1. Introduction
Arrow signs on roadway pavement are a crucial component of modern transportation systems that provide critical direction and guidance for drivers. The accurate identification and analysis of these signs is important for creating comprehensive road maps and decision support systems that can optimise traffic flow and enhance road safety. Traditional methods applied to identify arrow signs on the pavement involve manual inspection, which can be time-consuming and prone to errors. However, recent advances in computer vision and deep learning (DL) can enable the automation of the process of identifying arrow signs on roadway pavement using orthophotography (it is important to note that no public dataset or repository containing road arrow signs is available).
This paper aims to present a novel approach that provides accurate and efficient identification of arrow signs on roadway pavement, together with their angle orientation and direction using aerial orthophotography and DL algorithms. The method can automatically determine the travel direction of highways or road network lanes that flow in parallel and associate the predicted information within the scope of cartography production and updating to facilitate autonomous vehicle navigation. In this regard, the predicted information is associated with the geometries of the road axes alongside other types of details such as the number of lanes and speed limits.
Specifically, in the proposed method, convolutional neural network (CNN) architectures that were adapted for regression tasks were trained to automatically detect the orientation and direction of straight arrow signs on roadway pavement, using aerial high-resolution imagery. This approach enabled us to overcome the limitations of traditional manual inspection methods and provide a more efficient and accurate way of analysing these traffic signals. To do so, several popular CNNs (VGGNet [
1], ResNet-50 [
2], Xception [
3], and DenseNet [
4]) were adapted for regression tasks and trained with state-of-the-art techniques. This investigation was experimental and used a quantitative approach, where we raised a delimited and concrete study problem and processed data collected by applying standard processing techniques for training artificial neural networks. In the experimental design, four CNN models that have proven their effectiveness in image recognition were considered, together with an ad hoc model that was specifically designed for the task of arrow orientation recognition with the computational efficiency component in mind (being better suited for real-time applications). Afterwards, quantitative analyses and a comparison of the performance achieved in the experimental results were conducted to identify the most suitable model that can serve as a basis for a future improvement in the performance metrics or be introduced in a road extraction workflow.
The main contributions of this work are summarised as follows.
A deep learning-based methodology was developed that can accurately analyse straight arrow signs on road pavement using orthophotography and predict their orientation. The proposed approach was based on the adaptation of convolutional neural networks for regression tasks and was evaluated and implemented on popular deep learning image recognition models, where it achieved a maximum mean R2 score of 0.993 on the training set and a maximum R2 score of 0.896 on the test set.
A benchmark dataset (RoadArrowORIEN) was developed for predicting the orientation angle of road directional arrows, and the method applied to create it is described. The dataset can be used for training and evaluating the performance of future model implementations; it is hosted by the Zenodo repository [
5] and can be downloaded under a CC-BY 4.0 licence.
A new artificial neural network architecture was designed to improve the performance and efficiency in the task of predicting the orientation of arrow signs found on road pavement that was specifically constructed for faster prediction times. The model achieved a mean R2 score of 0.987 on the training set and a maximum R2 score of 0.862 on the test set.
The remainder of this article is organised as follows. In
Section 2, similar studies found in the relevant literature are discussed.
Section 3 presents the proposed deep learning method.
Section 4 describes the experimental design and the additional algorithmic implementations considered in this study. In
Section 5, the discussion of the obtained results can be found. Lastly,
Section 6 draws the conclusions of this study and mentions future lines of work.
2. Related Work
During the last decade, there have been significant advances in the DL field, mainly caused by the progress made in computer vision techniques—the introduced methods have impacted and affected most areas of science. In the research field related to the analysis of road pavement markings and signs, several studies have explored the use of machine learning algorithms for the identification of various road markings, such as stop lines, pedestrian crossings, and lane markings [
6,
7,
8]. These studies have shown promising results in terms of accurate detection and classification of these markings.
Orthophotography was used in several studies focused on the detection of lane markings on roads. For example, Soilan et al. [
9] use ortho-imagery to identify arrow signs that were manually segmented as ground truth for an application system using mobile laser scanning (MLS). Ansarnia et al. [
10] use orthophotography from vertically installed cameras for pedestrian and vehicle detection, and their approach involves the use of DL for different tasks including image classification (where the YOLO algorithm [
11] was used). Both papers discuss the potential for DL-based approaches to accurately detect the position of elements on the road transport network. In addition, Pritt et al. [
12] use satellite orthophotography and DL techniques for the identification of traffic objects, thus overcoming the existing limitations of traditional object detection and classification. Specifically, this approach made use of an ensemble of deep CNNs for object recognition in high-resolution, multispectral satellite images.
As Malik and Siddiqi [
13] also indicate (who propose a feature point detection and description algorithm with scale invariance and rotation invariance algorithm called BRISK), existing approaches for traffic signal extraction (in particular, vertical signals) apply more classical techniques, such as the scale-invariant feature transform (SIFT) algorithm [
14], to detect and describe local features in digital images, and the Speeded-Up Robust Features (SURF) [
15] computer vision algorithm, to obtain a visual representation of an image and extract detailed and content-specific information.
Li et al. [
16] detect traffic signals over real-time video with YOLO-V4-tiny and YOLO-MobileNet networks, while Zhou et al. [
17] use an improved version of VGG (IVGG) to detect traffic signals in Germany. Other works identified in the survey carried out by Sanyal et al. [
18] (where different databases are used to test the algorithms for traffic signs in real-time video) apply different classifiers such as support vector machine [
19], Gaussian, multilayer perceptrons, and convolutional neural networks that feature max pooling and fully connected layers.
In the field of object orientation detection, works that extend beyond the last decade can be found. Rybski et al. [
20] determine the global orientation of vehicle trajectories from images by training an ensemble of histogram of oriented gradient (HOG) classifiers and counting instances of gradient orientation in localised parts of an image. Asad and Slabaugh [
21] use random forest [
22] to detect angles in hand positions registered with images, while Sun et al. [
23] propose the BiFA-YOLO model as a bidirectional feature fusion and angular classification architecture based on YOLO to detect ship orientation on high-resolution synthetic aperture radar (SAR) images.
Shi et al. [
24] propose an object detection method for remote sensing images that is based on angle classification and uses rotation detection bounding boxes labelled with angle information. Specifically, they incorporate the neural architecture search framework with a feature pyramid network module (NAS-FPN) in a dense detector (RetinaNet) and use a binary encoding method in angle classification. Zhao et al. [
25] propose a modification of the YoloV5 framework to detect the orientation of the bounding boxes of objects and apply it in the field of electrical insulators on electricity transmission towers.
In a more recent study, Yang and Yan [
26] propose the transformation of the regression problem into a circular classification problem (CSL), for which they develop an object heading detection module that can be useful when exact heading orientation information is needed (e.g., for detecting the orientation of ships and aeroplanes). Also, Wang et al. [
27] evidence that using CSL does not work well because of the type of loss function used and propose the use of classification loss with adaptive Gaussian attenuation on the negative locations to solve the problem of negative angles and achieve better accuracies in angle estimation.
Finally, Zhao et al. [
28] propose a robust orientation detector (OrtDet) to solve the object angle problem, since convolutional neural networks do not explicitly model orientation variation. For this purpose, the authors use the token concatenation layer (TCL) strategy, which generates a pyramidal hierarchy of features to address different scales of objects and define the mean rotational precision (mRP) as a performance metric.
The mentioned studies demonstrate the potential for DL approaches in the analysis of road markings and road signs, but they tend to focus on the identification of individual elements in very favourable remote sensing scenes. Therefore, the closest identified studies (described in this section) generally use YOLO-based networks to identify the orientation of the enveloping rectangle of the objects (and allow the recovery of the object), but not the arrow direction. This also implies that these systems are not capable of differentiating the direction of arrows found in parallel highway lanes oriented in opposite directions.
It is important to note that no methodological proposal was found in the literature to identify the orientation of a traffic direction arrow in roadways and no studies that analyse the angle of arrow signs on road pavement were identified (although this source of information is important for the identification, construction, and updating maps of the road transport network and road intelligence systems). For these reasons, this study presents a novel approach for the analysis of directional arrow signs on road pavement using orthophotography and DL techniques.
3. Method Proposal
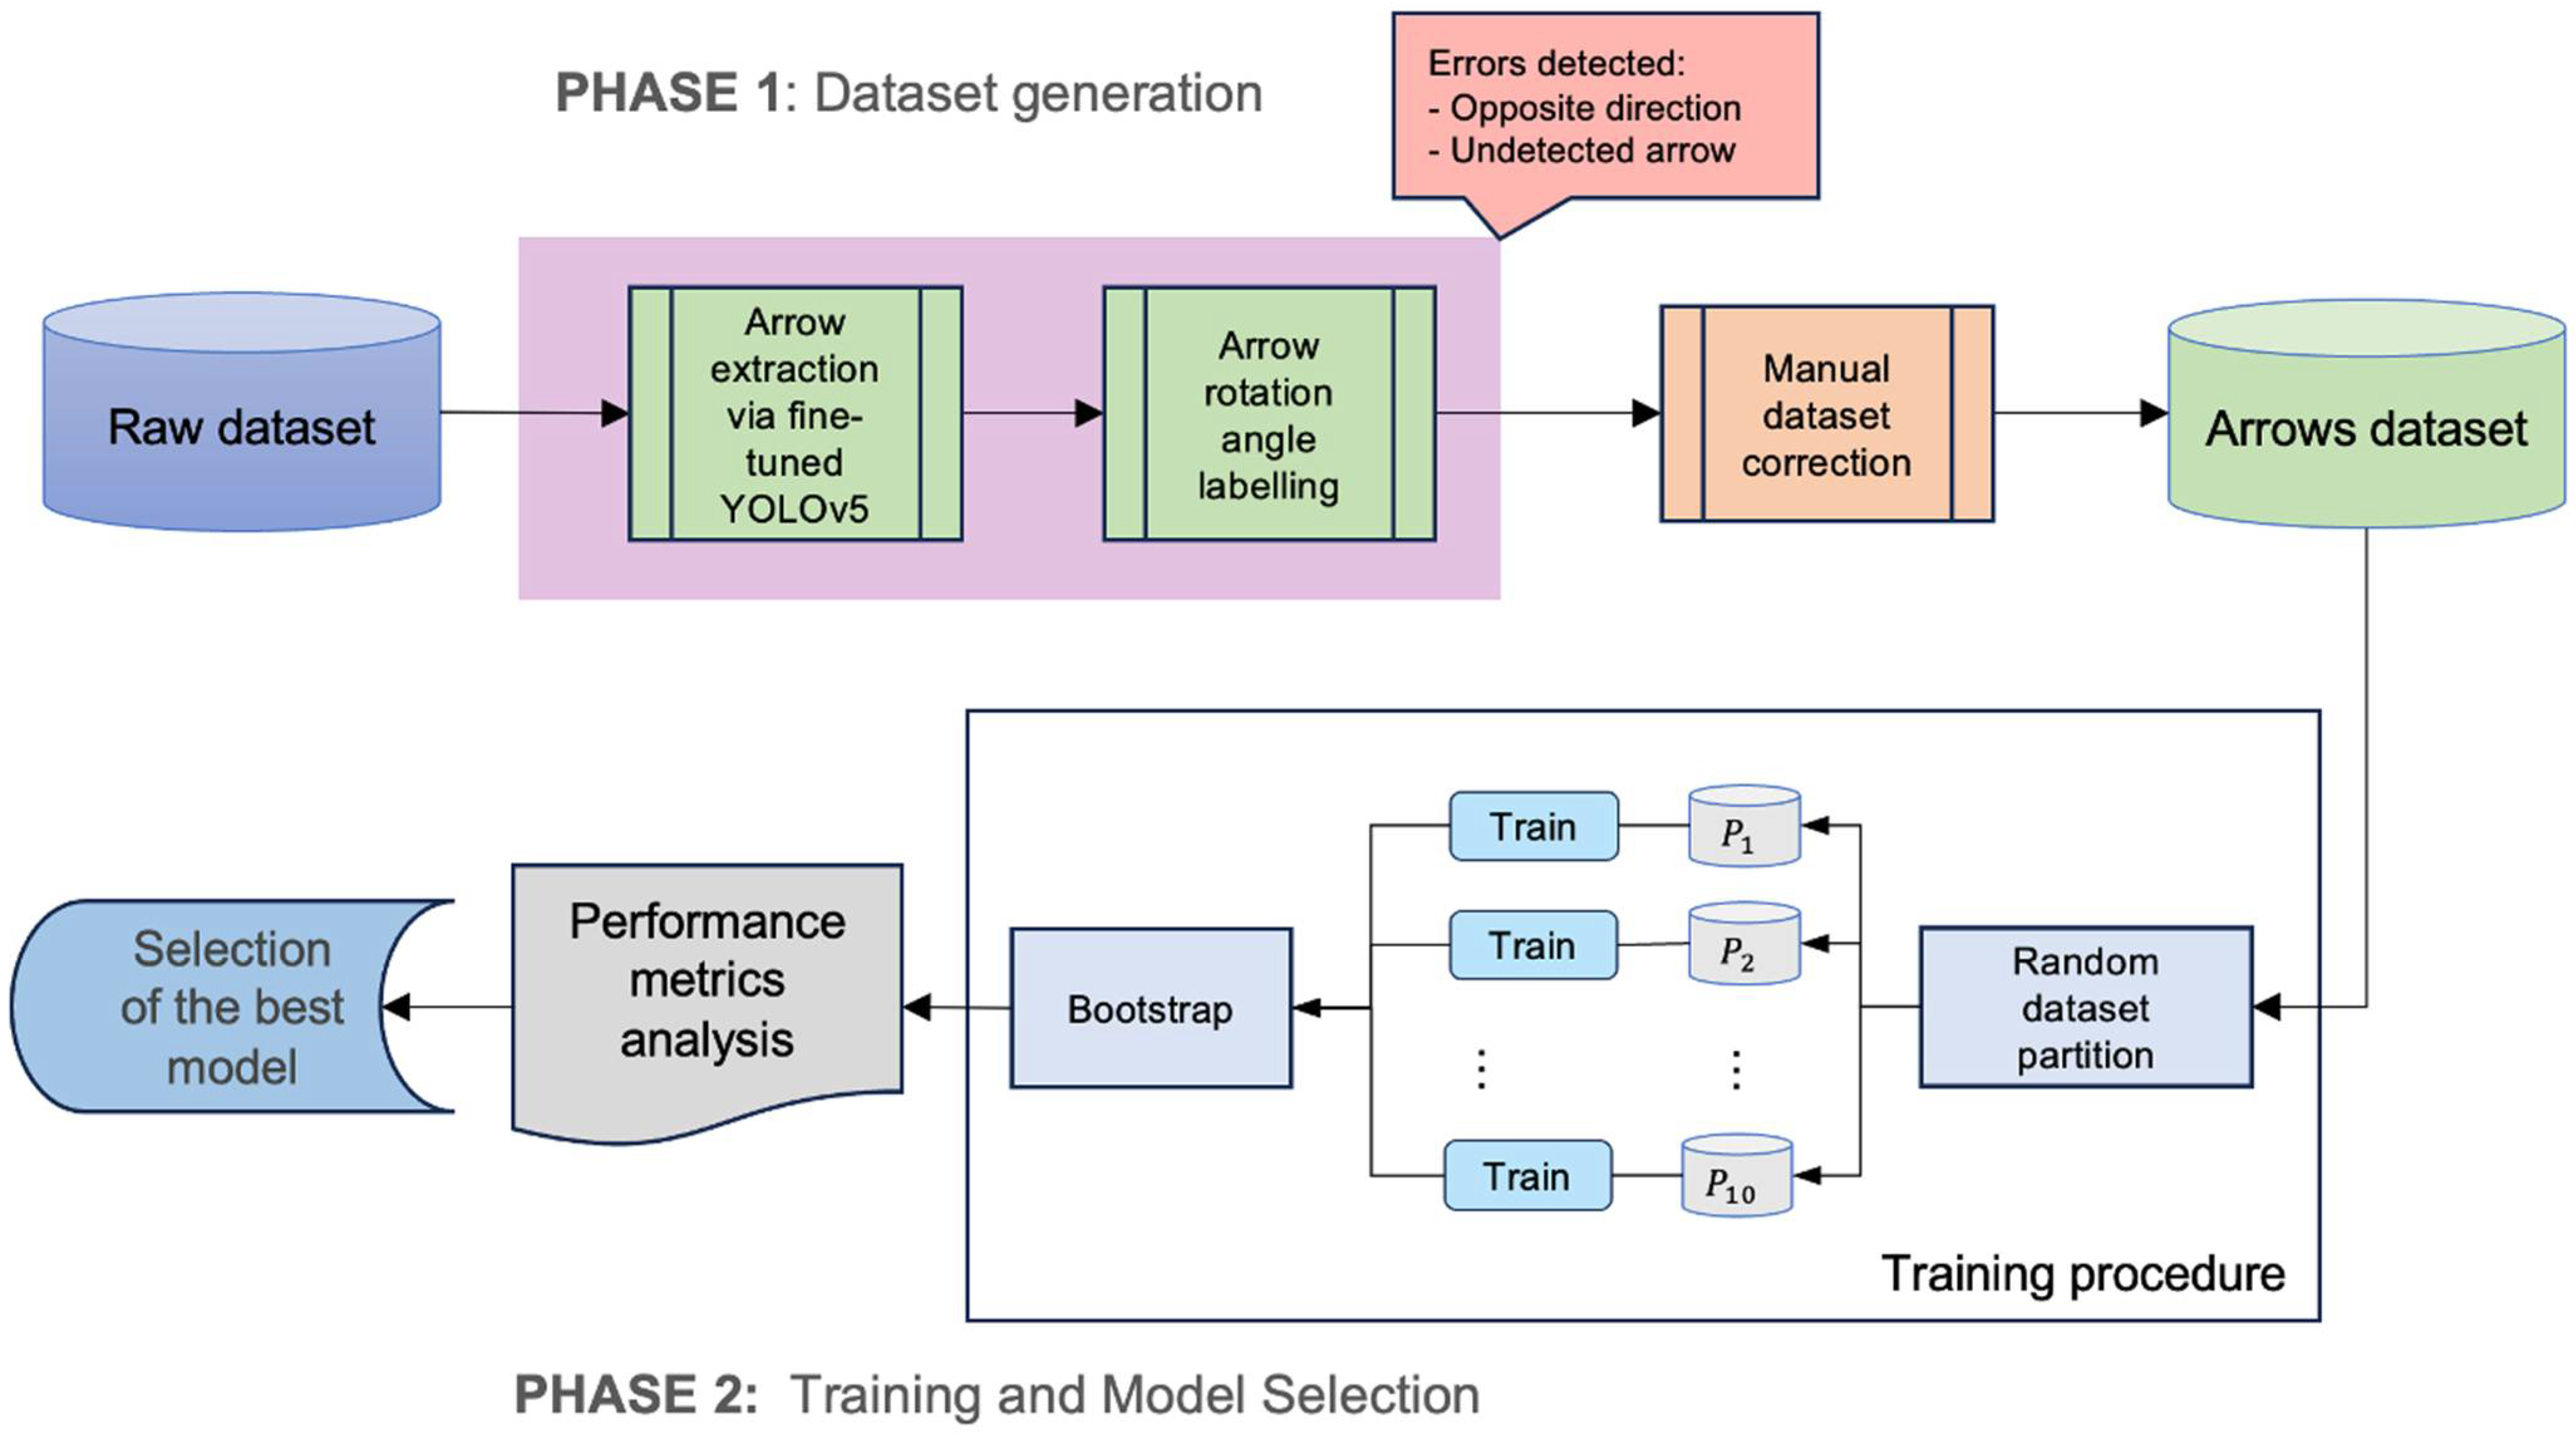
The process can be divided into two phases: the dataset generation step and the comparative study of methods for the model selection step.
The first part of the process is described in
Section 3.1 and
Section 4.1 and concerns the creation of a custom dataset for the considered task (the detection of arrow orientation in orthophotos). To obtain the data, a fine-tuned YOLOv5 algorithm (introduced by Redmon et al. [
11] and modified by Jocher et al. [
29]) is first used to detect and extract arrows from the original orthoimages. Afterwards, for each arrow, the rotation angle is identified with the process explained in
Section 3.1. However, it was observed that the arrow recognition and orientation processes may produce inaccuracies that can be categorised into two types: (1) arrows with correct angles but opposite directions (rotated by 180 degrees) and (2) arrows that are undetectable due to potential shortcoming of the YOLO process. For the first type of error, manual corrections are applied to adjust the rotation angle, while for the second type of error, the indetectable arrows are removed from the dataset.
The second part of the process begins with the proposal of a learning structure that enables convolutional neural networks to be used in regression tasks (where the goal is the prediction of continuous values instead of class probabilities—as described in
Section 3.2). Afterwards, the generated arrow signs dataset is used to train a range of popular CNN models that were modified with the proposed adaptation for regression tasks, along with an ad hoc model (described in
Section 3.2 and
Section 4.2). For training, a cross-validation approach is applied by creating ten random partitions of the dataset. Each combination of partition and model architecture is trained independently, and the performance metrics are calculated for each partition and recorded for further analysis (as described in
Section 3.3 and
Section 4.3).
To provide a robust assessment of model performance, a statistical analysis is performed using the bootstrap method. This enables the calculation of mean and confidence intervals for each metric, providing a comprehensive view of the model’s performance. Finally, a comparative study on the performance of the considered models is carried out to identify and select the most suitable one for the task. The process described above is presented in
Figure 1.
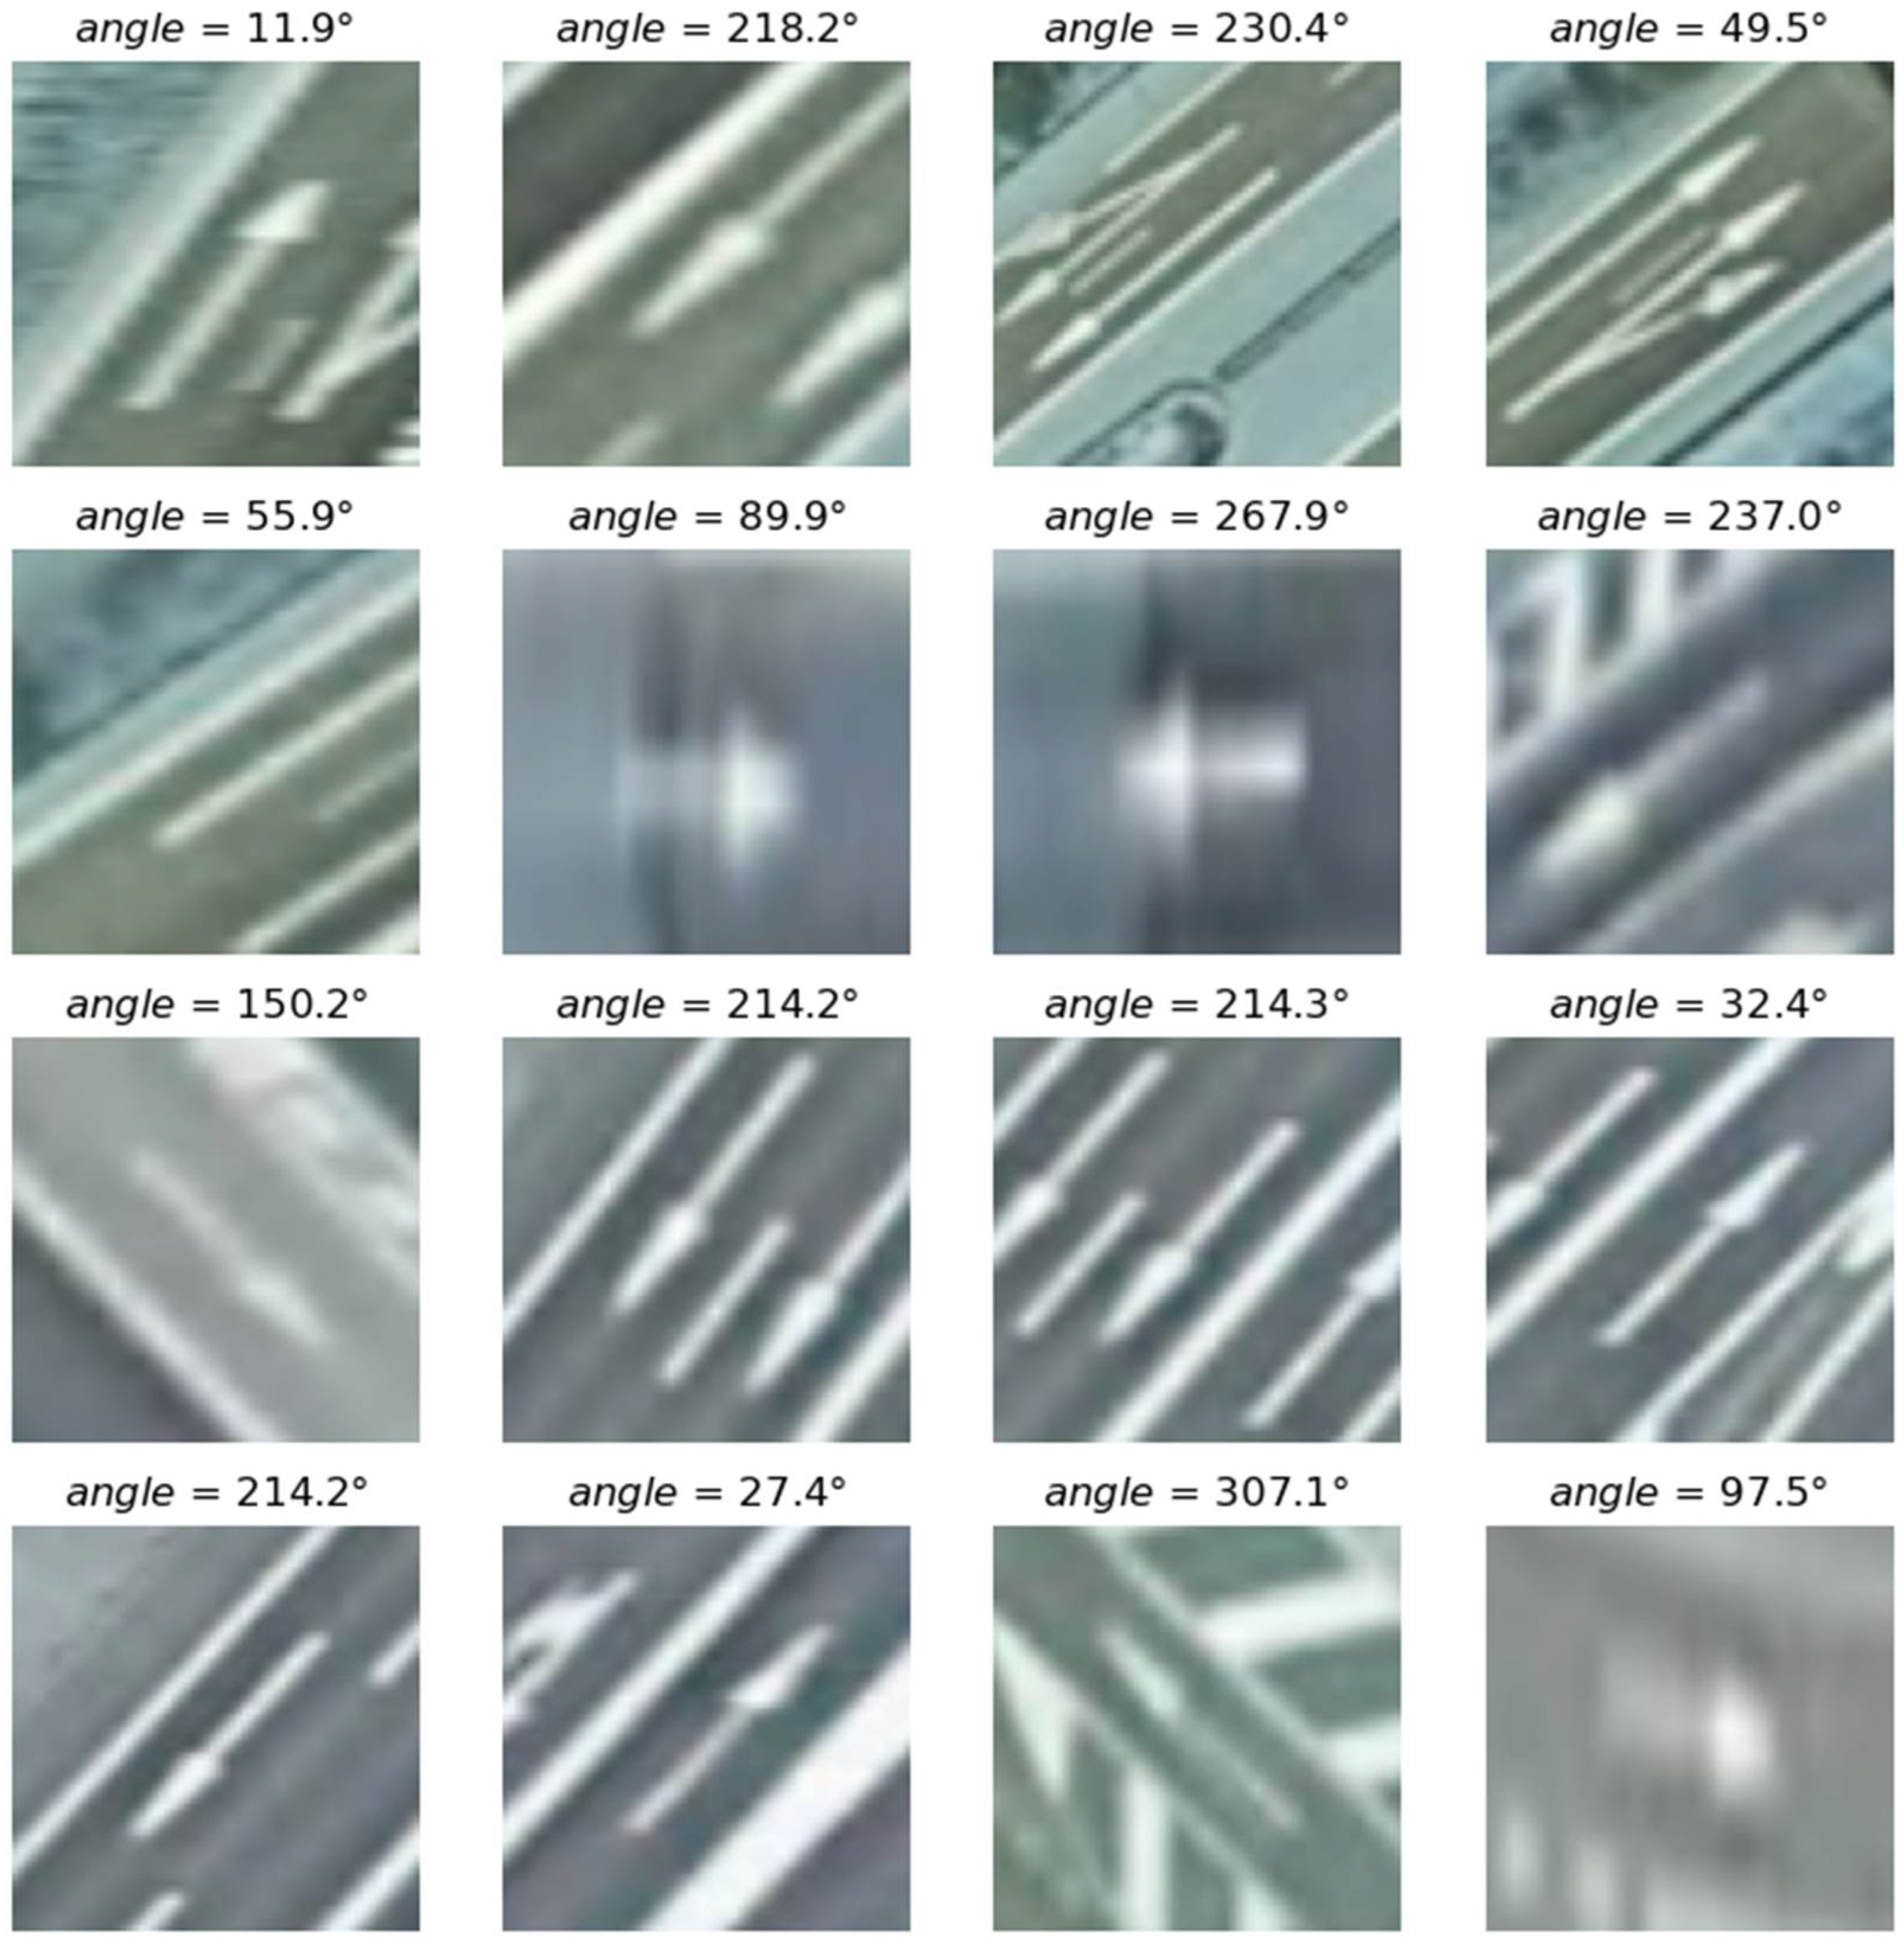
3.1. Data Generation Procedure: Traffic Lane Arrow Direction and Heading Detection
The procedure for inferring the angles is based on arrow data labelled at the pixel level and includes an algorithm created to obtain the coordinates of the vertices of the polygon and perform a clustering of the points into two groups based on proximity. During labelling, each arrow was represented as a polygon and features two points at the origin and five points in the part that marks the orientation.
In the first part of the procedure, these points were processed to perform a clustering operation based on the distance between points, in such a way that from these, two clusters,
and
, that contain two and five points, respectively, were generated. The result of applying the clustering was two classes of points, one with more points (the part of the arrow) and another with only two points (the centroids of the clusters). Afterwards, the centroid of both clusters was calculated using the K-means algorithm [
30], allowing for two labelled centroid points, where one was the origin of the vector while the other was the end. The orientation angle was calculated as the azimuth between
(the arrow origin) and
(the arrow end). The azimuth of the vector formed between the origin and the tip, i.e., the angle with respect to the Y-axis, was calculated and afterwards used to label the images. Finally, a sub-image centred on the arrow was extracted from the tile to work with images that only contain one arrow while maintaining the angle label.
The procedure applied for generating the dataset is presented in
Figure 2 and described as follows.
From the input consisting of RGB (red, green, blue) orthoimages, manually labelled with arrow sign information, create a JSON (JavaScript Object Notation) file containing the arrow polygon using the capabilities of software specialised in image tagging.
Extract the vertices of the generated arrow-shaped polygon.
Generate two clusters of nearby vertices, with a minimum cluster size of two vertices, so the origin cluster (, containing fewer vertices) and the arrow cluster (, containing five vertices) are identified.
For the two generated clusters, obtain their centroid ( and , respectively), preserving the information on the number of vertices that define the cluster.
Afterwards, generate the vector with origin in (of the cluster with fewer vertices) and with the end in the centroid (of the cluster with the higher number of vertices).
Next, calculate the azimuth of this vector with respect to the ordinate axis. For the output, automatically crop the orthoimage with a constant size (for example, 64 × 64 pixels) by taking an extension slightly larger than the area occupied by the arrow in the scene.
Figure 2.
Proposed procedure for generating the dataset containing arrow signs found on pavement and their corresponding orientation label.
Figure 2.
Proposed procedure for generating the dataset containing arrow signs found on pavement and their corresponding orientation label.
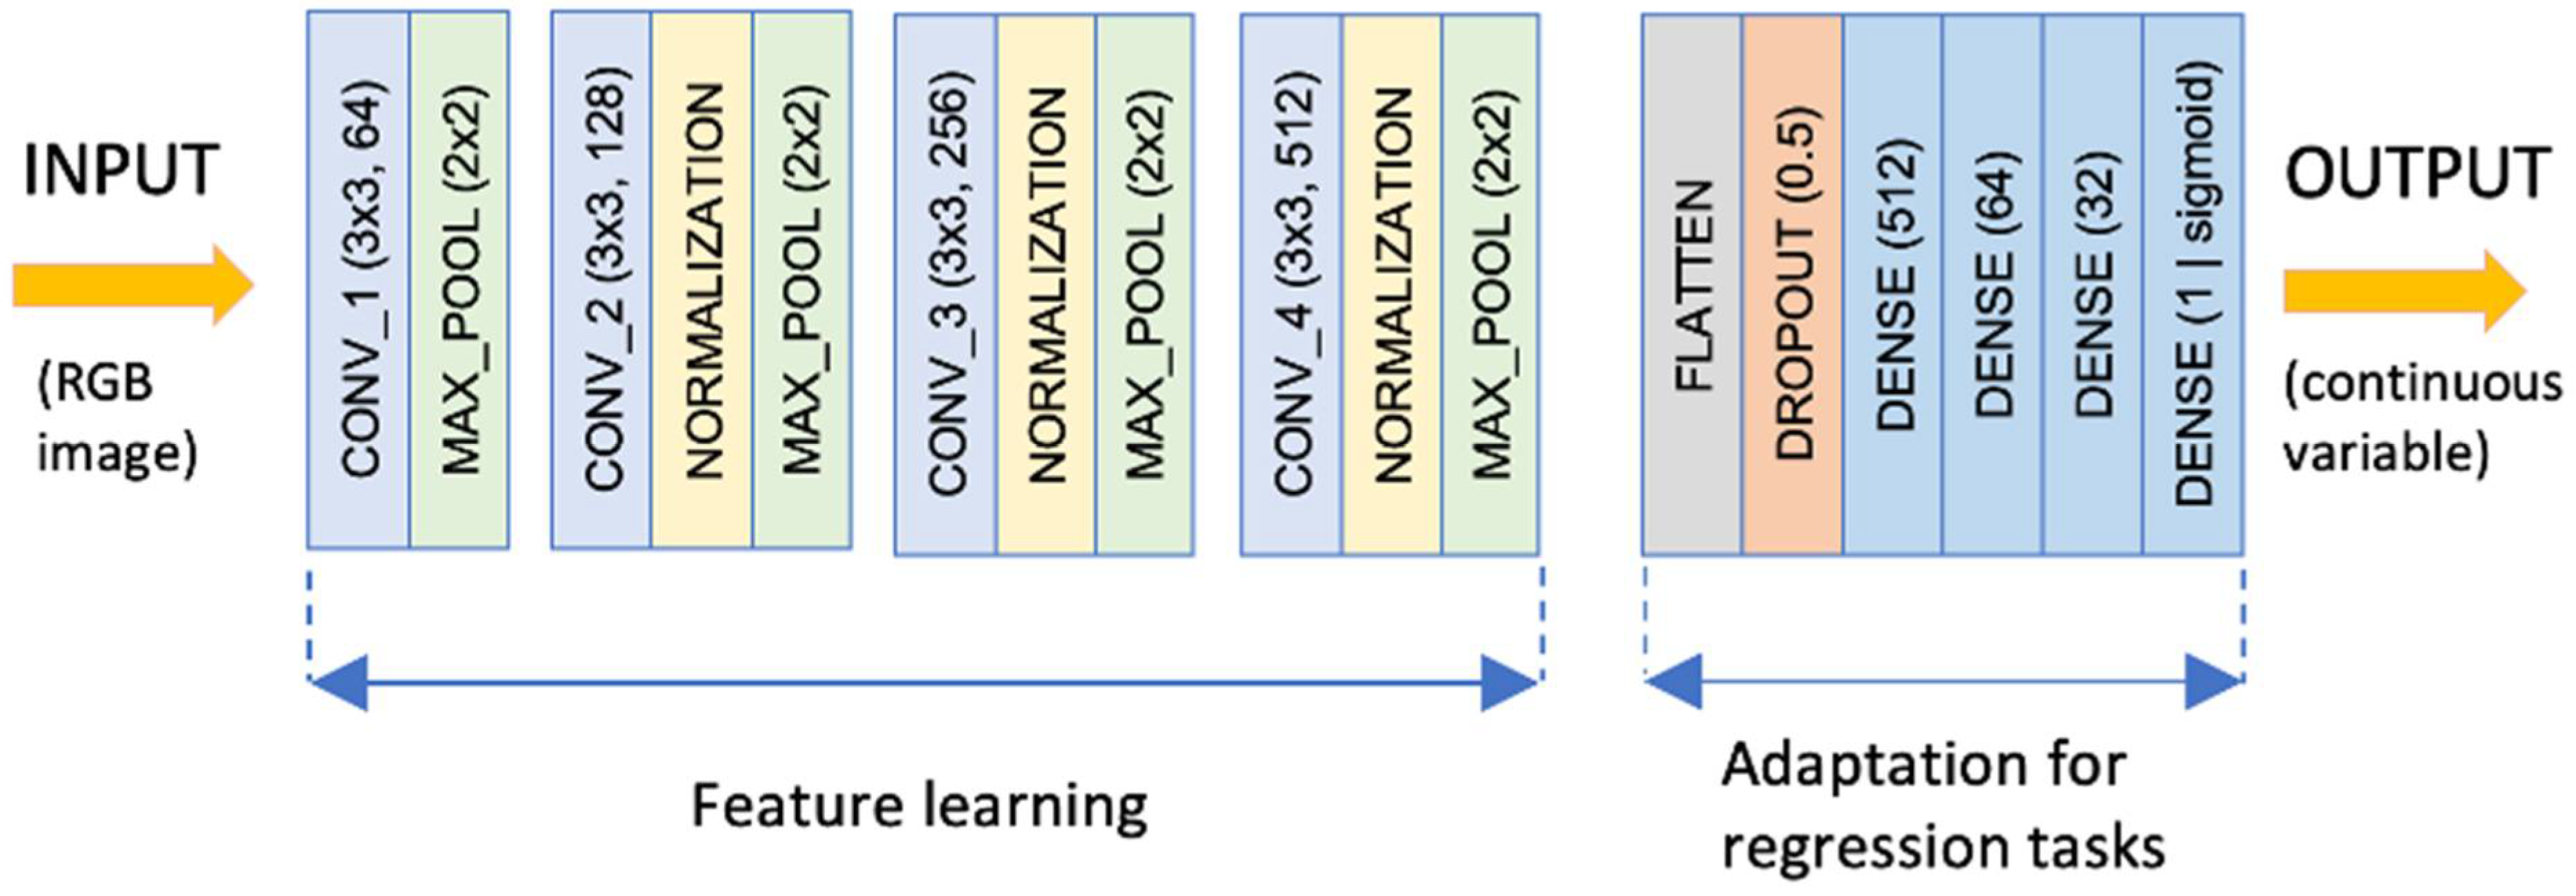
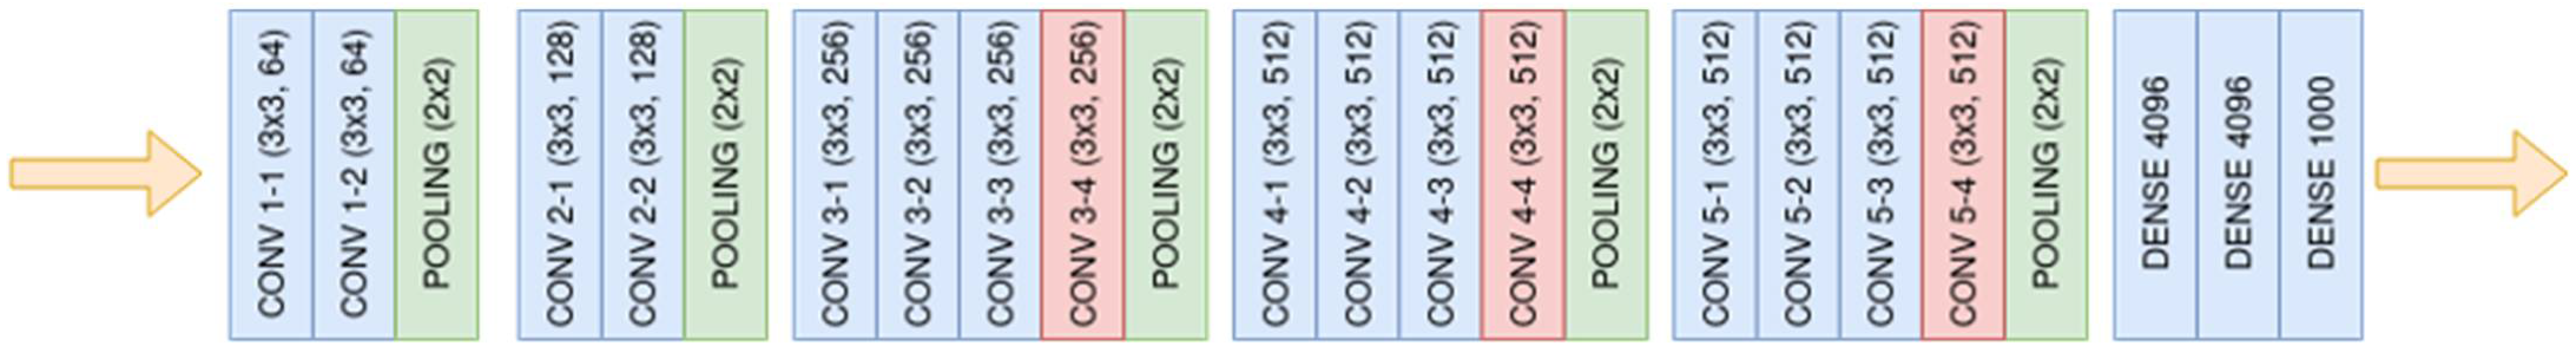
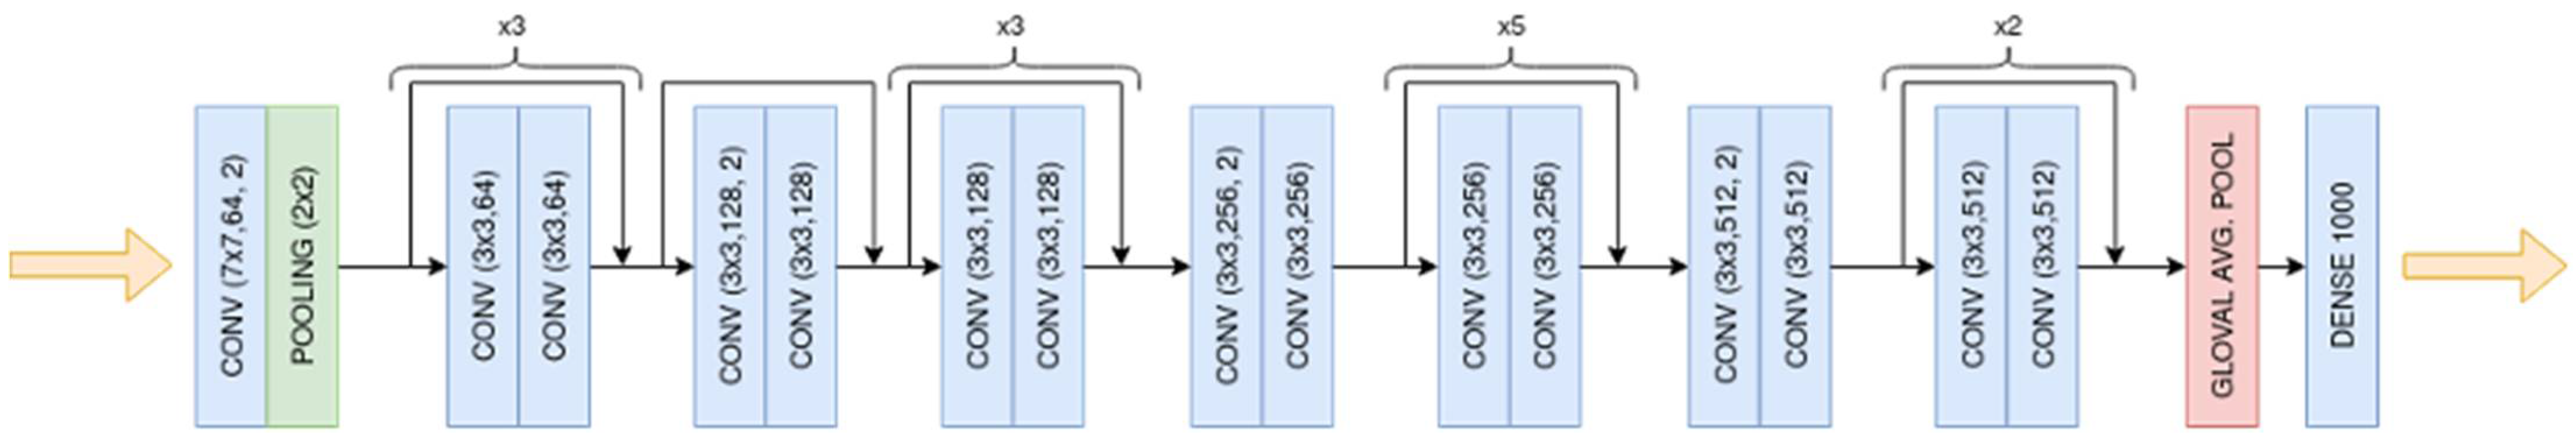
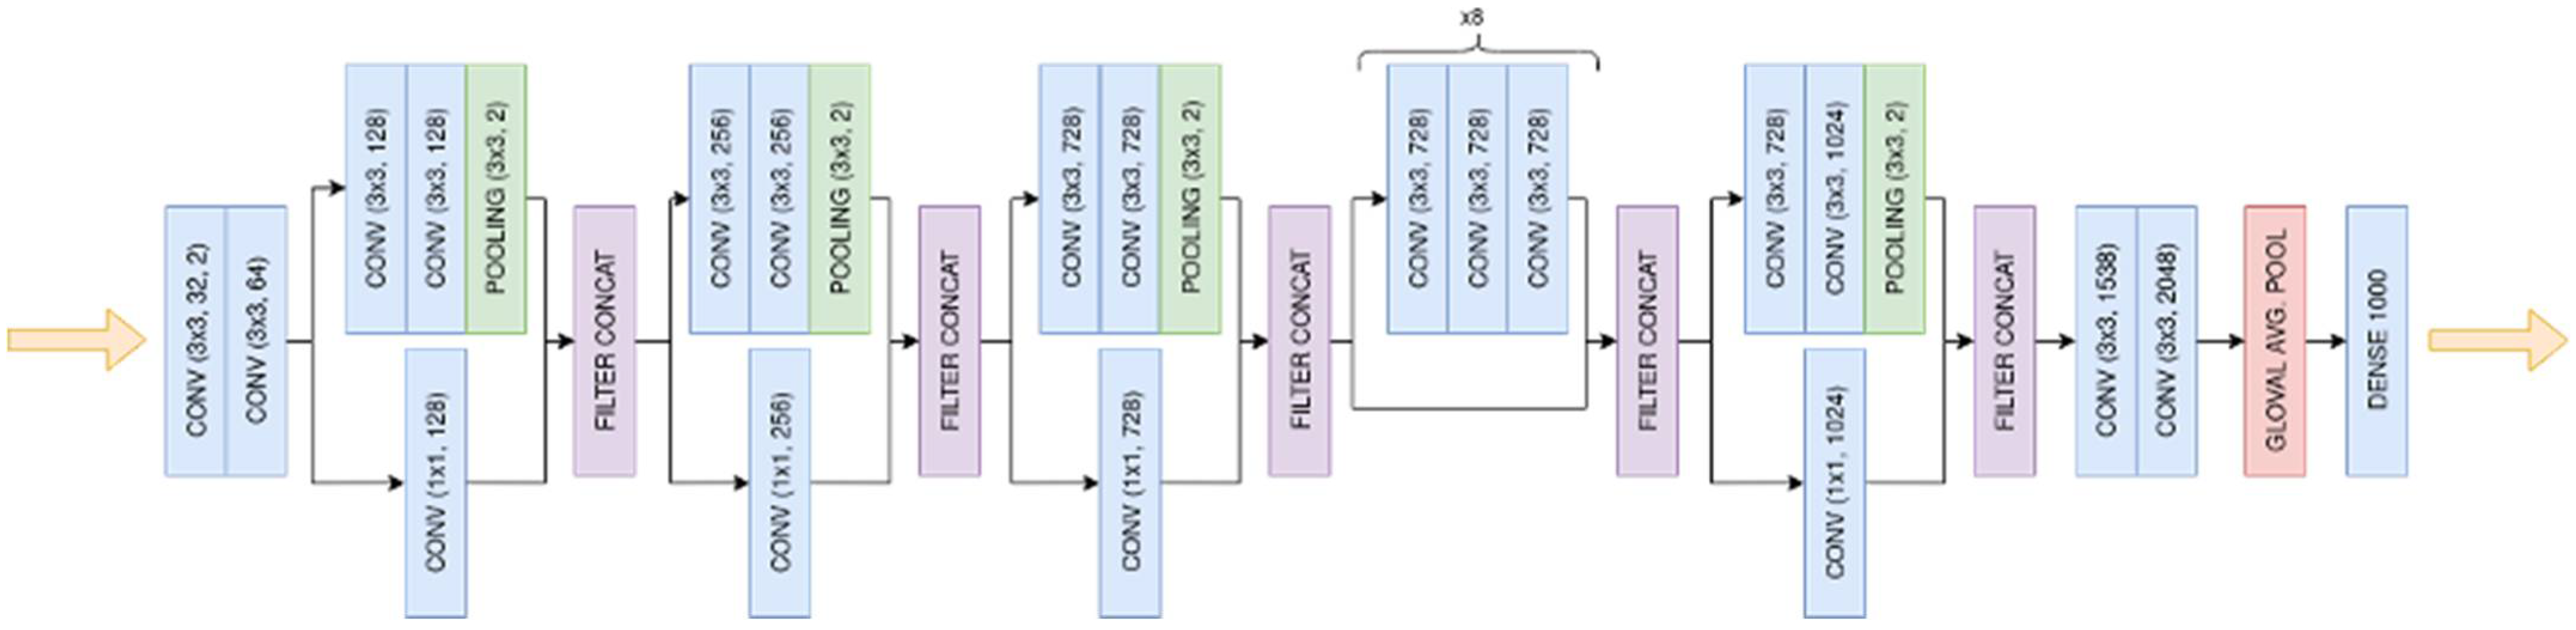
3.2. Proposed CNN Adaptation for Regression Tasks and Ad Hoc Model Architecture
As stated in the Introduction, and described in
Section 3, this work aims at implementing a deep learning-based approach to predict the orientation of straight arrows on marked road pavement.
At its core, a CNN is formed by a feature learning part (or convolutional base), where convolutional and pooling layers are used to learn and extract characteristics from the available data that enable correct predictions. Afterwards, the classifier part (generally formed by fully connected, or FC, layers) is found, where the filters containing the representations learned are used for class prediction. It is important to mention that the classifier part of convolutional neural networks features fully connected layers with thousands of units and is generally prepared for image recognition challenges on large datasets (for example, many of the popular CNNs were developed to participate in the ImageNet Large Scale Visual Recognition Challenge (ILSVRC) [
31], where the proposal of better learning structures was incentivised to better predict the 1000 classes featured in the ImageNet dataset that contains more than 1.2 million images).
The adaptation of CNNs for the regression task (presented in
Figure 3) involves removing the classifier part of a CNN architecture and replacing it with a flatten layer and four different dense layers with 512, 64, 32, and 1 unit, respectively. It is important to note that the final layer features a sigmoid activation function to make it suitable for regression problems. In addition, to strongly reduce the overfitting behaviour, the regression structure also features a dropout layer between the flatten and FC layers, with a rate of 0.5 (to randomly set 50% of the units to zero in each training iteration). This distribution of layers represents the inference block of the orientation angle and enables the CNN architectures, originally designed for image classification tasks, to be used in regression tasks (i.e., in this study, the target value is the angle in degrees relative to the azimuth). This architecture pivot enables the CNNs, initially architected for image classification, to be repurposed for regression problems.
Unlike expansive CNN architectures common in the literature, the ad hoc model champions simplicity without sacrificing performance. The design intent was two-fold: (a) efficiently predict arrow orientations and (b) ensure compatibility with real-time applications. The novel ad hoc architecture described in
Figure 3 is designed to balance the need for feature extraction with computational efficiency and is intended to be used in a real-time application.
The ad hoc model can be seen as a CNN-based architecture with a simpler disposition of layers when compared with popular models existent in the literature (as described in
Section 4.2). The architecture consists of four convolutional blocks featuring a kernel size of 3 × 3 with ReLU [
32] activation (chosen for its computational efficiency and adeptness at introducing non-linearity, which is used after each convolution) to process the 64 × 64 × 3 RGB image tensor. The four distinct blocks act as the backbone of this model and process the input image tensor, extracting intricate patterns essential for the regression task. Each convolutional block ends with a max pooling layer over a 2 × 2 window, ensuring a dimensionality reduction without information loss. Starting with the second convolutional block, the ad hoc model features normalisation layers to standardise the input values across the learned features within the same range to ensure more stable training and a maintain consistent data distribution across learnt features.
In the convolutional blocks, the ad hoc model applied the escalating filter count strategy, and the number of filters per convolution increases (from 64 to 128, 256, and 512) across blocks to ensure an optimal balance between basic and advanced feature extraction. The progression of these blocks—from basic to advanced feature extraction—is deliberate, mirroring the complexity of the features they are designed to capture.
Regarding efficiency and efficacy, the ad hoc architecture is fine-tuned for both feature extraction prowess and computational agility. A testament to its streamlined design, the model boasts a mere 2,673,729 parameters—a stark contrast to traditionally bulky CNNs, yet without a compromise in performance.
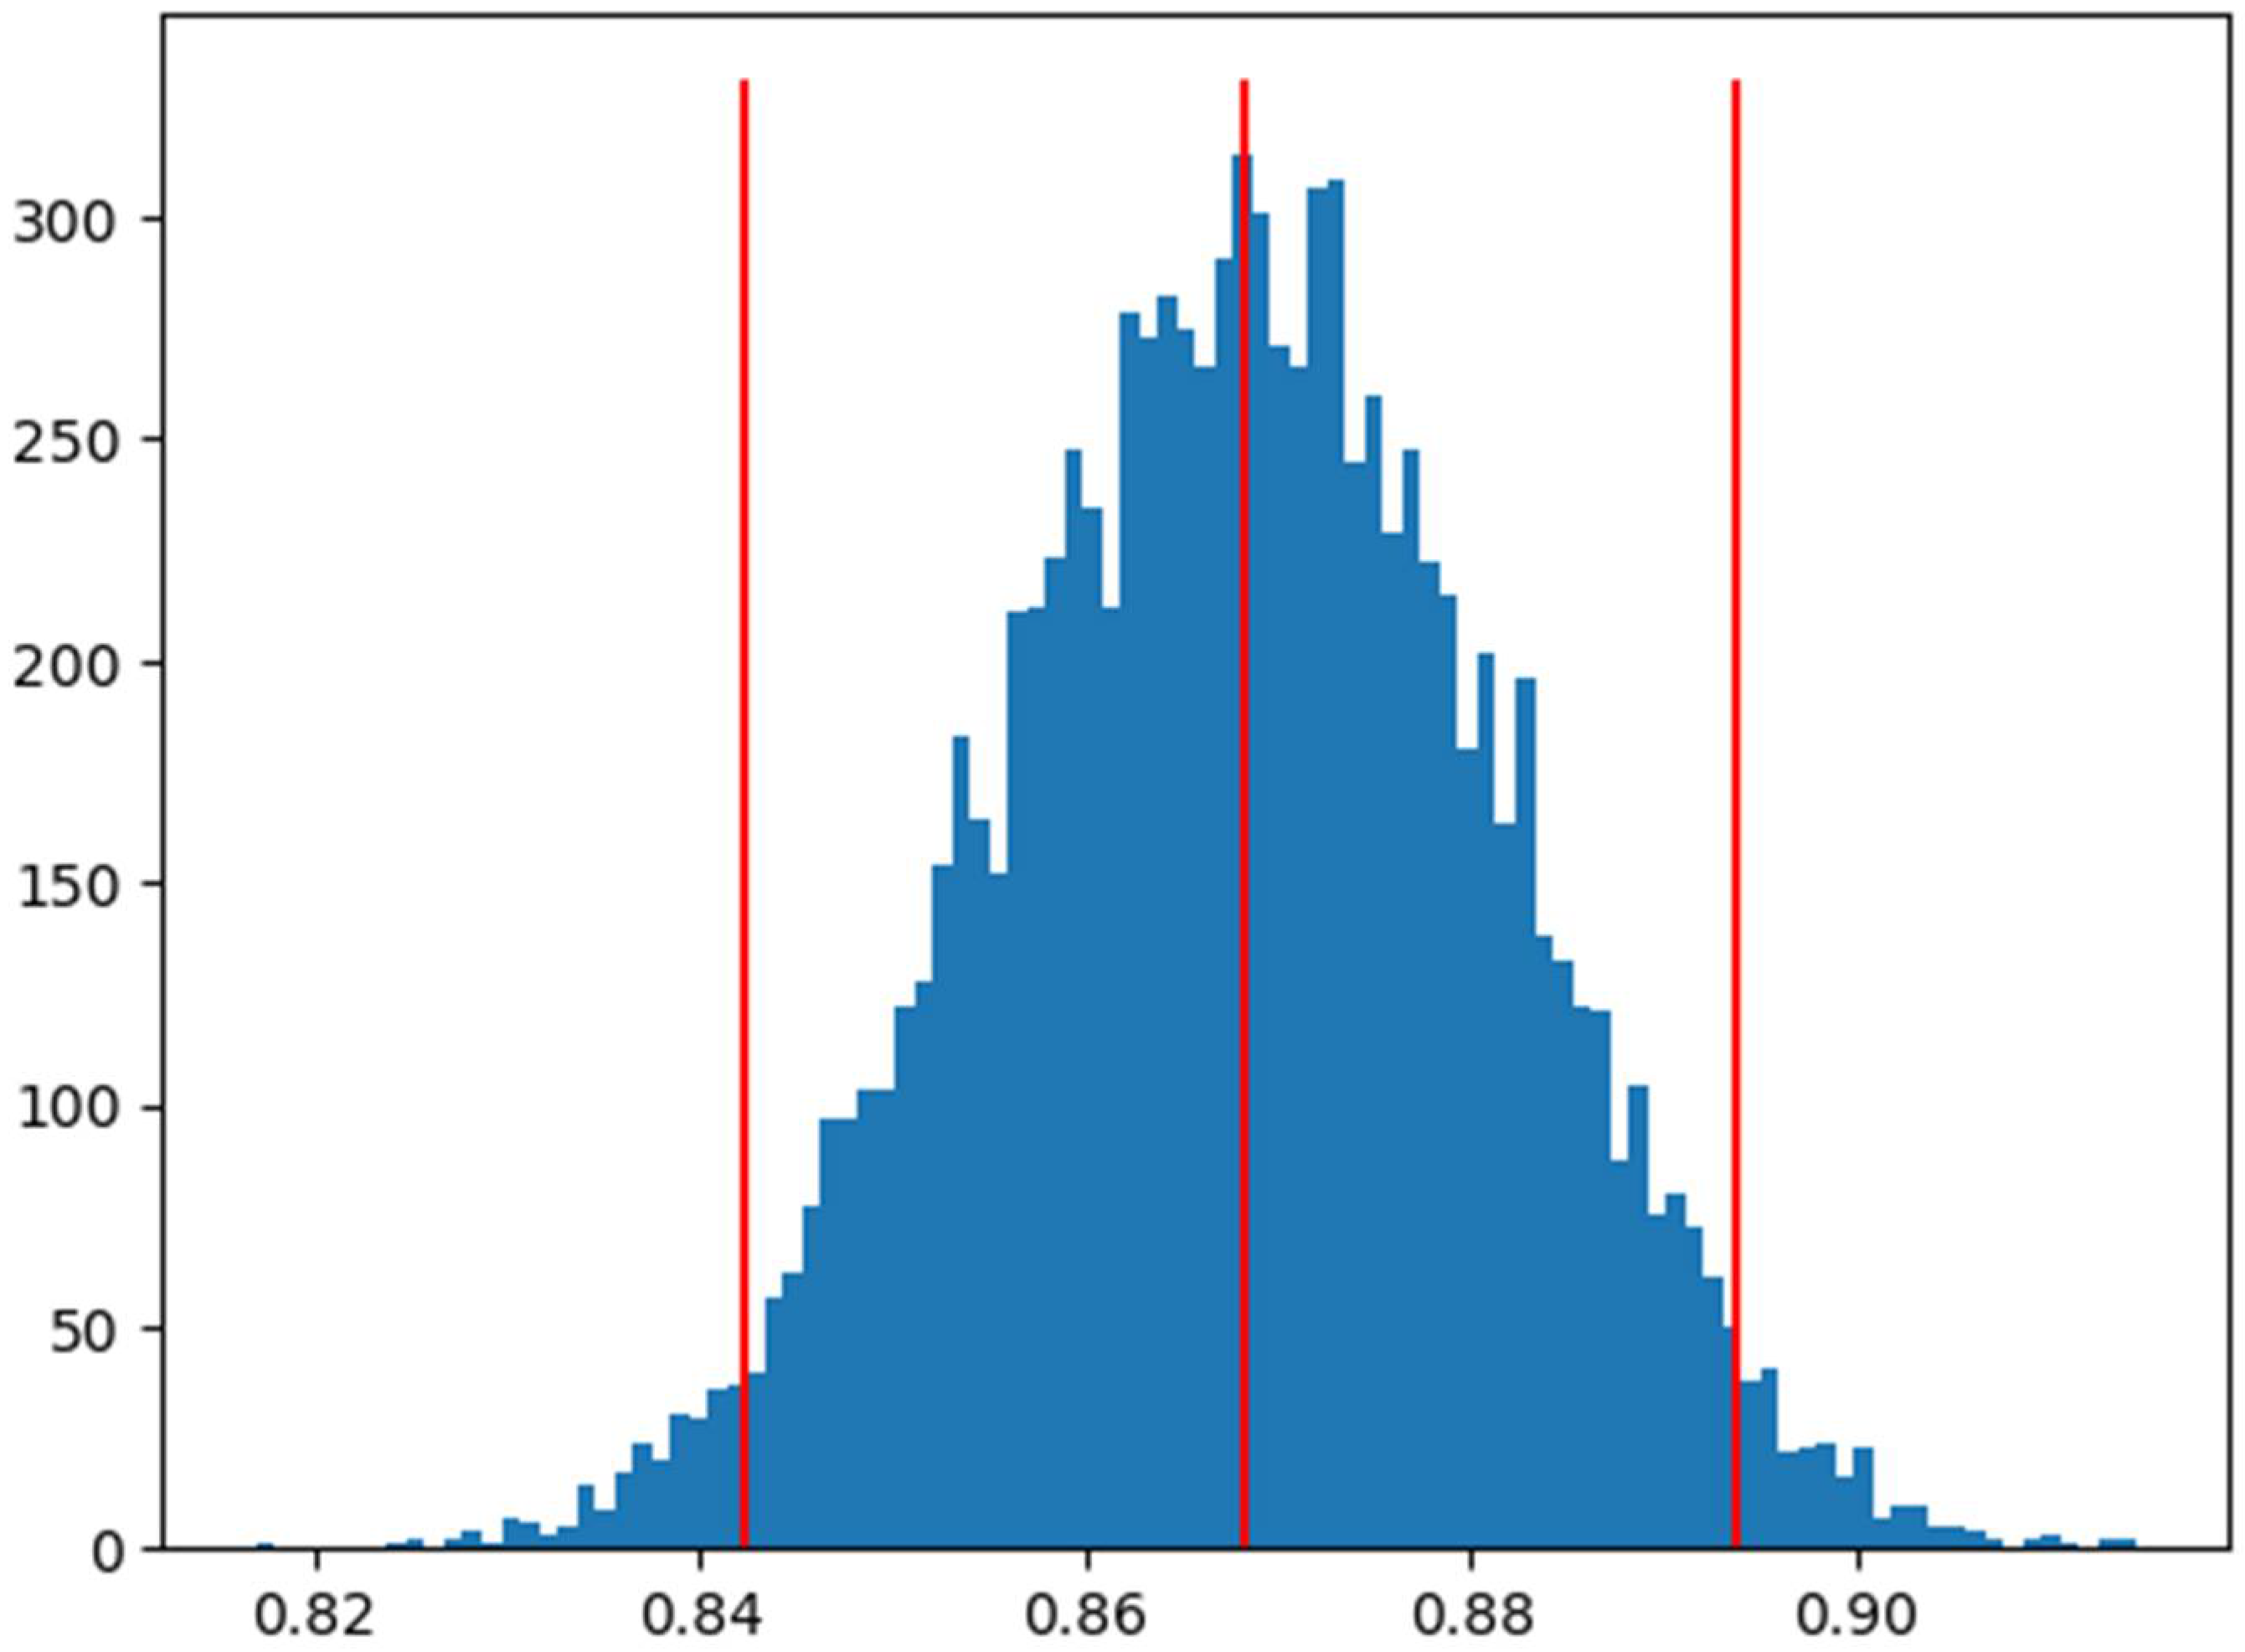
3.3. Considerations Regarding the Training Procedure
To reliably estimate the error achieved using each model, the training is repeated
times (in our case,
) with different random partitions in the train/ test data. This way,
estimates of the metrics (mean squared error, R
2, etc.) are obtained, and the bootstrap technique [
33] is applied afterwards to determine a confidence interval for each metric, without having to assume a normal distribution.
Once the
estimates for the metric of interest are obtained, the statistical estimator (e.g., the mean) is calculated at a 95% confidence interval. Here, the bootstrap procedure is applied, which roughly resamples the results obtained
times (in our case,
) and calculates the estimator for each resampling. By sorting and eliminating the 2.5% of the values (in our case, 250) at each tail of the sorted list, the confidence interval for the estimator is obtained.
Figure 4 shows the distribution of bootstrapped R
2 values for one of the trained models (a modified VGG19 network).
Another important training aspect is that, although the data augmentation technique was proven to increase the generalisation capability of the models when the size of the training set is reduced (features less than 10,000 samples), it is fundamental not to apply data augmentation in the form of random height or width shifts, vertical and horizontal shifts, or random rotations to the image tensor in similar studies. Nonetheless, data augmentation parameters such as changes in brightness and contrast or shifts in gamma and channel intensities could help in exposing the model to more aspects of the data (if small parameter values are selected). In addition, the use of transfer learning for the convolutional base of the considered CNN networks is recommended to take advantage of their learned feature extraction capabilities.
5. Results and Discussion
To evaluate the effectiveness of the five trained models, a comprehensive set of evaluation metrics was utilised, including the loss value, the R
2 score (defined in Equation (2), where
represents the sum of squares, with
tending to a minimum,
represents the predicted
, and
is the average of the values, and
is the sample size), and the mean angular error (defined as the sum of the angle errors divided by the total number of samples).
Moreover, the consistency of the models in predicting the target variable was analysed by investigating the standard deviation in the test R
2 score of each model (defined in Equation (3), where
represents any R
2 score value,
is the mean R
2 score value, and
is the total number of training sessions). The performance results obtained are presented in
Table 1.
The results show that the VGG16 and VGG19 variants of VGGNet achieved the best performance, with mean angular errors of 1.34 and 2.16, on the training set, respectively, and R2 scores of 0.87 and 0.83, on the test set, respectively. ResNet-50 and Xception performed slightly worse, with mean angular errors of 3.23 and 3.01, respectively, and lower validation R2 scores of 0.80 and 0.79, respectively. Meanwhile, DenseNet-121 exhibited a relatively higher mean angular error of 10.18, with a test R2 score of 0.79, and a standard deviation of the test R2 score of 0.05.
The proposed ad hoc model displayed a high generalisation capability in predicting the target variable, achieving a mean angular error of 2.52 degrees on the training set and a test R2 score of 0.84. These values are remarkable when considering the model’s increased computational efficiency (the ad hoc model processed and predicted the available information from 4.3 times to 6.2 times faster when compared with the other NN candidates). This indicates its appropriateness for use in similar regression tasks. In addition, the ad hoc model was the one with the most consistent performance, as its standard deviation of the test R2 scores reached a minimum of 0.03. Nonetheless, the standard deviations of the test R2 scores were relatively low across all models, reaching a value of 0.05 for DenseNet-121 and a maximum of 0.07 in the case of ResNet-50.
As for the proposed ad hoc model, its training process was up to 6.2 times faster when compared with its well-established counterparts, which indicates an advantage in applications where the real-time detection of arrow orientation is pursued. One possible explanation is that it features fewer layers and parameters when compared with well-established architectures. Moreover, during inference, it consistently performed between 1.2 and 5.7 times more rapidly. This advantage can be significant in real-world applications where real-time detection of arrow orientation is necessary. Such scenarios might include high-speed autonomous vehicles or robotics applications where rapid decision-making is crucial. One possible reason for this speed advantage is that the ad hoc model has fewer layers and parameters than the more established architectures, mitigating the risk of overfitting, which is a common issue in deep learning models with large parameter spaces. This model, therefore, offers a promising solution for applications where speed and efficiency are key factors. However, it is important to mention that the ad hoc model had to learn the studied phenomenon from scratch, which may have influenced its capacity to learn and generalise patterns in the data.
It is also important to note that the loss metric used in our models does not consider the potential error in arrows that are near 0 degrees, causing the error measurement between 0 and 359 degrees to be much larger than it is. However, given the ability of the models to tolerate noise, this is not a significant concern. Nonetheless, future work could explore alternative loss functions that account for this phenomenon to further improve accuracy. To gain a better understanding of the values presented in
Table 1 and provide a clear visual representation of how the models compare to each other, the performance of the trained models is also presented in
Figure 10 in terms of the R
2 score, MSE, and angular error.
According to these results, the first highlighted aspect is that Xception and ResNet-50, despite generally having a higher feature extraction capability, display a relatively worse predictive performance for this regression task. Interestingly, the results also suggest that more powerful architectures, such as Xception and ResNet-50, although pre-trained on ImageNet, may not always generalise well to other computer vision tasks. Despite their significant performance on ImageNet, VGG16 and VGG19 outperformed both Xception and ResNet50 on our task, as measured using the R2 score and angular error. This suggests that the features learned using these architectures may not be as relevant to our task as in the case of ImageNet. Thus, while pre-trained models featuring many parameters can be a useful starting point for many computer vision tasks, they may not always be the best choice, and other architectures should be considered depending on the specifics of the problem. Surprisingly, the VGG16 and VGG19 models, despite their slower processing times compared with our ad hoc model, outperformed Xception, ResNet-50, and DenseNet-121 on the approached task. This superior performance could be critically advantageous in applications where the slightest angular error in arrow orientation prediction could lead to significant consequences, such as misrouting in navigation systems.
As for overfitting concerns, the appropriate use of regularisation techniques (specifically, the dropout technique) prevents the model from memorising noise in the training data. In addition, as explained in
Section 3.2 and
Section 4.3, for higher control of overfitting behaviour, data augmentation (changes in brightness and contrast or shifts in gamma and channel intensities) was applied together with the bootstrapping technique for training (so that the division of the dataset and the training / validation were repeated ten times). The results obtained using the train and test sets display R
2 scores that approach 0.9, and the boxplots for the performance metrics do not display strong indicators of overfitting behaviour.
Despite the high feature extraction capability of models such as Xception, ResNet-50, and DenseNet-121, the model did not perform well in the approach regression task. The real-world implications of these displayed performances are important, especially in critical applications such as autonomous vehicles or robotics, where even small errors in determining the direction of an arrow could result in significant deviation. It can be highlighted that, although VGG16 and VGG19 are slower, they are more accurate than other models, indicating their potential usefulness in scenarios where the highest accuracy is needed (such as in navigation systems). Explicitly put, the inference speed of the ad hoc model may be important in real-world applications, where real-time detection of arrow orientation is necessary (for example, in high-speed autonomous vehicles, or robotics applications, where fast decision-making is crucial), making the ad hoc model more suitable in cases that demand real-time detection and quick decision-making.
In relation to the uncertainties in the models, the quantitative results listed in
Table 1 (especially the standard deviation) and the graphical representation of the performance in the form of boxplots showcasing the distribution of MSE, R
2, and angular error metrics (in
Figure 10) report a robust overview of the variability and reliability in the predictions of the models.
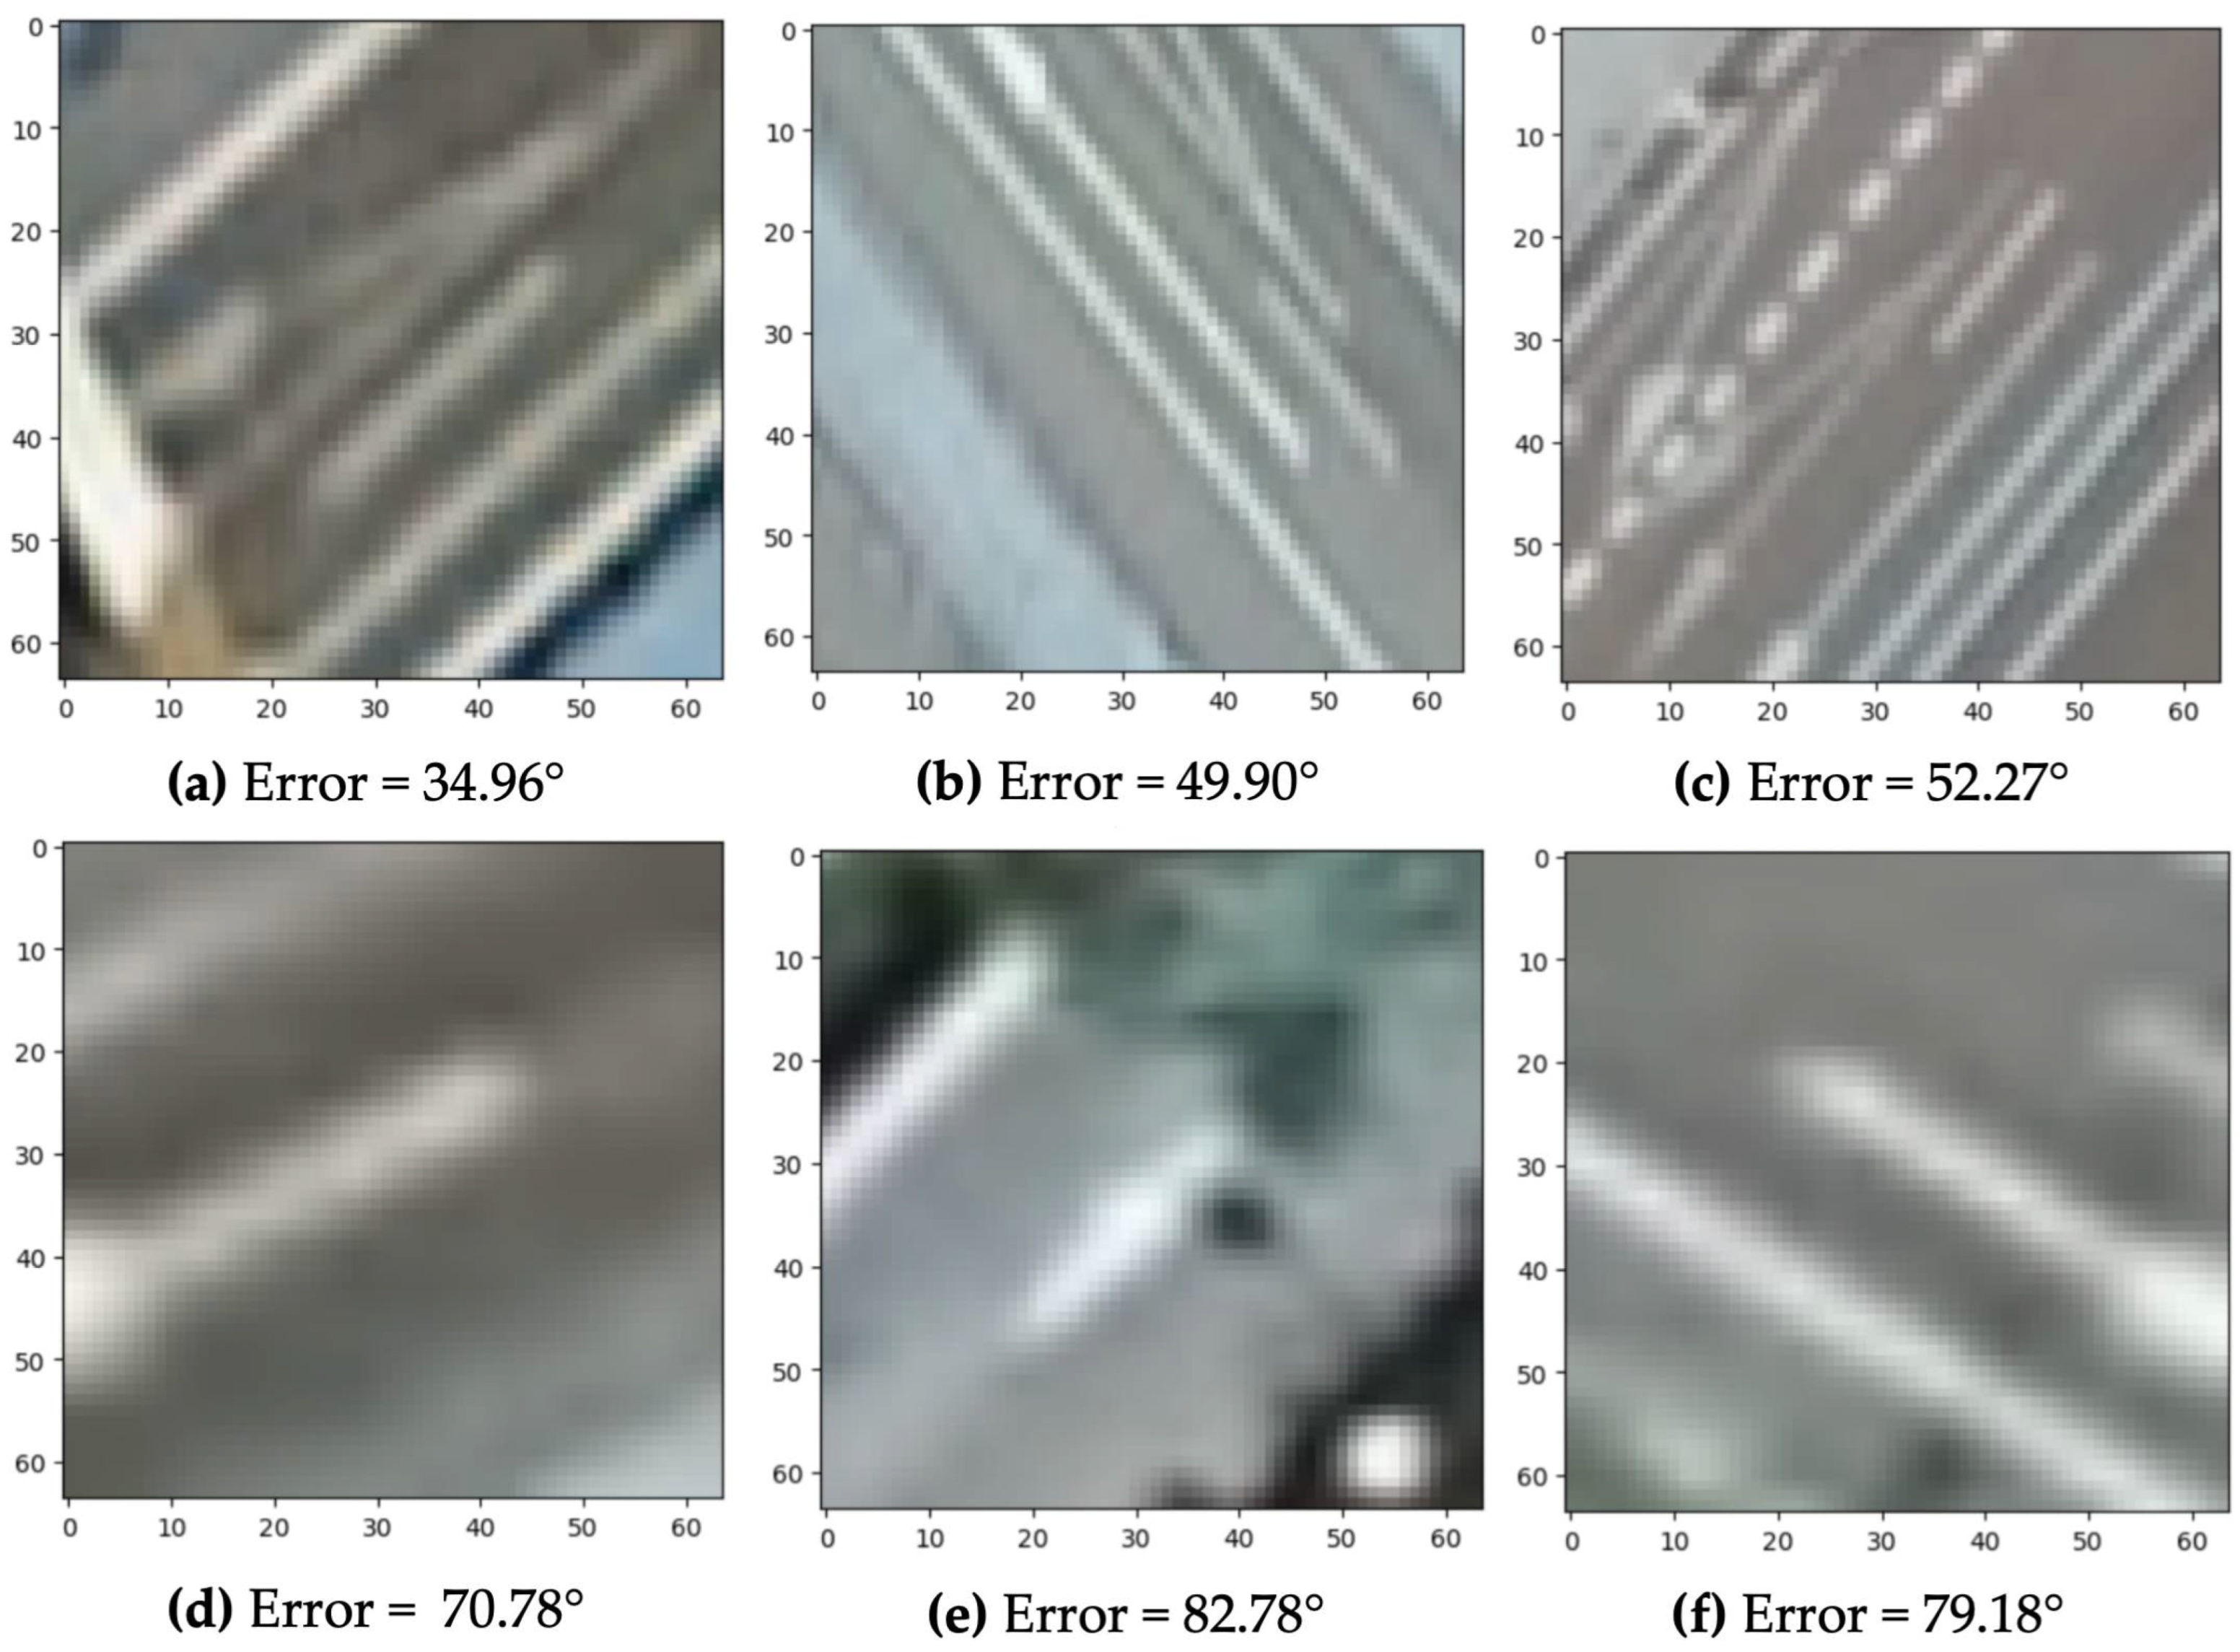
Regarding the interpretability of the models, the challenges associated with deep learning models are understood. While this work did not use specific techniques for feature interpretation, the ad hoc model architecture was designed with simplicity in mind, favouring transparency over complexity. However, six random test scenarios where the predictions feature high angular errors (more than 30 degrees) are reported in
Figure 11. Higher error rates were generally observed in complex scenes, where several linear elements (such as lane separation lines, as illustrated in
Figure 11a–c) with similar characteristics are present. Another important source of error is represented by the complex nature of the tackled task, as the studied arrow elements feature reduced dimensions and the corresponding samples display blurry, unclear arrows, even when using the highest available orthoimages with a spatial resolution of 50 cm (as found in
Figure 11d,f). Furthermore, obstructions present in the scenes (such as scenes) also seem to have an important impact on the quality of the predictions; considerably higher error rates are encountered in such scenarios (as displayed in
Figure 11e).
Regarding the robustness of the model in various additional scenarios, the data used in this study are based on high-resolution orthoimages that were captured by a public agency under optimal lighting conditions. Consequently, the training data aligns with these favourable lighting conditions, but it is expected that the trained models display improved robustness, due to the data augmentation techniques applied to expose the model to a range of lighting scenarios commonly encountered in real-world settings (that include variations in brightness and contrast).
Overall, the decision over the use of a certain model should be dictated by the specific application, the level of accuracy required, and the degree of computational efficiency needed. Future studies should aim to improve the trade-off between these factors for more robust and versatile computer vision tasks. For example, in a real-world setting, such as an autonomous vehicle or robotics application, where determining the direction of an arrow is crucial, the increased error rate in these models could result in a significant misdirection. In particular, DenseNet-121 showed a significantly higher mean angular error of 10.1833, along with a test R2 score of 0.7946, reflecting its poorer performance compared with the other models. This suggests that the features learned using these architectures may not be as suitable for tasks like ours as they are for ImageNet, leading to the potential overfitting to ImageNet. Thus, while these pre-trained models can provide a strong foundation for many computer vision tasks, their application should be carefully considered based on the specifics of the problem at hand.

 ,
, 


