Recent Advancements in Non-Destructive Testing Techniques for Structural Health Monitoring
by
 , , , , and
Patryk Kot
1,* ,
,
Magomed Muradov
1,
Michaela Gkantou
1,
George S. Kamaris
1,
Khalid Hashim
1,2 and
David Yeboah
1 1
Built Environment and Sustainable Technologies (BEST) Research Institute, Liverpool John Moores University, Liverpool L3 3AF, UK
2
Engineering Faculty, University of Babylon, Hilla 51001, Iraq
*
Author to whom correspondence should be addressed.
Appl. Sci. 2021, 11(6), 2750; https://doi.org/10.3390/app11062750
Submission received: 3 December 2020
/
Revised: 1 March 2021
/
Accepted: 10 March 2021
/
Published: 18 March 2021
(This article belongs to the Special Issue Nondestructive Testing (NDT): Volume II)
Abstract
:Structural health monitoring (SHM) is an important aspect of the assessment of various structures and infrastructure, which involves inspection, monitoring, and maintenance to support economics, quality of life and sustainability in civil engineering. Currently, research has been conducted in order to develop non-destructive techniques for SHM to extend the lifespan of monitored structures. This paper will review and summarize the recent advancements in non-destructive testing techniques, namely, sweep frequency approach, ground penetrating radar, infrared technique, fiber optics sensors, camera-based methods, laser scanner techniques, acoustic emission and ultrasonic techniques. Although some of the techniques are widely and successfully utilized in civil engineering, there are still challenges that researchers are addressing. One of the common challenges within the techniques is interpretation, analysis and automation of obtained data, which requires highly skilled and specialized experts. Therefore, researchers are investigating and applying artificial intelligence, namely machine learning algorithms to address the challenges. In addition, researchers have combined multiple techniques in order to improve accuracy and acquire additional parameters to enhance the measurement processes. This study mainly focuses on the scope and recent advancements of the Non-destructive Testing (NDT) application for SHM of concrete, masonry, timber and steel structures.
1. Introduction
Structures and infrastructure systems, namely buildings, dams, bridges, and pipelines require proper inspection, monitoring, and maintenance to support economics, quality of life and sustainability in civil engineering. The conventional practice is based on human visual inspection, which is not able to locate any hidden damages [1,2]. Therefore, there is a need for better inspection techniques for monitoring the deterioration of infrastructure as assessing the condition of a structure is necessary for its safety and reliability. Nondestructive evaluation (NDE) provides methods for the detection of hidden damages, which provides valuable information that can be utilized to extend the lifespan of monitored structures. However, the structures’ large size gives a challenge for sensor implementation, which is offering more localized inspection. In recent years, many researchers have investigated different techniques for structural health monitoring using different methods, namely electromagnetic, acoustic and others. A number of commonly monitored parameters used for Structural Health Monitoring (SHM) applications include the detection or measurement of strain, load, displacement, impact, pH-level, moisture, vibration signatures, and presence of cracks [3].
The working principle of nondestructive testing (NDT) techniques varies depending on the measuring parameter, type of the structure, and its physical properties. For instance, compressional and shear wave velocities and electrical resistivity must be considered in terms of the building material and engineering properties of the structure. The consideration takes into account an assumption about the structure, and it can also involve calibrating the measurement, which is a requirement for most NDT surveys. There is usually a specific NDT technique that is used for the measurement of a particular parameter based on the physical properties of structures and reliability of the used method. Five major factors should be considered during the selection of the design of the NDT survey, namely (1) the penetration capability of the technique, (2) the resolution requirements for measurements, (3) the contrast in physical properties between the target and its surroundings, (4) the level of noise of the techniques, i.e., whether the provided information about the measured structure is valid and (5) historical reputation of the method in its use in the construction of the structure. The consideration of these factors should lead to the specification in the design of the NDT method or provide an alternative to NDT techniques if it is not suitable for solving a particular problem [4].
Therefore, in this paper, the working principle of various NDT techniques is discussed. Focus is placed on the following NDT techniques for SHM: sweep frequency technique, ground-penetrating technique, infrared methods, fiber optic sensors, camera-based methods, laser scanner techniques, acoustic emission sensors, and ultrasonic methods, which are presented in Section 2, Section 3, Section 4, Section 5, Section 6, Section 7, Section 8 and Section 9, respectively. The basic principles of each technique are explained, and recent research advancements are critically reviewed.
2. Sweep Frequency Technique
The sweep frequency technique uses electromagnetic waves. Electromagnetic (EM) waves are defined as the energy that propagates through space at the speed of light [5]. EM waves are formed of oscillating electric and magnetic fields where the magnetic field is oriented orthogonal to the electric field. The electromagnetic frequency range can be divided into separate bands, with low-frequency (long wavelengths) radio waves, microwaves, infrared, visible light, ultraviolet, X-rays, and gamma rays at the high-frequency (short wavelengths). The EM waves in each of those bands have different characteristics, namely how they are produced, interaction with measured material, and their practical applications [5,6].
The radio and microwaves are actively investigated for the purpose of detection of various anomalies in materials under test [7]. Microwaves are EM waves with wavelengths ranging from one meter to one millimeter, or equivalently, with frequencies between 300 MHz (0.3 GHz) and 300 GHz [8,9]. The benefit of this part of the EM spectrum is it is none ionizing and providing high depth penetration through dielectric materials offering great potential to be commercialized and applied across several industrial sectors. This technique has been broadly used for water and wastewater quality control [10,11], detection of substances deposited on various materials [12,13], cultural heritage [14] and healthcare applications [15].
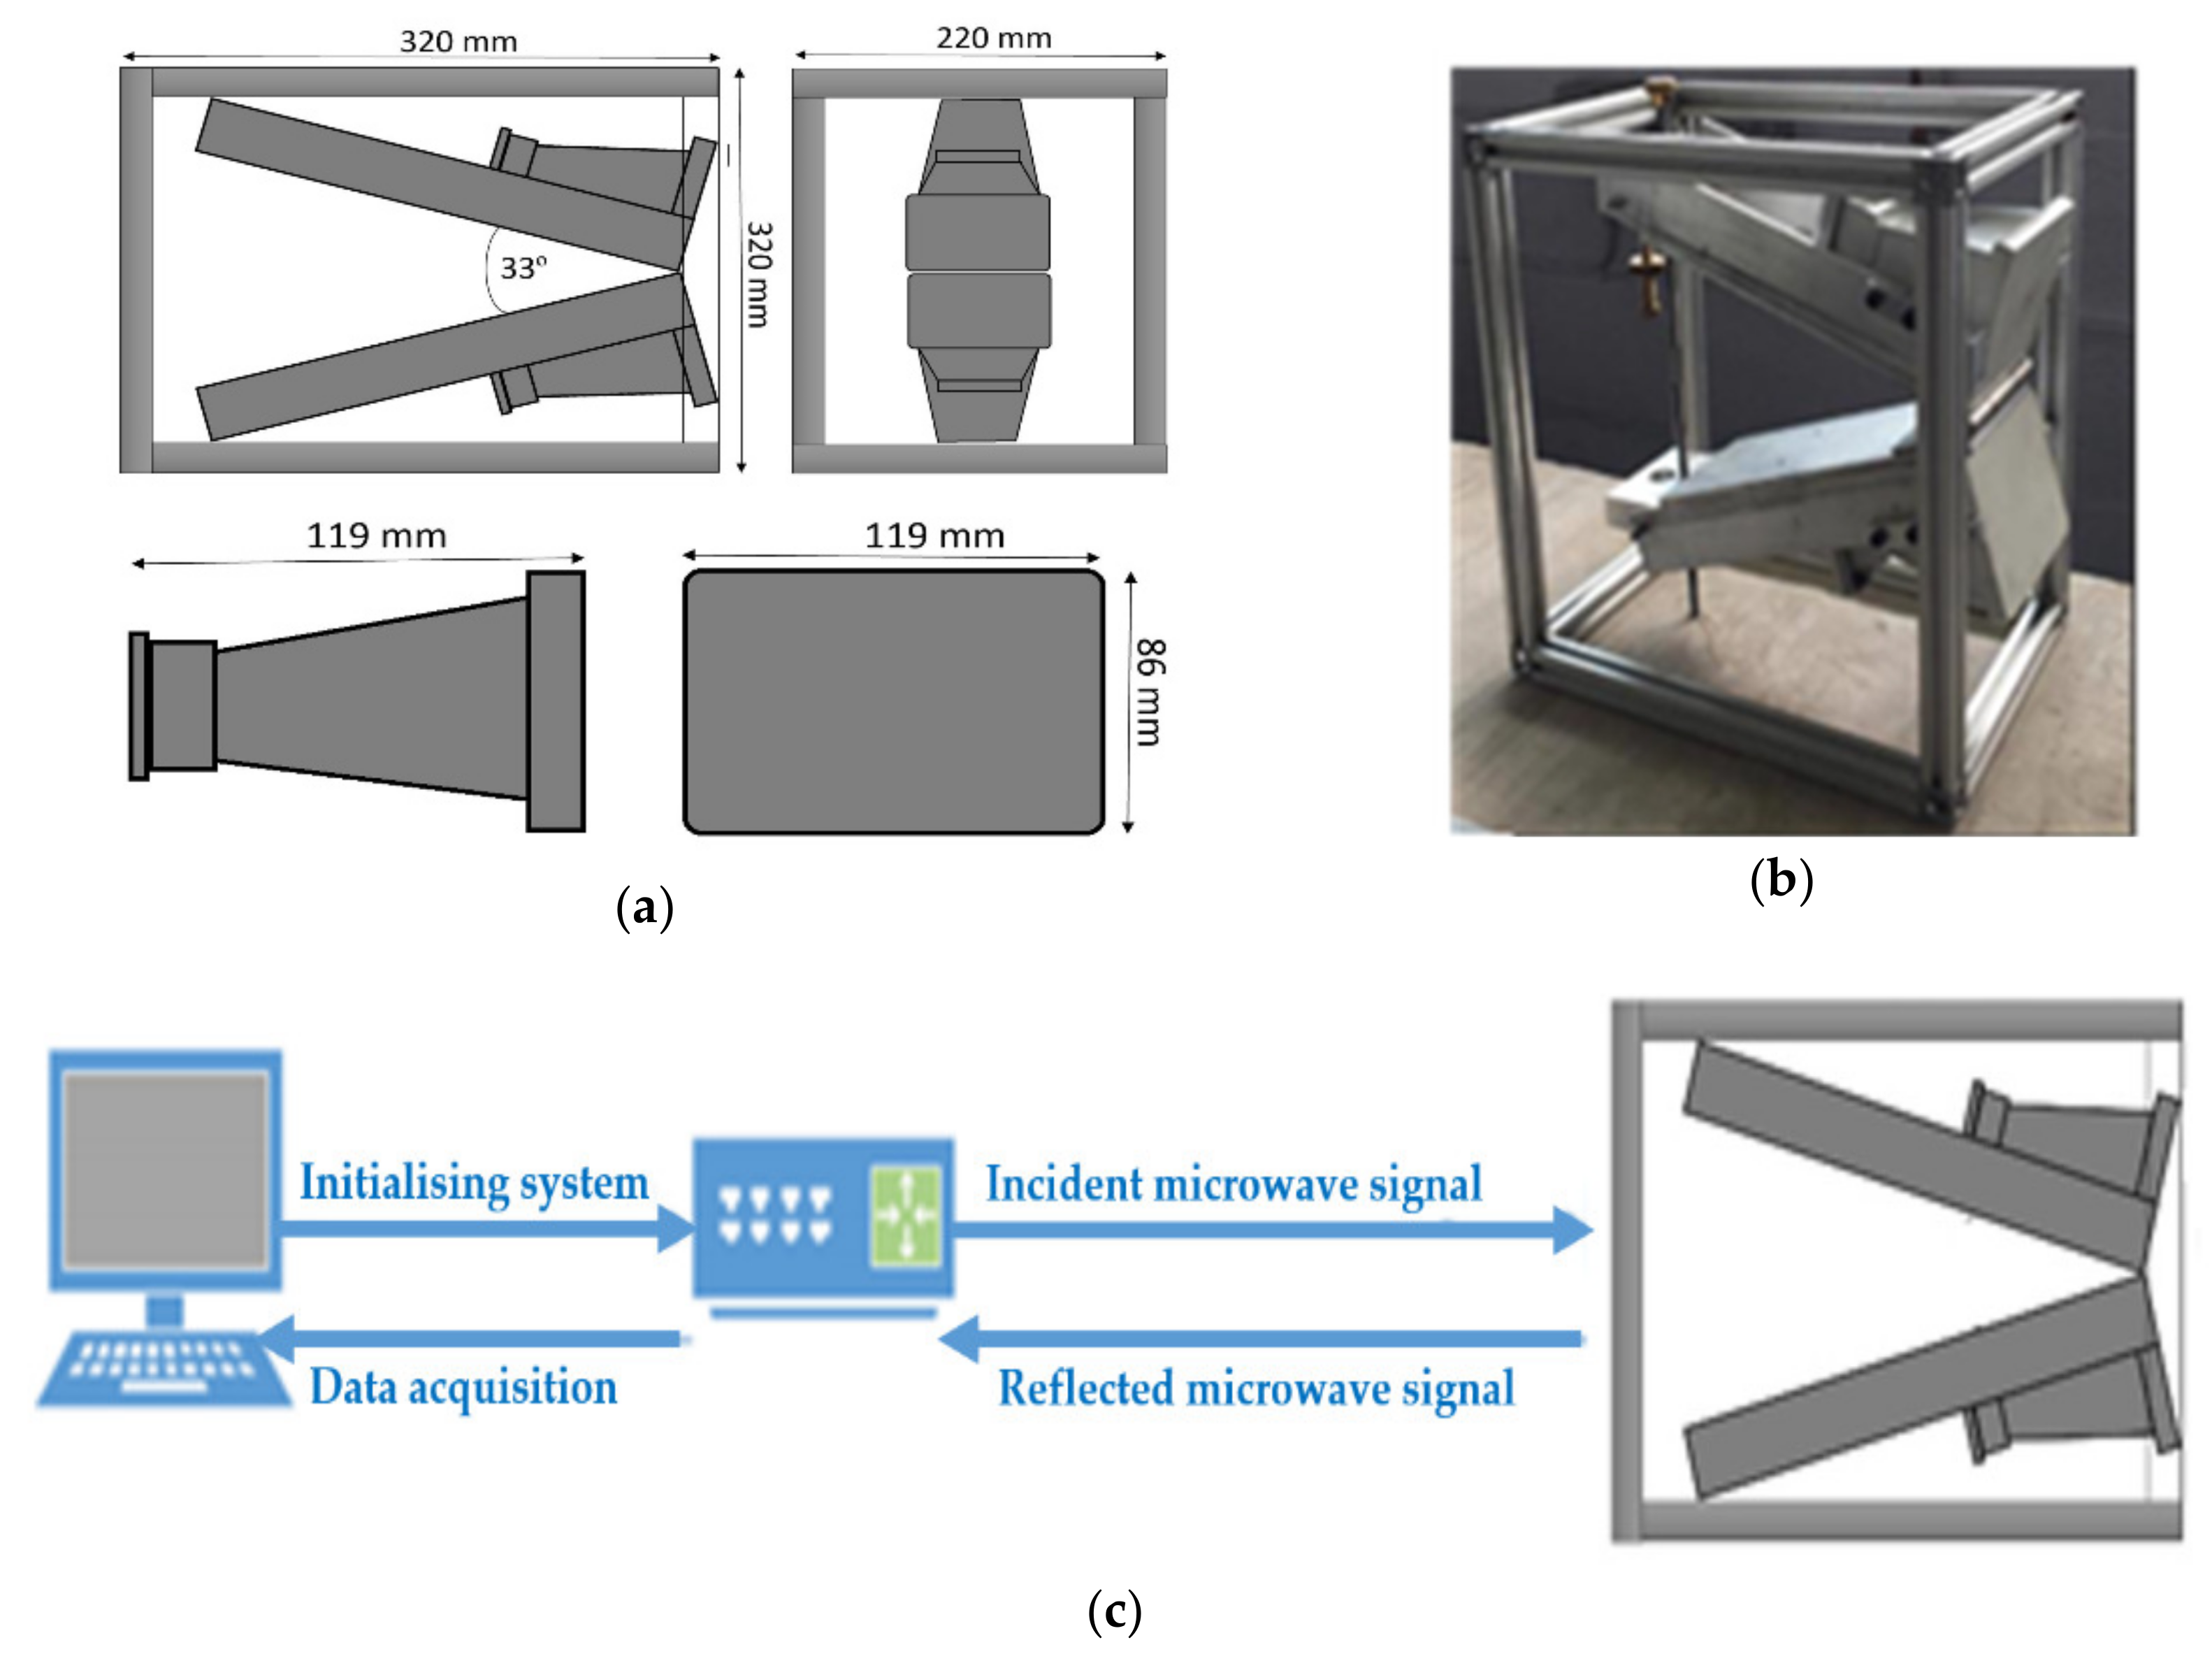
The Sweep Frequency Technique (SFT) is a microwave-based method that was investigated and proposed as a non-destructive measurement approach for structural health monitoring (SHM). The proposed SFT technique consists of two wideband horn antennas (transmitter and receiver), Vector Network Analyzer (Rohde & Schwarz ZVL13) and PC with in-house developed LabVIEW graphical user interface (GUI). The antennas are mounted on a bespoke frame that provides an ability to adjust the angle between the antennas and control the distance between the system and measured material under test (MUT). The antennas are connected to the vector network analyzer (VNA), which is controlled via the GUI.
The SFT system operates in the frequency domain and is set to sweep frequency from 2 GHz to 13 GHz. Measurements of the system are provided by S-parameters (S21), i.e., the incident wave is generated by the VNA and sent to the transmitter antenna via coaxial cable. The reflected signal from the MUT is captured via the receiver antenna and analyzed by the LabVIEW GUI in real-time. The dimensions of the bespoke frame with antennas and block diagram of the SFT system is presented in Figure 1.
The SFT was used for monitoring the excess moisture content caused by waterproof membrane defects [17,18] and chloride level [16] in concrete structures. Kot et al. [18] has first reported the use of the SFT for the detection of water infiltration for concrete roof structures. In the study, researchers replicated the concrete flat roof designs according to Malaysian standards and ran a series of experiments to monitor water infiltration, rebar location and membrane fault detection. The initial experimental work was undertaken with two flat roof specimens with and without reinforcement rebars. The obtained results demonstrated significant shifts in both frequencies (from 3.8 GHz to 4 GHz) and amplitude (from −38 dBm to −24 dBm) of the reflected signal from specimens with and without rebar, respectively. The changes were caused by more microwave energy is being able to penetrate through the specimen without rebar, i.e., microwaves are not able to penetrate through steel rebar, so more energy is reflected in the case of the reinforced specimen. The second study was carried out to detect membrane failure on concrete roof structures. Two concrete specimens (with and without rebar) were used to test the technique. The measurements were undertaken with and without faulty membranes (a hole with 20–30 mm diameter was made in the middle of the membrane) to investigate the changes in microwave signal, namely amplitude and frequency changes. The obtained results demonstrated that membrane failure influenced the microwave signal. The changes were both in the amplitude and frequency of the reflected microwave signal. The proposed technique was also investigated to detect chloride level in reinforced concrete (RC) structures by Omer et al. [16]. In this study, five concrete specimens were made and submerged first in tap and then in salted (various concentrations of chloride) water. The aim was to investigate the influence (if there is any) of the presence of chloride on the microwave signal. The captured results demonstrated that the absorption of the microwave energy was lower in specimens with lower chloride concentration owing to the lower conductivity, which in turn influences the microwave signal, namely the amplitude. The obtained data was pre-processed and analyzed using Levenberg-Marquardt algorithm, which demonstrated that the technique can detect chloride level in concrete with R2 = 0.99 and RMSE = 0.00012 at 5.42 GHz.
Microwave sensing technology was also investigated by researchers as an embedded solution for long term monitoring of concrete and masonry structures. A rectangular patch antenna (resonating at 2.45 GHz) and a split ring resonator (SRR) (resonating at 3.4 GHz, 4.7 GHz, 5.7 GHz, 8.7 GHz and 10.6 GHz) were investigated to monitor the excess moisture content in concrete specimens [19] and detect cracks in RC [20], respectively. Both sensor structures were embedded inside the concrete specimens for real-time monitoring. A model for the determination of moisture content and deterioration of concrete was successfully developed and implemented. Moisture content inside concrete specimens and crack development in RC specimens can be studied from the data of their interactions with microwaves. This measurement is provided via S-parameter (reflection coefficient (S11)), i.e., in the form of complex data.
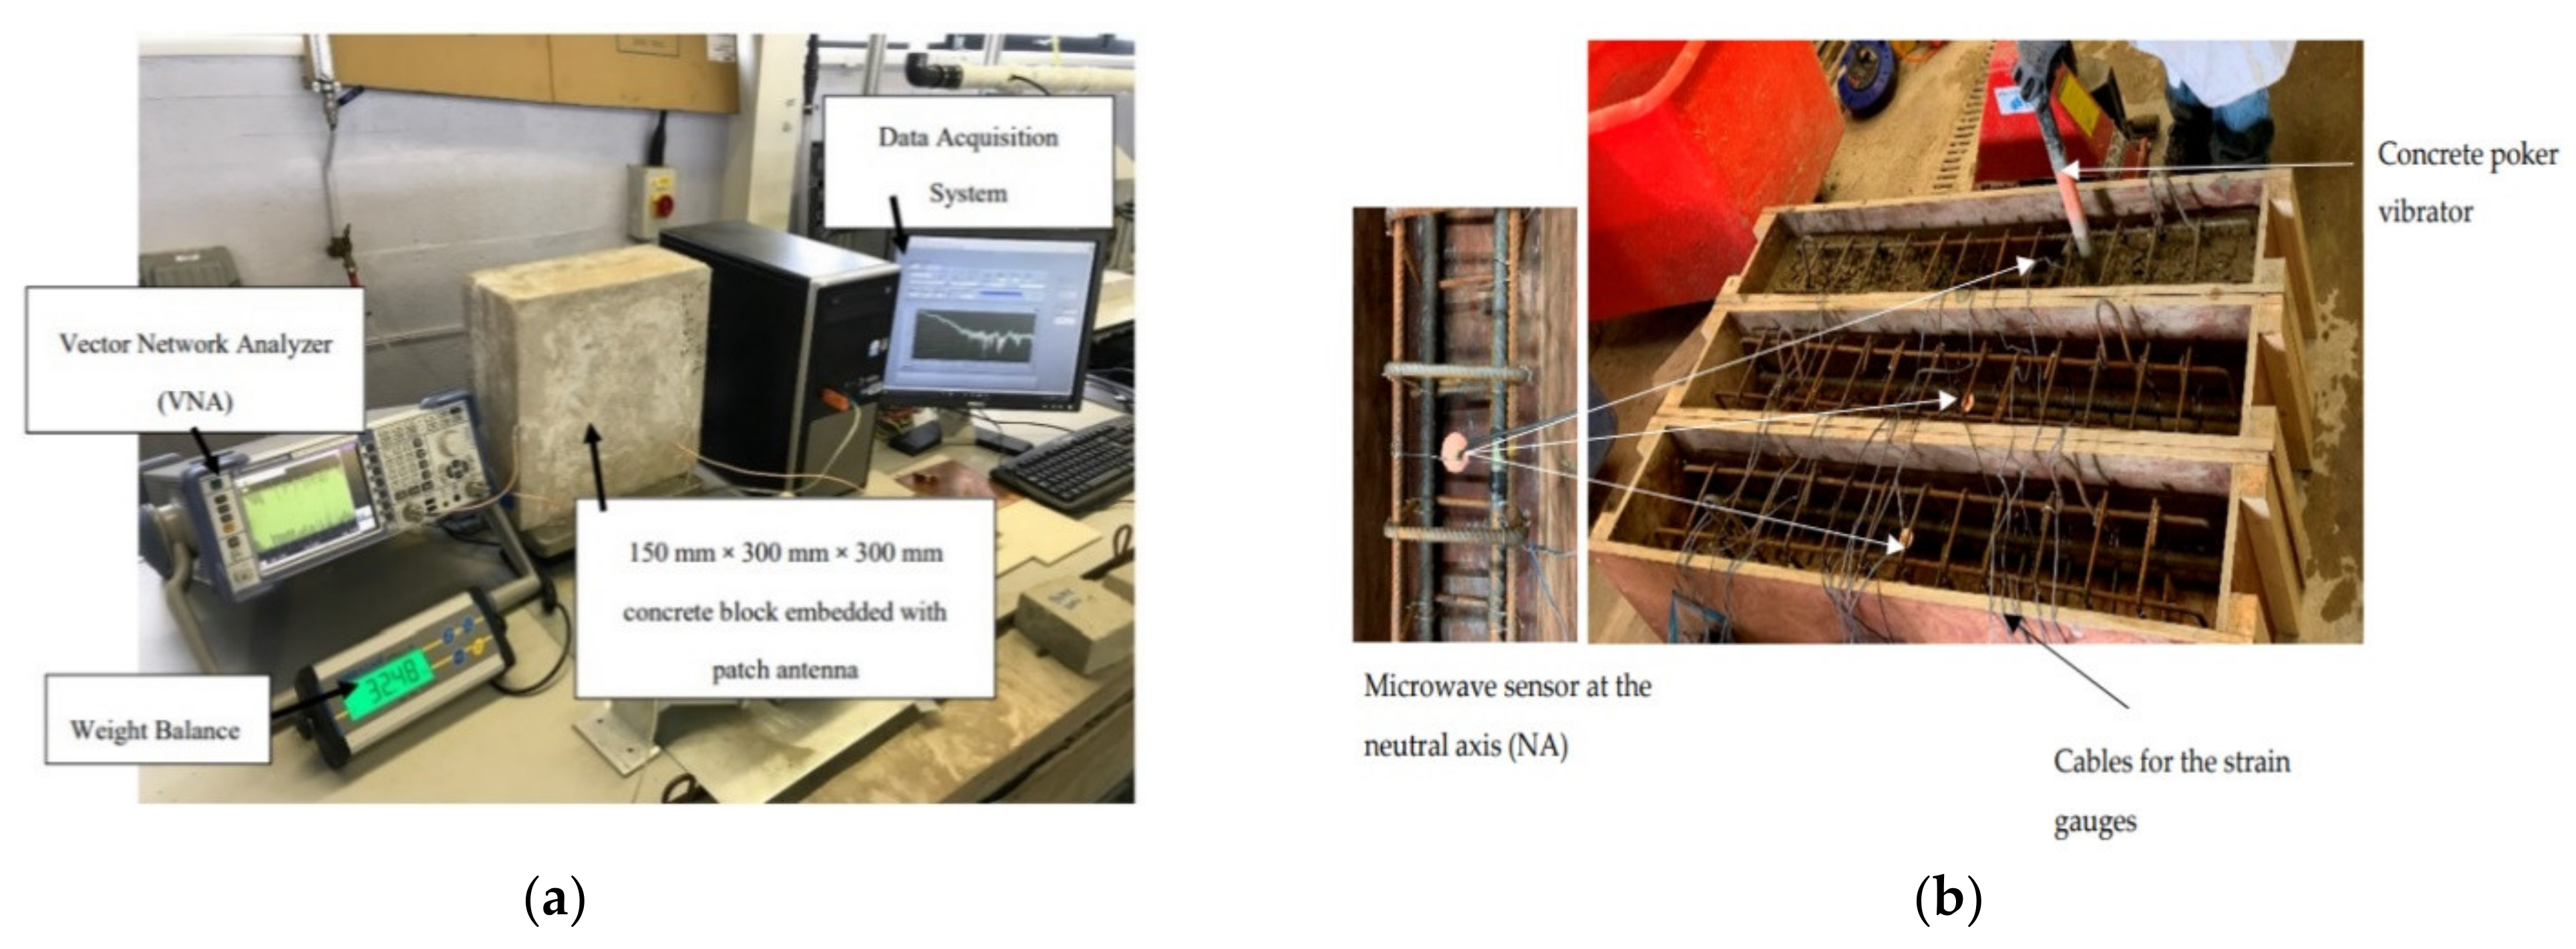
The experimental setup for the detection of moisture content with a rectangular patch antenna is presented in Figure 2a. The setup consists of a concrete specimen with the embedded antenna, which is connected to Vector Network Analyzer (VNA) and a PC with a bespoke LabVIEW program to control VNA and capture data. The specimen was submerged in water in order to increase the moisture content of the specimen and then was placed on a digital weighing scale to monitor the drying off process. Both specimen weight and microwave signal from the embedded antenna were recorded every 5 min for a period of 48 h. The data analysis presented a strong linear relationship between the weight loss of the specimen and changes in amplitude of the microwave signal from the embedded antenna, with R2 = 0.98.
Figure 2b shows the experimental setup for the detection of cracks in RC concrete specimens. The SRR antenna was placed 100 mm from the bottom of the concrete specimen in order to capture the crack propagation in the tensile zone just below the neutral axis of the specimen. In addition, the strain gauges were attached to the tensile reinforcement bars to measure the vertical deflection of the specimens while a load cell was used for the recording of the load increments applied by a calibrated hydraulic 100 kN load actuator. Synchronized data acquisition systems were used for the structural response measurements. The full captured microwave signal (1–10 GHz) was analyzed in order to investigate a relationship between the crack propagation and the signal. The strongest linear relationship was identified between the 2.8 GHz and 3 GHz frequency range, with R2 varying between 0.90 and 0.94.
Both studies have demonstrated the potential use of microwaves to monitor excess moisture in concrete structures as well as to detect crack propagation in reinforced concrete structures, offering a low-cost option for structural health monitoring (SHM). Further investigation is required to validate the results prior to the implementation of the proposed embedded sensors into actual structures.
3. Ground Penetrating Radar
Ground-penetrating radar (GPR) is one of the most used electromagnetic (EM) wave-based techniques in civil engineering owing to the noninvasive, low costs, and rapid monitoring nature of the technique. GPR is used for the evaluation of the stability of concrete and masonry structures, maintenance of the structures, and structural health monitoring of infrastructure conservation. In addition, the GPR technique is investigated to inspect the asphalt pavements in order to detect voids, fractures, or other types of defects [21,22].
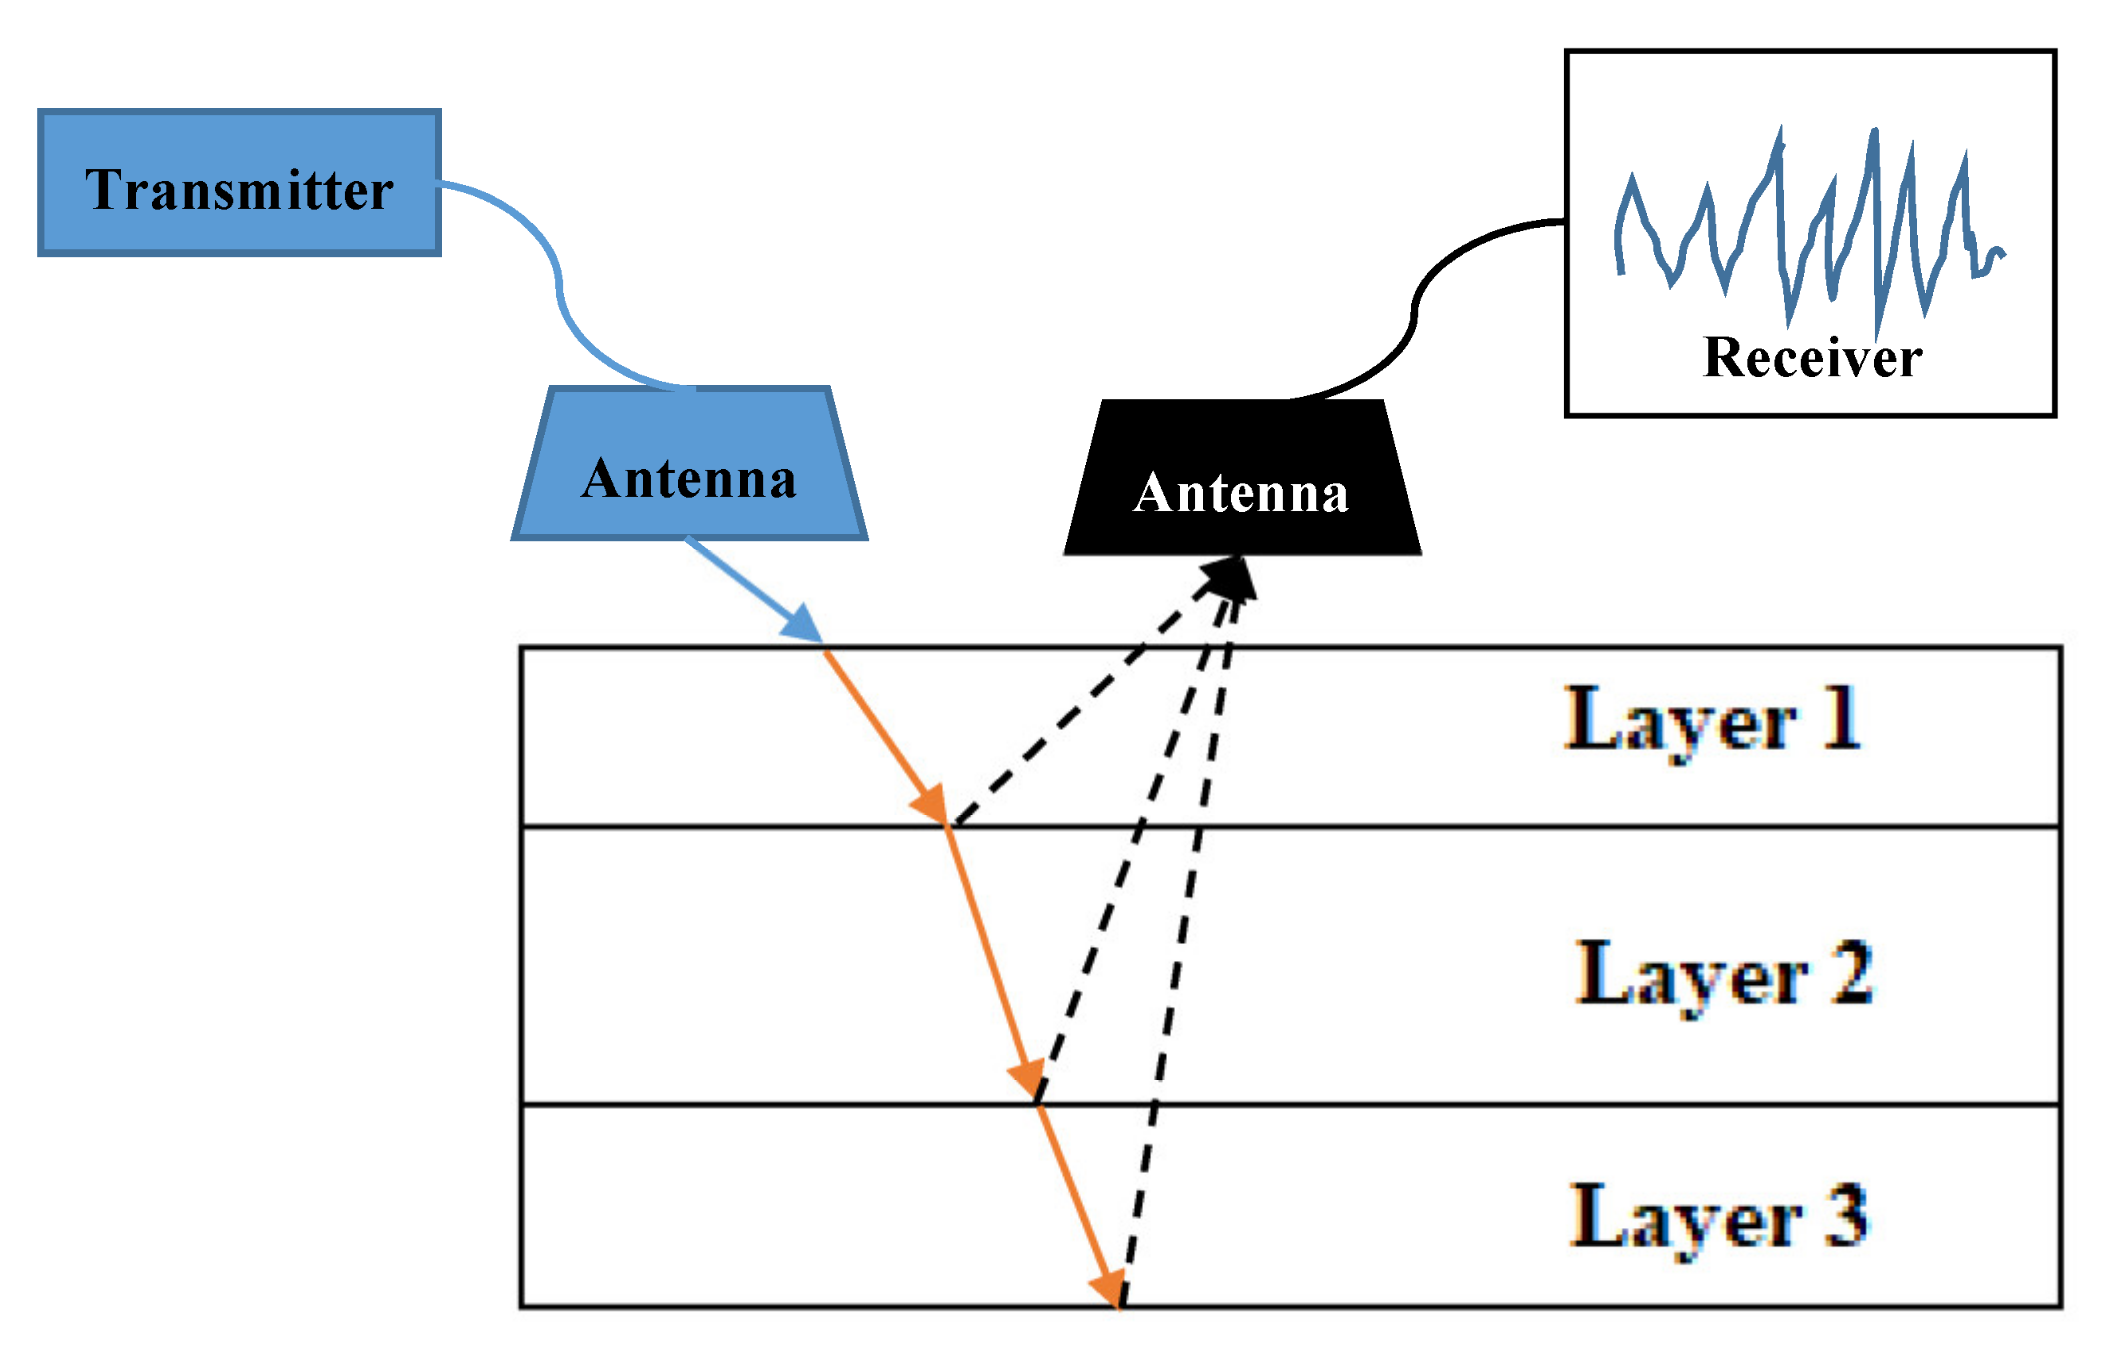
The working principle of the GPR technique is the use of the microwave region of the EM spectrum that employs a transmitter and a receiver (antennas) to send and capture the reflected wave (as shown in Figure 3. Radiated short pulses of high-frequency EM energy are generated by pulse mode GPR systems that penetrate through an object via a transmitting antenna and then detected by a receiver. Various frequencies are used depending on the requirement of the measurement, namely resolution versus penetration depth, i.e., the higher the operating frequency, the higher the resolution, and the lower the penetration depth of the system. To maintain the accuracy of the GPR systems, they must be calibrated with a core sample of the tested material [4]. The measured signal is amplified, processed, and analyzed based on the altered signal, i.e., the transmitted energy is partially absorbed and transmitted by the material under investigation, and the rest is reflected and captured by the system. The changes in the reflected energy, namely, electrical conductivity, dielectric permittivity, and magnetic permeability, help to detect, for instance, cables, pipes, rods inside structures [23] and to monitor the corrosion in reinforced concrete (RC) structures [24].
GPR inspections are often carried out in combination with other noninvasive geophysical techniques, namely, acoustic techniques, infrared thermography (IRT) and, electrical resistivity tomography (ERT) [21]. In the past five years, researchers focused on the development of various GPR data analysis methods in order to overcome the limitations of the technique.
One of the main drawbacks of the technique is the requirement for a highly skilled specialist to interpret captured data from the system. Therefore, researchers have been investigating various approaches to address the limitation, namely the implementation of artificial intelligence techniques to analyze the data for the detection of objects. Typically, there are three types of data obtained via the GPR system, namely A-, B- and C-scan data. A-scan data is punctual time-domain data (z-axis) at a certain spatial point, while the B-scan provides x-z domain data (x-axis) that are generated from numerous A-scan data along the scanning route. The C-scan data is obtained from the x-y domain data by combining B-scan images, which is acquired utilizing multiple antennas [25]. Khudoyarov et al. [26] proposed the three-dimensional convolutional neural network to analyze the GPR data in order to classify the underground objects. The 13 km of the 3D data was collected from urban roads in Seoul, South Korea, using a multichannel antenna mounted on the vehicle. The data consisted of various objects, namely, cavities, pipes, manholes and subsoil background. The proposed classification demonstrated the accuracy for cavities, pipes, manholes, and subsoil backgrounds 88%, 100%, 100% and 100%, respectively. The average classification accuracy for four underground objects is 97%.
Researchers are exploring other methods to improve GPR data assessment. For instance, Morris et al. [27] applied GPR for infrastructure assessment and SHM using quantitative attribute analysis. The purpose of the study is to investigate how the physical and mechanical properties of scanned objects are implicated in GPR data. The scans were carried out on Streicker Bridge with a GSSI StructureScan 2.6 GHz antenna to maintain a good balance between high resolution and a reasonable concrete penetration depth. The longitudinal and transverse scans of the bridge deck were collected, where longitudinal transects were collected at 15 cm line spacing with a nominal length of 8 m. The obtained data were processed using a standard set of basic filters focusing on preserving the relative amplitude of the data rather than absolute amplitude as the latter is influenced by the EM properties of the material, surface roughness and other external factors. Findings from the study demonstrated the potential of the attribute analysis method for the characterization of material when combined with other SHM and NDE techniques.
One of the advantages of structural health monitoring is the possibility to monitor structures over a long period of time in order to predict potential failures. On the other hand, processing and analysis of such data may present various challenges. Hong et al. [28] proposed a new method to address the challenges of processing long-term monitoring data from the GPR system. The principle of the new signal processing procedure involves individually pre-processing and energy mapping of each input GPR dataset. Then, the GPR signal energy intensity mappings are further registered using Mutual Information (MI) based image registration method. The final stage of the process is to normalize the intensity of the aligned images. In this study, researchers analysed GPR data collected to monitor the accumulative corrosion process over a period of 10 years. The proposed method of GPR signal processing was able to align the monitoring images and normalize their intensities in order to detect reinforcement corrosion in concrete.
4. Infrared Method
The infrared (IR) method is widely used in the civil engineering field in order to locate the weak spots or deterioration of structures, which are caused by cracks or corrosion [2]. The working principle of the IR method utilizes the measurement of the temperature changes on the surface of structures caused by compression or tension. The method uses specialized scanning cameras to capture the emitted heat at any temperature and convert the data into thermal images for further analysis.
Concrete structures with defects, namely debonding render and mosaic or delaminating concrete, emits infra-red radiation, which can be seen by the infra-red cameras as the concrete surface will heat up faster under solar irradiation, and the generated hot spots will be visible in the thermal record. The uniformity of the captured IR images of surfaces with even color and texture indicates that the structure has no or insignificant defects [4]. This method has been found effective for the rapid assessment of large structures, namely, high-rise apartment blocks. The advances in the development of high-end IR cameras can potentially enhance the reliability, accuracy, and cost-effectiveness of the technique [24].
Recent advancements of this technology have focused on the development of the automated data processing and analysis methods and their deployment onto various platforms (e.g., UAV). Hiasa et al. [29] proposed a new methodology for the enhancement of the usability and efficiency of IR thermography for subsurface detection of damages on concrete structures. The aim of this investigation was to address a challenge with interpretation and detection of delamination from IR images as setting up the temperature too high or too low might affect the identification of some defects. A finite element (FE) model was designed and simulated using COMSOL software in order to obtain a threshold for IR thermography data processing. Two thresholds were obtained for this investigation, namely sound and delaminated areas from the IR image and FE model, respectively. In this study, various sensitive parameters and factors to validate FE models, namely the size of delamination (area, thickness and volume), ambient temperature and solar irradiance conditions (different season), and the depth of delamination from the surface. The validation of the FE model demonstrated the potential of FEM analysis in the detectability within a temperature difference range of approximately ±0.3–0.4 °C band between delaminated and sound areas. The undertaken FEM simulation provides the possibility to estimate a detectable delamination depth by IRT prior to field inspection, which in turn will save time and improve the efficiency of the measurement and detection procedure.
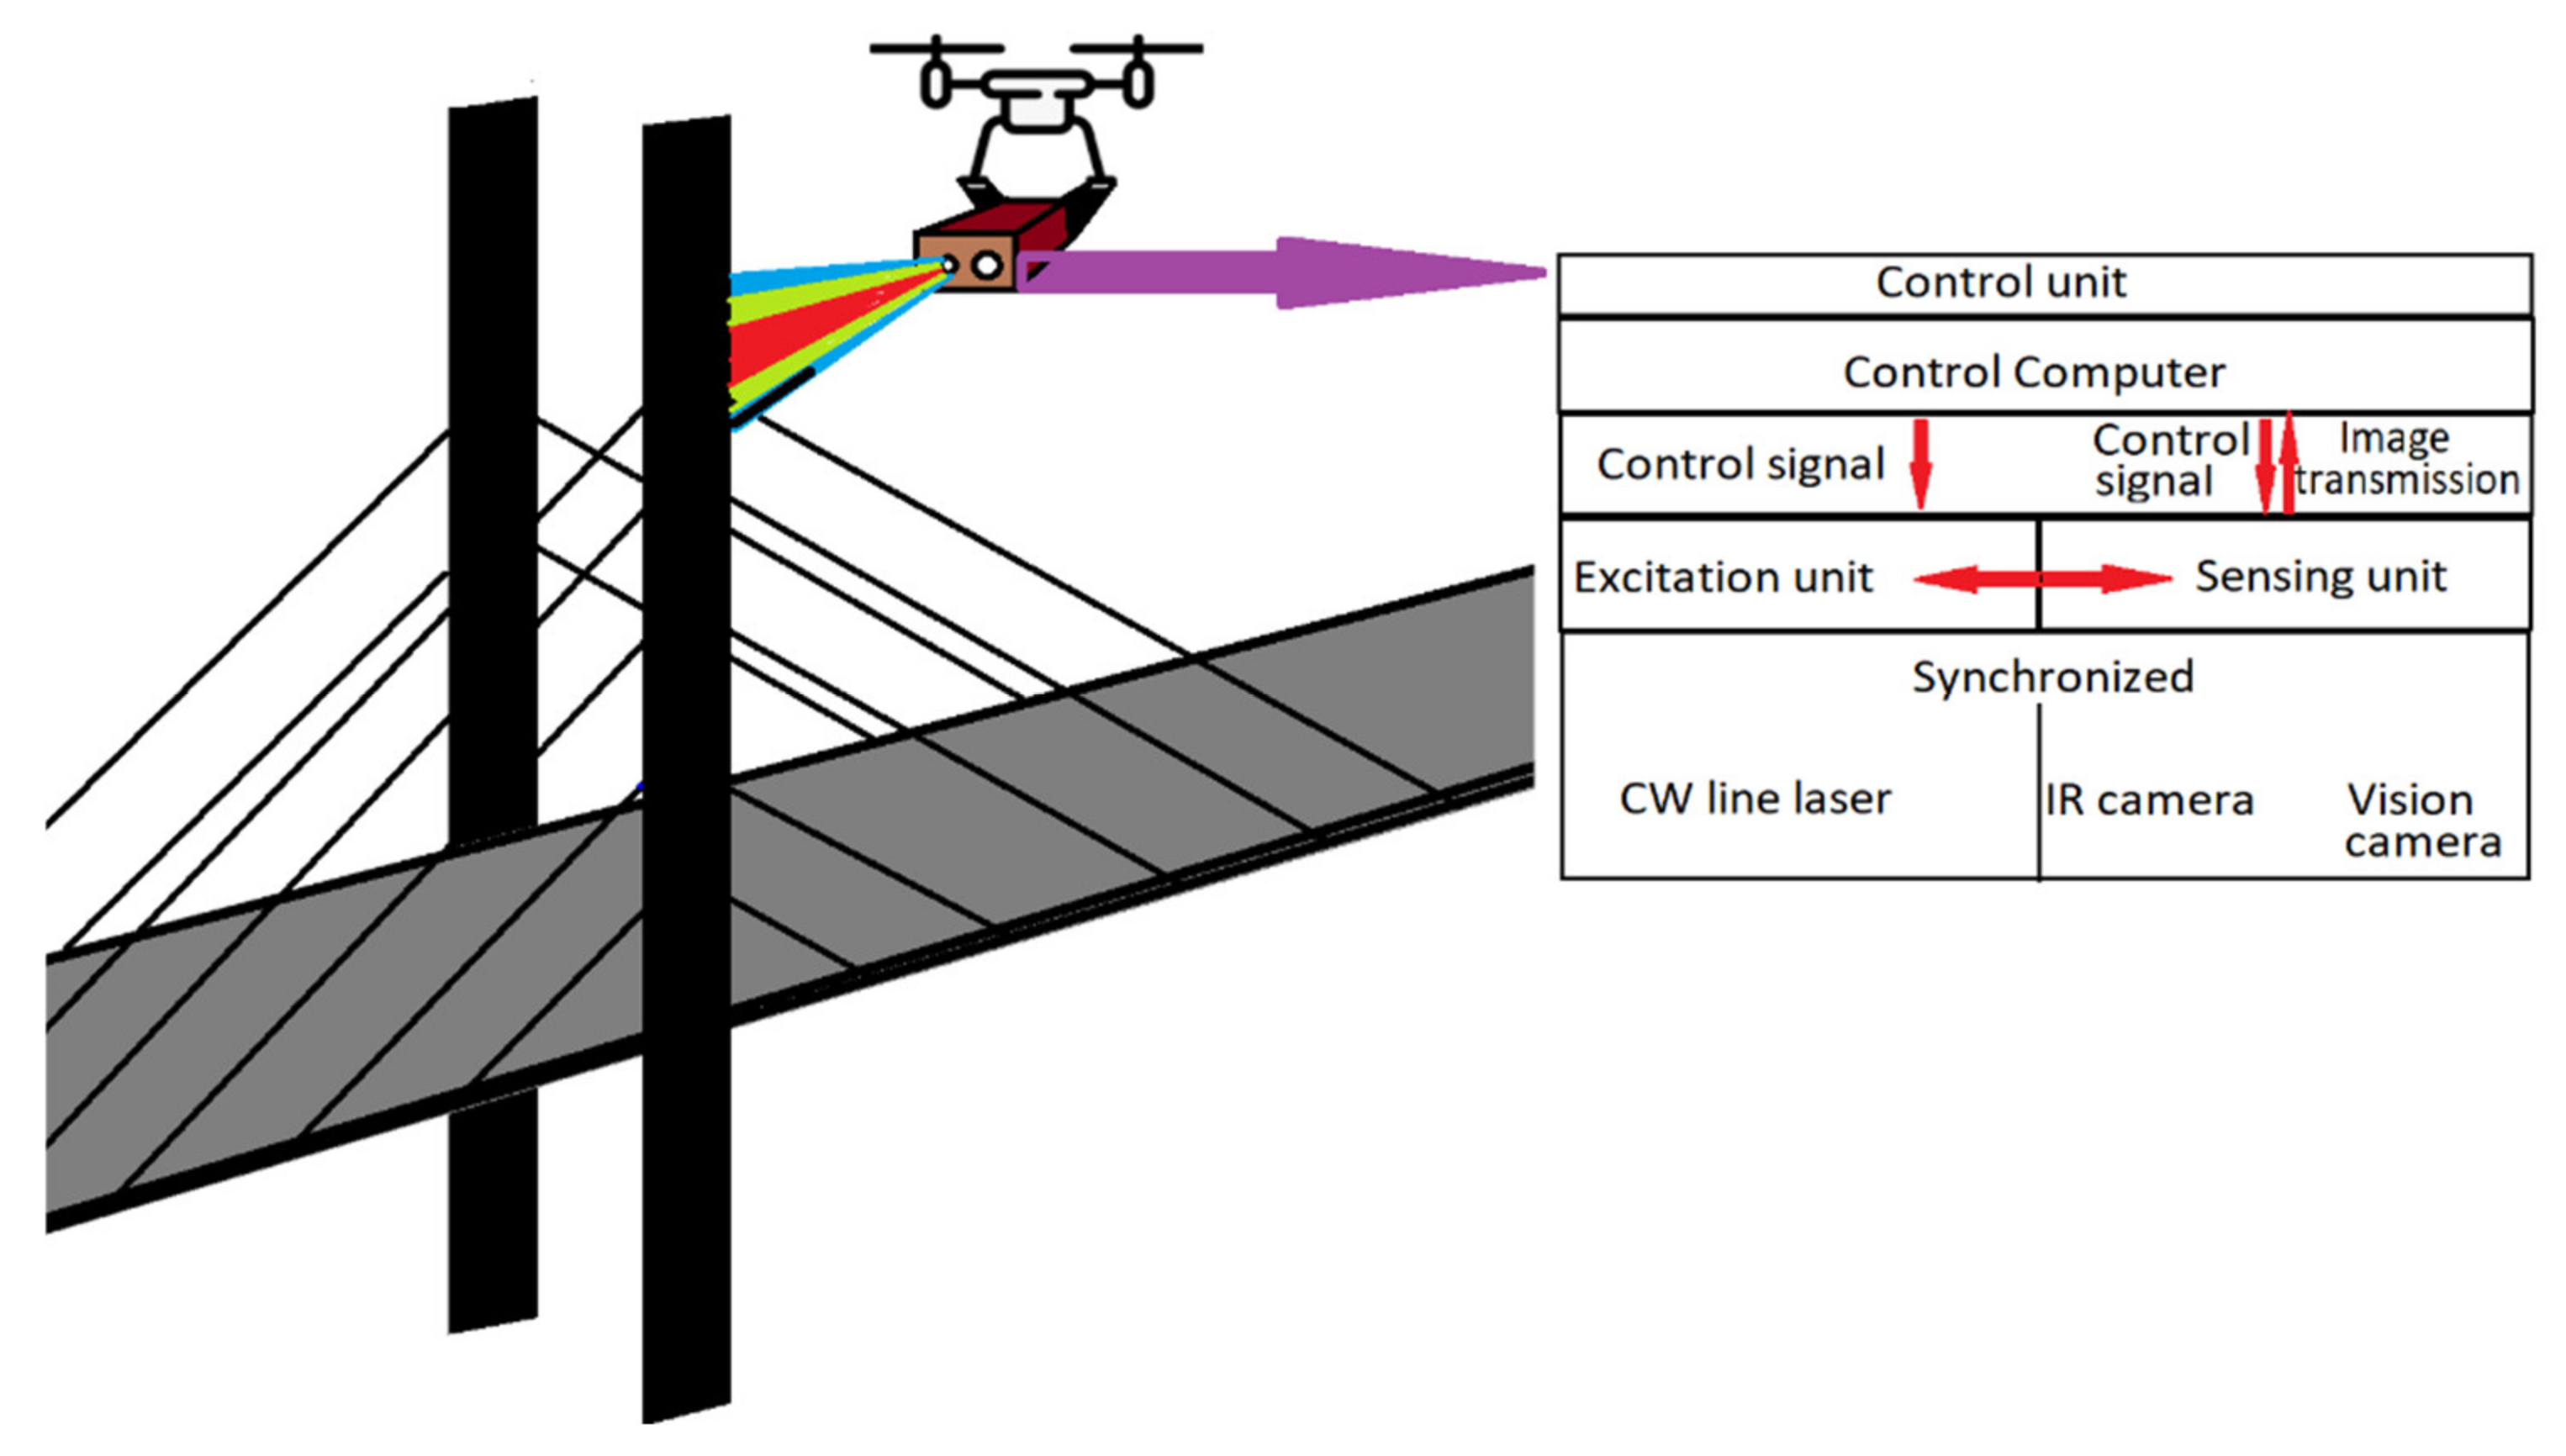
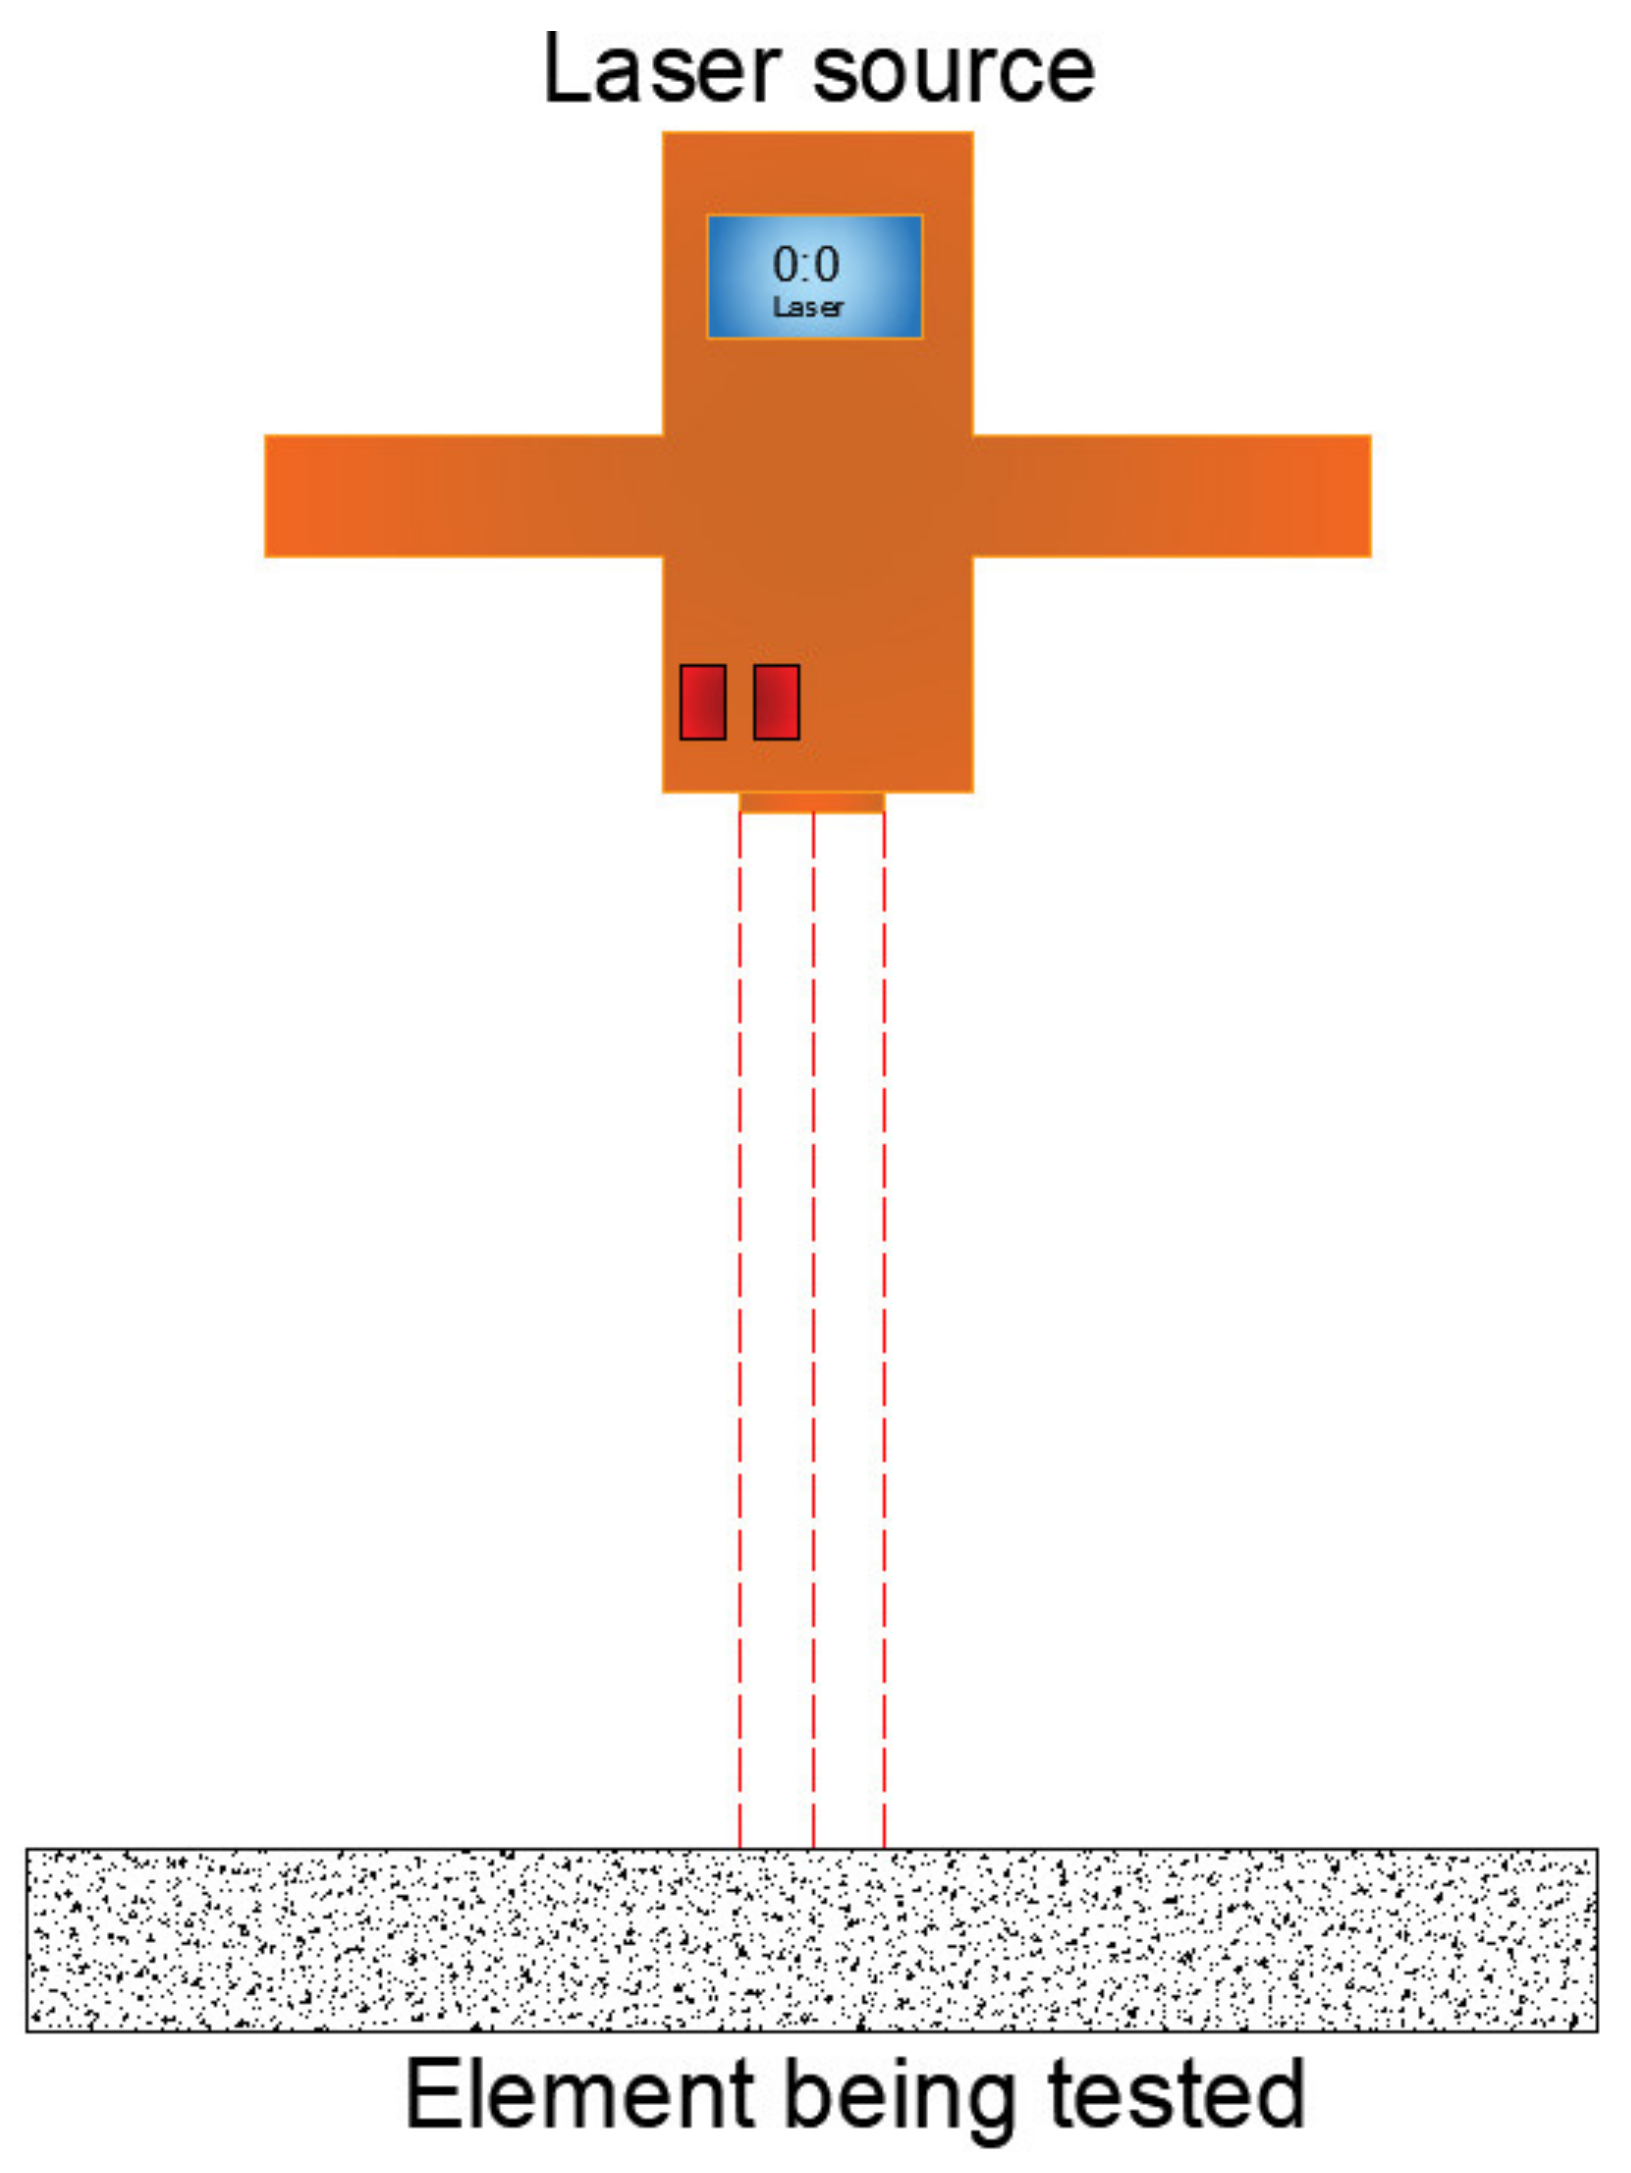
The infrared measurement technique has also been combined with other measurement methods, which is a common practice in SHM. However, hybrid methods require highly skilled specialists in multiple disciplines in order to interpret and/or analyze obtained data. In recent years, artificial intelligence has become an important part of the interpretation of complex data. Jang et al. [30] proposed the use of deep machine learning to automate the concrete crack detection process. In this study, a hybrid image scanning (HIS) system (see Figure 4) comprised of vision and infrared (IR) thermography was used. The system was controlled via a bespoke LabVIEW program, and the obtained data were processed using MATLAB. The working principle of the system is initiated via the control computer, which activates the continuous-wave (CW) laser to emit the point laser beam. The laser beam is then transformed into a line-shaped laser beam that is focused on a measured surface. In addition, the vision and IR cameras are used to acquire the surface condition and thermal waves responses. The scanned data is automatically saved in the control computer. Both captured vision and IR images are first distortion-calibrated and then go through the time–spatial-integrated (TSI) coordinate transformation. After the transformation process, IR images are further processed via phase mapping and spatial derivative method for precise multiple crack visualization, whilst vision images go through a deep convolutional neural network (CNN) process for the automatic crack extraction. Then, the images are matched and evaluated by the deep CNN process. The system was experimentally tested and validated using concrete specimens with various cracks in laboratory conditions. The results demonstrated the potential of the system to automatically visualize macro- and microcracks by minimizing false alarms.
5. Fiber Optics
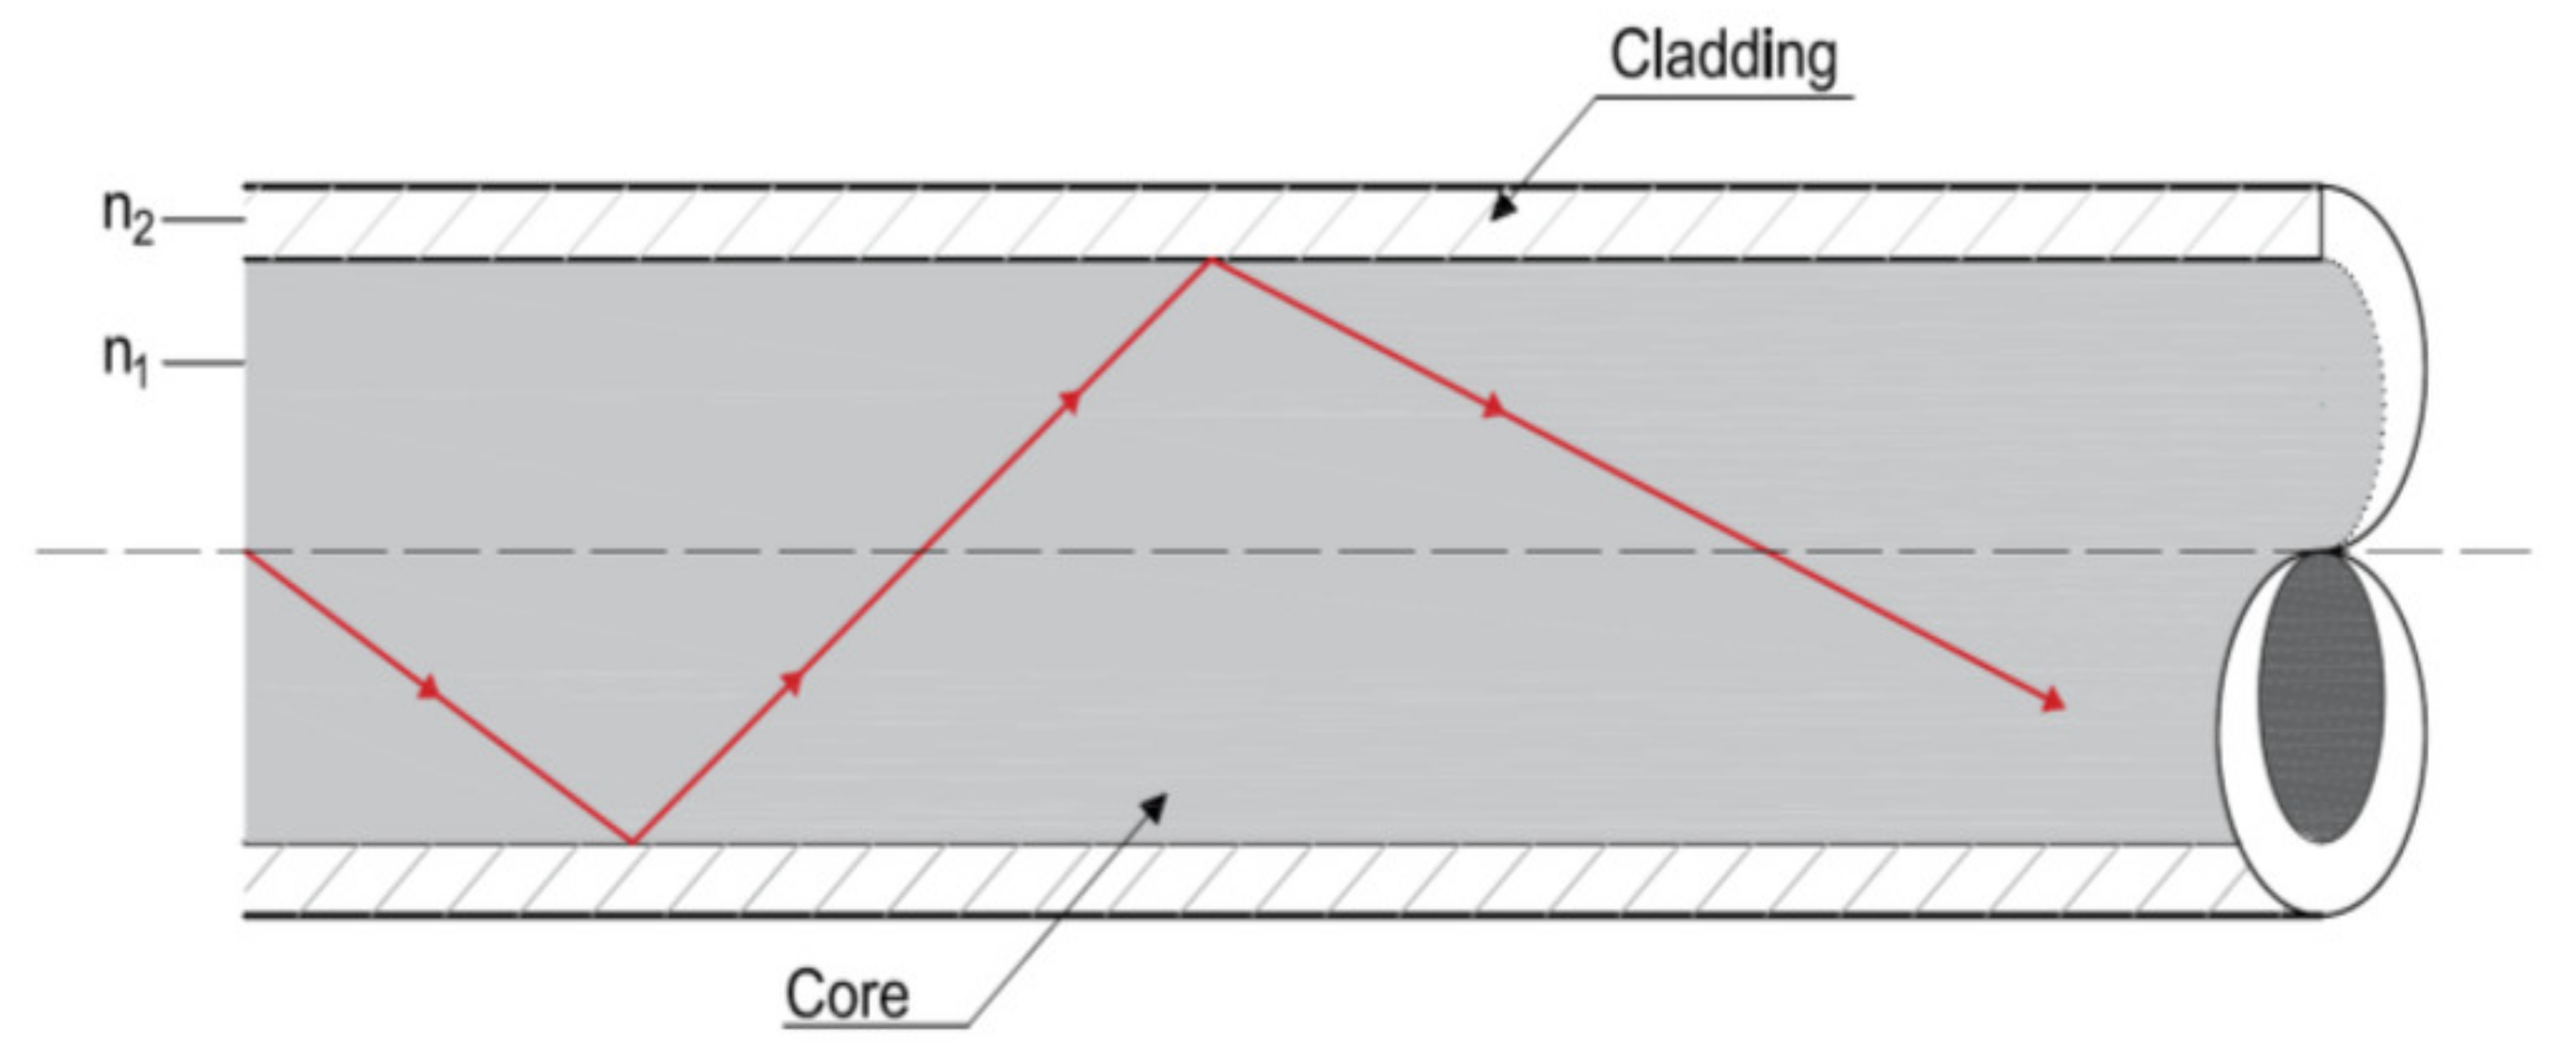
Fiber Optic Sensors (FOSs) have found their practical use in civil engineering applications for structural health monitoring, including crack detection, measuring strains, pH level, vibration, corrosion, temperature monitoring, etc. The FOSs are designed to manipulate transmitted or reflected light response, namely, intensity, polarization, and spectral content of the phase from the measured object. A FOS is a cylindrical symmetric structure, which comprises a central core with a diameter between 4 and 600 µm and a uniform refractive index [31]. The FOS is enclosed in cladding with a relatively lower refractive index. In this way, the light waves propagating within the core are trapped by the cladding due to the reflection at the interface between the core and the cladding [32]. The cladding is then covered with an external plastic coating, which provides environmental and mechanical protection to the FOS. A FOS is shown in Figure 5.
The FOSs offer a number of advantages compared to traditional sensors, such as strain gauges. Firstly, the light signal in the FOS is transmitted over a very long length leading to insensitivity to electromagnetic radiation and very low signal transmission loss [3]. FOSs are very durable since they are made of glass, and the protection cover is free from corrosion, which increases their durability [33,34]. FOSs are not non-conductive, which means that they are free of electromagnetic and radio-frequency interference. Thus, they can be used in urban areas, in which the problem of signal interferences is severe. FOS are light and of small size, and for this reason, they are suitable for embedding them permanently into structures [3,33]. In addition, many FOSs can be joined together into one array, so one cable is able to work for approximately 10 sensors, which is an advantage over the traditional electrical strain gauges and accelerometers that require a larger amount of wiring for one sensor. This results in simplification of the cable layout, and thus the installation period of FOSs is less than that of traditional sensors, which leads to less installation costs [33]. FOSs can be divided into three main techniques, i.e., fiber Bragg grating (FBG) sensors, distributed sensors and interferometric sensors [35]. In the following, the principles of each method are provided, along with some recent application in Civil Engineering.
5.1. Fiber Bragg Grating
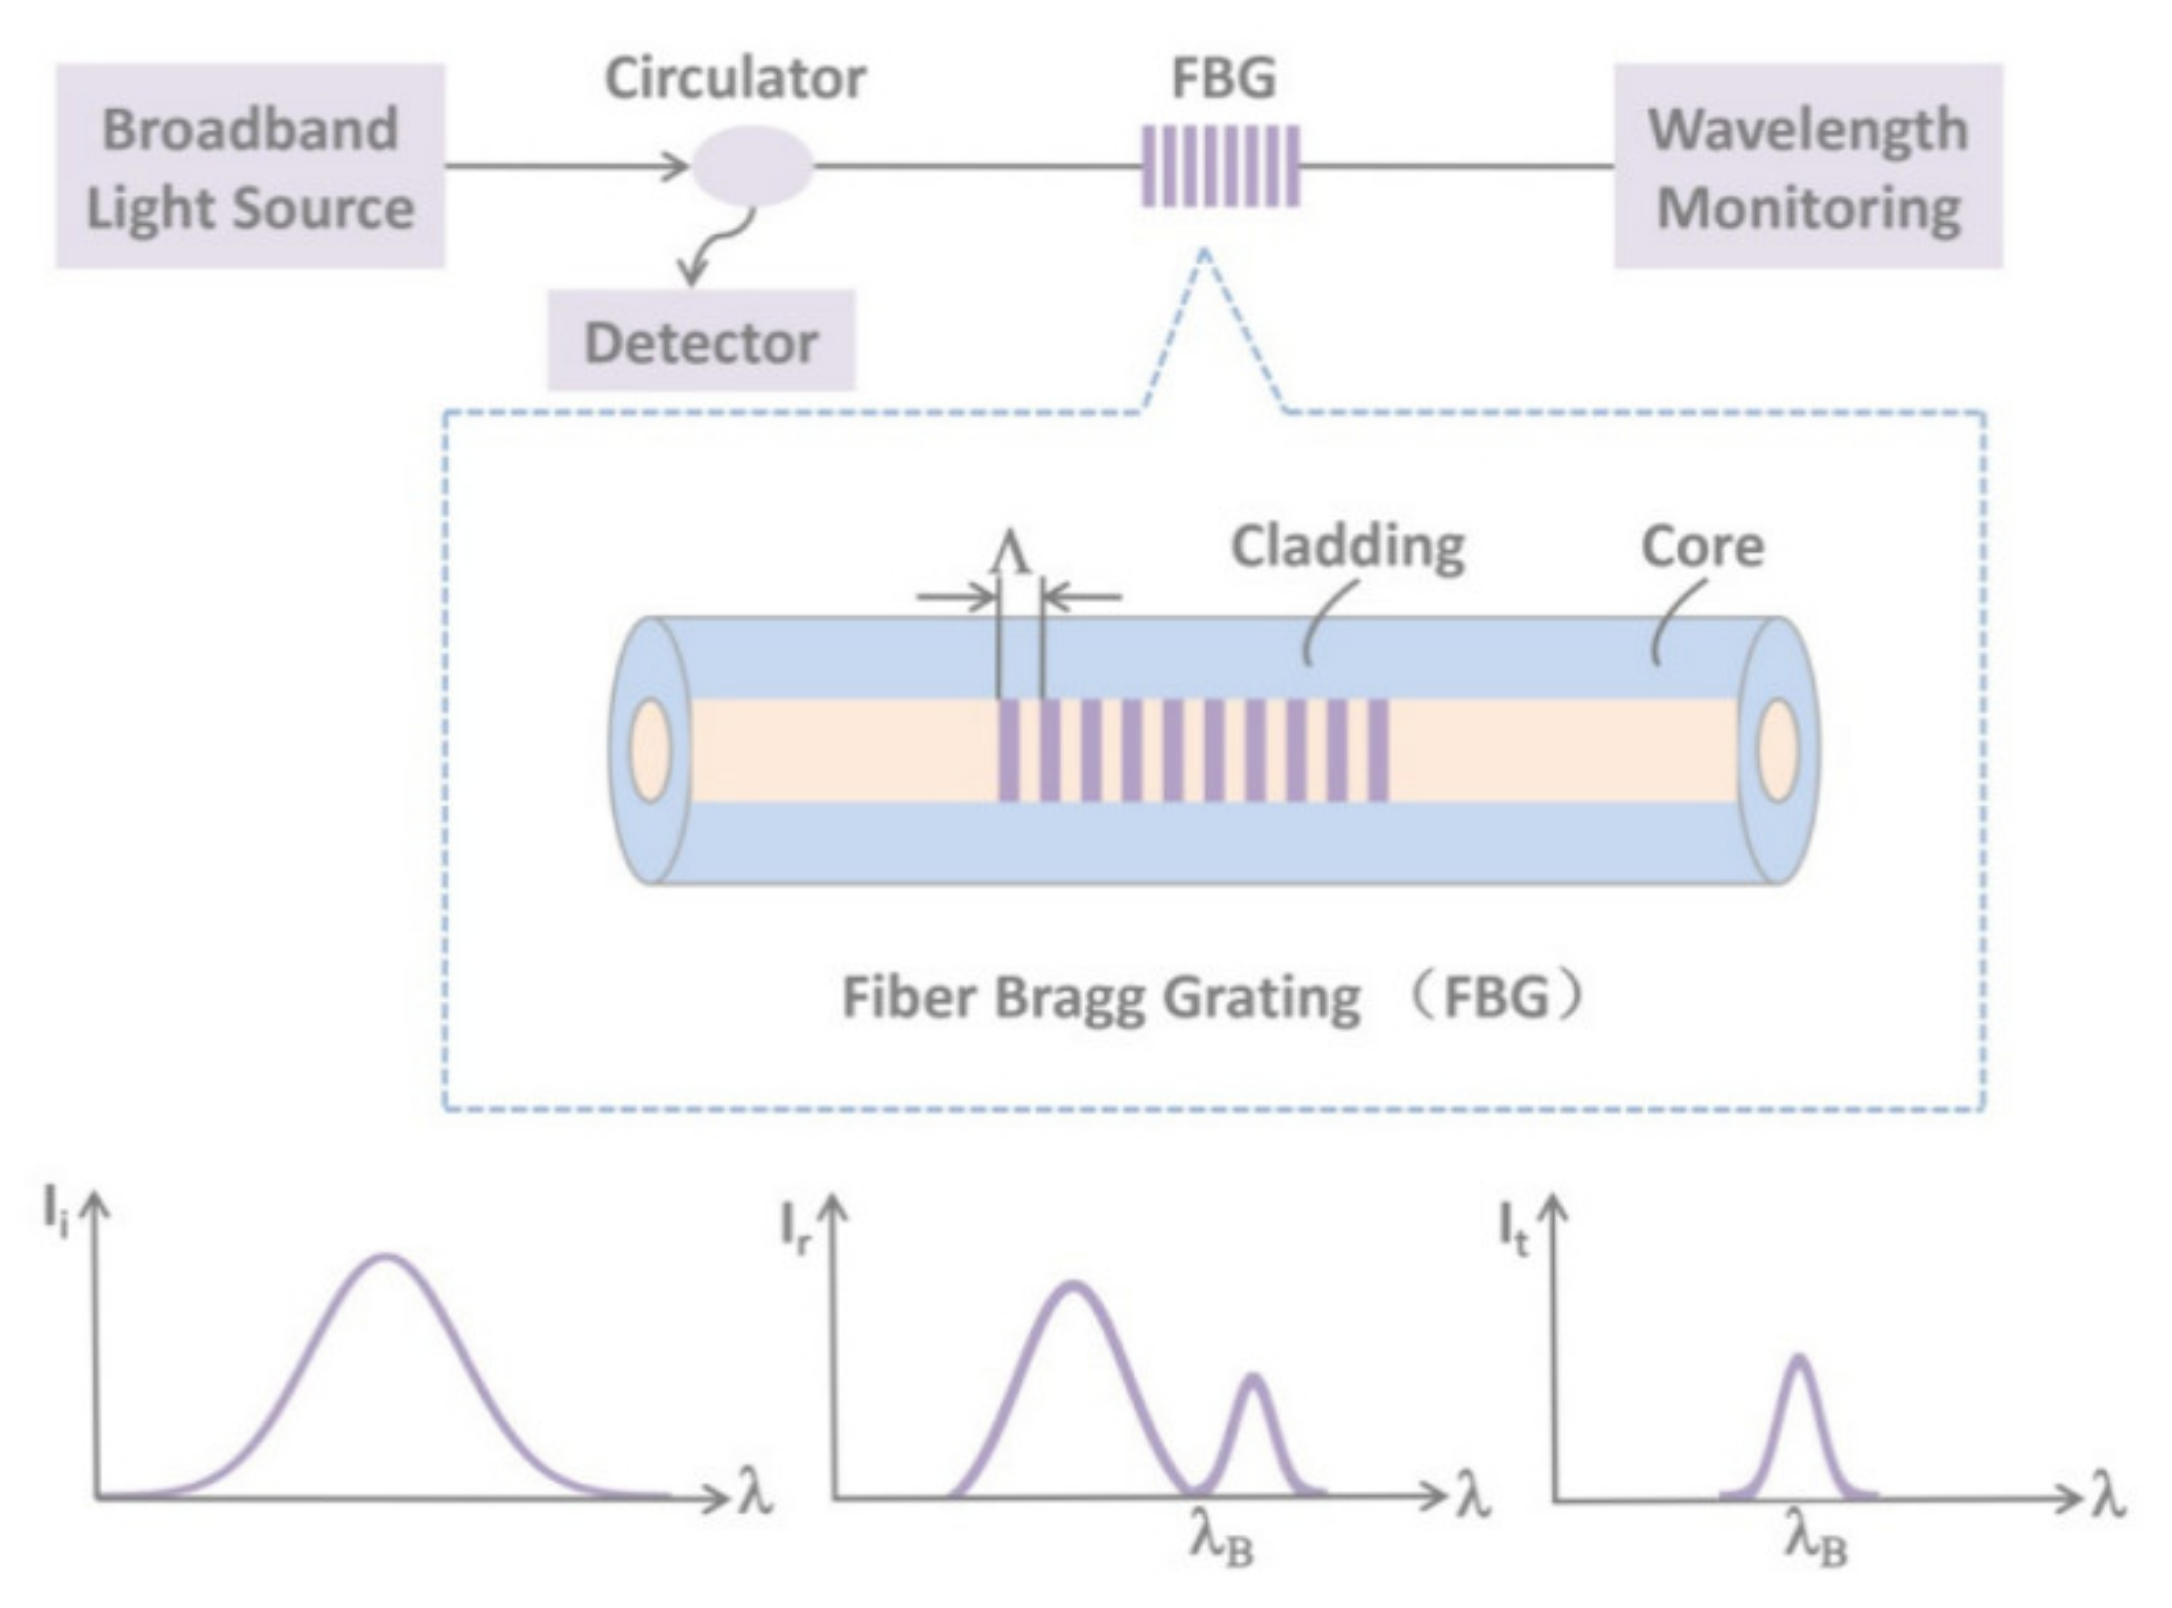
FBG sensors (Figure 6) can measure strain, deflection, temperature, damage, the dynamic behavior of structures, etc. An FBG is a periodic refractive index variation, which is formed in the core of an optical fiber by exposure to an intense UV interference pattern [36]. The FBG sensor comprises a distributed Bragg reflector, which has a higher refractive index than the rest of the glass core. There is also a sensing interrogator that transmits light to the reflector [33]. The distance between each Bragg reflector is constant, and for this reason, only one type of wavelength of light is reflected back to the interrogator. The interrogator receives the wavelength and transfers it to a digital signal. Strain, temperature, pressure or acoustic signals can change the distance between each Bragg reflector. When this distance changes, the reflected wavelength of light (Bragg wavelength) also changes. Thus, the optical sensing interrogator indicates the change of wavelength (wavelength shift) and converts it to digital data and computer analyses and records the sensing information.
There are expressions that relate the change of wavelength to strain, temperature, pressure or acoustic signals. For example, the relationship between wavelength shift, δλB, and strain, ε, for a homogeneous and isotropic material is the following [36]:
where λB is the Bragg wavelength and pe is given by the following expression:
where pij are he fiber Pockel’s coefficients and µ is the Poisson ratio. The Bragg wavelength λB is given by the following equation:
where neff is the modal index and Λ is the grating period.
FBG sensors have been extensively used in sensor technology and SHM. Bursi et al. [38] have used FBG sensors to measure the inelastic cyclic response of reinforced concrete sections of tunnel linings located in seismic prone areas. A full-scale specimen that represented the lining sections of a tunnel specimen and five substructure specimens were tested. Different sets of FBG packaging were used, including bonded and un-bonded sensors in concrete and embedded and external sensors to monitor the inelastic strains of the specimens. They concluded that un-bonded external FBG packaging is suitable for SHM of civil infrastructures exhibiting an inelastic response. The seismic damage response of reinforced concrete structures has also been monitored using FBG sensing technology [39]. Shake table tests were performed to simulate the seismic response of a three-story reinforced concrete building. The FBG sensors were embedded in the structure and were utilized to measure dynamic strain response. This research concluded that FBG sensors are very accurate and capable of detecting the initiation of a crack and the damages that occurred in the beams [39]. Moreover, long-gauge FBG sensors were applied to measure the deflection of tied-arch steel bridges by Zhang et al. [40]. A new method was proposed based on long-strain measurements to determine the deflection of tied-arch bridges under both static and dynamic loading. The accuracy of the proposed method was verified through the experimental results of a real model of a tied-arch bridge. Fan et al. [41] investigated the application of FBG sensors in monitoring strains in concrete dams subjected to earthquakes. A novel friction type FBG sensor was used to measure strains during shaking table tests of small gravity dam models. The FBG strain sensors were embedded in the dam models and the packaging method used in this paper can prevent damage of FBG sensor during the pouring process of concrete. The proposed sensor is suitable to monitor the dynamic strain, determine the dynamic characteristics of the dam model, describe the crack position, and monitor the cracking progress during the seismic events simulated by the shaking table. The application of FBG sensors embedded in polymer composite materials was investigated by Matveenko et al. [42]. A series of experiments were performed to measure strain under different conditions, i.e., pronounced gradient nature of strain distribution, compression and tension, a cyclic variation of strains with time and different temperatures. The results of the experiments have shown that FBG sensors are very effective in measuring strains in polymer composite materials. Temperature measurements with FBG sensing technology were performed by Xiao et al. [33]. A steel-concrete composite bridge located in Alaska was monitored with the aid of 11 fiber optic temperature sensors that are based on the FBG technique. Real-time temperature data were obtained and combined with other static and dynamic measurement data. These data were recorded on a computer were used to establish the relationship between the bridge response and thermal loading. Finally, FBG sensors have been implemented in monitoring damage in buildings due to vibration from rock blasting by Norén-Cosgriff et al. [43]. Two buildings were constructed and instrumented with FBG strain sensors to measure their damage when subjected to blast loading. The results showed that the sensing technique was accurate and that today’s vibration guideline limit values include a large safety margin for buildings.
5.2. Distributed Optical Fiber Sensors
Distributed Optical Fiber Sensors (DOFSs) provide the same benefits as FOSs, but additionally, they can monitor variations of one-dimensional structural physical fields along with the entire optical fiber in a truly distributed way. A single connection cable is necessary by DOFSs to communicate the data to the reading, compared to the large number of cables required by discrete sensors. This feature enables DOFSs to be very cost-effective and increases their potential use in SHM of large civil engineering infrastructure [32]. When this technique is used, fibers are mounted to the surface or embedded inside the material [44], and strain and temperature can be measured. When the variation of these monitored parameters is transmitted to the FOS, the signal in the fiber is modulated by these physical parameters. By measuring the variation of this modulated signal, distributed fiber sensing is achieved. The methods that have been employed can be subdivided in two main categories: optical time domain reflectometry (OTDR) and optical frequency domain reflectometry (OFDR) [32]. When the above techniques are applied, different types of scattering processes may occur in DOFSs, i.e., Rayleigh, Raman, and Brillouin scattering [45].
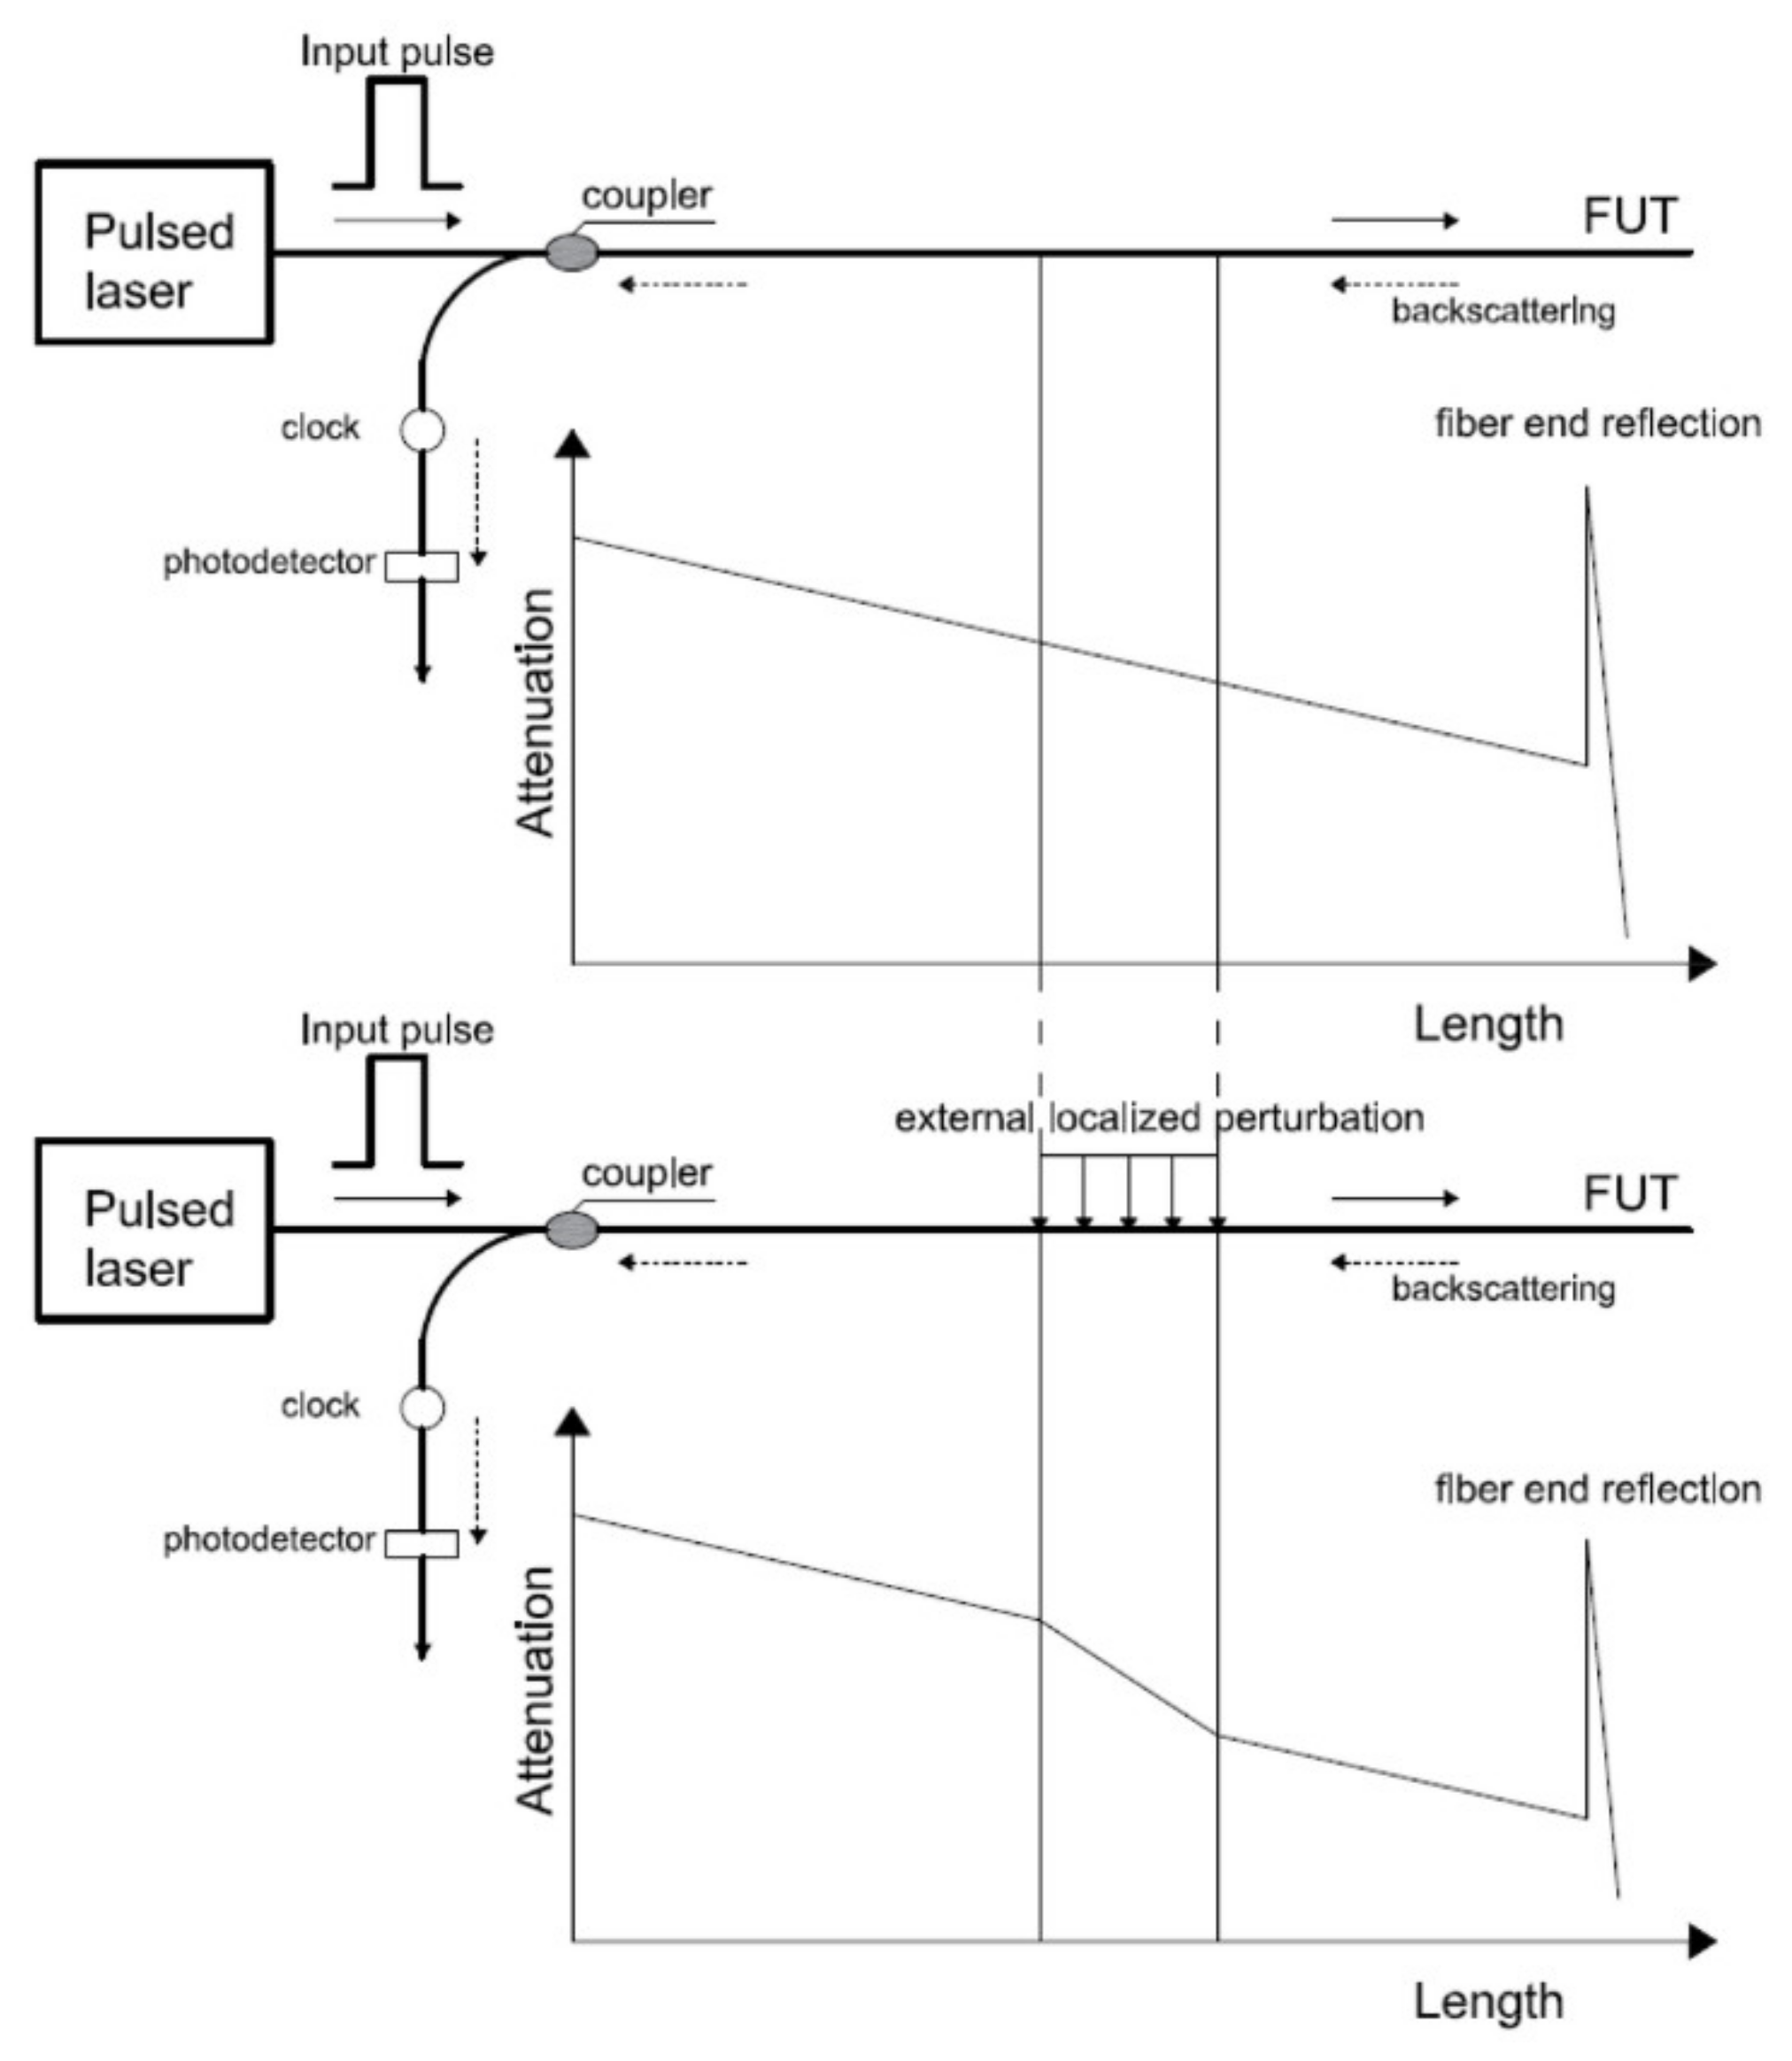
When OTDR is used, a short optical pulse is launched into the optic fiber, and the amount of light, which is backscattered, is processed by a photodetector. During this process, Rayleigh scattering is produced due to the microscopic and random variations of the fiber core refractive index. The spatial variations occurring in the fiber scattering coefficient are detected by measuring the intensity of the Rayleigh backscattered signal. These spatial variations in the fiber scattering coefficient are called attenuation [46]. The attenuation decays exponentially with time when the fiber is not subjected to any external perturbation, such as strain, temperature, etc. On the contrary, when the fiber is affected by external conditions and is subjected to an external perturbation, a sudden variation is exhibited in the attenuation, which is located at the point of the perturbation (Figure 7 [32]). This variation of the attenuation is utilized to provide information about the fiber properties and the external environmental factors that affect the fiber. In addition, different types of scattering have been employed to OTDR, such as Raman and Brillouin scattering. The spatial resolution of an OTDR, ΔZmin, is given by the following equation:
where c is the velocity of light, n is the refractive index of the optic fiber, and τ is the pulse width.
In contrary to the OTDR method that measures the intensity of the Rayleigh backscattered signal, the OFDR method is used for reading the interference fringes of the Rayleigh scattered light in the frequency domain. Thus, the spectral response of the fiber is provided by the OFDR, which indicates the variation of the external conditions that affect the fiber, i.e., strain, temperature variations, etc. In the case of the OTDR method, the spatial resolution, ΔZ, is given by the following expression:
where ΔF is the tunable laser source.
There are several recent applications of the DOFS method in SHM in Civil Engineering. DOFSs were used by Sierra-Pérez et al. [47] to evaluate damage in a 13.5 m composite wind turbine blade, which was tested under static loading. Different sensing technologies were used to measure strain: FBGs, DOFSs using an Optical Backscatter Reflectometer (OBR) and strain gauges. Comparison of the methods showed that the FOSs effectively measured strain and correspondent cracks induced during the test. A novel method, based on distributed fiber optical Brillouin technique was employed by Zhao et al. [48] to monitor corrosion expansion of steel reinforcement in reinforced concrete structures. The proposed method was tested by embedding DOFSs in reinforced concrete specimens to measure the expansion strain due to the corrosion of the reinforcement. The experimental results have shown that the proposed method, based on DOFSs can accurately evaluate reinforcement corrosion in RC structures. Acikgoz et al. [49] used DOFSs based on Brillouin optical domain reflectometry to monitor strain and location and width of resulting crack openings of a historic masonry vault due to the pile construction of the London Bridge Station Redevelopment. The results of this research indicated that DOFSs could accurately estimate the location and width of new radial cracks that formed during piling. Song et al. [50] monitored the response of a reinforced concrete pound lock structure during the construction process. The variations of temperature and stress/strain were measured using OTDR sensors based on Raman and Brillouin scattering. The results showed that the integrated distributed optical fiber sensing technology is a powerful tool to monitor the construction quality of a pound lock structure. DOFSs have also been used to measure strain fibre-reinforced polymer (FRP) strengthened reinforced concrete shear walls tested under cyclic loading by Woods et al. [51]. The DOFSs were utilised instead of strain gauges and could capture strain at any location along the length of a fiber, without knowing the specific measurement locations before the test. The DOFSs provided accurate estimations of the strain distribution and were not damaged during large reversals of the cyclic loading. Van Der Kooi and Hoult [52] used DOFSs to monitor strain in the members of the steel model truss. The truss model was tested under both static and dynamic conditions, and the results indicated that DOFSs could detect localized strain variations due to damage. Wang et al. [53] used the Brillouin OFDR to monitor the tunnel lining segment joint of the Suzhou Metro Line 1 tunnel. The results demonstrated the accuracy of the distributed fiber sensing method. Finally, Lim et al. [54] installed DOFSs to measure the deformation of the cross-section of a non-circular PVC pipe due to the dead weight of its carrying water. The deformation was displayed as oscillations in strain measurements made by the DOFSs.
5.3. Interferometric FOS
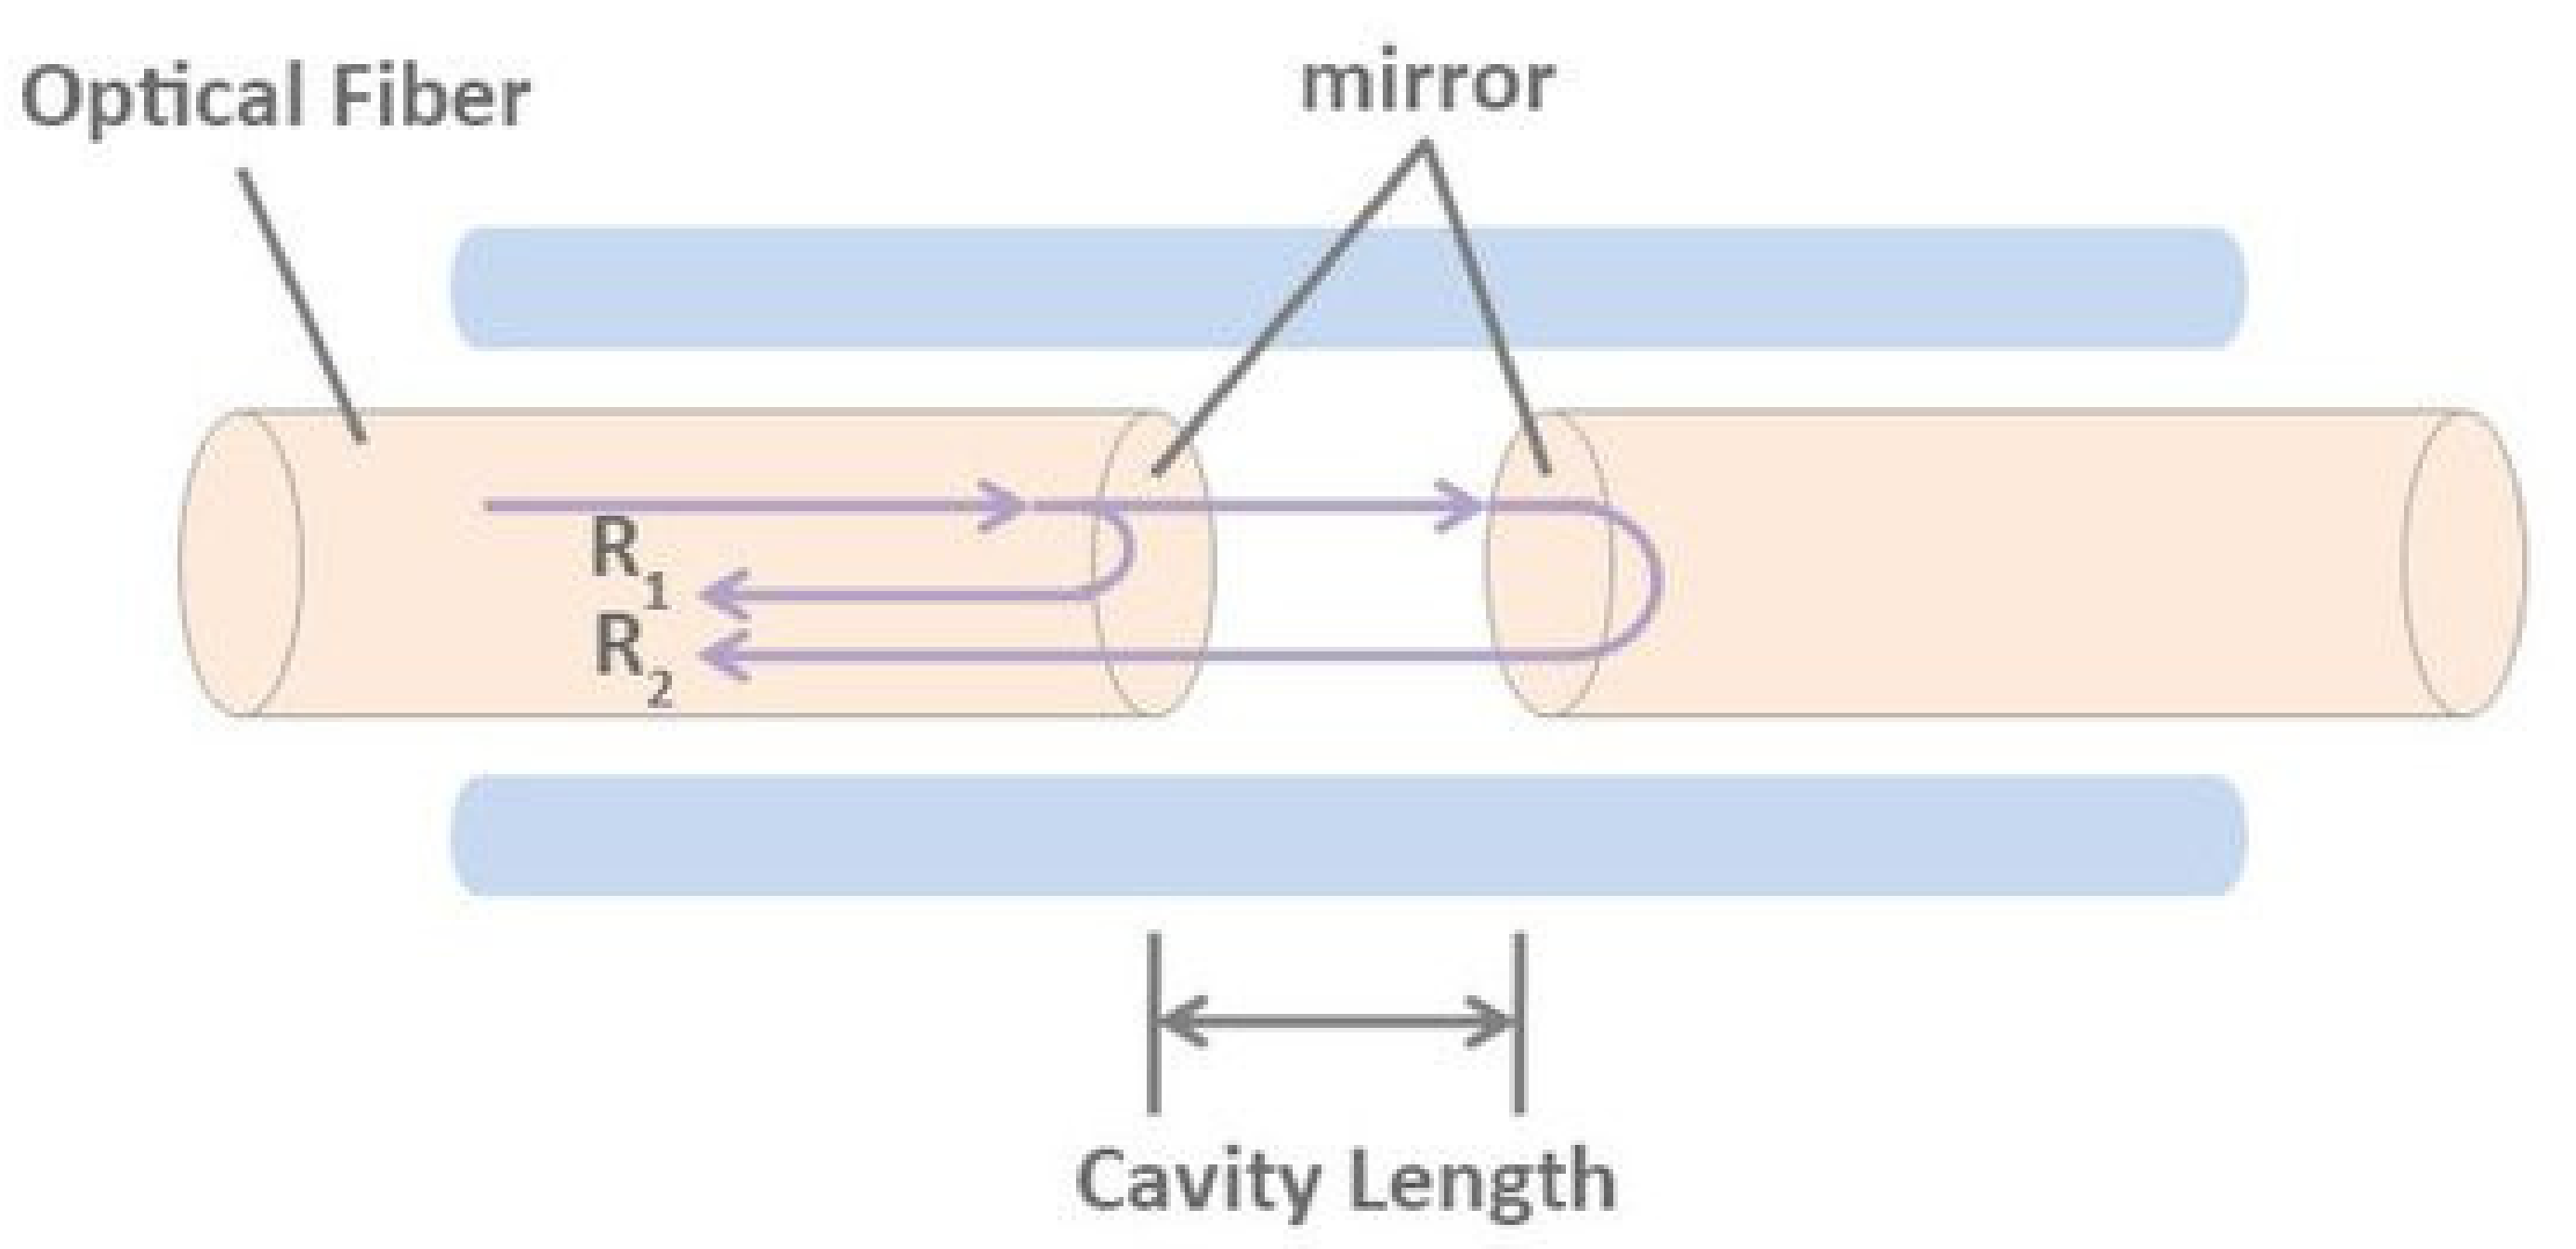
When the light is emitted by a light source, it is divided through a prism into two beams with the same frequency, polarization direction, and initial phase. One beam is a signal light, and the other one is a reference light. When the two beams meet, interference occurs. The interferometric sensors use the interference image to infer the effect of external factors, such as strain, on the signal light. An interferometric FOS can be divided into four main categories: Michelson FOS, Mach-Zehnder FOS, Sagnac FOS, and Fabry-Perot (FP) FOS. Figure 8 shows the Fabry-Perot FOS [37].
The principle of operation of interferometric sensors is based on the monitoring of the phase-shift of the propagated light in fiber optic under an applied strain relative to an unstrained reference fiber [3]. This light phase-shift is measured with the aid of an interferometric setup. The advantage of this method is high precision and immunity to fluctuation. In addition, the single-mode fibers used in this method are smaller in diameters compared to their multi-mode counterparts and can be embedded in a material, such as composite laminates, without resulting in discontinuity of the material. On the contrary, the installation of these single-mode fibers should be done very carefully in the field environment. The single-mode fibers should be successfully cleaved and coupled together to ensure minimal coupling losses [3].
This type of sensors has also been used in Civil Engineering applications. Zou et al. [55] used a fiber FP interferometer sensor to investigate the effects of the concrete hydration process. Two experiments were conducted: a calibration experiment and a concrete hydration experiment. Based on the results of the first experiment, the sensor showed a linear response (a direct relationship). The results of the second experiment showed that the sensor is suitable for reliable and stable monitoring of the concrete hydration heat. Liu et al. [56] developed a partially multiplexed FP interferometric fiber sensor for in situ strain measurement of composite structures. The proposed sensor is compact, robust, low-cost and offers long-term stability with reasonable accuracy. Finally, Leng et al. [57] used FP interferometric and FBG sensors to monitor the curing process of carbon FRP composite laminates. The results showed that both embedded FP interferometric and FBG sensors could be used to monitor the curing progress of composite materials and detect the occurred damages during the fabrication process of composite structures.
6. Camera-Based Technique
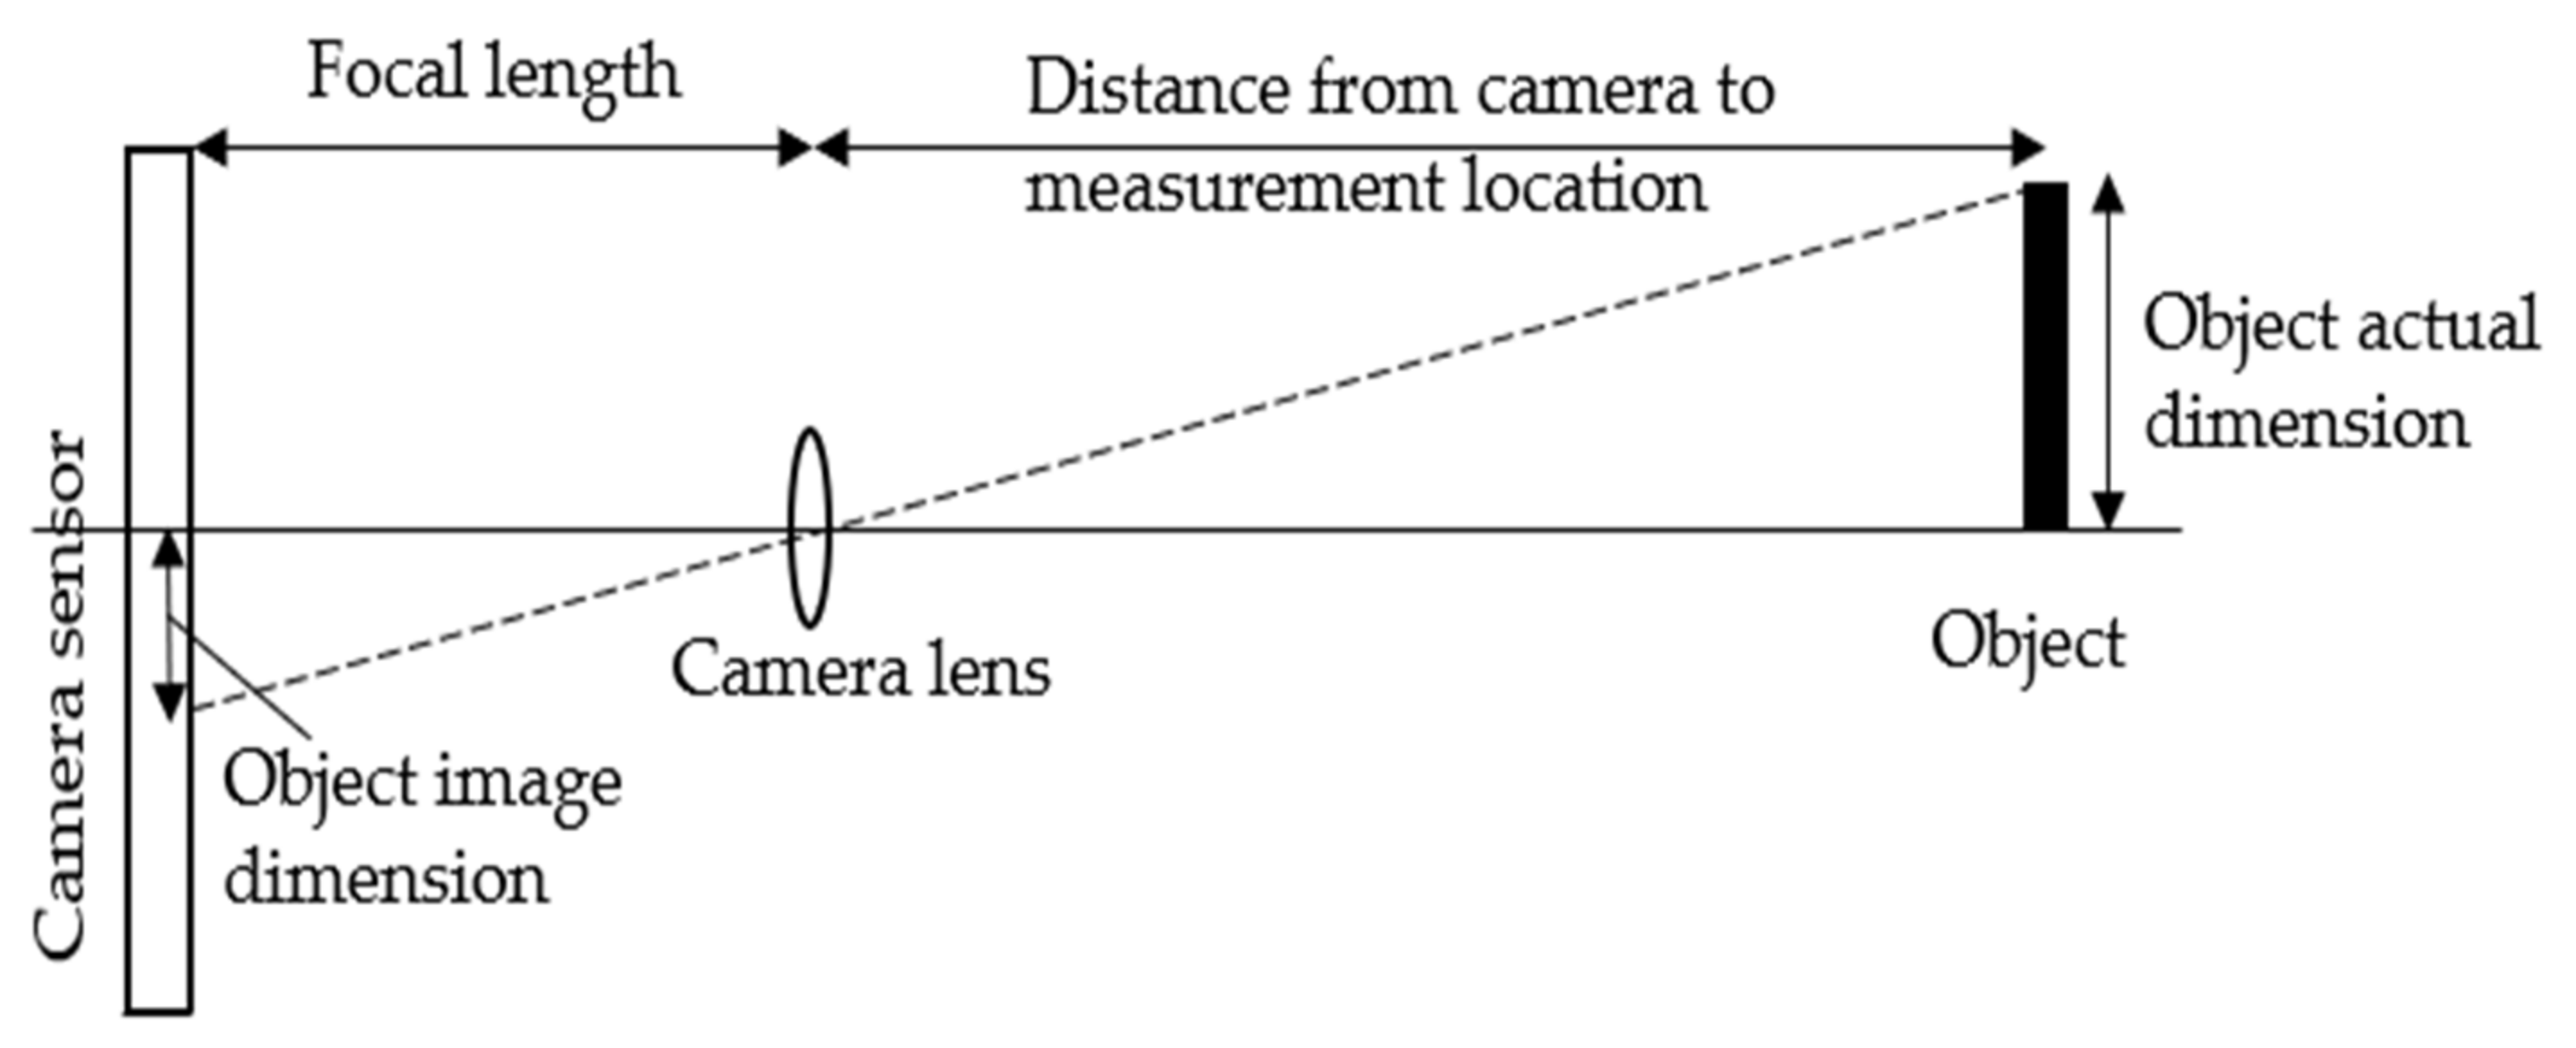
In recent years, the use of computer vision techniques increased in the civil engineering sector for structural health monitoring [14]. The primary use of this method is to monitor the displacement of structures in different environments. The system uses either one or more cameras, a zoom lens, and a computer to capture the collected data. The use of real-time processing software enables to measure displacement time histories and display results on the computer screen in real-time and automatically save data to the computer. Alternatively, the images can be captured, and data analysis can be performed at a later date [1].
Khuc and Catbas [58] suggested a completely contactless SHM technique of real-life structures using cameras and computer vision. Their method was based on the fundamental camera principle shown in Figure 9. By knowing the distance between predefined points on the targeted structure in both the image and the world coordinate, a conversion ratio between pixels and engineering units was determined.
A vision-based system for real-time displacement measurement of high-rise buildings was investigated by Shen et al. [59] and Lee and Kim [60] using a multiple vision-based displacement measurement. The rust defect-recognition method based on color and texture feature, which combines the Fourier transform and color image processing, was proposed by Shen et al. [59] for steel structures assessment. Automatic process and analysis of large volumes of images from different angles were studied as a vision-based technique for crack identification by Yeum and Dyke [61]. FFT algorithm combined with digital image correlation (DIC) data was recommended by Huňady et al. [62] in order to experimentally determine the damping ratio value in steel structures. Target-tracking DIC was used in Ngeljaratan and Moustafa [63], who presented a large-scale laboratory application where DIC was utilized to monitor the response of a bridge structure and identify various modal properties, such as natural frequency, damping ratio, and mode shapes. Park et al. [64] proposed a novel vision-based displacement measurement by successive estimation of relative displacements and rotational angles throughout a large flexible structure. The technique was validated experimentally using two webcams installed on a flexible steel column structure. Trebuňa and Hagara [65] proposed a high-speed correlation system using Dantec Dynamics cameras to estimate the modal parameters of steel plates. They suggested an automated tool to conduct image processing directly from data format files. In order to overcome the limitations related to high-speed and high-resolution cameras, Yoon et al. [66] used consumer-grade cameras and combined them with three algorithms for structural system identification. Capturing images using the consumer-grade camera and combining them with a deep learning algorithm was examined by Xu et al. [67] for crack detection in steel structures. The use of subpixel virtual visual sensors to obtain the modal shapes of structures and detect structural damage were experimentally studied by Song et al. [68].
7. Laser Scanners Technique
Laser Scanners are part of the remote sensing technologies that have been widely explored in civil engineering applications, namely for detailed documentation and inspection of large structures in recent years. The preference of laser scanners over traditional routine procedures is the ability of laser scanners to collect a huge amount of accurate data, which includes the geometry as well as different radiometric attributes [69].
Laser scanners can be considered as LiDAR (Light Detection and Ranging) or LaDAR (Laser Detection and Ranging) systems [70,71,72]. The principle of a laser system is the use of focused pulses of coherent light, where the system calculates the time of flight of the light (converted to distance) while it is transmitted and returned back from the measured object, see Figure 10. The generated scan offers a three-dimensional map of the collected points commonly called a “point cloud”. The detailed 3D map (in millimeter accuracy) of the measured object can be generated by formed polygons, which are created via connecting the point clouds.
One of the limitations of this system is only able to measure and generate a 3D map of visible surfaces of scanned objects, so its prime application is to measure deformations of visible objects such as girders of a bridge, i.e., the laser system is not able to detect any internal damages. Inadequate lighting and the low reflectivity of the scanned object can compromise the quality of the image and a slower scan rate may be required to improve the quality of the image [23].
Since the laser was applied in interferometry as an alternative for the traditional discharge lamps more than 50 years ago, a new type of measurement became possible [73]; this section focusses on recent applications of laser in monitoring the health structures, as discussed below.
Laser reflection is being used for defects detection in reinforced concrete systems. Qiu and Lau [74] the experimental results demonstrated that laser reflection techniques instantly and economically detect the occurrence of defects, but cannot measure the sizes of the defects. Xu et al. [75] found, through simulations and experiments, the laser methods are active in the inspections of the concrete systems compared to halogen lamps. Xu et al. [75] showed that the laser methods offer a wider inspection ranges (more than five meters), high sensitivity for damages, low power consumption (15 Watts laser excitation), and reduces wrong alarms because of external noise.
The occurrence of cracks is also detectable by the laser scanners depending on the difference between the temperatures of the cracked and the solid areas. Scalbi et al. [76] used a Laser Spot Thermography (LST) for detecting cracks in the surfaces of concrete slabs, the results showed that laser scanners not only detect the location of the surface cracks, but the thermal gaps across the depth of the cracks distinguish between shallow and deep cracks.
The sensitivity of the laser beams for the variation in the thermal gaps in the concrete systems made it possible to use deep learning in the detection of cracks and fractures in the concrete systems. Park et al. [77] used deep learning technology and laser sensors for detecting and quantifying cracks on the surface of concrete systems. The YOLO algorithm was employed in deep learning to provide real-time detections and quantifying of the cracks.
The laser was not only used to scan the concrete systems for cracks, it was also used to detect other defects and properties of concrete. Grigoriadis [78] used laser methods to investigate the substrate roughness in patch repairs in concrete systems. Laboratory results showed that the laser methods are active in the characterization of the substrate roughness.
The laser scanners generate a huge amount of data (big data) that is challenging to store, process, and interpret for traditional data management systems. Although technology has proven to be beneficial for SHM, the limitations of technology prevent it from being more widely implemented in civil engineering. The great limitation of the method is the laser methods cannot detect the internal cracks and damages in concrete [75], and laser methods need manual processing of a large amount of data, which requires time and training. As laser beams may not be applied in parallel because of mistakes in installation, corrections for the laser alignment algorithm (in the deep learning approaches) is required to increase the accuracy of the cracks detecting [77].
On the other hand, these limitations were decreased. With the recent developments in AI/ML and high-performance and supercomputers, these limitations can potentially be addressed [69]. A combination of acoustic and laser techniques enables reliable measurements of internal defects.
8. Acoustic Emission Technique
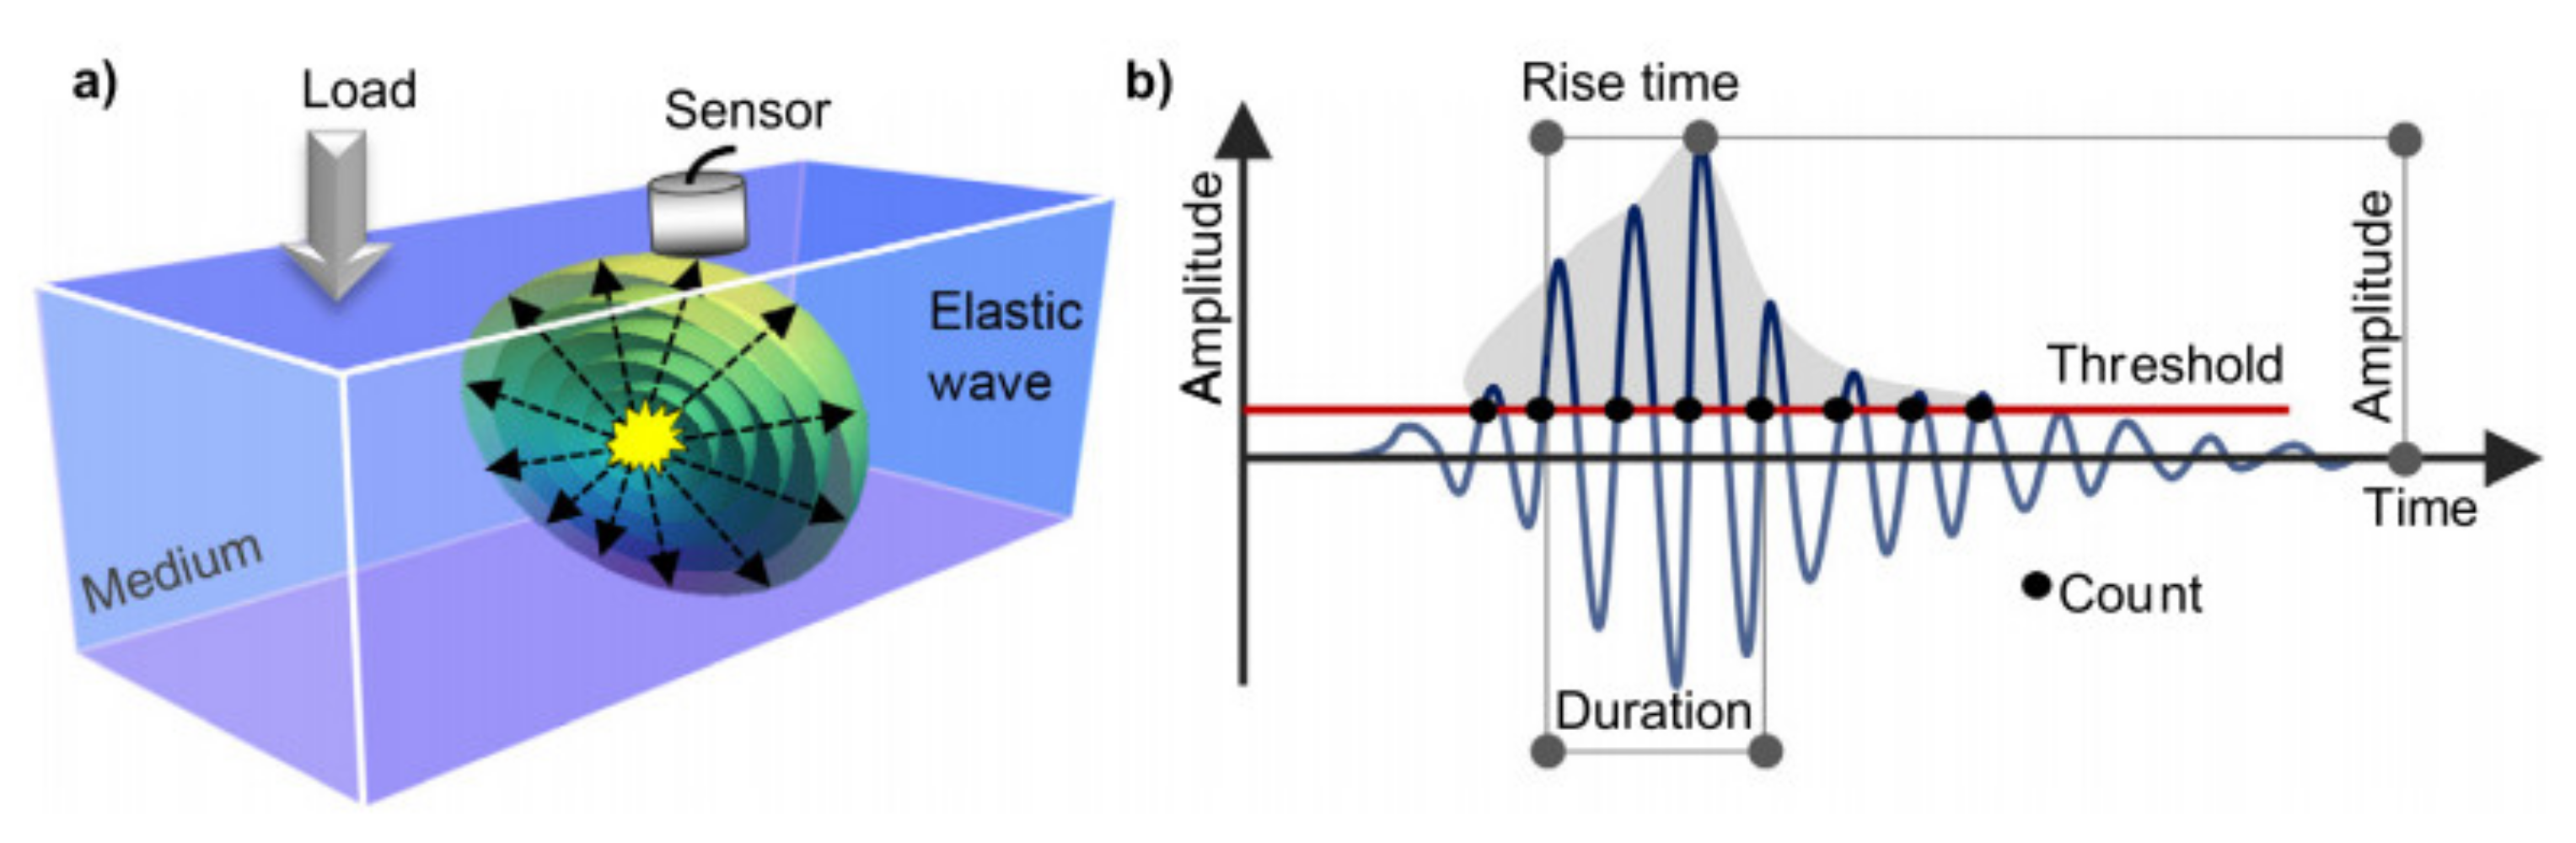
Acoustic non-destructive measurement technique uses transient elastic sound waves that are emitted as bursts of energy into a material under test. The Acoustic Emission (AE) monitoring process requires a material deformation, which is used as the source, and transducers to capture the stress waves that are generated by the source. Sensors located at the surface of the material (Figure 11a) are used to detect these waves. AE sensors are the heart of the AE system as they transform waves into electrical signals. In the case of non-integral sensors, the signal is amplified before transmitted to the AE instrument, whereas for integral sensors with an embedded amplifier, the wave is directly transferred to the AE instrument. The signal waveform is affected by the path from source to the sensor, the sensor characteristics and the system measurement. The signal is then transferred to the AE data acquisition system. The main AE features are shown in Figure 11b and include: amplitude, energy, duration, hit, rise time (=delay between the onset and highest peak of waveform) and count. Subsequent data analysis can include signal strength versus location, amplitude versus location, intensity analysis and average frequency (=number of counts/duration) versus RA (=rise time/peak amplitude) and can be performed via different algorithms. The technique is very sensitive and, therefore, able to real-time monitor microscopic events inside an object by separating background noise from AE. The generated elastic waves by the release of energy within a material can be utilized to detect/locate flaws as well as to evaluate their growth rate as a function of the applied stress. The method is characterized as burst/distinct pulses and continuous emissions for crack propagation and determination of fatigue crack activities in structures. Accumulation of AE hits can be used in order to measure crack initiation and growth and classify damage severity in structures. One of the AE advantages is that damage sources can also be localised by using multiple sensors.
The use of acoustic techniques for structural health monitoring dates back to the 70s [80]; this section focusses on recent advancements in concrete, steel, composite, masonry, timber and additively manufactured structures, as discussed below.
8.1. Concrete Structures
Crack monitoring is crucial for the safety and maintenance of concrete structures and AE is attractive as an NDT technique as it can detect and locate in real-time damage in concrete structures. The application of AE in reinforced concrete (RC) structures in order to assess damage due to fatigue loading were presented by Noorsuhada [81], concluding that the AE analyses (such as AE parameter, intensity analysis etc.) are limited, whereas the application of AE in structures with increasing fatigue magnitude needs further consideration. In order to overcome dispersion and attenuation issues of elastic wave based signals that can be a crucial problem in heterogenous materials, Tayfur and Alver [79] suggested a 3d parameter correction technique. Their proposal was assessed on the basis of mechanical observations from experimental testing of concrete beams. Artificial sources of 50 kHz frequency were generated on each of the 48 attached nodes by a signal generator and recorded by eight AE sensors attached to the beam. The relationship between the generated and recorded amplitude data were used for the proposal of correction AE parameters.
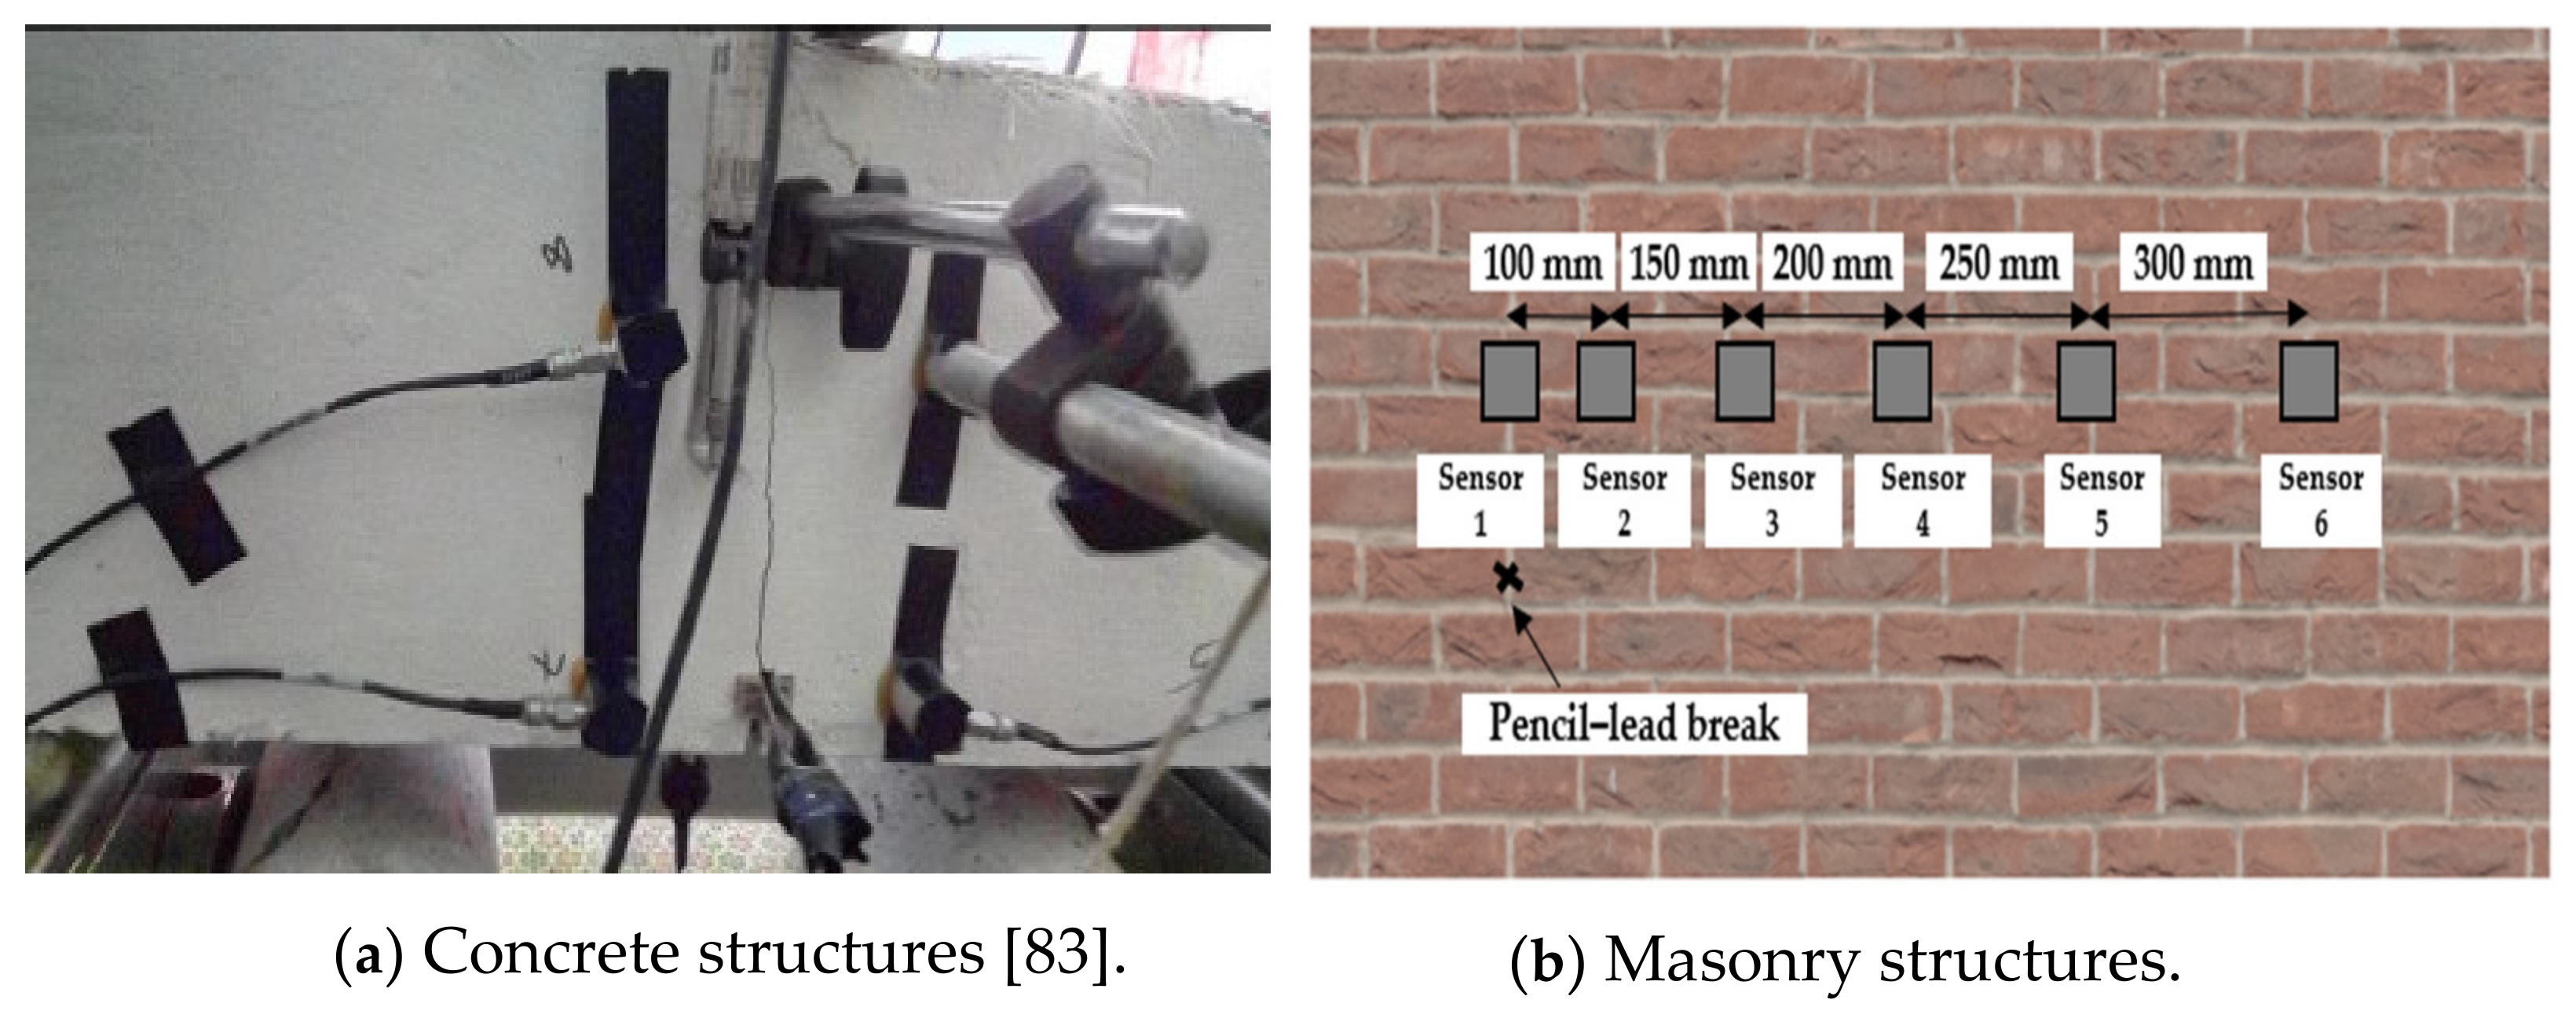
In addition to RC concrete structures, the efficiency of AE for different types of concrete structures has been evaluated. Rasheed et al. [82] used AE in order to study the crack development in lightweight cellular concrete and to assess the effect of fibre reinforcement on the fracture behaviour of these structures (see Figure 12a). Two types of sensors covering a wide range of frequency were attached at predefined locations of beam specimens, and the signal measurements were recorded. On the basis of tests results, the AE hits accumulation was correlated with the crack initiation and propagation characteristics. Appropriate AE sensor types are important in the fracture monitoring of concrete structures, and since concrete is a highly attenuating material, lower frequency sensors are most suitable. Xu et al. [83] applied two AE sensors together with multichannel monitoring and operating in order to study cracking in crumb rubber concrete, showing that AE can allow for a good understanding of micro-cracking and fracture monitoring. Prefabricated structural elements were assessed by [84] and AE features provided information for concrete cracking, bar debonding and bar plastic deformation. Laboratory-based bending tests of grouted connections for offshore wind turbines were carried out by Tziavos et al. [85]. Four AE resonant transducers were installed at the bottom and top of the connections for real-time monitoring through a data acquisition system. The signals were amplified using pre-amplifiers, and dB thresholds were set to eliminate background interference. The released AE energy and counts were correlated with load-deflection data in order to identify damage evolution and grout cracking; further to cracking, corrosion of RC structures is one of the major issues of structural failure that early detection could help limit the location and extent of repair and all associated costs. Zaki et al. [24] proposed AE as an efficient technique in order to detect corrosion in real-time.
Raw data obtained from structural monitoring system is nearly useless without reinterpretation, and hence neural network and machine learning techniques can be applied for better understanding. A correlation between AE parameters and the structural performance and design strength requirement through a deep neural network was proposed by Ma and Du [86]. The method was implemented on two bridges, demonstrating its potential for real-world applications. AE technique was used in order to characterise the source of the mechanism of events with different energy dissipation levels. This classification was based on experimental findings during the fracture of fibre reinforced concrete and was carried out via neural network analysis [87]. On the basis of AE signal measurements, a probabilistic crack classification for cementitious materials was proposed by Das et al. [88]. Implementing machine learning, a framework was designed and compared to a theoretical approach, yielding a good qualitative prediction of the crack pattern. Recent research work has also combined AE (“the ear”) with Digital Image Correlation (DIC) (“the eye”) technique in order to characterise the mechanical performance. Omondi et al. [89] studied prestressed concrete sleepers at the standard laboratory level, and it was suggested that this combination could enhance understanding of concrete damage in practical applications. The combination of AE and DIC has also been examined by Alam et al. [90] and the obtained damage mechanisms results were compared with Eurocode expressions. Further to damage assessment, evaluation of the stress state of a concrete structure via AE has also been examined by Liu and Ma [91]. Correlating the results of DIC from structural testing along with AE measurements, they proposed an AE Intensity Distribution that allows stress estimation.
Finally, conventional AE sensors are mounted on surfaces of structures. Li et al. [92] investigated the efficiency of smart aggregates as AE sensors embedded in a concrete beam. Smart aggregates in this study were piezoceramic transducers, and their performance in monitoring structural damage was compared with conventional AE sensors, showing that there is potential in this direction.
8.2. Steel Structures
Adamczak-Bugno et al. [93] presented the application of AE signals for in situ monitoring of the technical condition of steel structures and particularly assessed destruction processes during construction work on the steel support structure of a cable car. Fatigue crack growth was investigated by Krampikowska et al. [94], who tested 40CrMo steel beam specimens with a single edge notch. The work-related selected parameters of AE signals with the crack growth and fracture mechanics and concluded that there is a need for a better characterization of AE parameters, for the integration of new analysis methods and for developing an approach to link localized damage evolution with the global structural integrity. Improved characterisation of plastic deformation and crack growth was attempted by Stankevych and Skalsky [95], who processed the AE signals by wavelet technique and provided a correlation between AE measurements and fracture modes. To ensure good data quality, the data acquisition system was initially calibrated with a pencil lead break procedure. Moreover, the surface of the sensor was covered with silicon grease to provide efficient acoustic coupling between the material and the sensor, and an indicating channel was applied to avoid the effects of acoustic disturbance.
8.3. Composite Structures
Research on carbon fibre composites by Barile et al. [96] examined the effect of material properties (ply number, fibre orientation, material thickness) on the propagation of the acoustic waves. These variations were characterised as changes in amplitude and waveform through AE descriptors, waveform and wavelet analysis. Crivelli et al. [97] tested a carbon fibre panel with an artificial crack to fatigue loading and processed the AE signals using neural network technique, thus allowing a good understanding of the structural mechanism. Masmoudi et al. [98] examined the effect of the acoustic signal by either embedding sensors on fibre composite structures or mounting them on the surface. It was demonstrated that embedded sensors have good potential for SHM of composite structures.
8.4. Masonry Structures
Despite the fact that SHM of masonry structures is an engineering challenge, Wu et al. [99] proposed an innovative procedure of using AE for assessing the damage. A uniaxial compression test was conducted, and two AE sensors were used on each side of the specimen close to the mortar joint; a thin layer of Vaseline was applied between the sensor and the wall to allow for sufficient acoustic coupling. Initial spectrum analysis was carried out, and an amplitude-frequency diagram through FFT transformation was developed in order to filter signal measurements and eliminate environmental interference. The AE parameters were assessed, and a linear between AE cumulative events and damage degree was suggested. The application of AE in masonry structures has also been investigated by Han et al. [100]. Pencil-lead breaks which are widely used as a reproducible source for test signals in AE applications have been used in the study of Han et al. [100]. Six sensors were installed at increasing intervals on a masonry model bridge to analyse wave velocity (see Figure 12b). On the basis of AE readings, the traditional procedure applied for crack source localisation in concrete has been modified for masonry structures, and a crack characterisation approach with good reliability was proposed.
8.5. Timber Structures
Multi-resonant sensors linearly distributed along a reinforced timber beam were tested by Rescalvo et al. [101] and Rescalvo et al. [102]. To eliminate the effect of the attenuation, the spectral energy is corrected by empirically derived attenuation curves. The experimental findings showed that AE is a promising technique in real-life retrofitted beams. A correlation between AE signal features and failure mechanisms for different wood species on the basis of bending tests was performed by Perrin et al. [103]. In this study, the AE activity was related to the degree of heterogeneity of the timber species.
8.6. Additive Manufactured Materials
In addition, to conventional structural materials, the possibility of using AE technique damage assessment has also been examined for additive manufacture (AM) metals [104]. This study evaluated whether phenomena like the Kaiser effect and waveform parameters would influence the results concluding that the damage condition of AM structure can be correctly estimated via AE and other NDT methods.
9. Ultrasonic Method
9.1. Introduction and Principle of the Application
The ultrasonic waves are defined as sound waves with a frequency in excess of 20 kHz that exceeds the human hearing limit [105,106,107]. The ultrasonic method can be used to detect defects that are embedded in sound conducting materials. Ultrasonic testing (UT) is recognised in many industries, such as composite material production [108], and electrical [109] and electronic components [110] manufacturing, as the most effective and efficient inspection method [111,112].
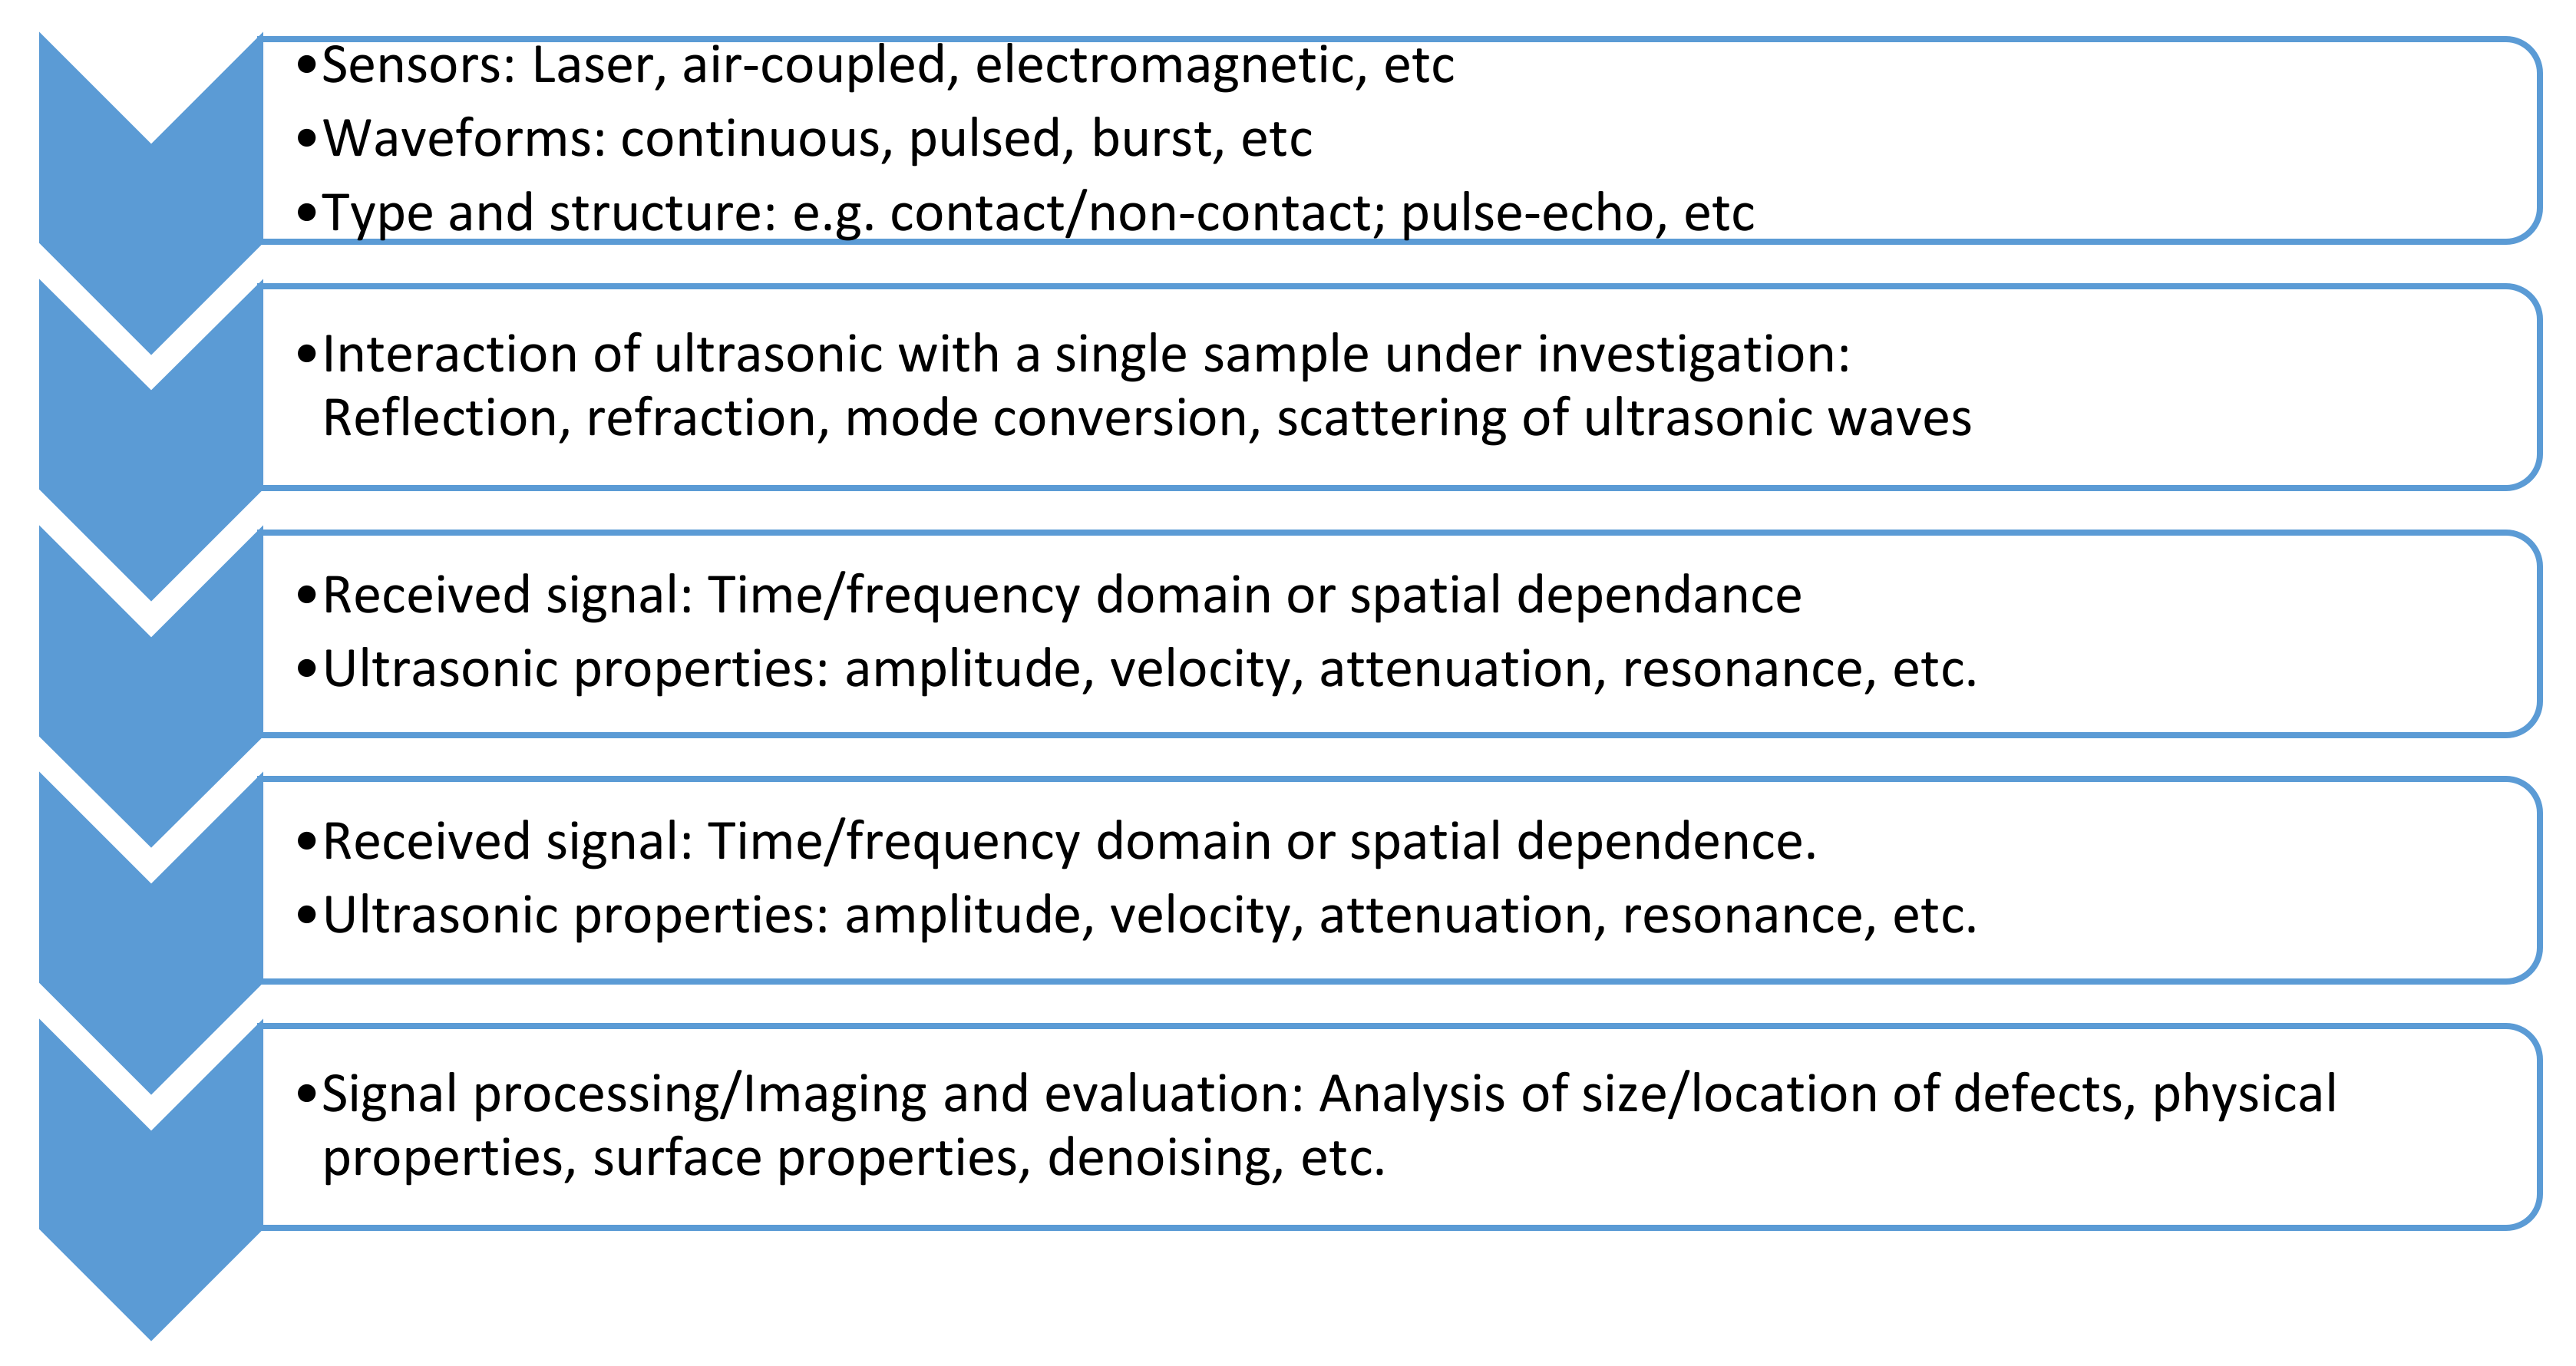
A principle of UT is that induced stress waves generated from an actuator are used to detect and analyze damage conditions, defects and variability of mechanical properties of elements (ASTM E1316-16, 2016). During testing, signal analysis is used to determine material properties such as modulus of elasticity because some wave characteristics differ from the properties and geometry of the medium of propagation [113]. Ultrasonic pulses are produced when an electric charge is applied to a piezoelectric crystal, causing it to vibrate for a while at frequencies depending on the thickness of the material or crystal. Figure 13 shows the basic description of the structure regarding the ultrasonic measurement system [114].
The ultrasonic technique uses various methods depending on how mechanical vibrations or waves are generated and detected within the specimens being tested [115]. Amongst the most used methods are the contact method, which uses piezoelectric transducers, and the non-contact method, which employs capacitive transducers [116]. In the case of the contact method, the transducers are made to contact and press onto the surface of the element with the aid of constant springs or weight. A couplant, such as gel or electromagnetic material, is employed to intensify sound transmission. The non-contact type is termed the air-coupled method (because it uses air as a couplant) have been applied in industries. In this method, the transducers do not make contact with the element or material surface for transmission and detection of stress waves. It has been demonstrated that the non-contact method is more efficient in the detection of structural defects than the corresponding contact ones [116]. A more advanced non-contact type that uses computerised scanning technology has also been developed and applied in industries [117]. In addition, there is a Phased Array ultrasonic technique (PAUT) where phased array ultrasonic probes are used [118].
The ultrasonic wave non-destructive method is based on the theory of acoustoelastic laws. The theory states that the elastic wave that is propagated through an element depends on the mechanical stresses as well as wave propagation, in addition to initial stress [119,120]. The following are some of the applications of the ultrasonic waves as non-destructive tool in civil engineering:
9.1.1. Quality of Concrete
Pedreros et al. [121] investigated the quality of concrete using UPV. They measured the velocities of acoustic waves travelling through the manufactured concrete samples and found a correlation between the UPV and the compressive strength of the concrete. An experiment has also been conducted to investigate the relationship between ultrasonic pulse velocity (UPV), porosity and compressive strength of lightweight foam concrete samples [122]. In contrast to the results by Pedreros et al. [121], it was mentioned that several factors such as composition, presence of cracks or defects of the concrete do not affect the compressive stiffness of the concrete to the same extent as they affect the magnitude of the UPV. Thus, the UPV results alone are not reliable for the prediction of the compressive stiffness of the concrete. Instead, the combination of several NDT methods should be employed for results that are more accurate [122]. Sokołowska and Zalegowski [123] used ultrasonic wave propagation waves to assess the quality of polymer-cement concrete with polyethene terephthalate (PET) as an aggregate. They found that the more PET was added to the polymer-cement concrete, the more the ultrasonic wave velocity reduced. The results also showed that the mechanical properties, namely flexural and compressive strengths, were in correlation with the ultrasonic wave velocity. Thus, the higher the mechanical property of the composite, the higher the wave velocity. Ultrasonic guided waves were utilized by Sharma and Mukherjee [124] to monitor the progression of corrosion in steel reinforcement in chloride and oxide environment.
9.1.2. Timber Structures
It is also possible to use UT methods to detect insect damage and delamination as well as cracks in timber structures. Moreover, fungal growth in timber has been assessed by transverse transmission methods of UT. In this method, waves propagating in the direction perpendicular to the grain were used to detect the decayed portions of the wood through wave attenuation, wave velocity as well as analysis of frequency spectrum. Two ultrasonic methods, namely, pulse-echo and through-transmission and thermal camera, were used as NDT methods to assess internal defects of pruned and unpruned eucalyptus wood samples at 120% moisture content. The experiment aimed to determine the influence of defects on the ultrasonic wave propagation and thermal camera. It was observed that, for standing tress, several types of defects in various parts of the tree might not affect the wave velocity but may influence other parameters such as wave amplitude [125].
9.1.3. Brick Masonry Members
Makoond et al. [126] have used ultrasonic pulse velocity (UPV) and Impulse Excitation of Vibration (IEV) to evaluate the dynamic modulus of elasticity and shear modulus of brick masonry members. They found that both NDT methods could be employed to determine the dynamic properties of the brick samples. However, it was observed that the UPV method was faster and simpler in comparison with the corresponding IEV method.
9.1.4. Composite Structures
The air-coupled magnetostrictive ultrasonic method has been used for non-contact NDT methods for composite structures. In the experiment, four types of titanium horns were manufactured and analysed for optimal horn configuration. It was observed that there was a good correlation between the experimental and theoretical model regarding the dependence of vibration amplitude on the unit power of the ultrasonic horns [127]. Additionally, an ultrasonic non-destructive method has been successfully used to evaluate porosity in reinforced metal-matrix composites [128].
9.1.5. Fibre Reinforced Materials
Tiwari et al. [114] also used an ultrasonic guided waves system to extract information on the detection of disband-type defects of glass fibre reinforced polymer material. Rentala et al. [129] have also used a 2-D axis symmetry finite element model (FEM) to estimate ultrasonic signal response from symmetrical defects. Liu et al. [130] have proposed a non-contact laser ultrasonic method to estimate five engineering constants of carbon fibre reinforced composites based on measurement of velocities of transverse and longitudinal waves. Jakubczak and Bienias [131] employed an ultrasonic testing method to assess fibre metal laminates (FML). They adopted a novel approach by performing quantitative and qualitative transmission NDT tests on the FML under dynamic loads. The results were then compared with the conventional pulse-echo ultrasonic approach. They observed that the novel transmission phased array method was more effective and efficient in assessing the condition of the FML in terms of detection of defects, quality and quantity, notwithstanding the type and surface condition of the laminates.
The ultrasonic technique is able to identify internal flaws in an element over large volumes. Another advantage is that there is a hand-held type, whose application is relatively easy [113]. Moreover, the automation of the technique ensures the dependability and repeatability of the NDT methods [132].
The main drawback in the ultrasonic non-destructive method is that there are no suitable methods to process the noise from the ultrasonic signals in order to estimate defects on a structure effectively [133]. In addition, there is normally an influence of conditions of coupling. It is also very difficult to interpret results, especially for irregular and heterogeneous elements, such as timber. It is extremely difficult to acquire information on NDT parameters because of certain complicated factors such as microstructure features, transmission, mode of conversion, stress and diffraction [118,120]. However, such complexity can be overcome by using several NDT methods depending on various physical approaches [120]. There are also difficulties in identifying signals from the opposite side of tested elements or structures emerging from secondary reflections from composite structures, which might lead to errors in the analysis of results [131].
This technology was also used in sensing structural health. An ultrasonic sensing network was developed by Ervin et al. [134] to evaluate corrosion of steel reinforcement. The ultrasonic waves are defined as sound waves with a frequency that exceeds the human hearing limit [105,106,107]. This technology was also used in sensing structural health. An ultrasonic sensing network was developed by Ervin et al. [134] to evaluate corrosion of steel reinforcement. Guided ultrasonic waves were utilized to monitor reinforced mortar specimens under accelerated uniform and localized corrosion. Ultrasonic guided waves were utilized by Sharma and Mukherjee [124] to monitor the progression of corrosion in steel reinforcement in chloride and oxide environment.
10. Conclusions
This paper presented a review of the recent developments in techniques for SHM together with their applications in different structural systems. The focus of this paper is on the recent uses of sensors, as non-destructive tools, in the assessment of structural health. To facilitate the topic of this paper, the commonly used sensing methods in the civil engineering field for SHM, their working principles, and installation techniques were presented and reviewed. The main techniques that were included in this paper are: sweep frequency approach, ground penetrating radar, infrared technique, fiber optics sensors, camera-based techniques, laser scanners, acoustic emission and ultrasonic techniques. The advantages of each technique in SHM were presented, and different examples of the recent applications of the reviewed sensing methods were provided.
The present paper proved several key facts about the application of sensing technology in civil engineering which are the following:
- Sensors have been effectively used in different civil engineering applications during the past five years providing very accurate measurements.
- Sensors significantly minimize the monitoring costs as they reduce the need for the actual observations that require long testing time and expensive sources.
- Sensors can minimize the sudden failure accidents as they deliver accurate real-time data about the invisible damages in the structures, such as corrosion of steel bars.
Author Contributions
P.K., M.M., M.G., G.S.K., D.Y. and K.H.; organized the conceptualization of the idea and the methodology employed in this paper. Following that, P.K., M.M., M.G., G.S.K. and K.H.; worked on the critical evaluation of the existing techniques. The original writing and draft preparation were carried out by all authors. M.M., P.K. and K.H. carried out the review and editing. All authors have read and agreed to the published version of the manuscript.
Funding
This research received no external funding.
Institutional Review Board Statement
Not applicable.
Informed Consent Statement
Not applicable.
Data Availability Statement
Not applicable.
Conflicts of Interest
Authors declare that there is no conflict of interest.
References
- Feng, D.; Feng, M.Q. Computer vision for SHM of civil infrastructure: From dynamic response measurement to damage detection–A review. Eng. Struct. 2018, 156, 105–117. [Google Scholar] [CrossRef]
- Rens, K.L.; Wipf, T.J.; Klaiber, F.W. Review of nondestructive evaluation techniques of civil infrastructure. J. Perform. Constr. Facil. 1997, 11, 152–160. [Google Scholar] [CrossRef]
- Kuang, K.S.C.; Quek, S.T.; Koh, C.G.; Cantwell, W.J.; Scully, P. Plastic optical fibre sensors for structural health monitoring: A review of recent progress. J. Sens. 2009, 2009, 312053. [Google Scholar] [CrossRef] [Green Version]
- McCann, D.; Forde, M. Review of NDT methods in the assessment of concrete and masonry structures. Ndt E Int. 2001, 34, 71–84. [Google Scholar] [CrossRef]
- Kimura, W.D. What are electromagnetic waves? In Electromagnetic Waves and Lasers; Morgan & Claypool Publishers: San Rafael, CA, USA, 2017. [Google Scholar] [CrossRef]
- Hashim, K.S.; Shaw, A.; AlKhaddar, R.; Kot, P.; Al-Shamma’a, A. Water purification from metal ions in the presence of organic matter using electromagnetic radiation-assisted treatment. J. Clean. Prod. 2021, 280, 124427. [Google Scholar] [CrossRef]
- Yunus, M.A.M.; Mukhopadhyay, S.C. Novel planar electromagnetic sensors for detection of nitrates and contamination in natural water sources. IEEE Sens. J. 2010, 11, 1440–1447. [Google Scholar] [CrossRef]
- Sarwate, V. Electromagnetic Fields and Waves; Bohem Press: Trieste, Italy, 1993. [Google Scholar]
- Abdulhadi, B.; Kot, P.; Hashim, K.; Shaw, A.; Muradov, M.; Al-Khaddar, R. Continuous-flow electrocoagulation (EC) process for iron removal from water: Experimental, statistical and economic study. Sci. Total Environ. 2021, 756, 1–16. [Google Scholar] [CrossRef]
- Ryecroft, S.; Shaw, A.; Fergus, P.; Kot, P.; Hashim, K.; Moody, A.; Conway, L. A First Implementation of Underwater Communications in Raw Water Using the 433 MHz Frequency Combined with a Bowtie Antenna. Sensors 2019, 19, 1813. [Google Scholar] [CrossRef] [Green Version]
- Ryecroft, S.P.; Shaw, A.; Fergus, P.; Kot, P.; Hashim, K.; Conway, L. A Novel Gesomin Detection Method Based on Microwave Spectroscopy. In Proceedings of the 12th International Conference on Developments in eSystems Engineering (DeSE), Kazan, Russia, 7–10 October 2019; pp. 429–433. [Google Scholar]
- Kot, P.; Muradov, M.; Ryecroft, S.; Pedrola, M.O.; Shaw, A.; Hemingway, J.; Deb, R.; Coleman, M. Identification of Optimal Frequencies to Determine Alpha-Cypermethrin Using Machine Learning Feature Selection Techniques. In Proceedings of the 2018 IEEE Congress on Evolutionary Computation (CEC), Rio de Janeiro, Brazil, 8–13 July 2018; pp. 1–7. [Google Scholar]
- Teng, K.H.; Idowu, I.; Kot, P.; Shaw, A.; Muradov, M. Non-destructive Electromagnetic Wave Sensor for Hazardous Biological Materials. In Proceedings of the 2019 12th International Conference on Developments in eSystems Engineering (DeSE), Kazan, Russia, 7–10 October 2019; pp. 651–655. [Google Scholar]
- Tobiasz, A.; Markiewicz, J.; Łapiński, S.; Nikel, J.; Kot, P.; Muradov, M. Review of Methods for Documentation, Management, and Sustainability of Cultural Heritage. Case Study: Museum of King Jan III’s Palace at Wilanów. Sustainability 2019, 11, 7046. [Google Scholar] [CrossRef] [Green Version]
- Mason, A.; Korostynska, O.; Louis, J.; Cordova-Lopez, L.; Abdullah, B.; Greene, J.; Connell, R.; Hopkins, J. Noninvasive in-situ measurement of blood lactate using microwave sensors. IEEE Trans. Biomed. Eng. 2017, 65, 698–705. [Google Scholar] [CrossRef] [Green Version]
- Omer, G.; Kot, P.; Atherton, W.; Muradov, M.; Gkantou, M.; Shaw, A.; Riley, M.; Hashim, K.; Al-Shamma’a, A. A Non-Destructive Electromagnetic Sensing Technique to Determine Chloride Level in Maritime Concrete. Karbala Int. J. Mod. Sci. 2020, 6, 1–14. [Google Scholar]
- Kot, P.; Shaw, A.; Riley, M.; Ali, A.; Cotgrave, A. The feasibility of using electromagnetic waves in determining membrane failure through concrete. Int. J. Civ. Eng. 2017, 15, 355–362. [Google Scholar] [CrossRef]
- Kot, P.; Ali, A.S.; Shaw, A.; Riley, M.; Alias, A. The application of electromagnetic waves in monitoring water infiltration on concrete flat roof: The case of Malaysia. Constr. Build. Mater. 2016, 122, 435–445. [Google Scholar] [CrossRef]
- Teng, K.H.; Kot, P.; Muradov, M.; Shaw, A.; Hashim, K.; Gkantou, M.; Al-Shamma’a, A. Embedded Smart Antenna for Non-Destructive Testing and Evaluation (NDT&E) of Moisture Content and Deterioration in Concrete. Sensors 2019, 19, 547–559. [Google Scholar]
- Gkantou, M.; Muradov, M.; Kamaris, G.S.; Hashim, K.; Atherton, W.; Kot, P. Novel Electromagnetic Sensors Embedded in Reinforced Concrete Beams for Crack Detection. Sensors 2019, 19, 5175. [Google Scholar] [CrossRef] [PubMed] [Green Version]
- Capozzoli, L.; Rizzo, E. Combined NDT techniques in civil engineering applications: Laboratory and real test. Constr. Build. Mater. 2017, 154, 1139–1150. [Google Scholar] [CrossRef]
- Maierhofer, C. Nondestructive evaluation of concrete infrastructure with ground penetrating radar. J. Mater. Civ. Eng. 2003, 15, 287–297. [Google Scholar] [CrossRef]
- Chang, P.C.; Liu, S.C. Recent research in nondestructive evaluation of civil infrastructures. J. Mater. Civ. Eng. 2003, 15, 298–304. [Google Scholar] [CrossRef]
- Zaki, A.; Chai, H.K.; Aggelis, D.G.; Alver, N. Non-destructive evaluation for corrosion monitoring in concrete: A review and capability of acoustic emission technique. Sensors 2015, 15, 19069–19101. [Google Scholar] [CrossRef] [PubMed]
- Kang, M.-S.; Kim, N.; Lee, J.J.; An, Y.-K. Deep learning-based automated underground cavity detection using three-dimensional ground penetrating radar. Struct. Health Monit. 2020, 19, 173–185. [Google Scholar] [CrossRef]
- Khudoyarov, S.; Kim, N.; Lee, J.-J. Three-dimensional convolutional neural network–based underground object classification using three-dimensional ground penetrating radar data. Struct. Health Monit. 2020, 19, 1884–1893. [Google Scholar] [CrossRef]
- Morris, I.; Abdel-Jaber, H.; Glisic, B. Quantitative attribute analyses with ground penetrating radar for infrastructure assessments and structural health monitoring. Sensors 2019, 19, 1637. [Google Scholar] [CrossRef] [PubMed] [Green Version]
- Hong, S.; Wiggenhauser, H.; Helmerich, R.; Dong, B.; Dong, P.; Xing, F. Long-term monitoring of reinforcement corrosion in concrete using ground penetrating radar. Corros. Sci. 2017, 114, 123–132. [Google Scholar] [CrossRef]
- Hiasa, S.; Birgul, R.; Catbas, F.N. A data processing methodology for infrared thermography images of concrete bridges. Comput. Struct. 2017, 190, 205–218. [Google Scholar] [CrossRef]
- Jang, K.; Kim, N.; An, Y.-K. Deep learning–based autonomous concrete crack evaluation through hybrid image scanning. Struct. Health Monit. 2019, 18, 1722–1737. [Google Scholar] [CrossRef]
- Gupta, B.D. Fiber Optic Sensors: Principles and Applications; New India Publishing: New Delhi, India, 2006. [Google Scholar]
- Barrias, A.; Casas, J.R.; Villalba, S. A review of distributed optical fiber sensors for civil engineering applications. Sensors 2016, 16, 748. [Google Scholar] [CrossRef] [Green Version]
- Xiao, F.; Hulsey, J.L.; Balasubramanian, R. Fiber optic health monitoring and temperature behavior of bridge in cold region. Struct. Control Health Monit. 2017, 24, e2020. [Google Scholar] [CrossRef]
- Di Sante, R. Fibre optic sensors for structural health monitoring of aircraft composite structures: Recent advances and applications. Sensors 2015, 15, 18666–18713. [Google Scholar] [CrossRef]
- Guo, H.; Xiao, G.; Mrad, N.; Yao, J. Fiber optic sensors for structural health monitoring of air platforms. Sensors 2011, 11, 3687–3705. [Google Scholar] [CrossRef]
- Meltz, G. Overview of fiber grating-based sensors. In Proceedings of the SPIE’s 1996 International Symposium on Optical Science, Engineering, and Instrumentation, Denver, CO, USA, 4–9 August 1996; pp. 2–22. [Google Scholar]
- Wu, T.; Liu, G.; Fu, S.; Xing, F. Recent Progress of Fiber-Optic Sensors for the Structural Health Monitoring of Civil Infrastructure. Sensors 2020, 20, 4517. [Google Scholar] [CrossRef]
- Bursi, O.S.; Tondini, N.; Fassin, M.; Bonelli, A. Structural monitoring for the cyclic behaviour of concrete tunnel lining sections using FBG sensors. Struct. Control Health Monit. 2016, 23, 749–763. [Google Scholar] [CrossRef]
- Zhang, C.; Alam, Z.; Sun, L.; Su, Z.; Samali, B. Fibre Bragg grating sensor-based damage response monitoring of an asymmetric reinforced concrete shear wall structure subjected to progressive seismic loads. Struct. Control Health Monit. 2019, 26, e2307. [Google Scholar] [CrossRef] [Green Version]
- Zhang, Q.; Zhang, J.; Duan, W.; Wu, Z. Deflection distribution estimation of tied-arch bridges using long-gauge strain measurements. Struct. Control Health Monit. 2018, 25, e2119. [Google Scholar] [CrossRef]
- Fan, S.; Ren, L.; Chen, J. Investigation of fiber Bragg grating strain sensor in dynamic tests of small-scale dam model. Struct. Control Health Monit. 2015, 22, 1282–1293. [Google Scholar] [CrossRef]
- Matveenko, V.; Shardakov, I.; Voronkov, A.; Kosheleva, N.; Lobanov, D.; Serovaev, G.; Spaskova, E.; Shipunov, G. Measurement of strains by optical fiber Bragg grating sensors embedded into polymer composite material. Struct. Control Health Monit. 2018, 25, e2118. [Google Scholar] [CrossRef]
- Norén-Cosgriff, K.; Ramstad, N.; Neby, A.; Madshus, C. Building damage due to vibration from rock blasting. Soil Dyn. Earthq. Eng. 2020, 138, 106331. [Google Scholar] [CrossRef]
- López-Higuera, J.M.; Cobo, L.R.; Incera, A.Q.; Cobo, A. Fiber optic sensors in structural health monitoring. J. Lightwave Technol. 2011, 29, 587–608. [Google Scholar] [CrossRef]
- Boyd, R. Nonlinear Optics, 3rd ed.; Academic Press: Rochester, NY, USA, 2008. [Google Scholar]
- Francis, T.S.; Yin, S. Fiber Optic Sensors; Marcel Dekker Inc.: New York, NY, USA, 2002. [Google Scholar]
- Sierra-Pérez, J.; Torres-Arredondo, M.A.; Güemes, A. Damage and nonlinearities detection in wind turbine blades based on strain field pattern recognition. FBGs, OBR and strain gauges comparison. Compos. Struct. 2016, 135, 156–166. [Google Scholar] [CrossRef]
- Zhao, X.; Gong, P.; Qiao, G.; Lu, J.; Lv, X.; Ou, J. Brillouin corrosion expansion sensors for steel reinforced concrete structures using a fiber optic coil winding method. Sensors 2011, 11, 10798–10819. [Google Scholar] [CrossRef] [Green Version]
- Acikgoz, S.; Pelecanos, L.; Giardina, G.; Aitken, J.; Soga, K. Distributed sensing of a masonry vault during nearby piling. Struct. Control Health Monit. 2017, 24, e1872. [Google Scholar] [CrossRef] [Green Version]
- Song, Z.P.; Zhang, D.; Shi, B.; Chen, S.E.; Shen, M.F. Integrated distributed fiber optic sensing technology-based structural monitoring of the pound lock. Struct. Control Health Monit. 2017, 24, e1954. [Google Scholar] [CrossRef]
- Woods, J.; Lau, D.T.; Bao, X.; Li, W. Measuring strain fields in FRP strengthened RC shear walls using a distributed fiber optic sensor. Eng. Struct. 2017, 152, 359–369. [Google Scholar] [CrossRef]
- Van Der Kooi, K.; Hoult, N.A. Assessment of a steel model truss using distributed fibre optic strain sensing. Eng. Struct. 2018, 171, 557–568. [Google Scholar] [CrossRef]
- Wang, X.; Shi, B.; Wei, G.; Chen, S.E.; Zhu, H.; Wang, T. Monitoring the behavior of segment joints in a shield tunnel using distributed fiber optic sensors. Struct. Control Health Monit. 2018, 25, e2056. [Google Scholar] [CrossRef] [Green Version]
- Lim, K.; Wong, L.; Chiu, W.K.; Kodikara, J. Distributed fiber optic sensors for monitoring pressure and stiffness changes in out-of-round pipes. Struct. Control Health Monit. 2016, 23, 303–314. [Google Scholar] [CrossRef]
- Zou, X.; Chao, A.; Tian, Y.; Wu, N.; Zhang, H.; Yu, T.-Y.; Wang, X. An experimental study on the concrete hydration process using Fabry–Perot fiber optic temperature sensors. Measurement 2012, 45, 1077–1082. [Google Scholar] [CrossRef]
- Liu, T.; Wu, M.; Rao, Y.; Jackson, D.A.; Fernando, G.F. A multiplexed optical fibre-based extrinsic Fabry-Perot sensor system for in-situ strain monitoring in composites. Smart Mater. Struct. 1998, 7, 550. [Google Scholar] [CrossRef]
- Leng, J.; Asundi, A. Structural health monitoring of smart composite materials by using EFPI and FBG sensors. Sens. Actuators A: Phys. 2003, 103, 330–340. [Google Scholar] [CrossRef]
- Khuc, T.; Catbas, F.N. Completely contactless structural health monitoring of real-life structures using cameras and computer vision. Struct. Control Health Monit. 2017, 24, e1852. [Google Scholar] [CrossRef]
- Shen, H.-K.; Chen, P.-H.; Chang, L.-M. Automated steel bridge coating rust defect recognition method based on color and texture feature. Autom. Constr. 2013, 31, 338–356. [Google Scholar] [CrossRef]
- Lee, J.; Kim, S. Structural damage detection in the frequency domain using neural networks. J. Intell. Mater. Syst. Struct. 2007, 18, 785–792. [Google Scholar] [CrossRef]
- Yeum, C.M.; Dyke, S.J. Vision-based automated crack detection for bridge inspection. Comput. Aided Civ. Infrastruct. Eng. 2015, 30, 759–770. [Google Scholar] [CrossRef]
- Huňady, R.; Hagara, M.; Schrštter, M. Using high-speed digital image correlation to determine the damping ratio. Procedia Eng. 2012, 48, 242–249. [Google Scholar] [CrossRef] [Green Version]
- Ngeljaratan, L.; Moustafa, M.A. Structural health monitoring and seismic response assessment of bridge structures using target-tracking digital image correlation. Eng. Struct. 2020, 213, 110551. [Google Scholar] [CrossRef]
- Park, J.-W.; Lee, J.-J.; Jung, H.-J.; Myung, H. Vision-based displacement measurement method for high-rise building structures using partitioning approach. NDT E Int. 2010, 43, 642–647. [Google Scholar] [CrossRef]
- Trebuňa, F.; Hagara, M. Experimental modal analysis performed by high-speed digital image correlation system. Measurement 2014, 50, 78–85. [Google Scholar] [CrossRef]
- Yoon, D.-J.; Weiss, W.J.; Shah, S.P. Assessing damage in corroded reinforced concrete using acoustic emission. J. Eng. Mech. 2000, 126, 273–283. [Google Scholar] [CrossRef]
- Xu, Y.; Li, S.; Zhang, D.; Jin, Y.; Zhang, F.; Li, N.; Li, H. Identification framework for cracks on a steel structure surface by a restricted Boltzmann machines algorithm based on consumer-grade camera images. Struct. Control Health Monit. 2018, 25, e2075. [Google Scholar] [CrossRef]
- Song, Y.-Z.; Bowen, C.R.; Kim, A.H.; Nassehi, A.; Padget, J.; Gathercole, N. Virtual visual sensors and their application in structural health monitoring. Struct. Health Monit. 2014, 13, 251–264. [Google Scholar] [CrossRef] [Green Version]
- Riveiro, B.; DeJong, M.; Conde, B. Automated processing of large point clouds for structural health monitoring of masonry arch bridges. Autom. Constr. 2016, 72, 258–268. [Google Scholar] [CrossRef]
- Liu, W.; Chen, S.-E.; Sajedi, A.; Hauser, E. The role of terrestrial 3D LiDAR scan in bridge health monitoring. In Proceedings of the SPIE Smart Structures and Materials + Nondestructive Evaluation and Health Monitoring, San Diego, CA, USA, 7–11 March 2010; p. 76491K. [Google Scholar]
- Stone, W.; Cheok, G. LADAR Sensing Applications for Construction; Technical Paper; National Institute of Standards and Technology: Gaithersburg, MD, USA, 2001. [Google Scholar]
- Sony, S.; Laventure, S.; Sadhu, A. A literature review of next-generation smart sensing technology in structural health monitoring. Struct. Control Health Monit. 2019, 26, e2321. [Google Scholar] [CrossRef]
- De la Torre, I.M.; Montes, M.d.S.H.; Flores-Moreno, J.M.; Santoyo, F.M. Laser speckle based digital optical methods in structural mechanics: A review. Opt. Lasers Eng. 2016, 87, 32–58. [Google Scholar] [CrossRef]
- Qiu, Q.; Lau, D. A novel approach for near-surface defect detection in FRP-bonded concrete systems using laser reflection and acoustic-laser techniques. Constr. Build. Mater. 2017, 141, 553–564. [Google Scholar] [CrossRef]
- Xu, Y.; Hwang, S.; Wang, Q.; Kim, D.; Luo, C.; Yang, J.; Sohn, H. Laser active thermography for debonding detection in FRP retrofitted concrete structures. NDT E Int. 2020, 114, 102285. [Google Scholar] [CrossRef]
- Scalbi, A.; Olmi, R.; Inglese, G. Evaluation of fractures in a concrete slab by means of laser-spot thermography. Int. J. Heat Mass Transf. 2019, 141, 282–293. [Google Scholar] [CrossRef]
- Park, S.E.; Eem, S.-H.; Jeon, H. Concrete crack detection and quantification using deep learning and structured light. Constr. Build. Mater. 2020, 252, 119096. [Google Scholar] [CrossRef]
- Grigoriadis, K. Use of laser interferometry for measuring concrete substrate roughness in patch repairs. Autom. Constr. 2016, 64, 27–35. [Google Scholar] [CrossRef] [Green Version]
- Tayfur, S.; Alver, N. A 3D parameter correction technique for damage assessment of structural reinforced concrete beams by acoustic emission. Constr. Build. Mater. 2019, 215, 148–161. [Google Scholar] [CrossRef]
- Spanner, J.C. Monitoring Structural Integrity by Acoustic Emission: A Symposium Presented at Ft. Lauderdale, Fla., 17–18 Jan. 1974, American Society for Testing and Materials; ASTM International: West Conshohocken, PA, USA, 1975; Volume 571. [Google Scholar]
- Noorsuhada, M. An overview on fatigue damage assessment of reinforced concrete structures with the aid of acoustic emission technique. Constr. Build. Mater. 2016, 112, 424–439. [Google Scholar] [CrossRef]
- Rasheed, M.A.; Prakash, S.S.; Raju, G.; Kawasaki, Y. Fracture studies on synthetic fiber reinforced cellular concrete using acoustic emission technique. Constr. Build. Mater. 2018, 169, 100–112. [Google Scholar] [CrossRef]
- Xu, J.; Fu, Z.; Han, Q.; Lacidogna, G.; Carpinteri, A. Micro-cracking monitoring and fracture evaluation for crumb rubber concrete based on acoustic emission techniques. Struct. Health Monit. 2018, 17, 946–958. [Google Scholar] [CrossRef]
- Tsangouri, E.; Remy, O.; Boulpaep, F.; Verbruggen, S.; Livitsanos, G.; Aggelis, D. Structural health assessment of prefabricated concrete elements using Acoustic Emission: Towards an optimized damage sensing tool. Constr. Build. Mater. 2019, 206, 261–269. [Google Scholar] [CrossRef]
- Tziavos, N.I.; Hemida, H.; Dirar, S.; Papaelias, M.; Metje, N.; Baniotopoulos, C. Structural health monitoring of grouted connections for offshore wind turbines by means of acoustic emission: An experimental study. Renew. Energy 2020, 147, 130–140. [Google Scholar] [CrossRef]
- Ma, G.; Du, Q. Structural health evaluation of the prestressed concrete using advanced acoustic emission (AE) parameters. Constr. Build. Mater. 2020, 250, 118860. [Google Scholar] [CrossRef]
- Kravchuk, R.; Landis, E.N. Acoustic emission-based classification of energy dissipation mechanisms during fracture of fiber-reinforced ultra-high-performance concrete. Constr. Build. Mater. 2018, 176, 531–538. [Google Scholar] [CrossRef]
- Das, A.K.; Suthar, D.; Leung, C.K. Machine learning based crack mode classification from unlabeled acoustic emission waveform features. Cem. Concr. Res. 2019, 121, 42–57. [Google Scholar] [CrossRef]
- Omondi, B.; Aggelis, D.G.; Sol, H.; Sitters, C. Improved crack monitoring in structural concrete by combined acoustic emission and digital image correlation techniques. Struct. Health Monit. 2016, 15, 359–378. [Google Scholar] [CrossRef]
- Alam, S.Y.; Loukili, A.; Grondin, F.; Rozière, E. Use of the digital image correlation and acoustic emission technique to study the effect of structural size on cracking of reinforced concrete. Eng. Fract. Mech. 2015, 143, 17–31. [Google Scholar] [CrossRef]
- Liu, S.; Ma, H. Estimation of the stress level on a cross section of a reinforced concrete beam via Acoustic emission Intensity Distribution (AID) analysis. Constr. Build. Mater. 2018, 164, 463–476. [Google Scholar] [CrossRef]
- Li, W.; Kong, Q.; Ho, S.C.M.; Mo, Y.; Song, G. Feasibility study of using smart aggregates as embedded acoustic emission sensors for health monitoring of concrete structures. Smart Mater. Struct. 2016, 25, 115031. [Google Scholar] [CrossRef]
- Adamczak-Bugno, A.; Swit, G.; Krampikowska, A. Application of the Acoustic Emission Method in the Assessment of the Technical Condition of Steel Structures. In IOP Conference Series: Materials Science and Engineering; IOP Publishing Ltd.: Bristol, UK, 2019; p. 032041. [Google Scholar]
- Krampikowska, A.; Pała, R.; Dzioba, I.; Świt, G. The use of the acoustic emission method to identify crack growth in 40CrMo steel. Materials 2019, 12, 2140. [Google Scholar] [CrossRef] [Green Version]
- Stankevych, O.; Skalsky, V. Investigation and identification of fracture types of structural materials by means of acoustic emission analysis. Eng. Fract. Mech. 2016, 164, 24–34. [Google Scholar] [CrossRef]
- Barile, C.; Casavola, C.; Pappalettera, G.; Vimalathithan, P. Experimental wavelet analysis of acoustic emission signal propagation in CFRP. Eng. Fract. Mech. 2019, 210, 400–407. [Google Scholar] [CrossRef]
- Crivelli, D.; Guagliano, M.; Eaton, M.; Pearson, M.; Al-Jumaili, S.; Holford, K.; Pullin, R. Localisation and identification of fatigue matrix cracking and delamination in a carbon fibre panel by acoustic emission. Compos. Part B Eng. 2015, 74, 1–12. [Google Scholar] [CrossRef] [Green Version]
- Masmoudi, S.; El Mahi, A.; Turki, S. Fatigue behaviour and structural health monitoring by acoustic emission of E-glass/epoxy laminates with piezoelectric implant. Appl. Acoust. 2016, 108, 50–58. [Google Scholar] [CrossRef]
- Wu, Y.; Li, S.; Wang, D.; Zhao, G. Damage monitoring of masonry structure under in-situ uniaxial compression test using acoustic emission parameters. Constr. Build. Mater. 2019, 215, 812–822. [Google Scholar] [CrossRef]
- Han, Q.; Xu, J.; Carpinteri, A.; Lacidogna, G. Localization of acoustic emission sources in structural health monitoring of masonry bridge. Struct. Control Health Monit. 2015, 22, 314–329. [Google Scholar] [CrossRef]
- Rescalvo, F.J.; Suarez, E.; Valverde-Palacios, I.; Santiago-Zaragoza, J.M.; Gallego, A. Health monitoring of timber beams retrofitted with carbon fiber composites via the acoustic emission technique. Compos. Struct. 2018, 206, 392–402. [Google Scholar] [CrossRef]
- Rescalvo, F.J.; Valverde-Palacios, I.; Suarez, E.; Roldán, A.; Gallego, A. Monitoring of carbon fiber-reinforced old timber beams via strain and multiresonant acoustic emission sensors. Sensors 2018, 18, 1224. [Google Scholar] [CrossRef] [Green Version]
- Perrin, M.; Yahyaoui, I.; Gong, X. Acoustic monitoring of timber structures: Influence of wood species under bending loading. Constr. Build. Mater. 2019, 208, 125–134. [Google Scholar] [CrossRef]
- Strantza, M.; Aggelis, D.G.; De Baere, D.; Guillaume, P.; Van Hemelrijck, D. Evaluation of SHM system produced by additive manufacturing via acoustic emission and other NDT methods. Sensors 2015, 15, 26709–26725. [Google Scholar] [CrossRef] [Green Version]
- Al-Marri, S.; AlQuzweeni, S.S.; Hashim, K.S.; AlKhaddar, R.; Kot, P.; AlKizwini, R.S.; Zubaidi, S.L.; Al-Khafaji, Z.S. Ultrasonic-Electrocoagulation method for nitrate removal from water. In Proceedings of the IOP Conference Series: Materials Science and Engineering, Chennai, India, 16–17 September 2020; p. 012073. [Google Scholar]
- Hashim, K.S.; Ali, S.S.M.; AlRifaie, J.K.; Kot, P.; Shaw, A.; Al Khaddar, R.; Idowu, I.; Gkantou, M. Escherichia coli inactivation using a hybrid ultrasonic–electrocoagulation reactor. Chemosphere 2020, 247, 125868–125875. [Google Scholar] [CrossRef]
- Alnaimi, H.; Idan, I.J.; Al-Janabi, A.; Hashim, K.; Gkantou, M.; Zubaidi, S.L.; Kot, P.; Muradov, M. Ultrasonic-electrochemical treatment for effluents of concrete plants Ultrasonic-electrochemical treatment for effluents of concrete plants. In Proceedings of the IOP Conference Series: Materials Science and Engineering, Chennai, India, 16–17 September 2020; p. 012063. [Google Scholar]
- Li, C.; Pain, D.; Wilcox, P.D.; Drinkwater, B.W. Imaging composite material using ultrasonic arrays. NDT E Int. 2013, 53, 8–17. [Google Scholar] [CrossRef]
- Li, J.; Monaghan, T.; Nguyen, T.; Kay, R.; Friel, R.; Harris, R. Multifunctional metal matrix composites with embedded printed electrical materials fabricated by ultrasonic additive manufacturing. Compos. Part B Eng. 2017, 113, 342–354. [Google Scholar] [CrossRef] [Green Version]
- Bournias-Varotsis, A.; Friel, R.J.; Harris, R.A.; Engstrøm, D.S. Ultrasonic Additive Manufacturing as a form-then-bond process for embedding electronic circuitry into a metal matrix. J. Manuf. Process. 2018, 32, 664–675. [Google Scholar] [CrossRef]
- Tallafuss, P.J.; Rosochowski, A.; Campbell, S. A feasibility study on different NDT techniques used for testing bond quality in cold roll bonded Al-Sn alloy/steel bimetal strips. Manuf. Rev. 2017, 4, 4. [Google Scholar] [CrossRef] [Green Version]
- Hasiotis, T.; Badogiannis, E.; Tsouvalis, N.G. Application of ultrasonic C-scan techniques for tracing defects in laminated composite materials. Stroj. Vestn. J. Mech. Eng. 2011, 57, 192–203. [Google Scholar] [CrossRef]
- Palma, P.; Steiger, R. Structural health monitoring of timber structures—Review of available methods and case studies. Constr. Build. Mater. 2020, 248, 118528. [Google Scholar] [CrossRef]
- Tiwari, K.A.; Raisutis, R.; Samaitis, V. Hybrid signal processing technique to improve the defect estimation in ultrasonic non-destructive testing of composite structures. Sensors 2017, 17, 2858. [Google Scholar] [CrossRef] [PubMed] [Green Version]
- Kumar, S.; Mahto, D. Recent trends in industrial and other engineering applications of non destructive testing: A review. Int. J. Sci. Eng. Res. 2013, 4. [Google Scholar]
- Marcantonio, V.; Monarca, D.; Colantoni, A.; Cecchini, M. Ultrasonic waves for materials evaluation in fatigue, thermal and corrosion damage: A review. Mech. Syst. Signal Process. 2019, 120, 32–42. [Google Scholar] [CrossRef]
- Sanabria Martín, S.J. Air-Coupled Ultrasound Propagation and Novel Non-Destructive Bonding Quality Assessment of Timber Composites. Ph.D. Thesis, ETH Zurich, Zurich, Switzerland, 2012. [Google Scholar]
- Chauveau, D. Review of NDT and process monitoring techniques usable to produce high-quality parts by welding or additive manufacturing. Weld. World 2018, 62, 1097–1118. [Google Scholar] [CrossRef]
- Acevedo, R.; Sedlak, P.; Kolman, R.; Fredel, M. Residual stress analysis of additive manufacturing of metallic parts using ultrasonic waves: State of the art review. J. Mater. Res. Technol. 2020. [Google Scholar] [CrossRef]
- Ivanova, Y. Non-destructive monitoring of tensile of mild steel samples by magnetic Barkhausen and ultrasonic methods. MATEC Web Conf. 2018, 145, 05007. [Google Scholar] [CrossRef] [Green Version]
- Pedreros, L.; Cárdenas, F.; Ramírez, N.; Forero, E. NDT non-destructive test for quality evaluation of concrete specimens by ultrasonic pulse velocity measurement. In Proceedings of the IOP Conference Series: Materials Science and Engineering, Cartagena, Colombia, 30 October–1 November 2019; p. 012041. [Google Scholar]
- Liu, L.; Miramini, S.; Hajimohammadi, A. Characterising fundamental properties of foam concrete with a non-destructive technique. Nondestruct. Test. Eval. 2019, 34, 54–69. [Google Scholar] [CrossRef]
- Sokołowska, J.; Zalegowski, K. Ultrasonic quality assessment of polymer-cement concrete with PET waste as the aggregate. Arch. Civ. Eng. 2018, 64, 67–77. [Google Scholar] [CrossRef] [Green Version]
- Sharma, S.; Mukherjee, A. Monitoring corrosion in oxide and chloride environments using ultrasonic guided waves. J. Mater. Civ. Eng. 2011, 23, 207–211. [Google Scholar] [CrossRef]
- Taskhiri, M.S.; Hafezi, M.H.; Harle, R.; Williams, D.; Kundu, T.; Turner, P. Ultrasonic and thermal testing to non-destructively identify internal defects in plantation eucalypts. Comput. Electron. Agric. 2020, 173, 105396. [Google Scholar] [CrossRef]
- Makoond, N.; Pelà, L.; Molins, C. Dynamic elastic properties of brick masonry constituents. Constr. Build. Mater. 2019, 199, 756–770. [Google Scholar] [CrossRef]
- Derusova, D.; Vavilov, V.; Druzhinin, N.; Kolomeets, N.; Chulkov, A.; Rubtsov, V.; Kolubaev, E. Investigating vibration characteristics of magnetostrictive transducers for air-coupled ultrasonic NDT of composites. Ndt E Int. 2019, 107, 102151. [Google Scholar] [CrossRef]
- Podymova, N.; Kalashnikov, I.; Bolotova, L.; Kobeleva, L. Laser-ultrasonic nondestructive evaluation of porosity in particulate reinforced metal-matrix composites. Ultrasonics 2019, 99, 105959. [Google Scholar] [CrossRef]
- Rentala, V.K.; Mylavarapu, P.; Gautam, J.P. Issues in estimating probability of detection of NDT techniques—A model assisted approach. Ultrasonics 2018, 87, 59–70. [Google Scholar] [CrossRef]
- Liu, H.; Zhang, L.; Liu, H.F.; Chen, S.; Wang, S.; Wong, Z.Z.; Yao, K. High-frequency ultrasonic methods for determining corrosion layer thickness of hollow metallic components. Ultrasonics 2018, 89, 166–172. [Google Scholar] [CrossRef]
- Jakubczak, P.; Bienias, J. Non-destructive damage detection in fibre metal laminates. J. Nondestruct. Eval. 2019, 38, 1–10. [Google Scholar] [CrossRef] [Green Version]
- Wu, H.-C.; Gupta, N.; Mylavarapu, P.S. Blind multiridge detection for automatic nondestructive testing using ultrasonic signals. IEEE Trans. Ultrason. Ferroelectr. Freq. Control 2006, 53, 1902–1911. [Google Scholar] [CrossRef] [PubMed]
- Mahmud, K.; Baba, N.; Ohba, R. Using of a diverse field algorithm in ultrasonic signal processing for nondestructive testing. Eur. Phys. J. Appl. Phys. 2001, 15, 3–6. [Google Scholar] [CrossRef]
- Ervin, B.L.; Kuchma, D.A.; Bernhard, J.T.; Reis, H. Monitoring corrosion of rebar embedded in mortar using high-frequency guided ultrasonic waves. J. Eng. Mech. 2009, 135, 9–19. [Google Scholar] [CrossRef]
Figure 1.
(a) Sensor dimensions, (b) Proposed microwave Transmitter/Receiver setup and (c) block diagram of proposed Sweep Frequency system for SHM [16].
Figure 1.
(a) Sensor dimensions, (b) Proposed microwave Transmitter/Receiver setup and (c) block diagram of proposed Sweep Frequency system for SHM [16].

Figure 2.
(a) Embedded Rectangular patch antenna setup for moisture detection [19], (b) Embedded SRR antenna setup for crack detection [20].

Figure 3.
Ground Penetrating Radar principle of work.

Figure 4.
Schematics of the proposed hybrid image scanning (HIS) system [30].
Figure 4.
Schematics of the proposed hybrid image scanning (HIS) system [30].

Figure 5.
An optical fiber along with light guiding and reflection [32].
Figure 5.
An optical fiber along with light guiding and reflection [32].

Figure 6.
FBG sensor [37].
Figure 6.
FBG sensor [37].

Figure 7.
OTDR method-Rayleigh backscattering [32].
Figure 7.
OTDR method-Rayleigh backscattering [32].

Figure 8.
Fabry-Perot FOS [37].
Figure 8.
Fabry-Perot FOS [37].

Figure 9.
Camera principle [58].
Figure 9.
Camera principle [58].

Figure 10.
Laser monitoring system.

Figure 11.
Acoustic emission principle: (a) AE sensor and medium; (b) AE parameters [79].
Figure 11.
Acoustic emission principle: (a) AE sensor and medium; (b) AE parameters [79].

Figure 12.
Examples of AE sensors application for crack monitoring.

Figure 13.
Ultrasonic measurement system [114].
Figure 13.
Ultrasonic measurement system [114].

Publisher’s Note: MDPI stays neutral with regard to jurisdictional claims in published maps and institutional affiliations. |
© 2021 by the authors. Licensee MDPI, Basel, Switzerland. This article is an open access article distributed under the terms and conditions of the Creative Commons Attribution (CC BY) license (http://creativecommons.org/licenses/by/4.0/).
Share and Cite
MDPI and ACS Style
Kot, P.; Muradov, M.; Gkantou, M.; Kamaris, G.S.; Hashim, K.; Yeboah, D. Recent Advancements in Non-Destructive Testing Techniques for Structural Health Monitoring. Appl. Sci. 2021, 11, 2750. https://doi.org/10.3390/app11062750
AMA Style
Kot P, Muradov M, Gkantou M, Kamaris GS, Hashim K, Yeboah D. Recent Advancements in Non-Destructive Testing Techniques for Structural Health Monitoring. Applied Sciences. 2021; 11(6):2750. https://doi.org/10.3390/app11062750
Chicago/Turabian StyleKot, Patryk, Magomed Muradov, Michaela Gkantou, George S. Kamaris, Khalid Hashim, and David Yeboah. 2021. "Recent Advancements in Non-Destructive Testing Techniques for Structural Health Monitoring" Applied Sciences 11, no. 6: 2750. https://doi.org/10.3390/app11062750
Note that from the first issue of 2016, this journal uses article numbers instead of page numbers. See further details here.