Life Cycle Assessment of Sugar Palm Fiber Reinforced-Sago Biopolymer Composite Takeout Food Container


1
Laboratory of Biocomposite Technology, Institute of Tropical Forest and Forest Products (INTROP), Universiti Putra Malaysia (UPM), Serdang, Selangor 43400, Malaysia
2
Department of Mechanical and Manufacturing Engineering, Universiti Putra Malaysia (UPM), Serdang, Selangor 43400, Malaysia
3
Faculty of Mechanical and Manufacturing Engineering Technology, Universiti Teknikal Malaysia Melaka (UTem), Hang Tuah Jaya, Durian Tunggal, Melaka 76100, Malaysia
*
Author to whom correspondence should be addressed.
Appl. Sci. 2020, 10(22), 7951; https://doi.org/10.3390/app10227951
Submission received: 21 September 2020
/
Revised: 22 October 2020
/
Accepted: 23 October 2020
/
Published: 10 November 2020
(This article belongs to the Section Environmental Sciences)
Abstract
:In the development of packaging products, the considerations are not limited to the food shelf-life, safety, and practicality, but also environmental sustainability. This paper reports a life cycle assessment (LCA) analysis of a proposed natural fiber-reinforced biopolymer composite takeout food container. The study focuses on the damage assessment of the whole product system, including disposal scenarios of the thermoformed sugar palm fiber (SPF)-reinforced sago starch composite takeout food container. The analysis performed was to anticipate the environmental impact of the cradle-to-grave approach. The results exhibited the total human health damage of 2.63 × 10⁻⁵ DALY and ecosystem damage of 9.46 × 10⁻⁸ species.year per kg of containers. The main contributor was the carbon dioxide emission from fossil fuel combustion for energy generation that contributed to climate change and caused human health and the ecosystem damages with low-level metrics of 1.3 × 10⁻⁵ DALY and 7.39 × 10⁻⁸ species.yr per kg of containers, respectively. The most contributed substances in the ‘Particulate matter formation’ impact categories that caused respiratory diseases were from air/nitrogen oxides, air/particulates, <2.5 µm, and air/sulphur dioxide with the metrics of 2.93 × 10⁻⁶ DALY, 2.75 × 10⁻⁶ DALY, and 1.9 × 10⁻⁶ DALY per kg containers, correspondingly. Whereas, for the ‘Agricultural land occupation’, which contributed to ecosystem damage, almost the total contributions came from raw/occupation, forest, intensive with the metric of 1.93 × 10⁻⁹ species.yr per kg of containers. Nevertheless, from the results, all impact categories impacted below than 0.0001 DALY for the Human Health damage category and below 0.00001 species.yr for the ecosystem damage category. These results would provide important insights to companies and manufacturers in commercializing the fully biobased takeout food containers.
1. Introduction
Almost half of the total plastics produced worldwide are used for short-term applications, such as food packaging [1,2]. Inefficient waste management has caused massive plastic debris discarded in terrestrial and in aquatic environments [3]. Plastic manufacturing demands for huge petroleum resources and emits hundreds of millions of tons of carbon dioxide (CO2) and other harmful gases into the atmosphere [4]. Henceforth, innovative product design shall consider sustainable, biodegradable, and biobased raw materials, and biobased products and biopolymer materials have demonstrated encouraging results in terms of environmental burdens [5]. The measurement of “green” characteristics of a product or a system is very dependent on its environmental impacts and resource utilization.
Life cycle assessment (LCA) is a standardized method to learn the potential environmental impacts of a product over its entire life-cycle [6]. LCA could also be a supporting tool in the design process to understand and assess the technical solutions to be employed in the production process so that the impacts could be minimized, not only from the product itself but also from the phases of use and the end-of-life [5]. LCA can also be utilized for product development and improvement, strategizing plans, making public policies, marketing decisions, and a few different applications [5,6]. Many packaging-related studies have already been applying LCA as a comparative assessment tool [7,8,9,10].
The development of the natural fiber-reinforced biopolymer composite or termed “green biocomposite” with biodegradability and/or compostability attributes is seen as one solution to reduce municipal solid waste in landfills. The microorganisms produce water and enzymes to initiate biopolymer breakdown, then taken up by the microbial cells and finally converted into water, carbon dioxide, and biomass [11]. Many LCA analyses of biocomposite materials have been carried out to assess their environmental profiles. For example, Günkaya and Banar [7] compared their newly developed orange peel-derived pectin jelly and corn starch with low-density polyethylene (LDPE) film using a cradle-to-gate LCA approach. Their results revealed that the biocomposite film has a slightly higher impact than LDPE film and mainly resulted from electricity consumption for the extrusion process, film-forming, and modified starch addition. Another recent comparative study through cradle-to-gate LCA was performed by Petrucci et al. [10]. They assessed and compared limonene plasticized poly(lactic acid) (PLA) films containing cellulose nanocrystals (CNC) from Phormium tenax leaf fibers with acetyl tributyl citrate (ATBC) plasticized PLA films containing organo-modified montmorillonite (OMMT). The environmental impact of PLA/limonene film reinforced with 1% in weight of CNC (PLA/CNC/limonene) was comparable to the environmental impact of PLA films reinforced with OMMT and plasticized with a petroleum-based plasticizer (ATBC; PLA/OMTT/ATBC).
Concerning biocomposite materials for packaging products, most LCA studies were performed for specific packaging products and applied the cradle-to-grave approach. Saraiva et al. [12], for instance, analyzed mango packaging made from polyethylene (PE)/natural fiber composites and compared its environmental performance with an identical cardboard packaging. Two different scenarios were developed based on the assumption of Brazil and Europe’s location of usage. With consideration of no reuse of the packaging, the results showed that most of the environmental impacts were lower for the cardboard packaging because of the higher electricity input and higher fuel consumption for the transportation of the heavier composite packaging. In contrast, Lorite et al. [13] studied the environmental impact assessment of PLA active packaging to the commonly used polyethylene terephthalate or PET. The LCA results indicated that PLA packaging with nano-clays had the highest environmental performance and presented the best approach to prevent microbial growth. In a more recent work, Maga et al. [9] performed an environmental assessment on meat trays made of nine different packaging materials. The materials analyzed were PS-based trays (extruded polystyrene and extruded polystyrene with a five-layered structure containing ethylene vinyl alcohol), PET-based trays (recycled polyethylene terephthalate, with and without polyethylene layer, and amorphous polyethylene terephthalate), polypropylene (PP), and polylactic acid (PLA). The results indicated that PS-based trays, especially the mono-material solutions made of extruded polystyrene, generated the lowest environmental impact across all categories, except resource depletion. The overall results were dominated by the production process, but it was also acknowledged that the end-of-life scenario affected the environmental performance. Apart from studies on the environmental performance of products realized from biobased materials compared with the conventional ones, there are also works utilizing LCA to analyze impacts generated and to identify environmental damage and hotspots. Ingrao et al. [11] reported an LCA application that highlighted the related environmental criticalities and potential indicators in the production of foamy 1 kg polylactic acid (PLA) trays for fresh food packaging applications. They concluded that the highest environmental impacts came from the production, mainly due to the corn cultivation phase and transportation of the granules to the tray manufacturing factory due to the extensive distance travelled (from America to Italy) and the methods utilized. It was emphasized that the transportation of the PLA-trays was the source of the high environmental impacts.
In addition to the reviewed works above, it is also noteworthy to point out that the LCA method is also utilized in design and optimization topics. It can be a design tool to help companies to be entirely aware of the environmental consequences of their actions and decisions in developing a product. From these aspects, LCA would be an invaluable decision-support tool for stakeholders like researchers, manufacturers, policy-makers, and company owners [11]. Environmentally sustainable design is an approach to designing products that consider and integrate the impacts on the environment of the product system, even before its development phase. Designers, engineers, and stakeholders must understand the thinking behind the selection of the raw materials, manufacturing technologies, and processes in a product system by taking materials and energy efficiency into account [6]. A report mentioned that eco-design studies of incorporated products and packaging life cycles are becoming trends since the search for alternative materials and their end-of-life routes are vital in the present and future of LCA for packaging [14].
As explained earlier, abundant studies are investigating the life cycle of biocomposites materials developed and using LCA as a tool to compare their environmental performances with identical packaging made from synthetic materials. However, there is still spacious room for more studies to be carried out, providing designers, researchers and scientists, and other stakeholders with guidelines that might reduce the environmental impacts of their intended green packaging products. Additionally, the life-cycle environmental assessment analysis studies dealt with takeout food containers are scarce. Additionally, to the best of authors’ knowledge, no related works to sugar palm fiber (SPF)-reinforced sago starch composites of takeout food containers were found in the literature. This paper reports the assessment of the potential environmental impact associated with the life cycle of the proposed concept design of biodegradable and fully biobased composite takeout food container by considering damage and impact categories.
2. Methodology
The life-cycle environmental impacts of the SPF-reinforced sago starch biocomposite takeout food container, which were developed conceptually in the authors’ previous works [15,16], are to be appraised in this study. An investigation from an environmental perspective of the entire life cycle of a container was realized from a fully biobased SPF-reinforced sago starch biocomposite for takeout food container application. The goal and scope definitions of the problem and the inventory analysis were outlined and conducted according to ISO 14040 guidelines [17]. The LCA and interpretation were performed according to ISO 14044 and ISO 14049 for developing function, establishing inputs and outputs of unit processes, and system boundaries [7,18]. SimaPro software [19], the most used LCA tool [14], was utilized as the primary source for the life cycle inventory (LCI), where it contains LCI data for over 2500 processes typically used in the packaging industry [5].
2.1. Goal, Scope, and Functional Unit of the Study
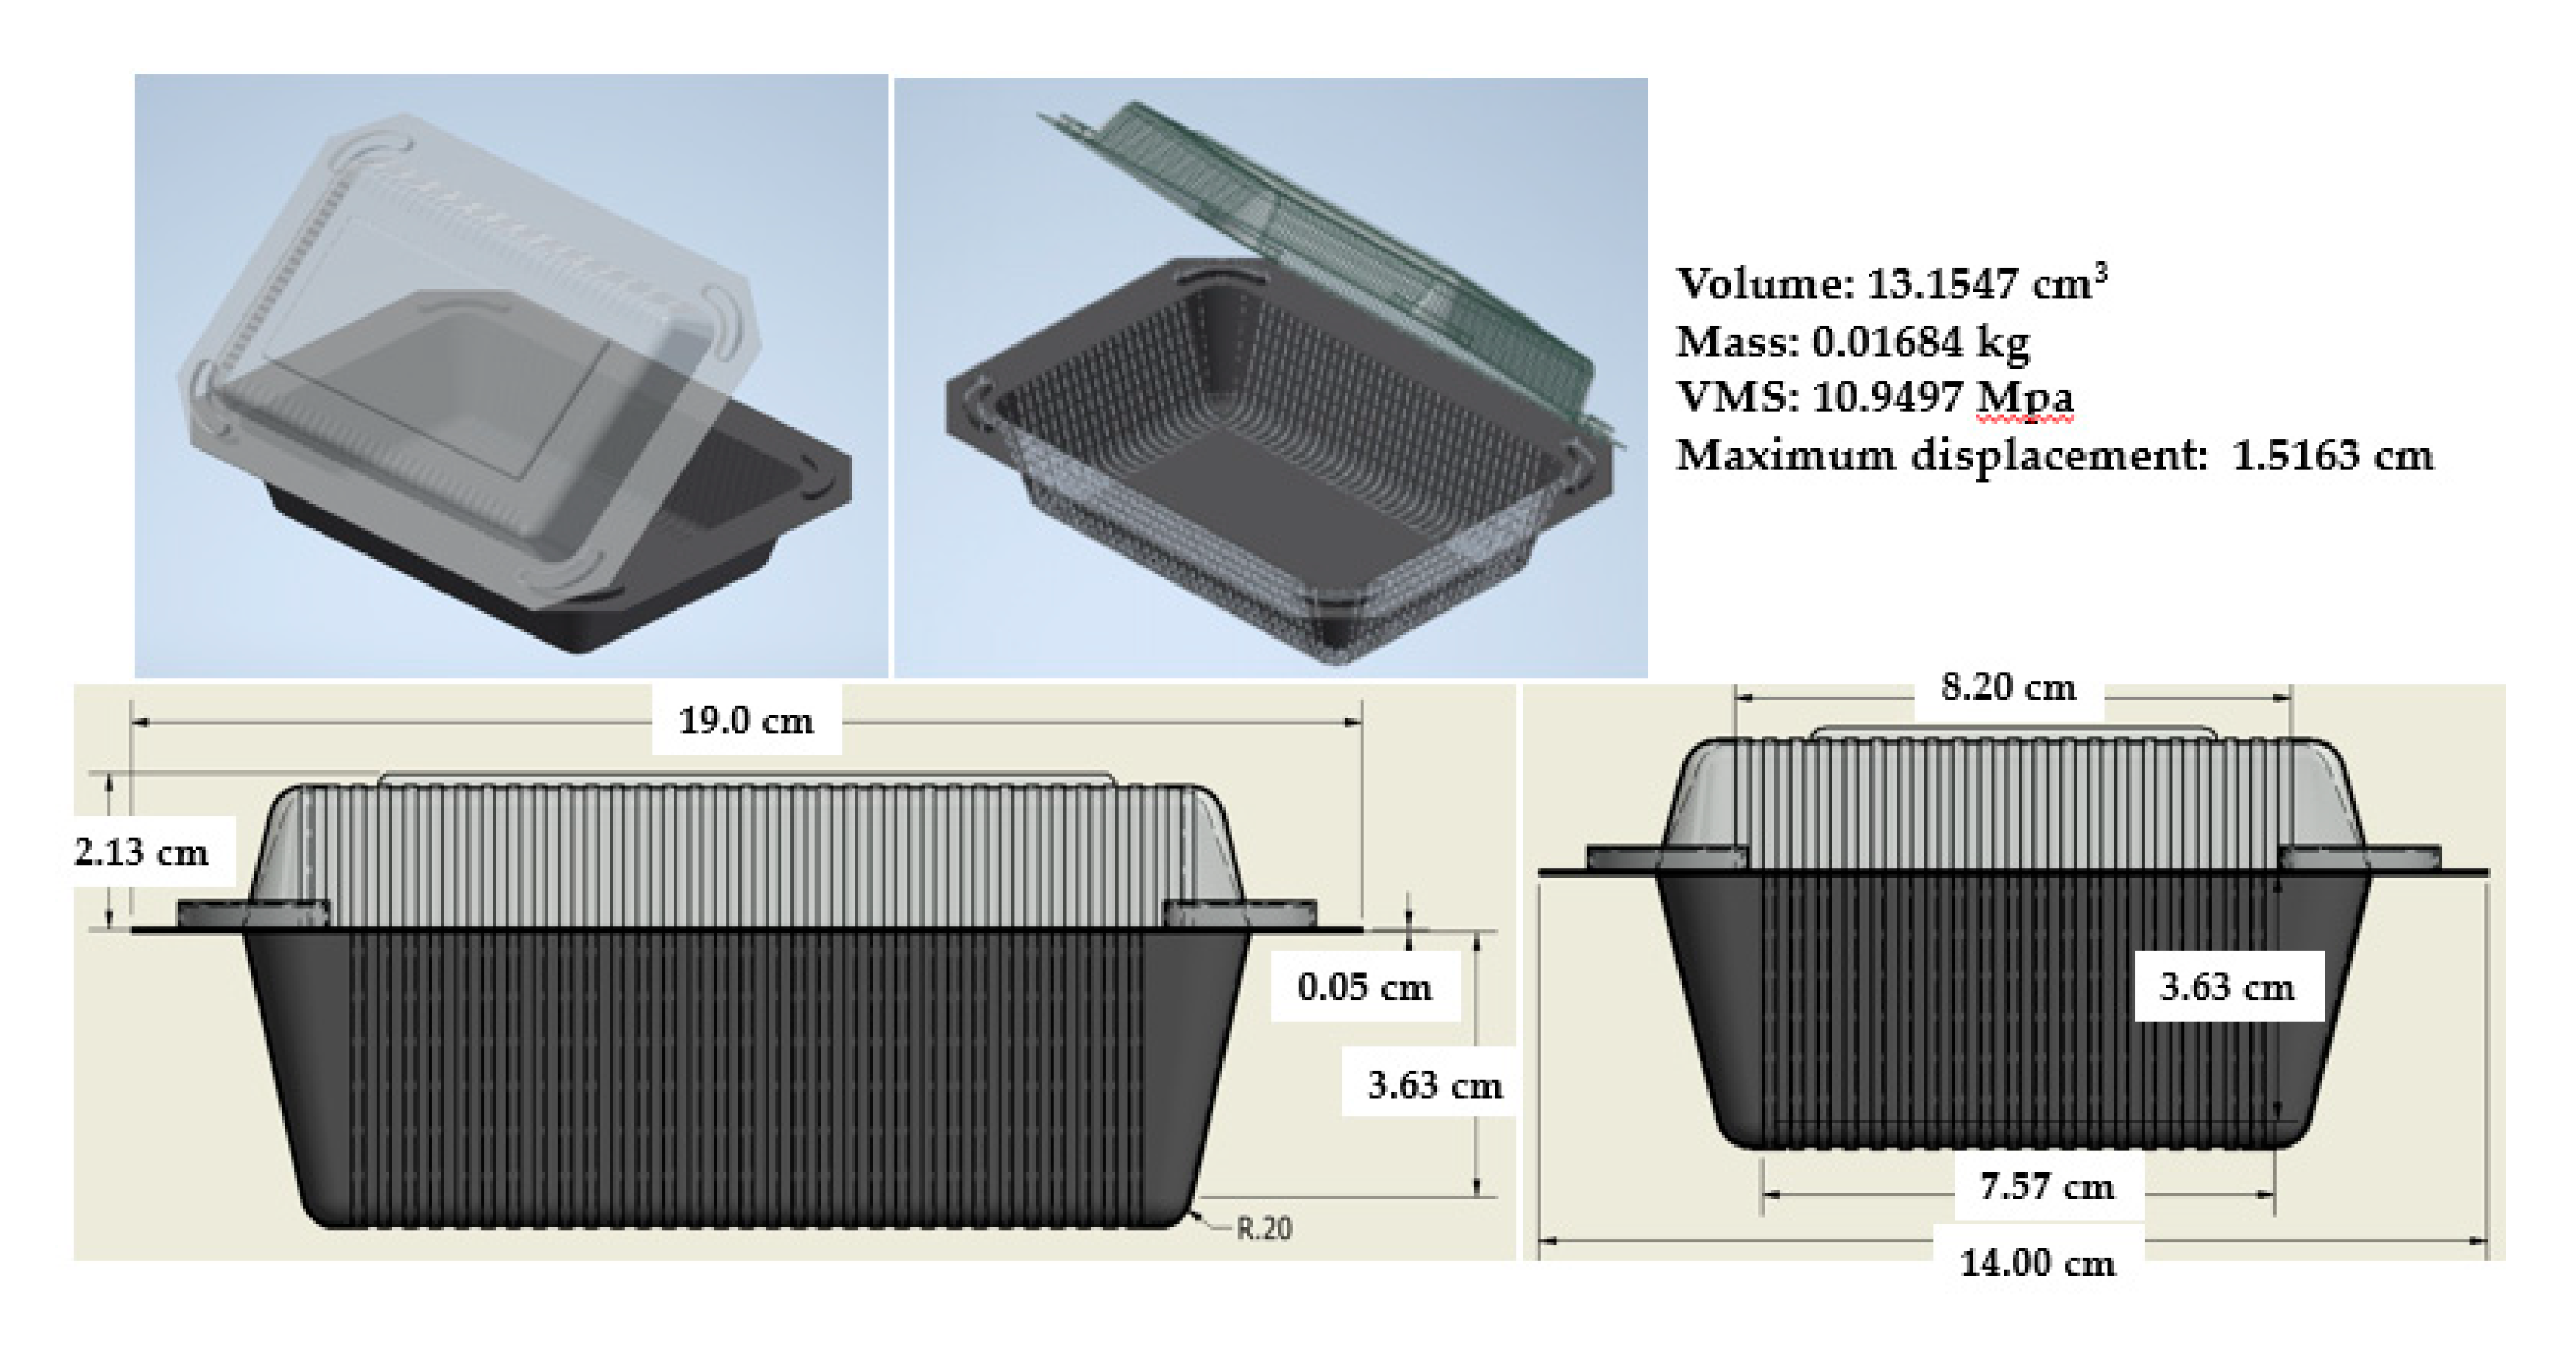
The study aimed to assess the environmental damage in the life cycle of natural fiber sago starch biocomposite takeout food containers by performing attributional LCA (A-LCA). The container’s final concept design had a maximum capacity of 13.155 cm3 and weight of 0.01183 kg. Figure 1 depicts the dimensions of the final conceptual design selected in the authors’ concept design work. The functional unit (FU) defined in this study was a parcel containing 1 kg (85 pcs) of equal dimension SPF-reinforced sago starch composite takeout food container. An FU is described as the functional requirements of a product system for a certain period, enabling different systems to be regarded as functionally equivalent for direct comparison analysis [20]. According to Lorite et al. [13], FU can also be understood as a reference unit representing the level of performance of the product system.
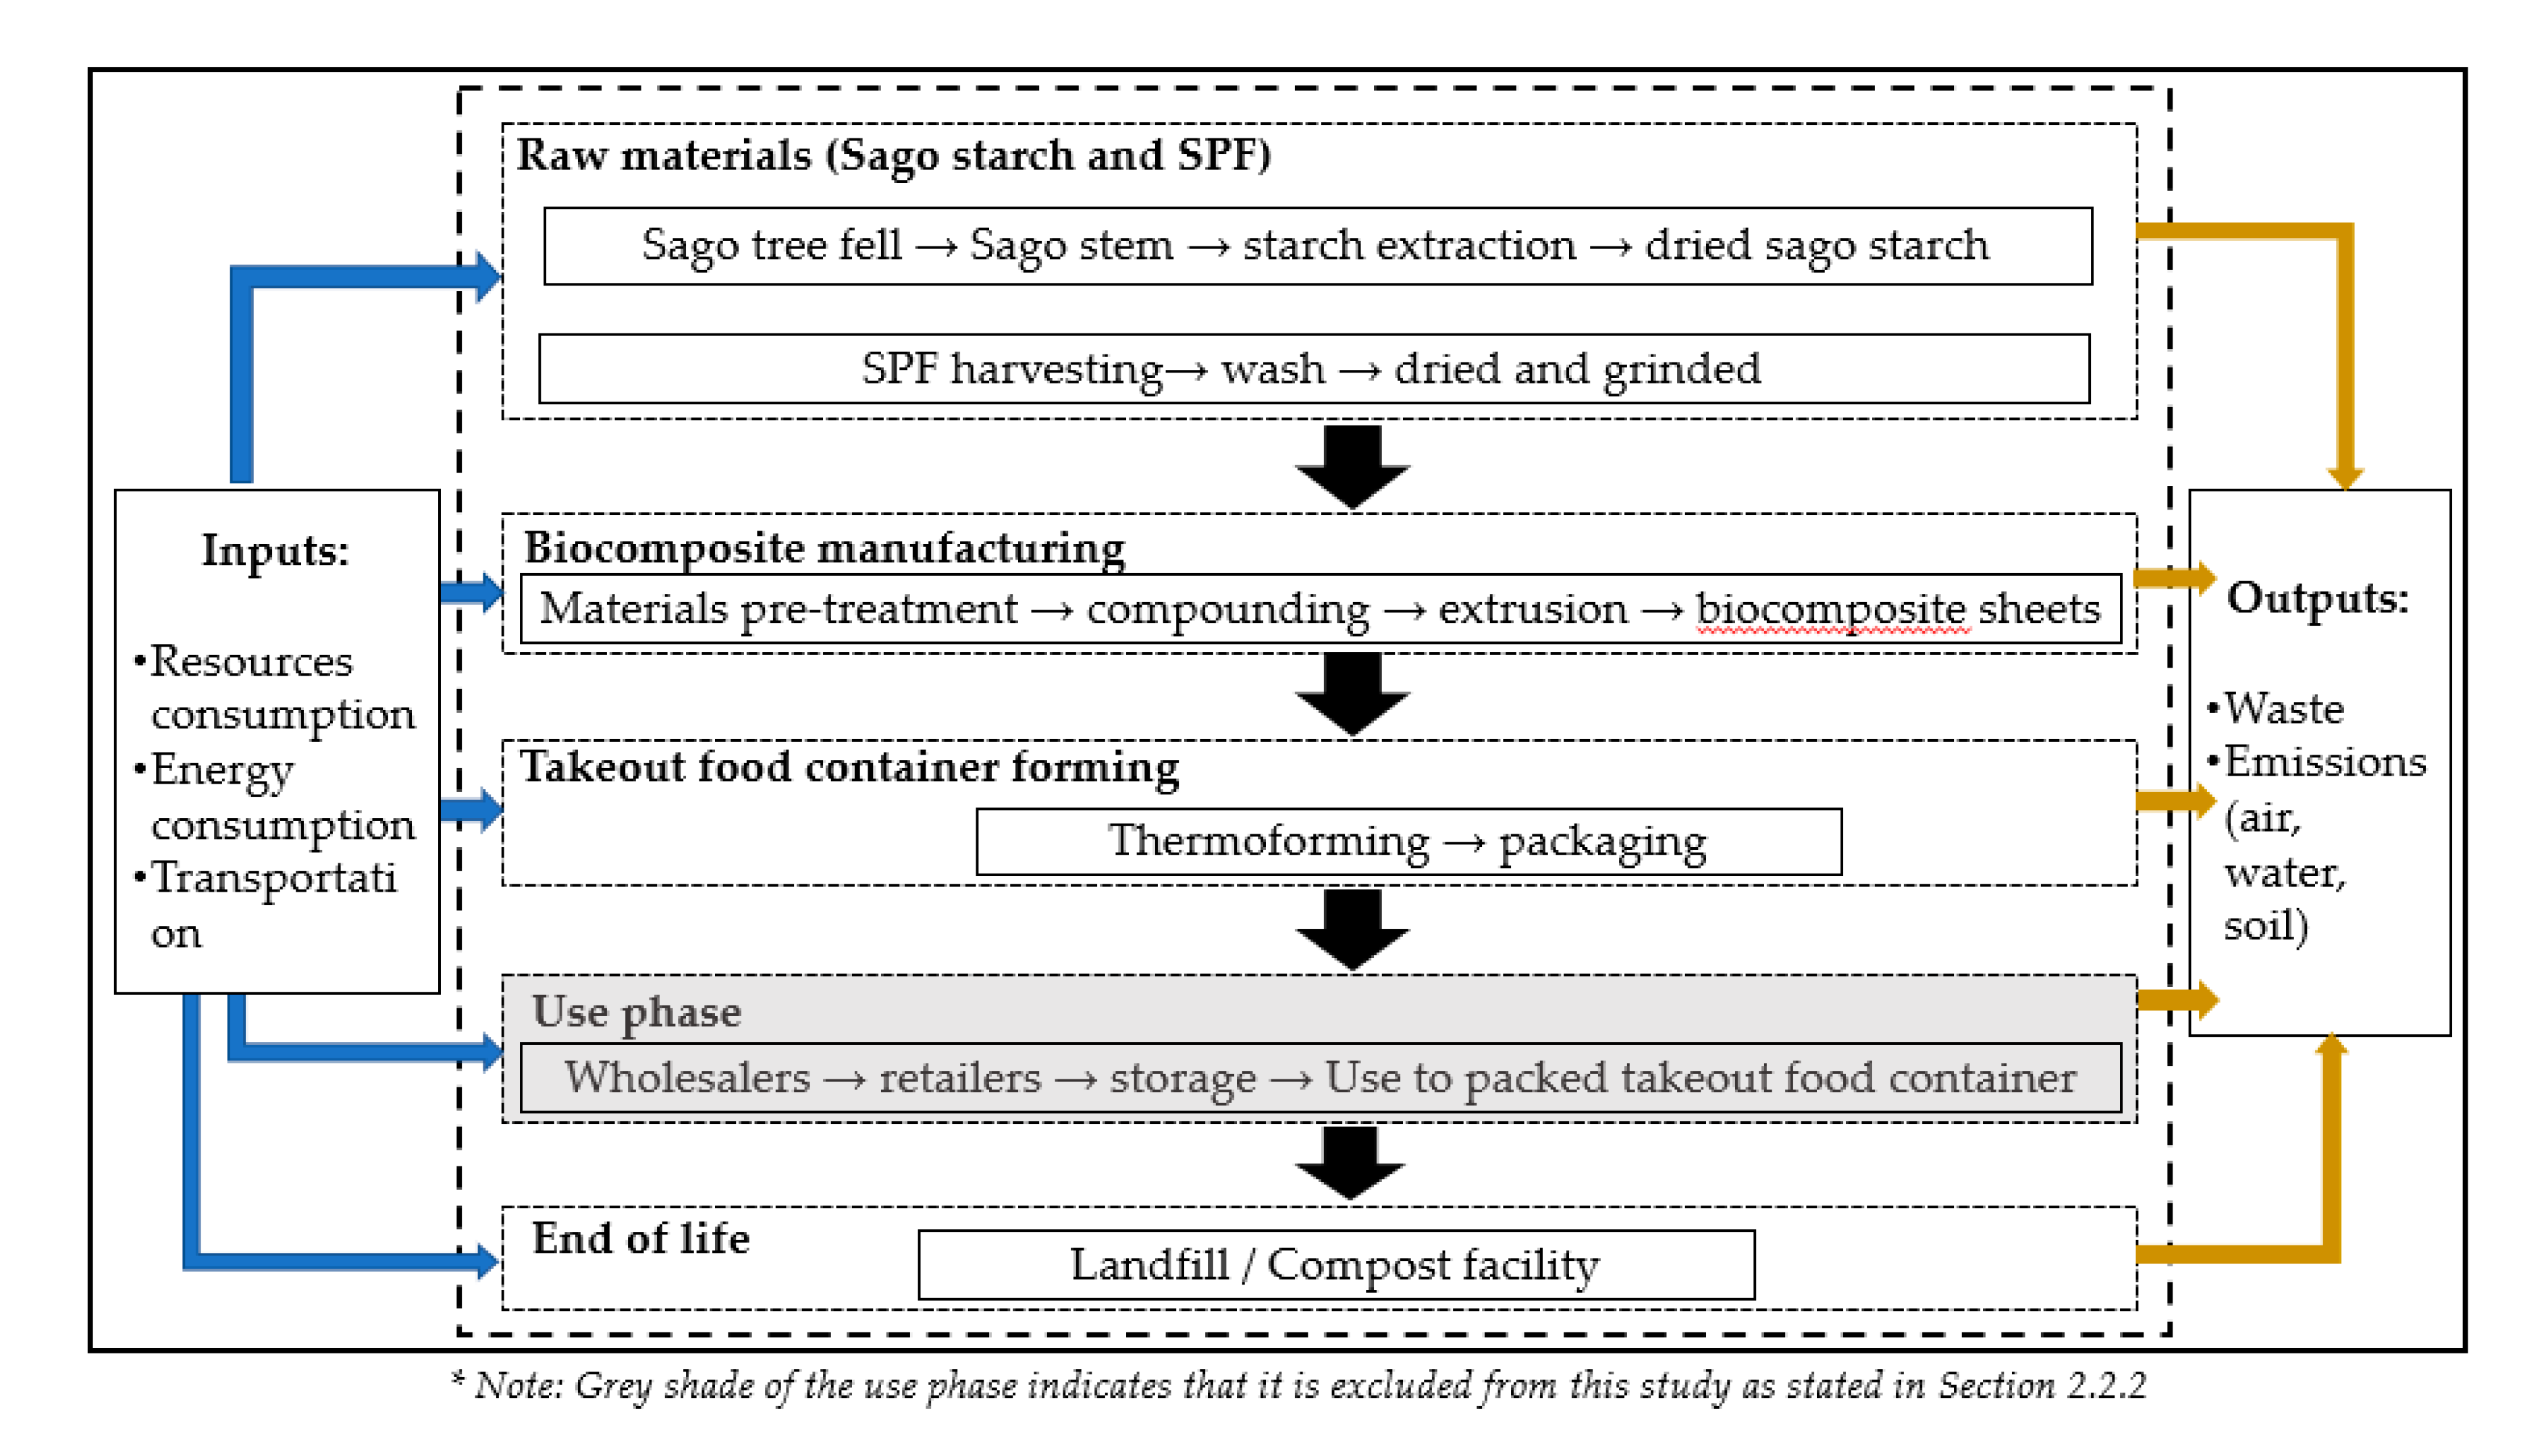
The life cycle began with sago stem harvesting from sago tree felling, and SPF collected from sugar palm trees. These raw materials were sent to the mill for further processes, i.e., sago starch extraction, SPF washing, and grinding. Next was the compounding process to produce biocomposite resin. The composite resin was then extruded into sheets that underwent a thermoforming operation and converted into the designed containers [5]. After consumption, the containers reached the end-of-life stage and ended up in a landfill/composting facility. The system boundary would implicitly describe what is included and what is excluded from the analysis [21]. Generally, system boundaries include manufacturing, delivery, and disposal [22]. The first phase considered in this study was the production and supply of the raw materials required to manufacture 1 kg of the SPF-reinforced sago starch biocomposite takeout food containers. The system boundary under investigation is represented in Figure 2.
2.2. Data and Data Quality Requirements (Sources and Geography)
As a standard practice in the LCA study, secondary data were extrapolated from international databases of scientific importance and reliability. In particular, the processes used for representing the resources, materials, and energies consumed (fuels included), and the road and transportation means utilized, were extrapolated from databases (Ecoinvent 3, Agri-footprint and US Life Cycle Inventory database (USLCI) available in the SimaPro software.
2.2.1. Production Processes
Inventory data were taken from the literature, including electricity and diesel consumed during the raw constituents’ materials harvesting and pretreatment processes that were also included in the data of transportation of sago starch and SPF from the mills to the containers’ manufacturer gate. Byproducts of sago starch production such as sago stem, pith, and pulp [23] were considered as biomass that has zero or no environmental burden, where they can be useful in agricultural applications, e.g., reduction of soil acidity or utilization as animal feed [24]. LCI data sources used to model the processes involved in fabricating the biocomposite and thermoforming process of the takeout food container were adopted from Mahalle et al. [25].
2.2.2. Consumption Stage
The use stage of the green biocomposite containers, which includes the transfer of containers to the market through wholesalers and retailers, storage during distribution and use to pack takeout food sold by food sellers, was excluded from the study. This was aligned with the “Product-Category Rules (PCR) for Preparing an Environmental Product Declaration (EPD) for Food Contactable Plastic Containers”, where the environmental impact during this stage is likely insignificant [11].
2.2.3. Distances and Transportation
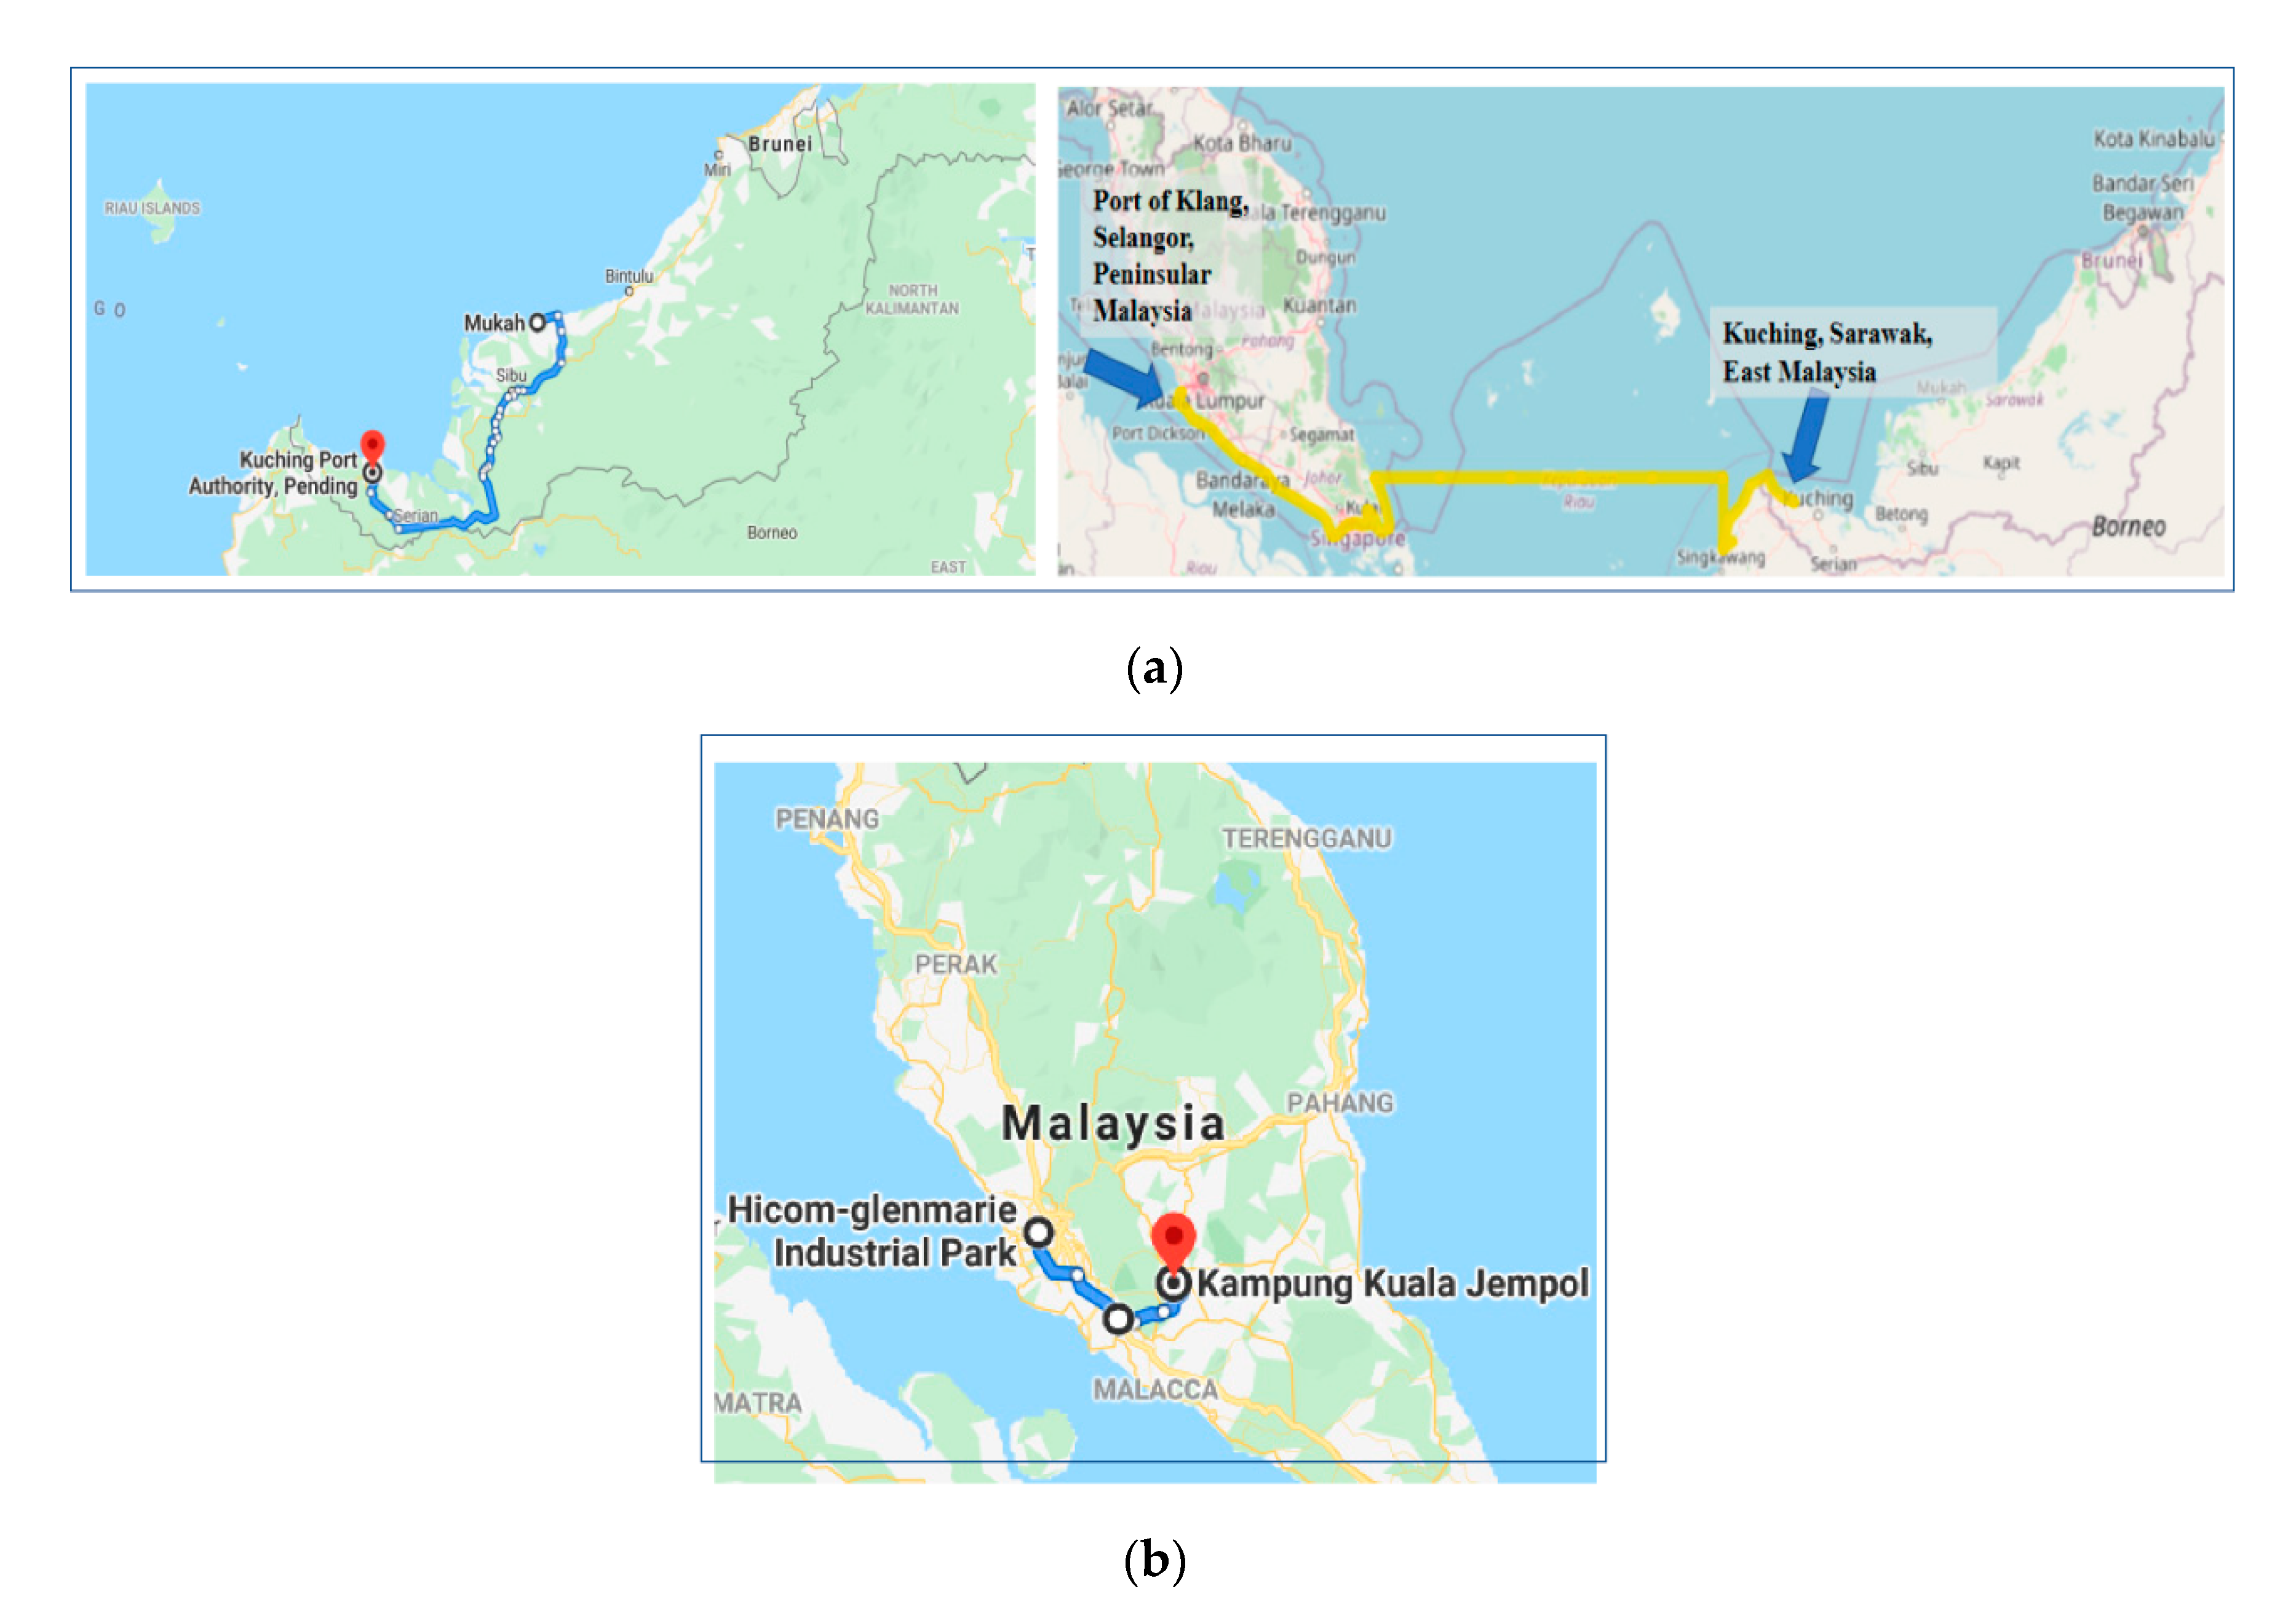
Raw constituent materials of the green biocomposite were sago starch and SPF. Sago starch was assumed to be produced by a mill in Mukah, Sarawak, in East Malaysia [26], while SPF was harvested and processed in a mill at Kampung Kuala Jempol, Negeri Sembilan, Malaysia [27]. Sago starch from Mukah was transported by trucks to Kuching port before being shipped to Port of Klang in Peninsular Malaysia before delivered by trucks to composite manufacturing gate in Glenmarie, Shah Alam, Selangor. The containers’ manufacturer was presumed to be in the same location, i.e., Glenmarie Shah Alam. The routes of the transportation included are depicted in Figure 3. The data for all transportations involved were obtained from the Ecoinvent database in SimaPro.
2.2.4. End-Of-Life Stages
In Malaysia, 95% of collected wastes are disposed of in landfills, and various reports mentioned that dumping and landfilling are the main disposal methods in many countries [28]. The after-use of green biocomposite takeout food containers produced organic wastes in nature because of their fully biobased elements, and therefore, composting would be an excellent option. Johari et al. [28] reported that composting is one of the most cost-effective and sustainable waste management options as it enables the recycling of potential plant nutrients. Composting gives benefits to many agricultural activities such as farming productions, horticulture, and in some cases, for land restoration. Nevertheless, composting is not carried out on a large scale and is rarely practiced in Malaysia, even though compost is priced from RM180 to RM1000 per ton, depending on its quality [28]. Organic waste produced from the analyzed SPF-reinforced sago starch biocomposite takeout food container is assumed to have great potential for high-quality compost and generates revenue. For this reason, this study took into consideration both landfills and composting for end-of-life scenarios. Due to the data constraint of the composting practice that was relatively uncommon in the past LCA study [8], this analysis was extrapolated data from a study by Khandelwal et al. [29], where 17% of the disposed containers were sent to composting and another 83% to landfill. The overall data used to analyze the cradle-to-grave of the SPF-reinforced sago starch biocomposite takeout food container are shown in Table 1.
2.3. Life Cycle Impact Assessment (LCIA)
The life cycle assessment (LCIA) phase was carried out based on a limited set of impact categories for all the output flows quantified in the LCI phase. They were grouped into damage categories, namely environmental compartments suffering the damage caused by the product in its life cycle. The assessment was drawn-out to the end-point approach to understand the degree of damage and understood that there would be high uncertainties in the damage characterization [34]. Associated environmental impacts in system investigation could quantitatively be represented with all the included materials and processes. Thus, most impacting ones could be highlighted. The damaging impact was assessed based on three damage categories at the end-point level by utilizing the ReCiPe method, the most common method in SimaPro software [35]. The end-point factors of characterization used in the ReCiPe method are described as follows: 1. Human health: stated as the number of years life lost and the number of years lived disabled and termed as disability adjusted life years (DALYs), an index used by the World Bank and World Health Organization (WHO). DALYs measure the difference between an ideal situation in which everyone lives to the standard life expectancy in perfect health and the actual situation. The metric is a combination of the years of life lost (YLL) due to premature mortality and the years of life lost due to disability (YLD) when living with the disease or its consequences: DALY = YLD + YLL [36]. The DALY unit is defined by WHO measured from ‘0′ for no effect or safe, ‘0.67 and above’ for danger or critical, and the value of ‘1′ for fatal damage or death [37] or generally “0” indicating indifference between the health state and full health and “1” indicating indifference between the health state and death [38,39]; 2. Ecosystems: expressed as the loss of species over a particular area during a specific time. It also includes altered pH, nutrient availability, and concentration in soil. The formula to calculate the damage to ecosystems is (plant species (%) × affected area (m2) × number of production years), known as ecosystem damage potential (EDP), and the unit is species.year; 3. Resources scarcity: represented in surplus costs of future resource production over an infinitive time frame (assuming constant annual production), considering a 3% discount rate. The unit is USD ($) [37].
3. Results and Discussion
According to the established FU, the analyzed product system showed that 47.4% would impact the human health category, 49.3% and 3.38% were for the resources and ecosystem categories, respectively. The major contributor to damage was electricity (66.9%) used in the pretreatment processes of raw materials and manufacturing of the SPF-reinforced sago starch biocomposite takeout food container. Electricity was also being consumed for the waste portion end-up in the composting facility.
Damage assessment for a cradle-to-grave life cycle of the 1 kg sugar palm reinforced sago starch composite takeout food container was analyzed by applying the ReCiPe Endpoint method, excluding long-term emissions. The purpose of damage assessment was to combine several impact category indicators into a damage category. Damage impacts, and its impact categories, are arranged in Table 2. Climate change human health was the highest contribution in human health damage with a value of 1.58 × 10⁻⁵ DALY. For ecosystem damage, the impact category of the climate change ecosystem contributed to the highest among all other categories with the value of 8.97 × 10⁻⁸ species.yr. Whereas, fossil depletion was the higher contributor to the resources scarcity category than metal depletion with the costs of $0.486 and $0.00493, respectively. However, in this paper, the resources damage category will not be further discussed.
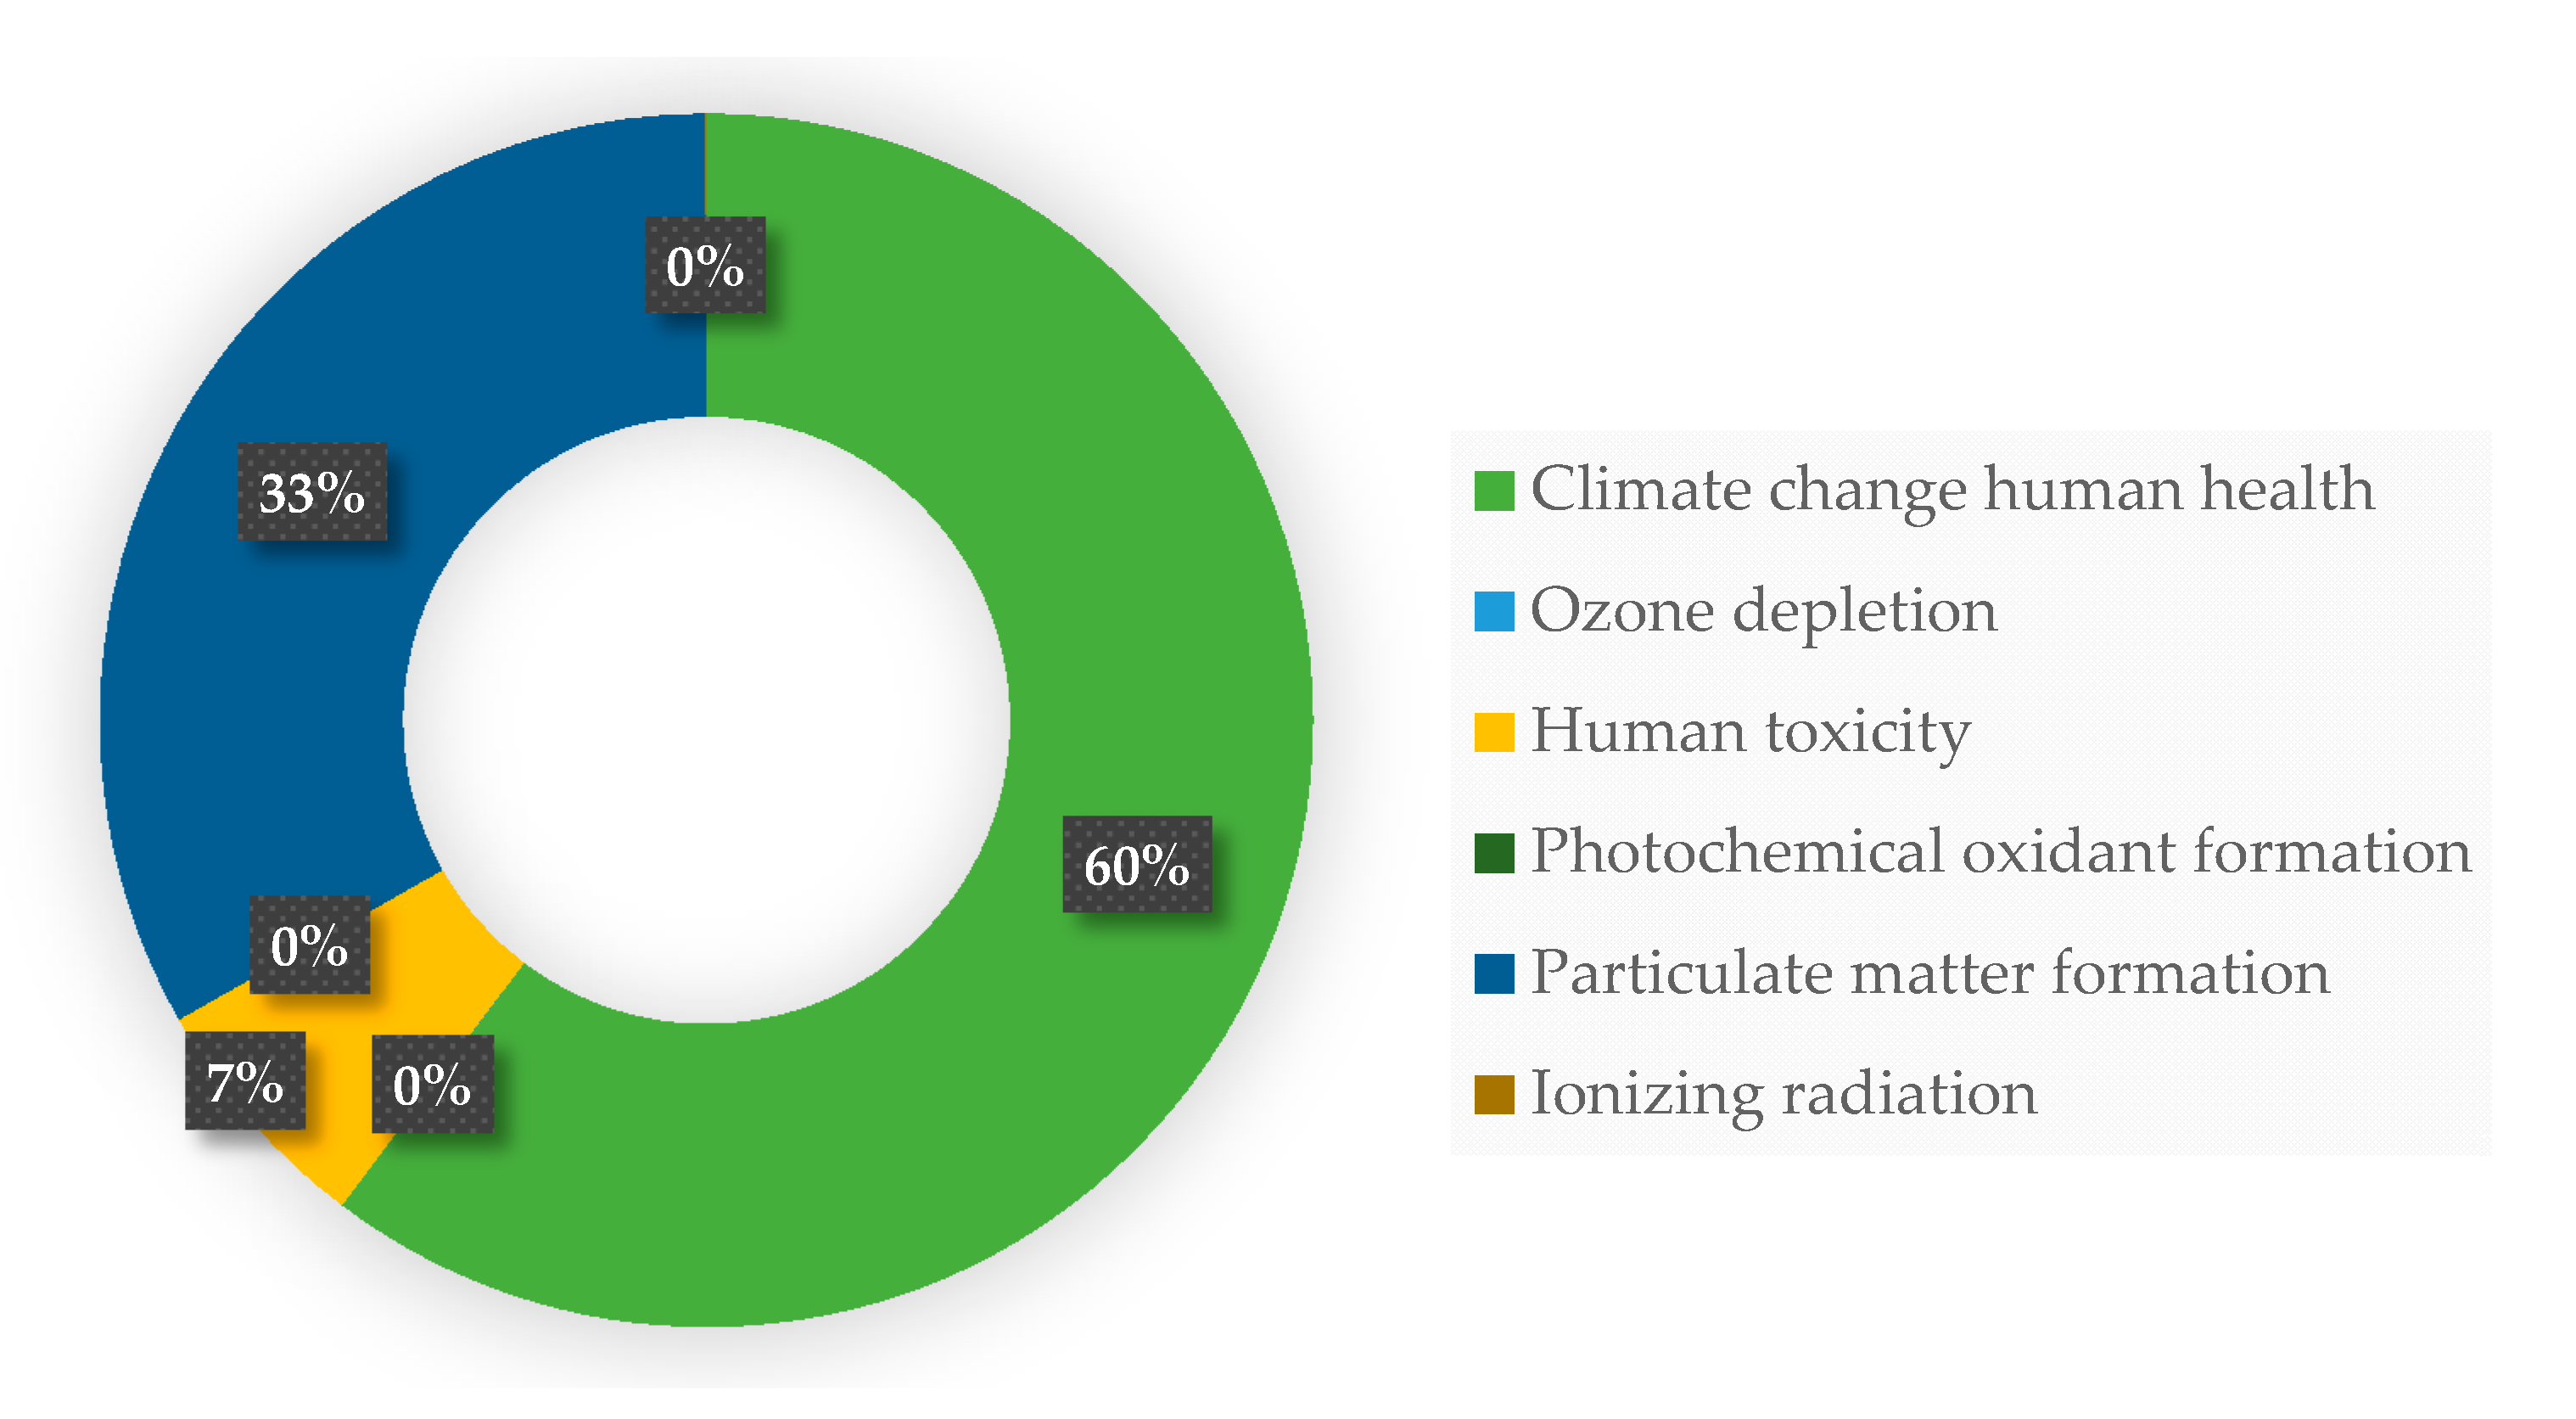
Contributions of each impact category to the total human health damage (DALY) is shown in Figure 4. Climate change human health was the largest portion (60%), and particulate matter formation was the second largest contributor of 33%, and human toxicity contributed to the remaining by 7%. The other impact categories were extremely low and can be assumed to not impact the total DALY.
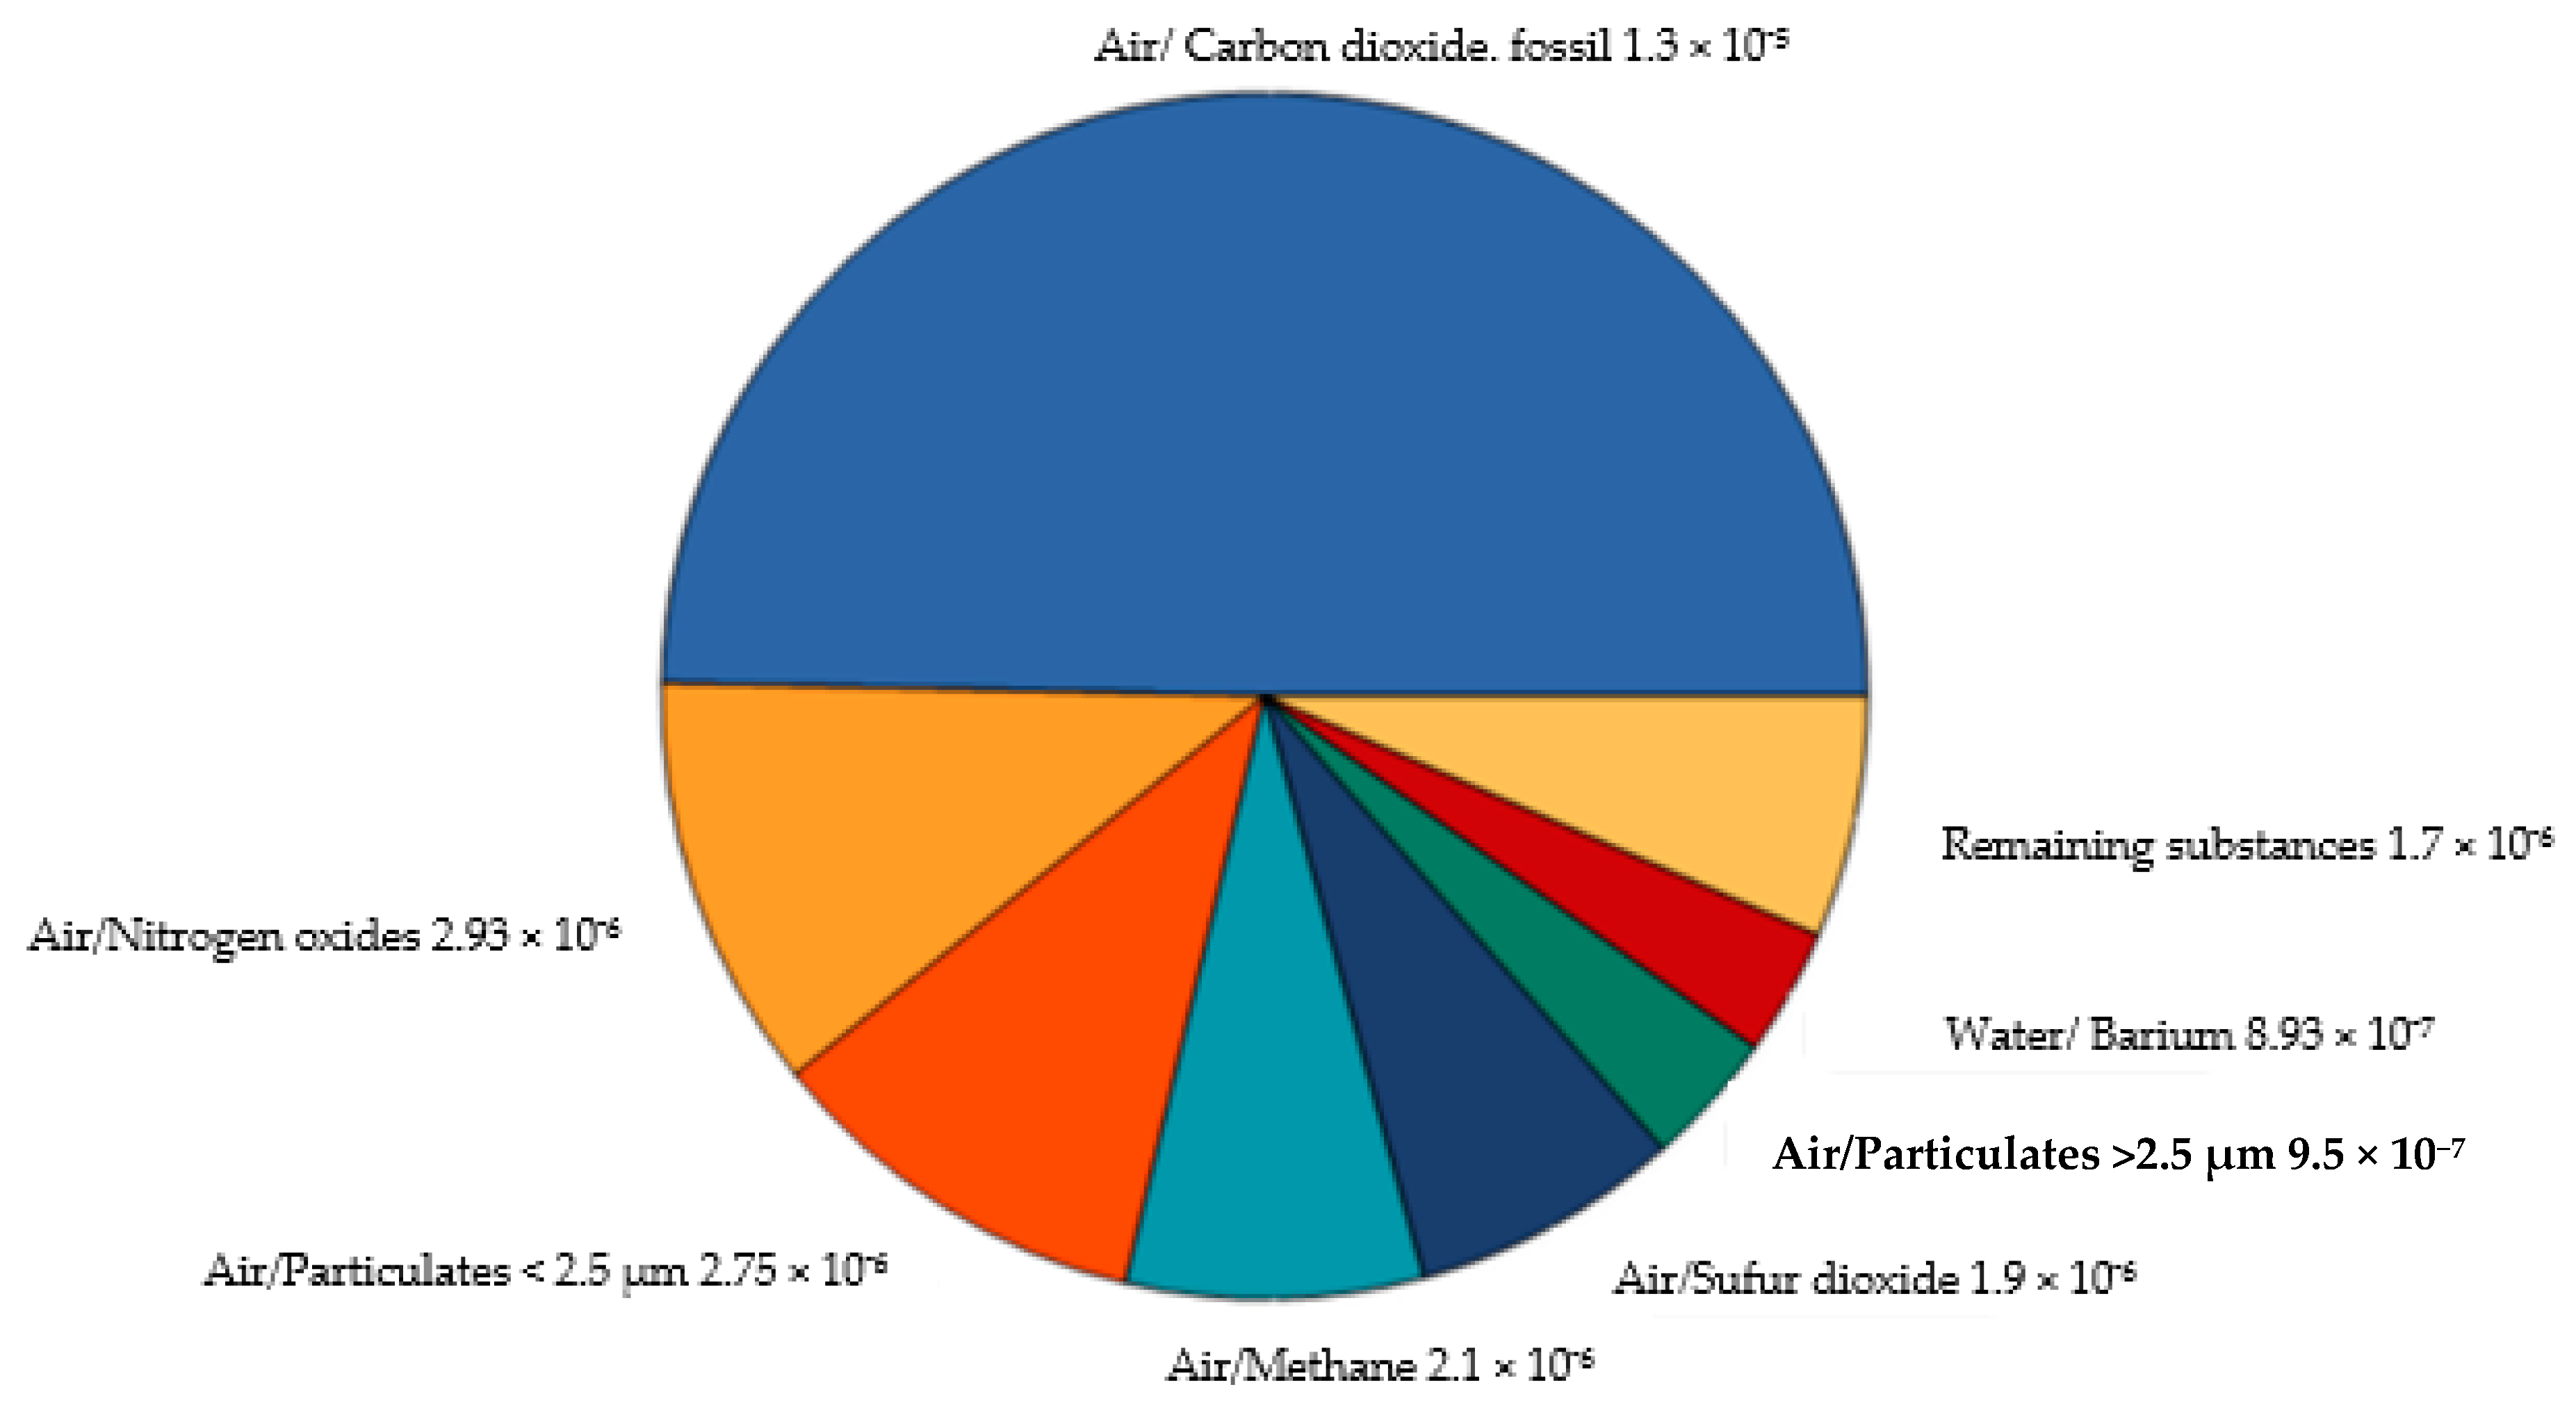
The chart in Figure 5 represents the substances contributing to the human health damage impacted from 1 kg of SPF-reinforced sago starch biocomposite takeout food container. The result showed that air/CO2 contributed to the major portion, but the score was only 1.3 × 10⁻⁵ DALY per 1 kg SPF-reinforced sago starch biocomposite takeout food containers. Yusof et al. [37], too, obtained similar results where CO2 contributed the most, but the value was 0.0125 DALY for their study on the LCA of hybrid oil palm/glass fiber-reinforced polyurethane composites for the automotive crash box (ACB). Even though this result was not an accurate comparison because of its entirely different product system studied, but the two figures showed how much CO2 was being released from the system, and the metric in this study was much lower. The next largest contributor was air/nitrogen oxides of 2.93 × 10⁻⁶ DALY, followed by air/particulates <2.5 µm of 2.75 × 10⁻⁶ DALY, air/methane of 2.1 × 10⁻⁶ DALY, air/sulphur dioxide of 1.9 × 10⁻⁶ DALY, air/particulates >2.5 µm and <10 µm of 9.5 × 10⁻⁷ DALY, water/barium 8.93 × 10⁻⁷, respectively and other remaining substances (less than 2% contribution) of 1.7 × 10⁻⁹ DALY, for 1 kg of containers.
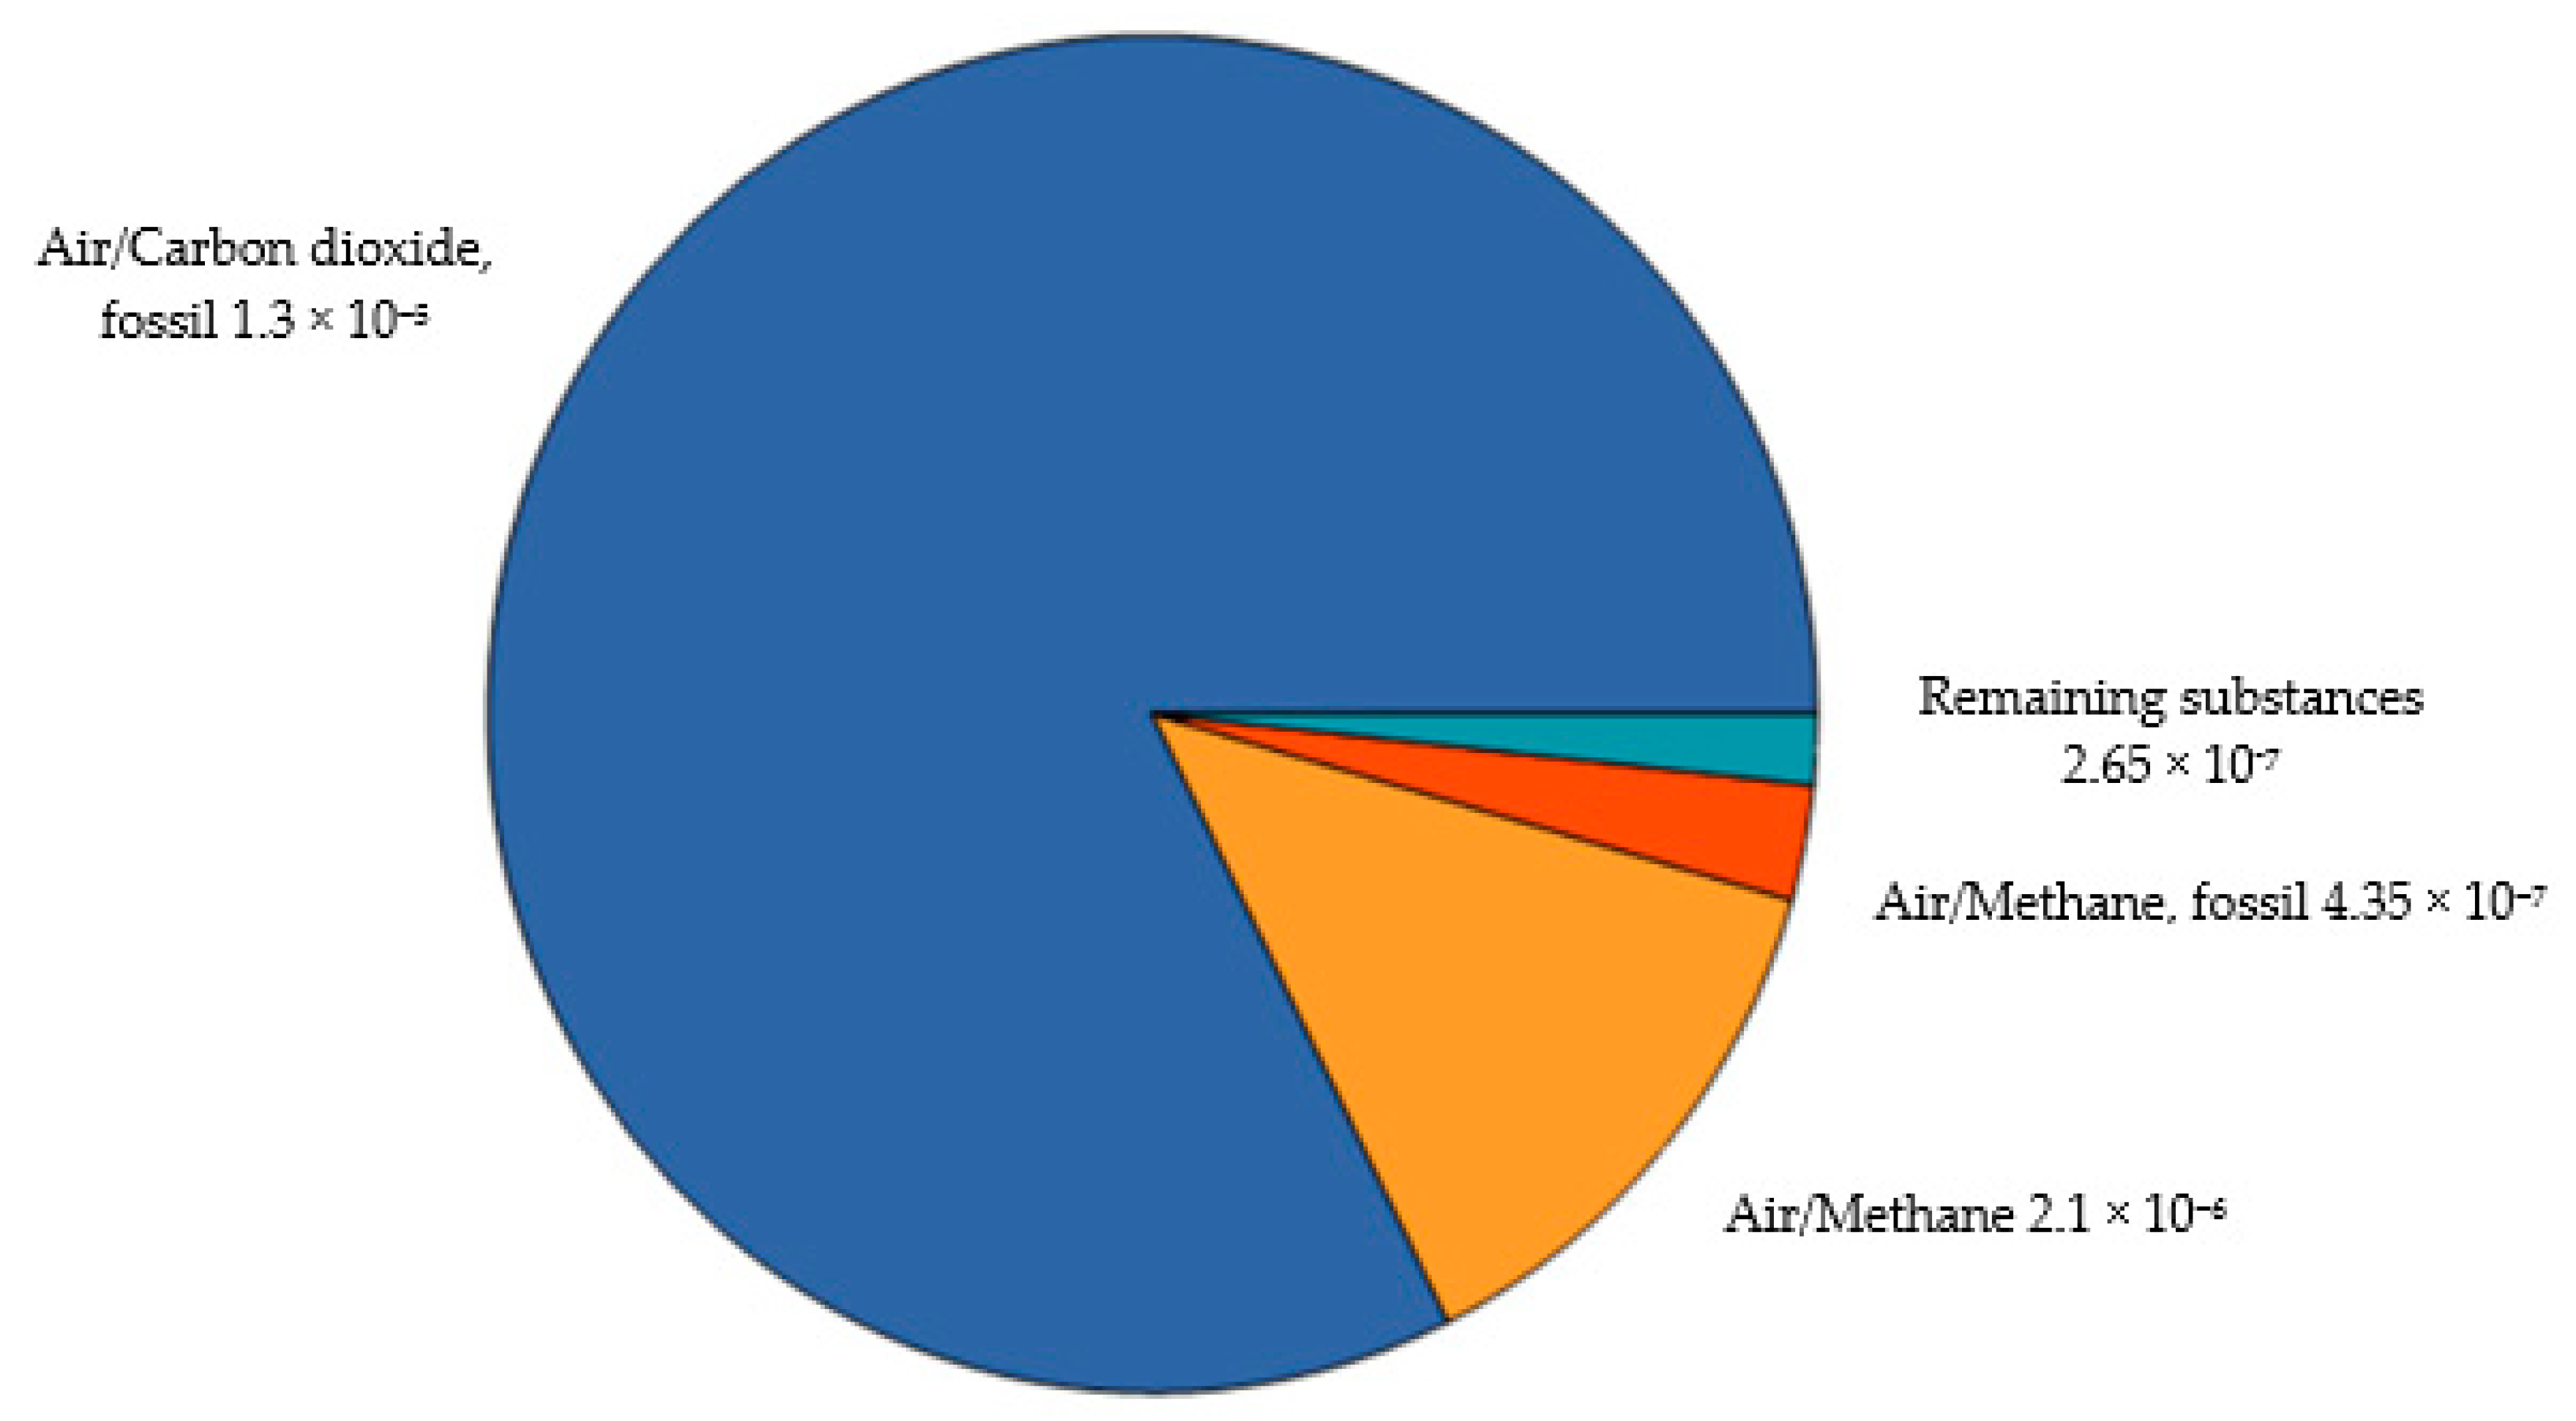
Human health could be affected by heat and heatwaves due to climate change that is understood as the modification of the natural environment. It affects the functioning ecosystems in terms of the quantity and quality of functions with a beneficial role for human physical health [40]. The outdoor air quality associated with climatic factors and changes in wind affects the distribution and level of associated health burdens, including respiratory, cardiovascular, and infectious diseases [41]. Figure 6 shows the elements released, which contributed to the climate change and affecting human health. Air/carbon dioxide, fossil was the major release of 1.3 × 10⁻⁵ DALY per 1 kg of containers. Air/methane of 2.1 × 10⁻⁶ DALY and air/methane, fossil of 4.35 × 10⁻⁷ DALY were also emitted. Accumulative of 2.65 × 10⁻⁷ DALY per 1 kg of containers came from other elements emitted from the system.
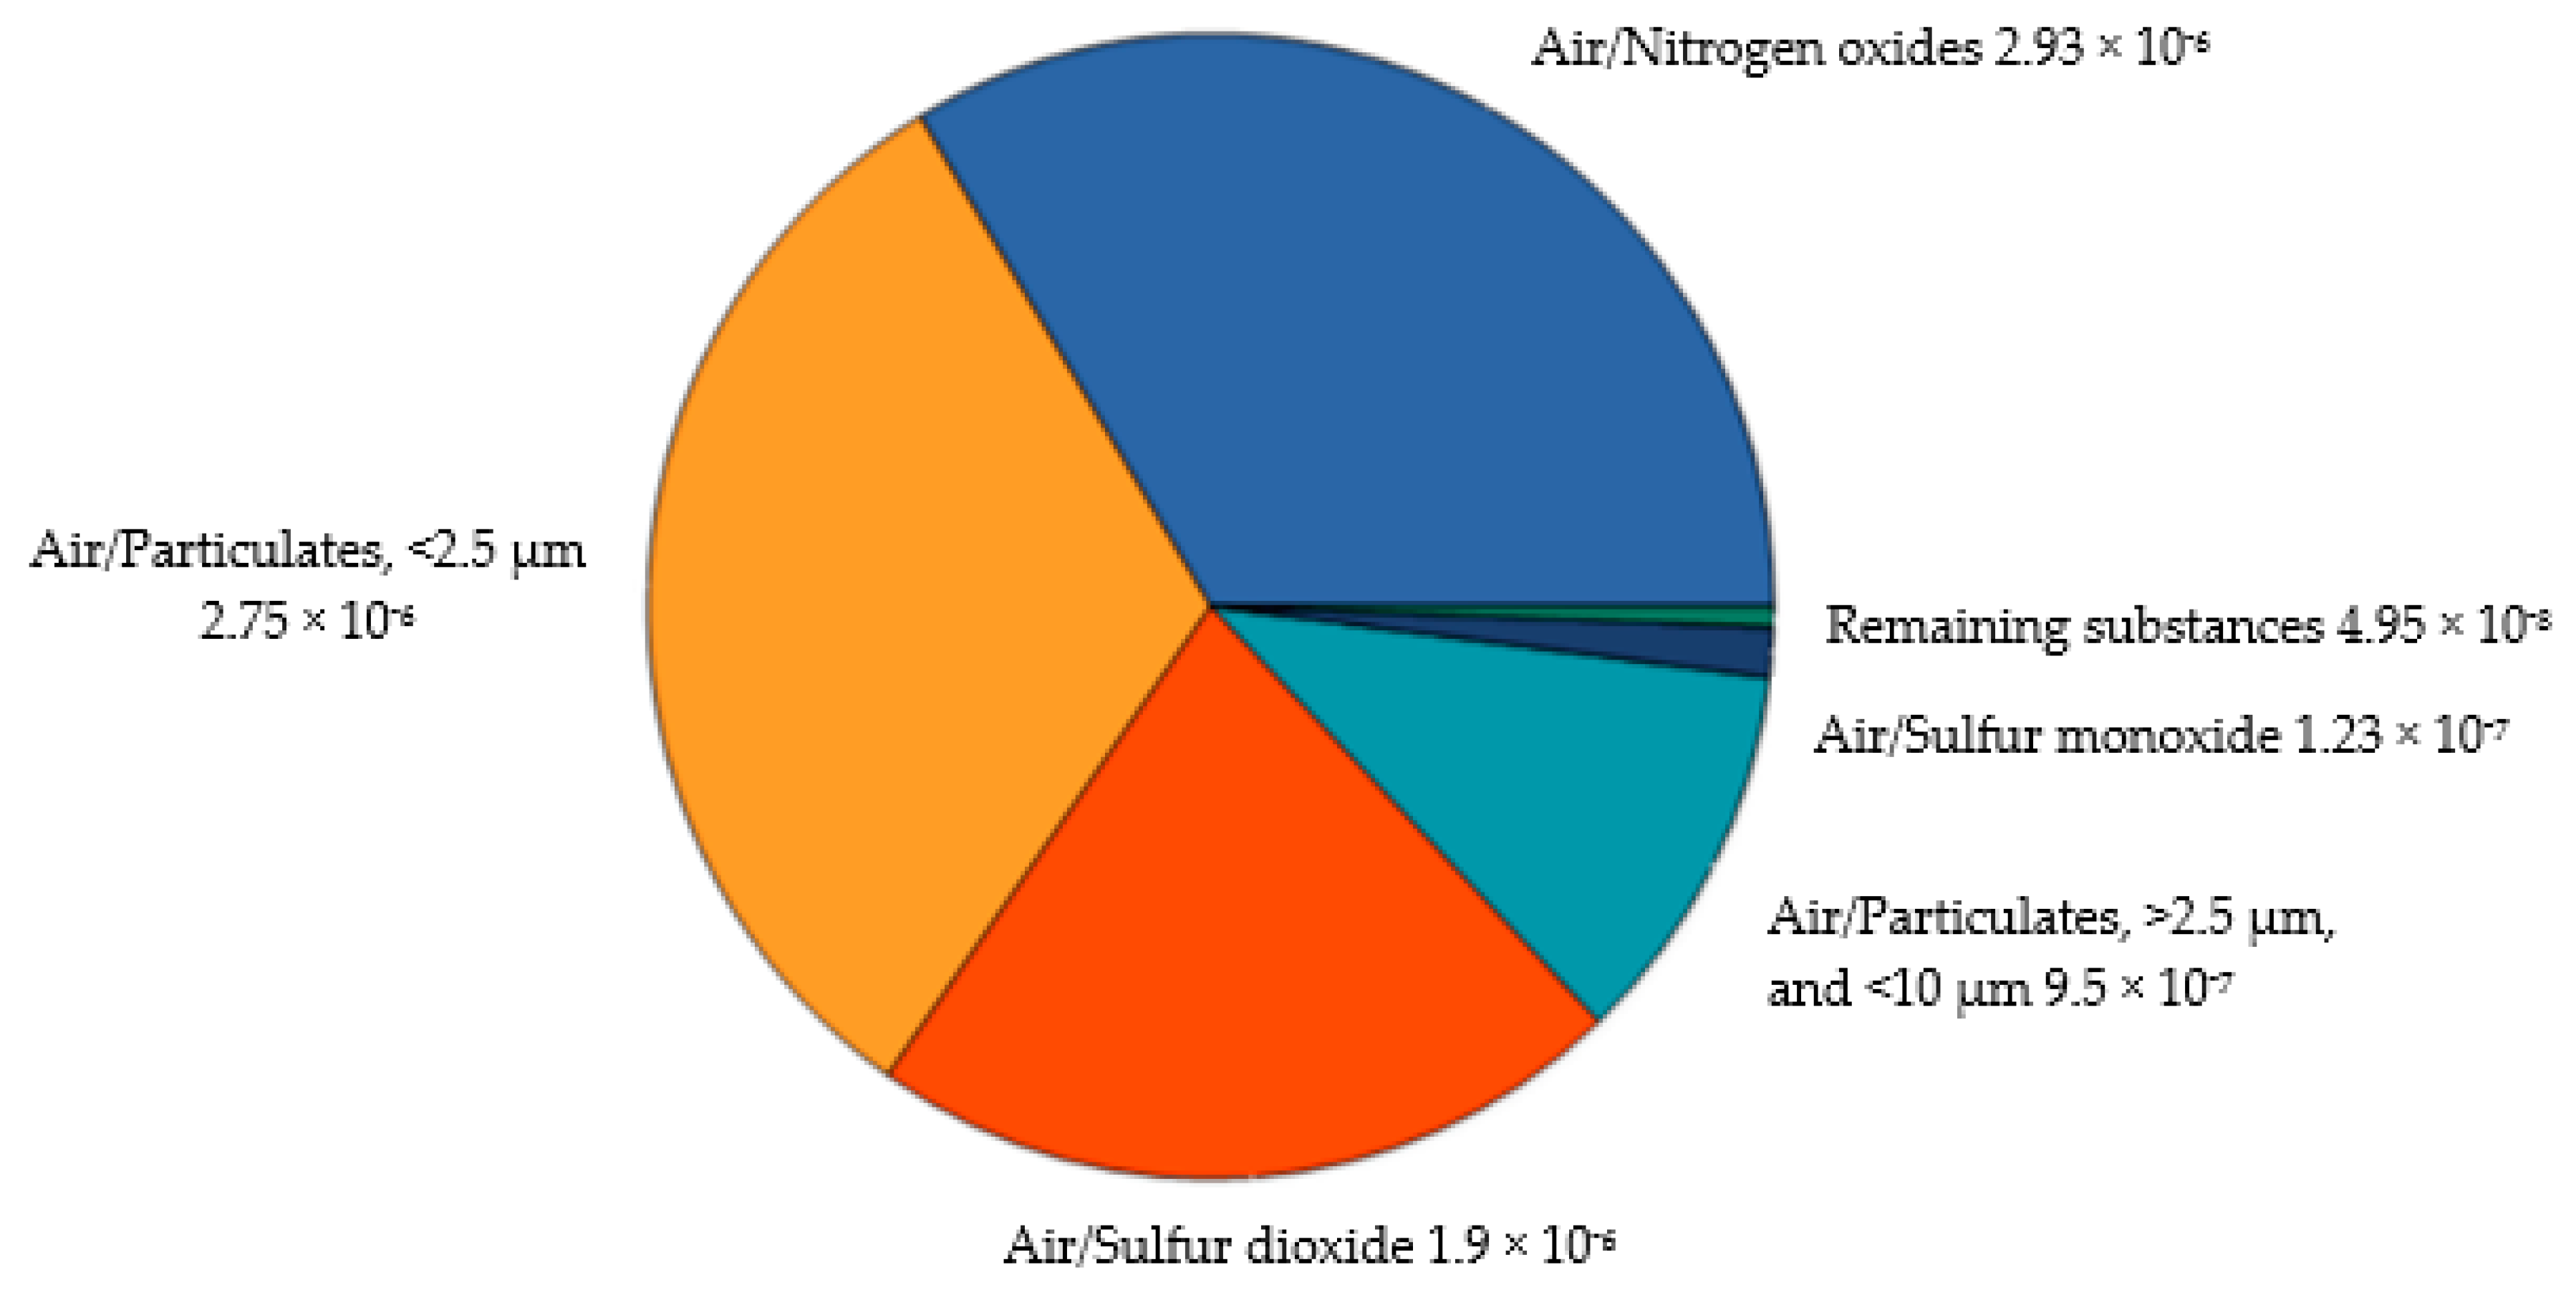
Particulate matter formation impact category was the second-highest element under the human health damage category with a metric of 0.87 × 10⁻⁵ DALY per 1 kg of containers. Particulate matter (PM) is a solid particle or liquid droplet present in the atmosphere and is also called an aerosol. Anthropogenic sources of PM include smog, fly ash, chemical mist, etc., and their suspension in the atmosphere in large concentrations is known as air pollution. Inhaling PM could cause bad effects on human health because they are easily deposited in the respiratory tract and lungs. Respiratory diseases are caused by PM deposition, especially in the alveolus and in the case of carcinogenic PM, the tissue could become cancerous [42]. Nitrogen oxides (NO), sourced from combustion, rapidly react with ozone or radicals in the atmosphere, forming NO2 [43]. Sulfur dioxide (SO2) is too produced from fossil fuel combustion, especially combustion processes for energy production and road transportations [43]. Whereas the particles’ size determines their deposition site in the respiratory tract, <2.5 µm particles are able to reach lungs alveoli. Exposure to increased levels of SO2 would give symptoms of nose and throat irritation, followed by bronchoconstriction and dyspnea, especially in asthmatic individuals [43]. Figure 7 shows the results of particulate matter formation impact assessment for the product system. Air/nitrogen oxides, air/particulates, <2.5 µm, and air/sulphur dioxide contributed to the major damage with the metric of 2.93 × 10⁻⁶ DALY, 2.75 × 10⁻⁶ DALY, and 1.9 × 10⁻⁶ DALY per 1 kg of containers, respectively. The DALY metrics for the three major elements though were below that of 0.00001 DALY.
Another impact category analyzed was human toxicity, and human toxicity potential is the potential harm of a unit of chemical released into the environment. Toxicity is represented by the cancer potential for carcinogens and the safe dose for non-carcinogens [44]. From the system, Figure 8 depicts the substances that contributed to human toxicity assessment. Water/barium dominated more than half of the portion with the index of 8.93 × 10⁻⁷ DALY, and air/iodin, 2,3,7,8 tetracholodibenzo-p- was the next largest slice of 4.37 × 10⁻⁷ DALY per 1 kg of containers. Barium enters the air during refining processes and coal and oil combustion, and its compounds that dissolve in water can be harmful to human health. Extraordinarily large amounts of barium that are water-soluble may cause paralysis and even death [45]. Nevertheless, the common amount of barium found in food and water is typically low and not harmful to human health. Workers in the barium-related industry have a higher risk of barium exposure [45]. While iodin, 2,3,7,8 tetracholodibenzo-p-dioxin (TCDD) is produced from burning or heating of commercial, and it might affect the reproductive system when excessively exposed [46]. Lymphoma and stomach cancer are also associated with exposure to large amounts of materials contaminated with TCDD.
Ozone depletion had the lowest contribution to human health damage assessment. Figure 9 shows the results of the ozone depletion damage assessment of the system for takeout food containers made of SPF-reinforced sago starch composite. Earth’s stratospheric ozone layer losses to chlorofluorocarbons (CFCs) and other ozone-depleting substances, such as greenhouse gases (N2O and CH4) [47]. Depletion of stratospheric ozone leads to an increase of ultraviolet radiation on the Earth’s surface and affects human health, such as skin cancer (melanoma), eye cancers (cornea and conjunctiva), and affecting immunity and causing infection [48]. From the results, air/methane, tetrachloro-, CFC-10 contributed the most with 4.04 × 10⁻¹⁰ DALY, followed by air/methane, bromotrifluoro-, halon 13012, air/ethane,1,2-dichloro-1,1,2,2-tetrafluoro-, CFC-114, and air/methane bromochlorodifluoro-, Halon 1211 with metrics of 2.98 × 10⁻¹⁰ DALY, 2.33 × 10⁻¹⁰ DALY, and 1.74 × 10⁻¹⁰ DALY per 1 kg of containers, respectively. All substances emitted from the system analyzed were less than 0.00001 DALY.
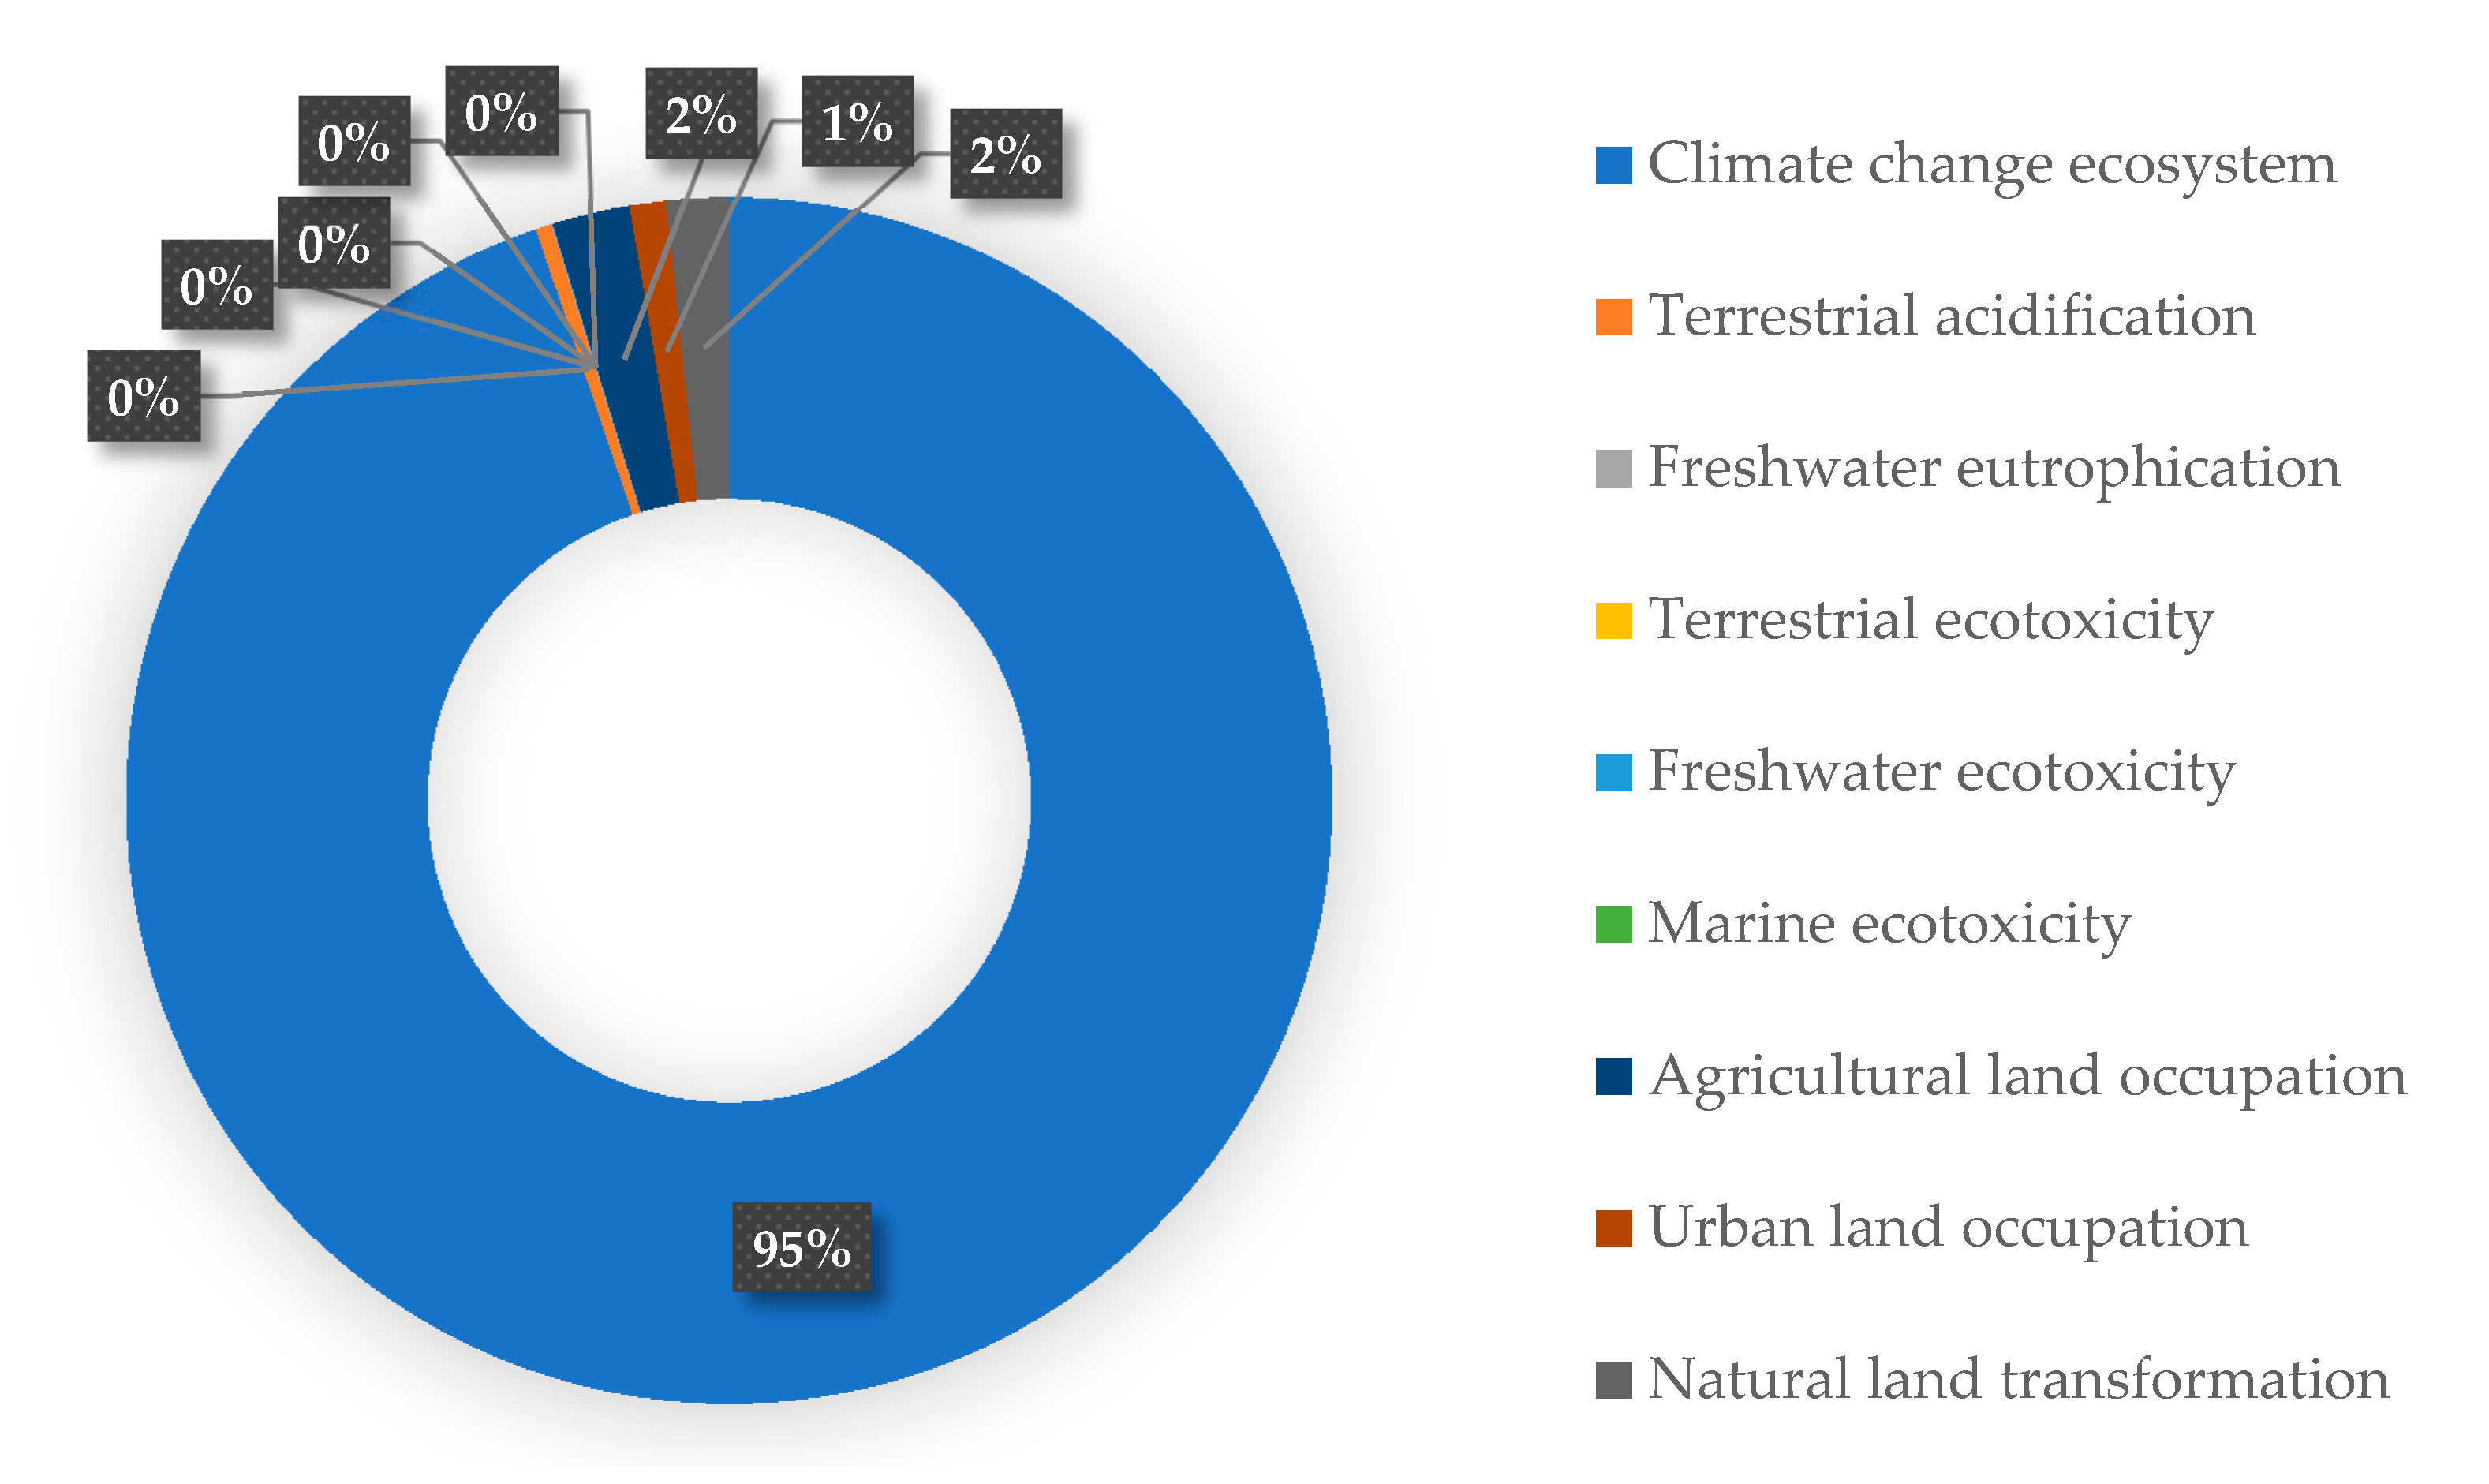
Climate change contributed to a significant share in the destruction of the ecosystem [49]. Global warming led to increased temperatures, sea levels, and ocean acidity, which disrupt the ecosystem’s natural balance [50]. Biodiversity is defined as “the variability among living organisms from all sources including, inter alia, terrestrial, marine, and other aquatic ecosystems and the ecological complexes of which they are part; this includes diversity within species, between species and of ecosystems” [49]. In the analysis, the unit used to measure the ecosystem damage is species.year (species.yr.), which is approximately any species extinction estimated over time. Contributions of each impact category to the total ecosystem damage (species.yr) are shown in Figure 10. The climate change ecosystem impact category contributed to 95% of the total ecosystem damage. The other impact categories were extremely low and can be assumed not impacting the total ecosystem damage (species.yr).
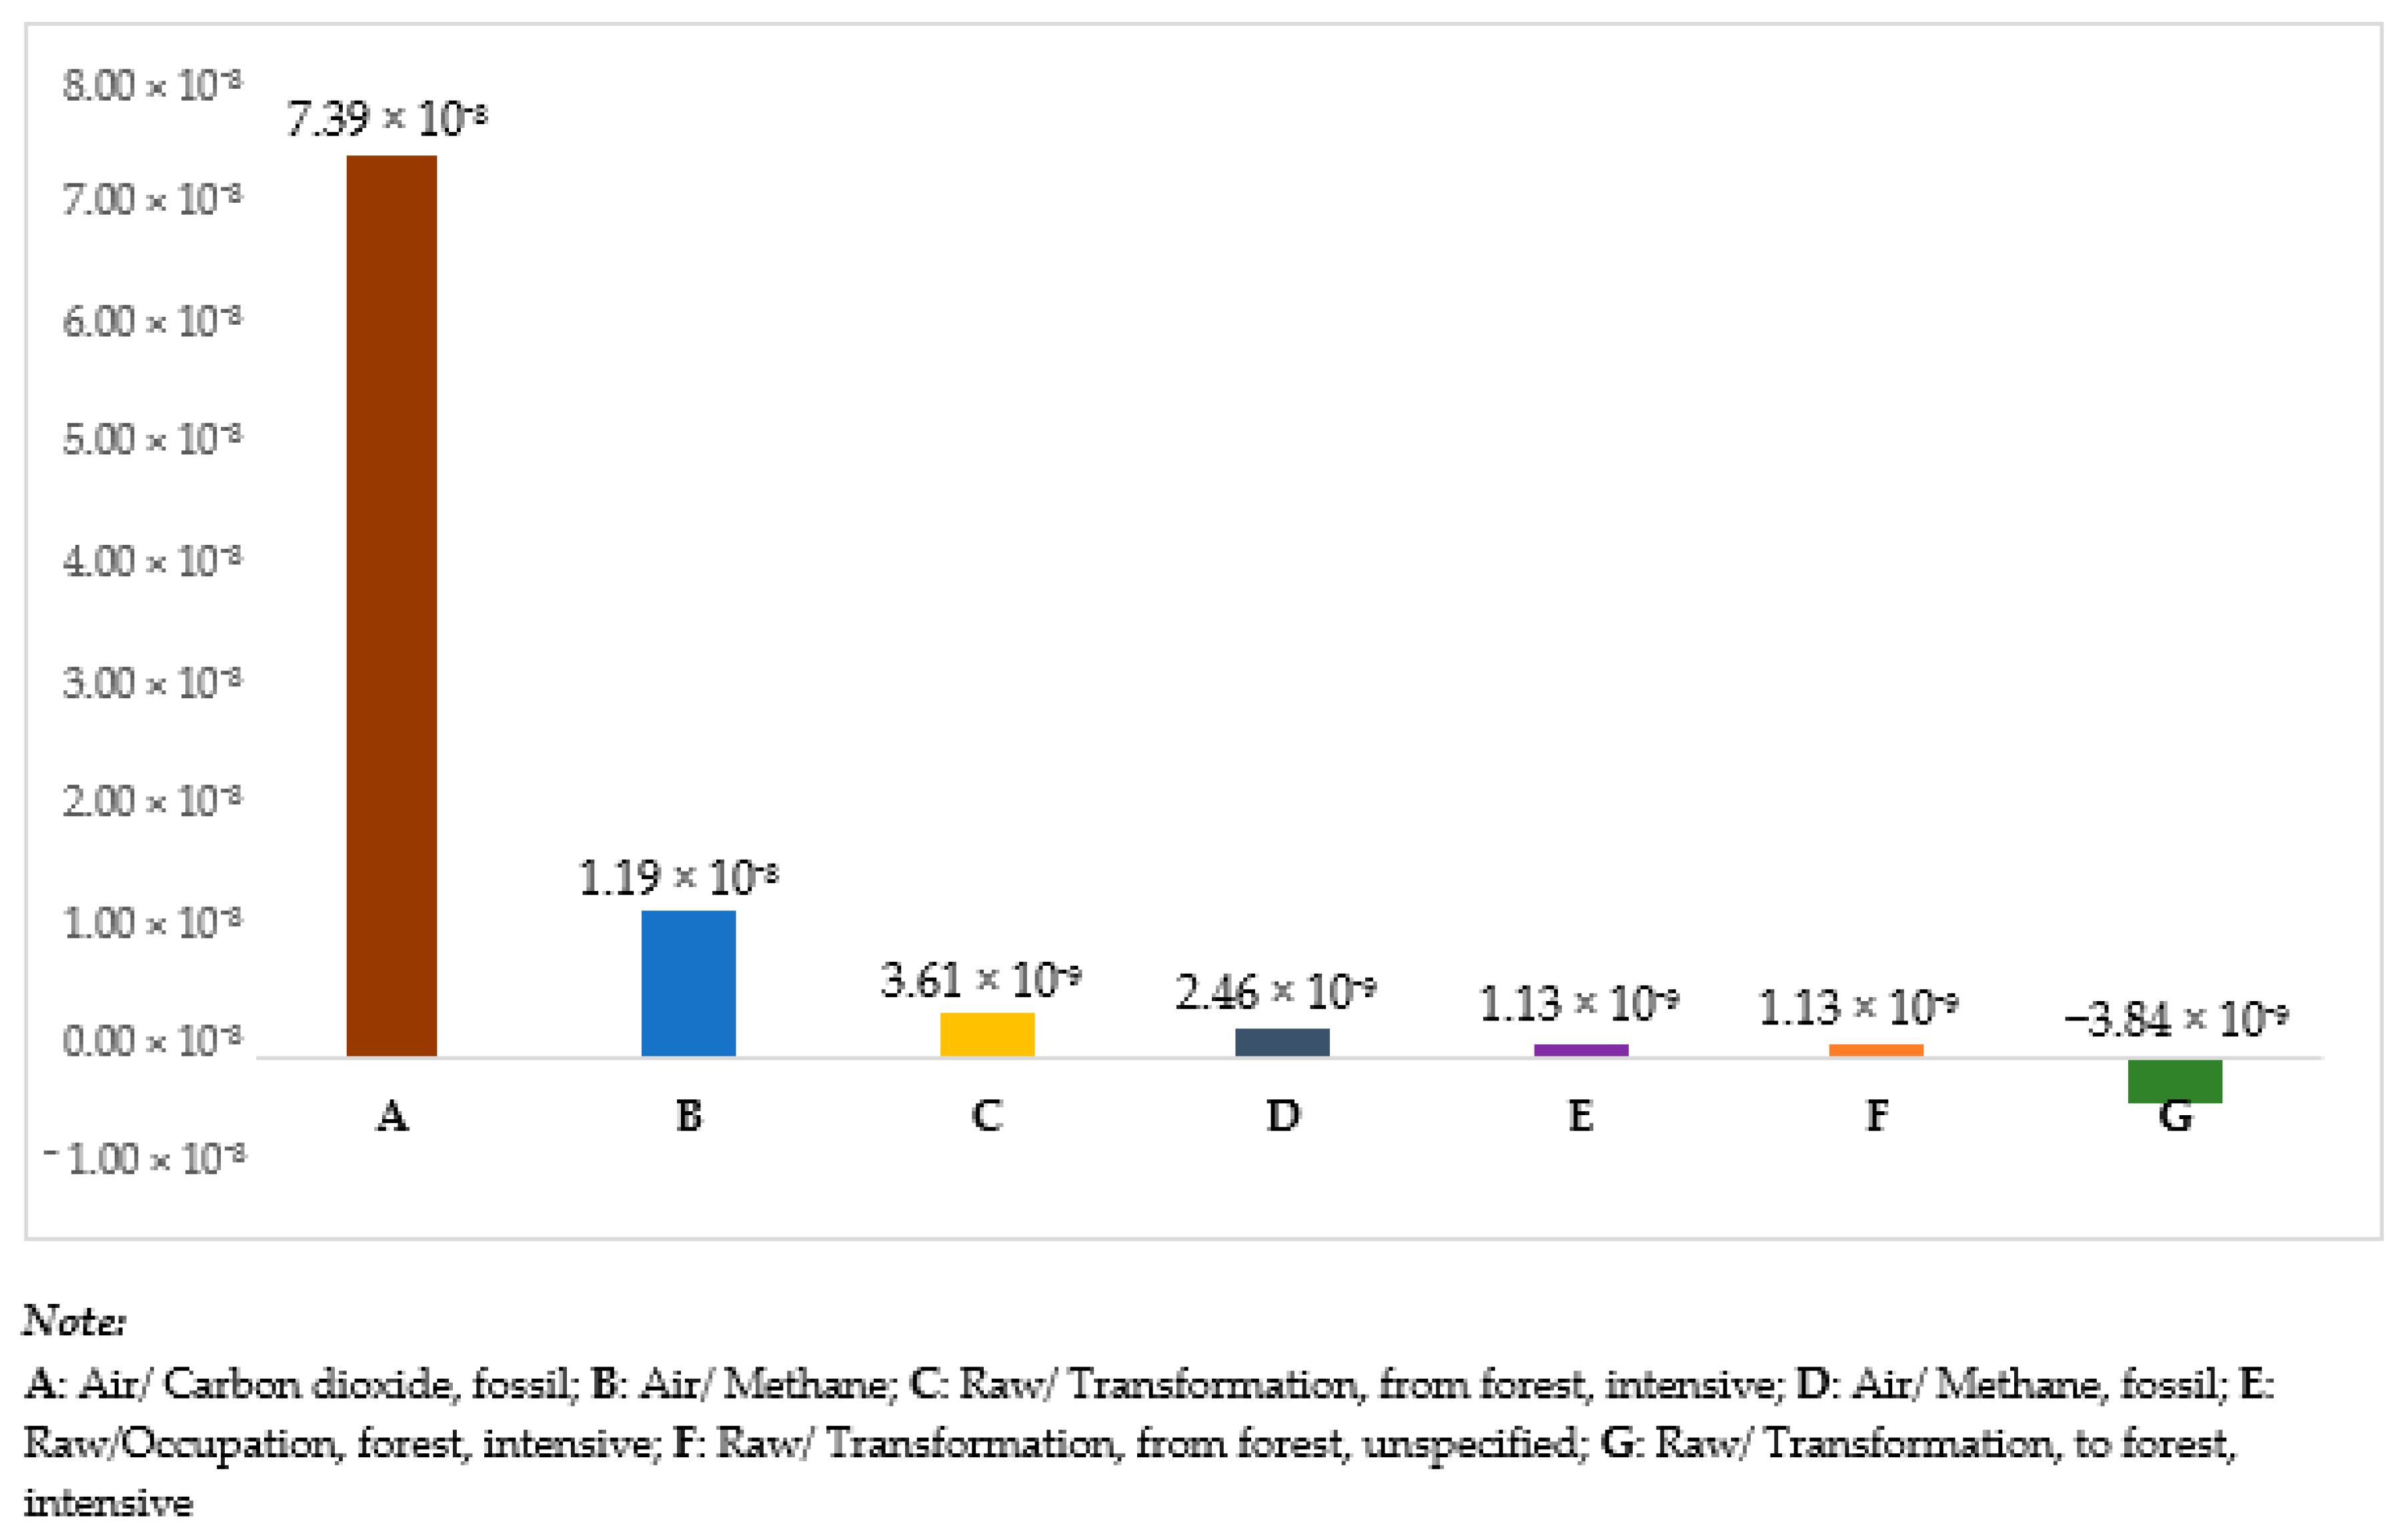
From the results of ecosystem damage assessment of 1 kg of SPF-reinforced sago starch composite takeout food container (Figure 11), air/carbon dioxide/fossil contributed the highest metric of 7.39 × 10⁻⁸ species.yr per 1 kg of containers, followed by air/methane of 1.19 × 10⁻⁸ species.yr, and raw/transformation, from forest, intensive of 3.61 × 10⁻⁹ species.yr, air/methane, the fossil of 2.46 × 10⁻⁹ species.yr, raw/occupation, forest, intensive of 1.13 × 10⁻⁹ species.yr, and raw/transformation, from forest of 1.13 × 10⁻⁹ species.yr. It is essential to mention that the element of raw/transformation, to forest, intensive obtained a negative score of −3.84 × 10⁻⁹ species.yr. This negative score shall indicate that the credits were larger than the burdens and contribute well to the ecosystem. Perhaps raw materials utilized from biobased, which eventually will return to the ecosystem as nutrients for the living species, could be the reason. Nevertheless, this, too, might be due to a loop in the product system model developed, which might consume more of the circulating product(s) than it produces. The elementary also might flowed inconsistently on the same input or output side (e.g., CO2 emissions on the input and output of processes) [51].
The widespread changes in productivity, species interactions, vulnerability to biological invasions, and other emergent properties are the effects of adjustments in species responding to climate change, and this altered the benefits and services that natural ecosystems can provide to society [38]. The contribution analysis of different greenhouse gasses (GHGs) to the damage of global warming impacts (GWIs) or labeled as the climate change ecosystem in the results analyzed is shown in Figure 12. The major contributor released in the air instigating climate change and impacting the ecosystem was carbon dioxide, fossil with the metric of 7.39 × 10⁻⁸ species.yr per 1 kg of containers. Fossil CO2 emissions were mostly coming from energy production, i.e., electricity and heat production, and transportations [52]. Air/methane, air/methane, fossil, and other remaining substances were also contributed to the damage of 1.19 × 10⁻⁸ species.yr, 2.46 × 10⁻⁹ species.yr, and 1.5 × 10⁻⁹ species.yr, respectively.
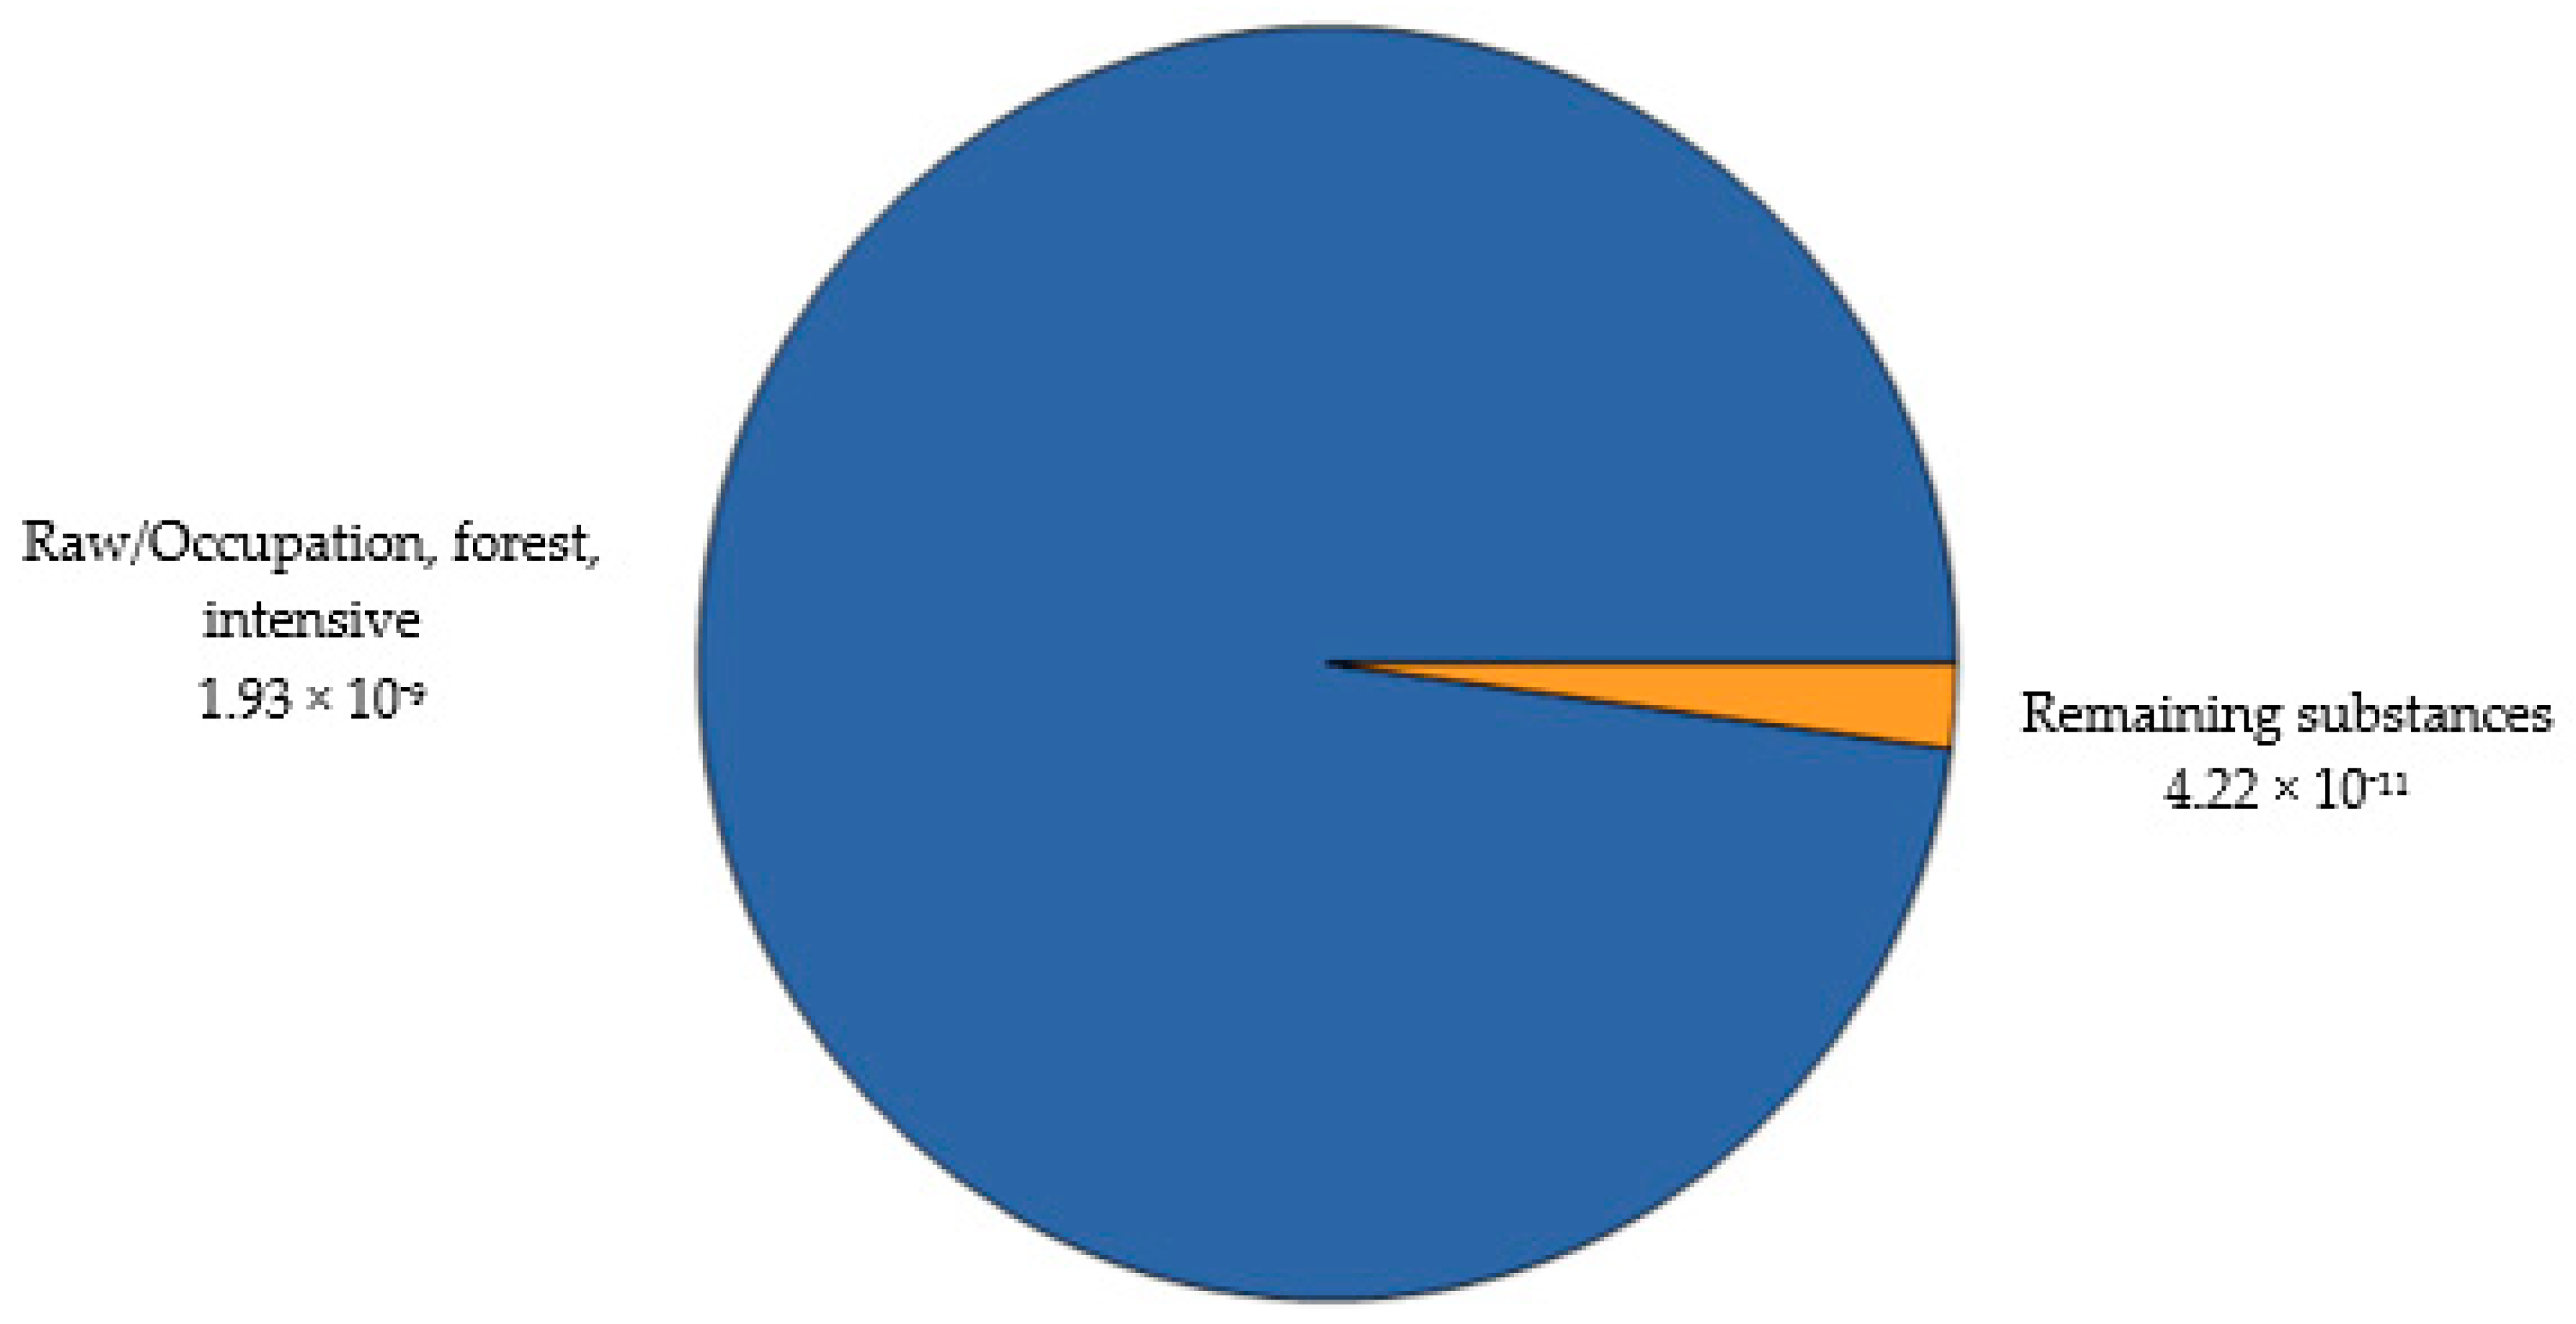
Land use impacts biodiversity, biotic production, and the regulating functions of the natural environment [53]. Land occupation refers to continuous usage of land for a particular function, e.g., agriculture or buildings, whereas land transformation refers to the change from one land use category to another [54]. The agricultural land occupation damage assessment results shown in Figure 13 revealed that almost the entire damage contribution originated from raw/occupation, forest, intensive with the metric 1.93 × 10⁻⁹ species.yr per 1 kg of containers where in this study, this would be from the sago and sugar palm plantation.
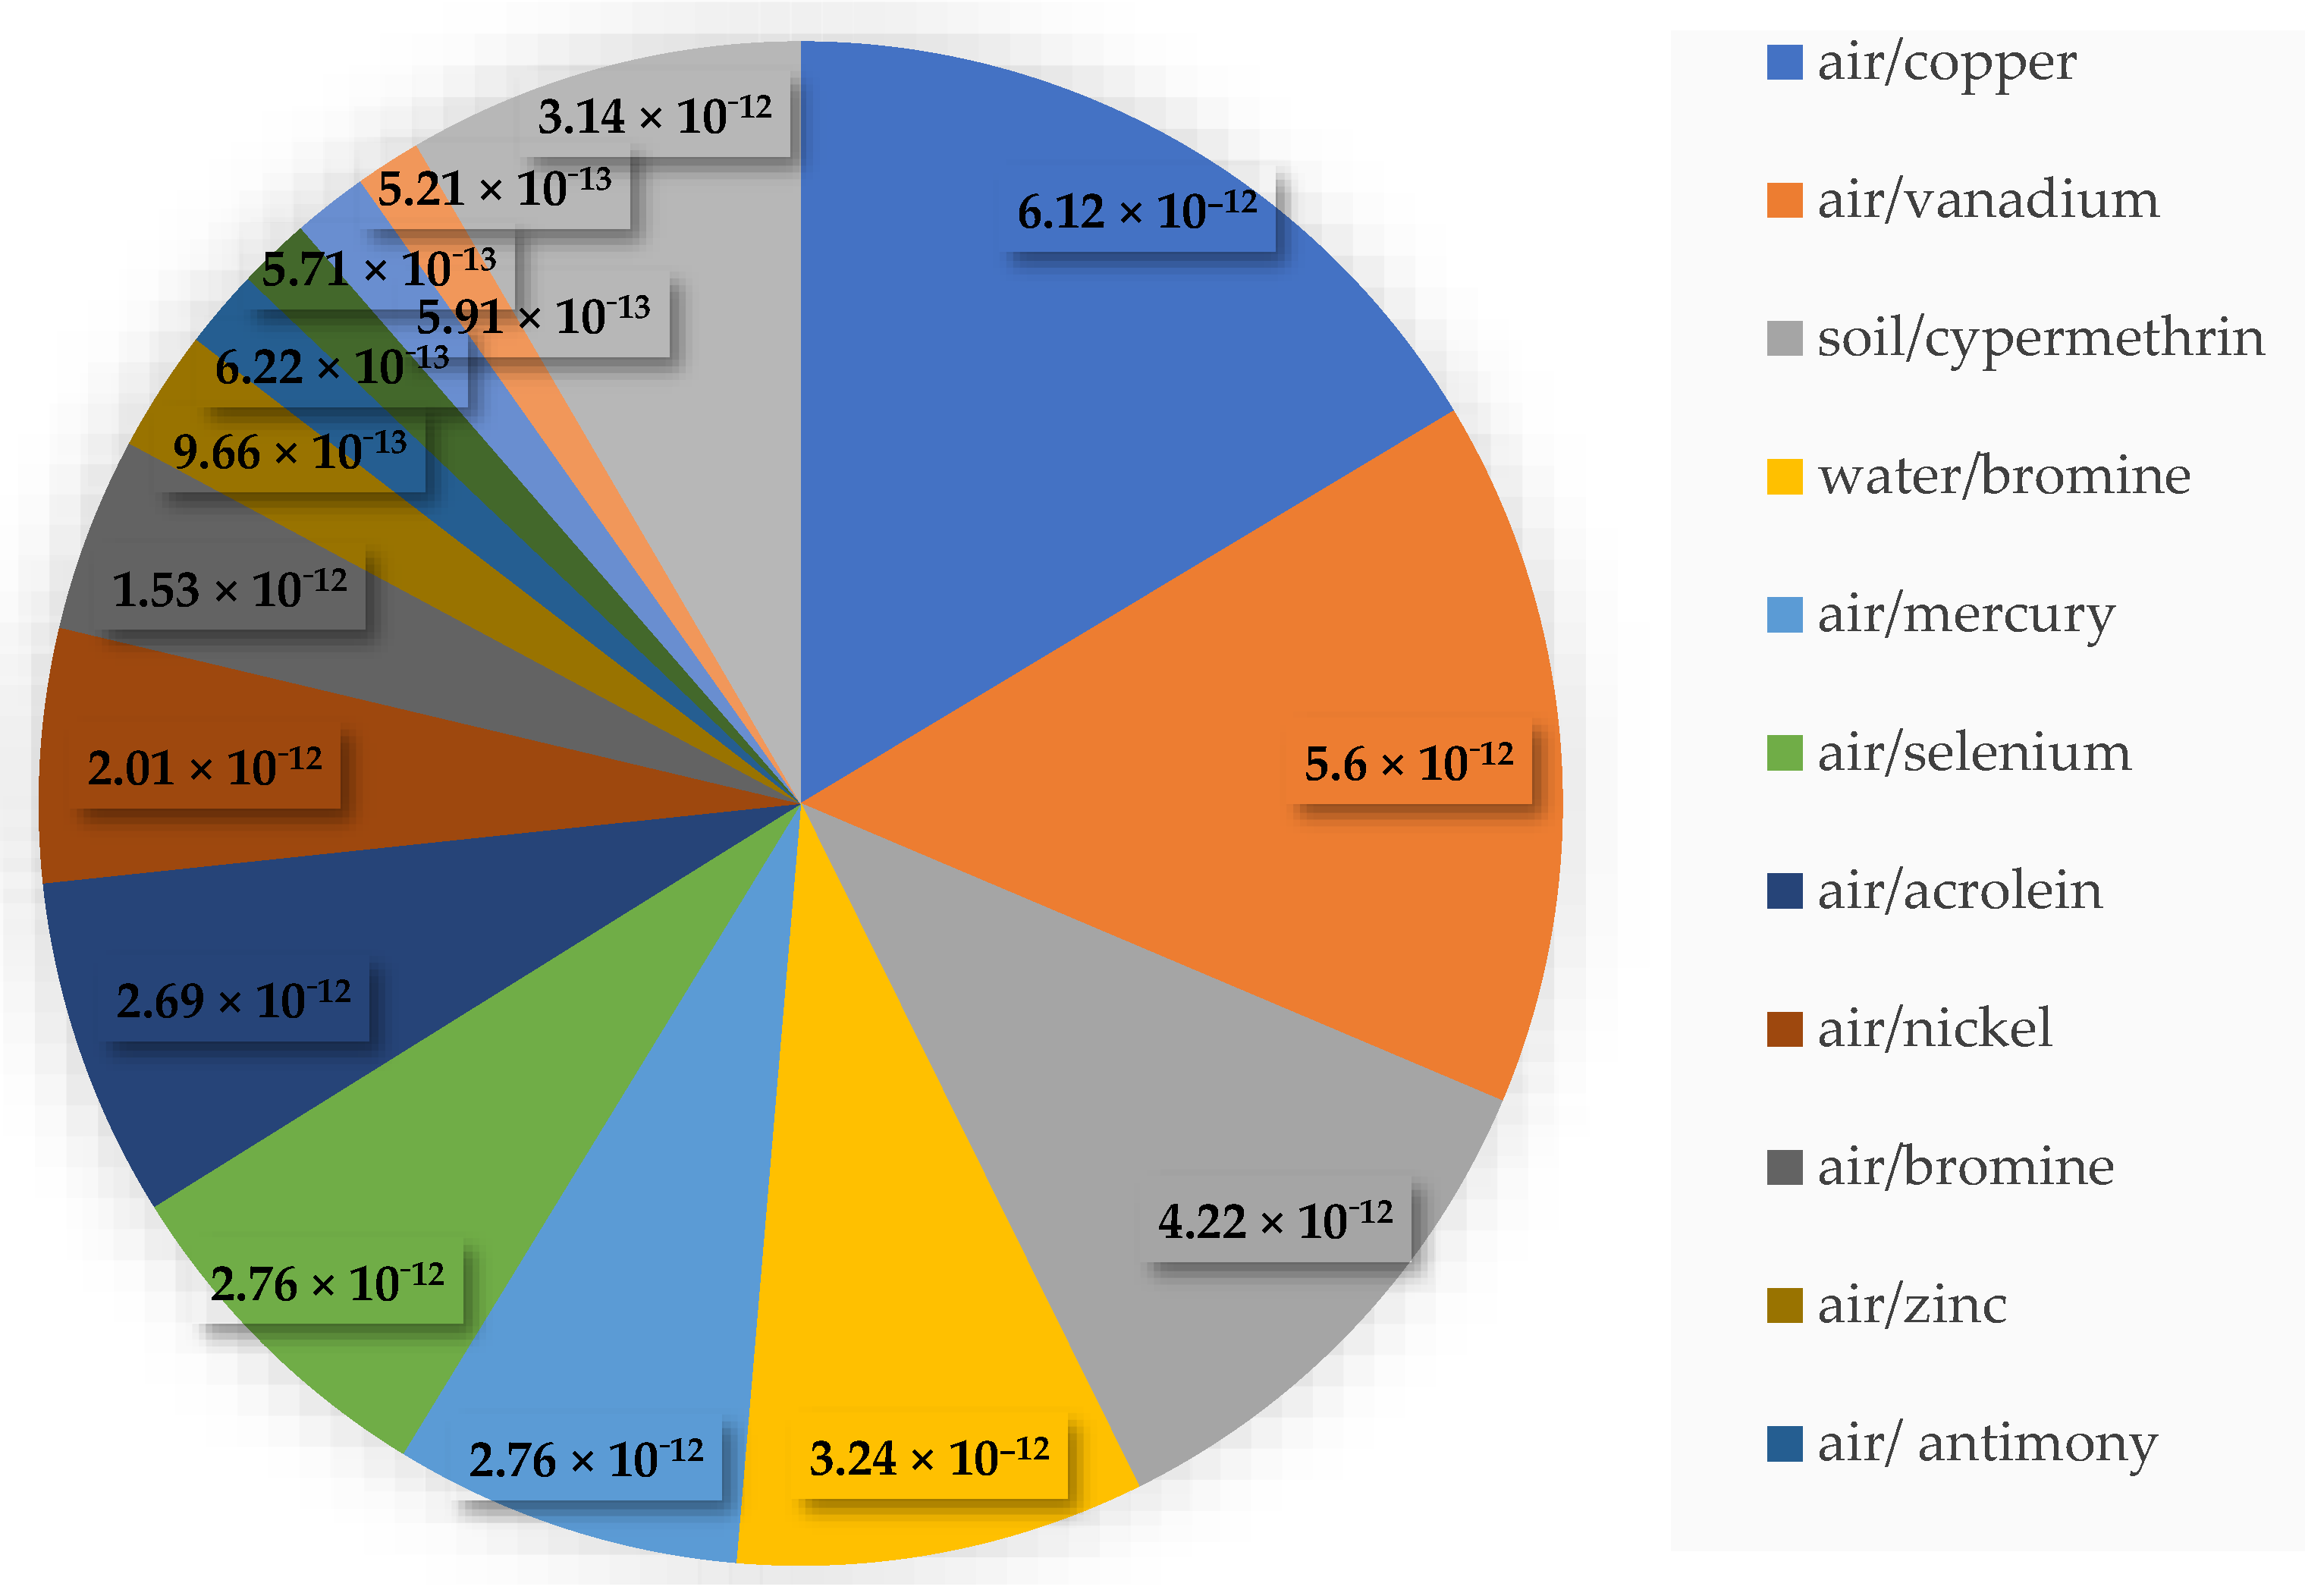
Terrestrial ecotoxicity is another interesting impact category analyzed from the product system. Of the elements 535 were emitted, and those contributed to more than 1% are as depicted in Figure 14. The largest contribution was air/copper and closely followed by air/vanadium with a score of 6.12 × 10⁻¹² species.yr and 5.6 × 10⁻¹² species.yr per 1 kg containers, respectively. Next was soil/cypermethrin (4.22 × 10⁻¹² species.yr), water/bromine (3.21 × 10⁻¹² species.yr), air/mercury (2.76 × 10⁻¹² species.yr), air/selenium (2.76 × 10⁻¹² species.yr), air/acrolein (2.69 × 10⁻¹² species.yr), air/nickel (2.01 × 10⁻¹² species.yr), air/bromine (1.53 × 10⁻¹² species.yr), and other lower score substances. Substances with less than 1% contribution were grouped as the remaining substances with an accumulated score of 3.14 × 10⁻¹² species.yr. Substances emitted during the life cycle of products might generate damages on the soil [55], and hence distressing the ecosystem.
The amount of substances emitted from the 1 kg SPF-reinforced sago starch biocomposite takeout food containers product system were at a low level, i.e., lower than 0.00001 DALY for the human health damage category and below 0.000001 species.yr for the ecosystem. This takeout food container is fully made from biobased raw materials from local sources in Malaysia, i.e., sago starch and abundance of insignificant utilization of SPF [27], could have produced low impacts to the environment. This is supported with the theory that designing a more sustainable biobased product can be performed at several levels, and among them are at the raw material level with the sourcing of local biomass feedstocks [6].
Even though all damage assessment results obtained were at a remarkably low level, there were high uncertainties in the results obtained, which is acknowledged as the weakness of the end-point approach. There were many possible sources to create these uncertainties in this environmental impact study, and according to Tenney et al. [56], they could be from model and baseline data errors, input data, and assumptions. The authors realized that for future enhanced works, the product system being studied could include more detailed processes to provide valuable contributions to the LCA analysis. Accurate and objective predictions would reduce these deficiencies, but it is an almost unattainable goal [56]. Nevertheless, the LCI data gathered in this study could be more comprehensive with the use of actual data on technologies and extensive materials utilized and energy consumption from relevant sago starch mill in Mukah Sarawak, SPF mill in Kampung Kuala Jempol, biocomposite manufacturer in Shah Alam, and composting facility and landfills available in Malaysia.
As far as the results are concerned, energy generated from fossil fuels was found to contribute to the largest damage. Thus, an alternative renewable resource for electricity generation would be a great environmentally friendly option to ensure lower impacts caused during the product’s total life cycle [21]. Furthermore, a comparable LCA assessment study of the fully biobased takeout food container with an identical container made from conventional materials would also provide a better understanding of the performance concerning the environment, as carried out by Khoshnava et al. [35] and Günkaya et al. [7]. A specified study on the end-of-life stage of the green biocomposite container, i.e., composting and landfilling with several options could also produce a different result of the impacts. Larger-scale implementation of composting biobased waste would create a more significant portion of waste diverted from landfills and could generate revenue for businesses [28]. Moreover, the development of composting facilities; along with production and commercial use of under-utilized SPF in rural areas like Kampung Kuala Jempol, Negeri Sembilan, and Mukah Sarawak will create jobs and improve the locals’ economy.
4. Conclusions
Utilizing locally sourced sago starch and sugar palm fiber as the constituents’ materials in green biocomposite to design a takeout food container and the whole product system are efforts to develop a more environmentally friendly takeout food packaging. The LCA analysis of the cradle-to-grave approach of the of 1 kg biobased composite takeout food containers produced a total damage of 2.63 × 10⁻⁵ DALY and 9.46 × 10⁻⁸ species.year for the damage categories of human health and ecosystem, respectively. The main contributor that was released into the air and affecting climate change was carbon dioxide coming from fossil fuel for electricity and heat generation, with 1.3 × 10⁻⁵ DALY and 7.39 × 10⁻⁸ species.yr per 1 kg of containers. The particulate matter formation impact assessment for the product system of 1 kg of the biobased composite containers was mostly contributed by air/nitrogen oxides, air/particulates, <2.5 µm, and air/sulfur dioxide with the metrics of 2.93 × 10⁻⁶ DALY, 2.75 × 10⁻⁶ DALY, and 1.9 × 10⁻⁶ DALY, respectively. Whereas the agricultural land occupation damage assessment results revealed that almost entire damage contribution came from raw/occupation, forest, intensive with the metric 1.93 × 10⁻⁹ species.yr. Overall, every impact category contributed to below than 0.0001 DALY for human health damage and below 0.00001 species.yr for ecosystem damage. For future work for improvement, the LCI data could be more comprehensive with the use of actual primary data on technologies utilized and energy consumption from relevant sago starch mills, SPF mills, biocomposite manufacturers, and composting facilities, and landfills. Comparative LCA assessment of the fully biobased takeout food container versus identical container made of conventional materials would also provide a better understanding of the performance. The results will give critical information to the prospective manufacturers in the commercialization phase of this new, fully biobased composite takeout food container.
Author Contributions
Conceptualization, S.M.S. and H.N.S.; methodology, H.N.S.; software, H.N.S. and S.M.S.; validation, S.M.S., M.Y.M.Z. and M.T.M.; formal analysis, S.M.S., H.N.S.; resources, S.M.S.; writing—original draft preparation, H.N.S.; writing—review and editing, H.N.S., S.M.S., M.Y.M.Z. and M.T.M.; supervision, S.M.S.; project administration, S.M.S., M.Y.M.Z. and M.T.M.; funding acquisition, S.M.S. All authors have read and agreed to the published version of the manuscript.
Funding
This research was funded by the Ministry of Education Malaysia Grant Scheme HICoE (Vote number 6369107).
Acknowledgments
Malaysia Public Service Department (JPA) provides scholarship to the first author.
Conflicts of Interest
The authors declare no conflict of interest.
References
- Geyer, R.; Jambeck, J.R.; Law, K.L. Production, uses, and fate of all plastics ever made. Sci. Adv. 2017, 3, 5. [Google Scholar] [CrossRef] [PubMed] [Green Version]
- Ellen MacArthur Foundation and McKinsey & Company. The New Plastics Economy: Rethinking the Future of Plastics; World Economic Forum: Geneva, Switzerland, 2016. [Google Scholar]
- Li, W.C.; Tse, H.F.; Fok, L. Plastic waste in the marine environment: A review of sources, occurrence and effects. Sci. Total Environ. 2016, 566–567, 333–349. [Google Scholar] [CrossRef] [PubMed]
- Karpušenkaitė, A.; Varžinskas, V. Bioplastics: Development, Possibilities and Difficulties. Environ. Res. Eng. Manag. 2014. [Google Scholar] [CrossRef]
- Madival, S.; Auras, R.; Singh, S.P.; Narayan, R. Assessment of the environmental profile of PLA, PET and PS clamshell containers using LCA methodology. J. Clean. Prod. 2009, 17, 1183–1194. [Google Scholar] [CrossRef]
- Venkatachalam, V.; Spierling, S.; Horn, R.; Endres, H.J. LCA and Eco-design: Consequential and Attributional Approaches for Bio-based Plastics. Procedia CIRP 2018, 69, 579–584. [Google Scholar] [CrossRef]
- Günkaya, Z.; Banar, M. An environmental comparison of biocomposite film based on orange peel-derived pectin jelly-corn starch and LDPE film: LCA and biodegradability. Int. J. Life Cycle Assess. 2016, 21, 465–475. [Google Scholar] [CrossRef]
- Hottle, T.A.; Bilec, M.M.; Landis, A.E. Biopolymer production and end of life comparisons using life cycle assessment. Resour. Conserv. Recycl. 2017. [Google Scholar] [CrossRef] [Green Version]
- Maga, D.; Hiebel, M.; Aryan, V. A comparative life cycle assessment of meat trays made of various packaging materials. Sustainability 2019, 11, 5324. [Google Scholar] [CrossRef] [Green Version]
- Petrucci, R.; Fortunati, E.; Puglia, D.; Luzi, F.; Kenny, J.M.; Torre, L. Life Cycle Analysis of Extruded Films Based on Poly(lactic acid)/Cellulose Nanocrystal/Limonene: A Comparative Study with ATBC Plasticized PLA/OMMT Systems. J. Polym. Environ. 2018. [Google Scholar] [CrossRef]
- Ingrao, C.; Gigli, M.; Siracusa, V. An attributional Life Cycle Assessment application experience to highlight environmental hotspots in the production of foamy polylactic acid trays for fresh-food packaging usage. J. Clean. Prod. 2017, 150, 93–103. [Google Scholar] [CrossRef]
- Bernstad Saraiva, A.; Pacheco, E.B.A.V.; Gomes, G.M.; Visconte, L.L.Y.; Bernardo, C.A.; Simões, C.L.; Soares, A.G. Comparative lifecycle assessment of mango packaging made from a polyethylene/natural fiber-composite and from cardboard material. J. Clean. Prod. 2016. [Google Scholar] [CrossRef]
- Lorite, G.S.; Rocha, J.M.; Miilumäki, N.; Saavalainen, P.; Selkälä, T.; Morales-Cid, G.; Gonçalves, M.P.; Pongrácz, E.; Rocha, C.M.R.; Toth, G. Evaluation of physicochemical/microbial properties and life cycle assessment (LCA) of PLA-based nanocomposite active packaging. LWT Food Sci. Technol. 2017, 75, 305–315. [Google Scholar] [CrossRef] [Green Version]
- Barros, M.V.; Salvador, R.; Piekarski, C.M.; de Francisco, A.C. Mapping of main research lines concerning life cycle studies on packaging systems in Brazil and in the world. Int. J. Life Cycle Assess. 2019, 24, 1429–1443. [Google Scholar] [CrossRef]
- Salwa, H.N.; Sapuan, S.M.; Mastura, M.T.; Zuhri, M.Y.M. Analytic Hierarchy Process (AHP)-based materials selection system for natural fiber as reinforcement in biopolymer composites for food packaging. BioResources 2019. [Google Scholar] [CrossRef]
- Salwa, H.N.; Sapuan, S.M.; Mastura, M.T.; Zuhri, M.Y.M. Application of Shannon’s Entropy-Analytic Hierarchy Process (AHP) for the Selection of the Most Suitable Starch as Matrix in Green Biocomposites for Takeout Food Packaging Design. BioResources 2019, 15, 4065–4088. [Google Scholar]
- ISO 14040 The International Standards Organisation. Environmental management—Life cycle assessment—Principles and Framework. ISO 14040. 2006. Available online: https://www.iso.org/standard/37456.html (accessed on 28 October 2020).
- Ingrao, C.; Lo Giudice, A.; Bacenetti, J.; Mousavi Khaneghah, A.; de Sant’Ana, A.S.; Rana, R.; Siracusa, V. Foamy polystyrene trays for fresh-meat packaging: Life-cycle inventory data collection and environmental impact assessment. Food Res. Int. 2015, 76, 418–426. [Google Scholar] [CrossRef]
- PRé Consultants. SimaPro|The World’s Leading LCA Software; PRé Consultants: Amersfoort, The Netherlands, 2019. [Google Scholar]
- Bohlmann, G.M. Biodegradable packaging life-cycle assessment. Environ. Prog. 2004, 23, 342–346. [Google Scholar] [CrossRef]
- Vignali, G. Life-Cycle Assessment of Food-Packaging Systems. In Environmental Footprints and Eco-Design of Products and Processes; Muthu, S., Ed.; Springer: Singapore, 2016; pp. 1–22. [Google Scholar]
- Molina-Besch, K.; Wikström, F.; Williams, H. The environmental impact of packaging in food supply chains—does life cycle assessment of food provide the full picture? Int. J. Life Cycle Assess. 2019. [Google Scholar] [CrossRef] [Green Version]
- Yusuf, M.A.; Romli, M.; Suprihatin; Wiloso, E.I. Potential of Traditional Sago Starch: Life Cycle Assessment (LCA) Perspective. IOP Conf. Ser. Mater. Sci. Eng. 2019, 507, 012014. [Google Scholar] [CrossRef]
- Groot, W.J.; Borén, T. Life cycle assessment of the manufacture of lactide and PLA biopolymers from sugarcane in Thailand. Int. J. Life Cycle Assess. 2010. [Google Scholar] [CrossRef]
- Mahalle, L.; Alemdar, A.; Mihai, M.; Legros, N. A cradle-to-gate life cycle assessment of wood fibre-reinforced polylactic acid (PLA) and polylactic acid/thermoplastic starch (PLA/TPS) biocomposites. Int. J. Life Cycle Assess. 2014, 19, 1305–1315. [Google Scholar] [CrossRef]
- Lai, J.C.; Rahman, W.A.W.A.; Avérous, L.; Lim, T.H. Study and characterisation of the post processing ageing of sago pith waste biocomposites. Sains Malaysiana 2016, 45, 633–641. [Google Scholar]
- Huzaifah, M.R.M.; Sapuan, S.M.; Leman, Z.; Ishak, M.R. Comparative Study on Chemical Composition, Physical, Tensile, and Thermal Properties of Sugar Palm Fiber (Arenga pinnata) Obtained from Different Geographical Locations. Bioresources 2017, 12, 9366–9382. [Google Scholar] [CrossRef]
- Johari, A.; Alkali, H.; Hashim, H.; Ahmed, S.I.; Mat, R. Municipal Solid Waste Management and Potential Revenue from Recycling in Malaysia. Mod. Appl. Sci. 2014, 8, 37–49. [Google Scholar] [CrossRef]
- Khandelwal, H.; Thalla, A.K.; Kumar, S.; Kumar, R. Life cycle assessment of municipal solid waste management options for India. Bioresour. Technol. 2019, 288, 121515. [Google Scholar] [CrossRef] [PubMed]
- Karim, A.A.; Tie, A.P.; Manan, D.M.A.; Zaidul, I.S.M. Starch from the Sago (Metroxylon sagu) Palm TreeProperties, Prospects, and Challenges as a New Industrial Source for Food and Other Uses. Compr. Rev. Food Sci. Food Saf. 2008, 7, 215–228. [Google Scholar] [CrossRef]
- Sahari, J.; Sapuan, S.M.; Zainudin, E.S.; Maleque, M.A. Thermo-mechanical behaviors of thermoplastic starch derived from sugar palm tree (Arenga pinnata). Carbohydr. Polym. 2013, 92, 1711–1716. [Google Scholar] [CrossRef] [PubMed]
- Zuraida, A.; Anuar, H.; Yusof, Y. The Study of Biodegradable Thermoplastics Sago Starch. Key Eng. Mater. 2011, 471–472, 397–402. [Google Scholar] [CrossRef]
- Wan, Y.K.; Ng, R.T.L.; Ng, D.K.S.; Aviso, K.B.; Tan, R.R. Fuzzy multi-footprint optimisation (FMFO) for synthesis of a sustainable value chain: Malaysian sago industry. J. Clean. Prod. 2016, 128, 62–76. [Google Scholar] [CrossRef]
- Bare, J.C.; Hofstetter, P.; Pennington, D.W.; de Haes, H.A.U. Midpoints versus endpoints: The sacrifices and benefits. Int. J. Life Cycle Assess. 2000. [Google Scholar] [CrossRef] [Green Version]
- Khoshnava, S.M.; Rostami, R.; Ismail, M.; Rahmat, A.R. A cradle-to-gate based life cycle impact assessment comparing the KBFwEFB hybrid reinforced poly hydroxybutyrate biocomposite and common petroleum-based composites as building materials. Environ. Impact Assess. Rev. 2018, 70, 11–21. [Google Scholar] [CrossRef]
- Zhang, X.; Zhang, M.; Zhang, H.; Jiang, Z.; Liu, C.; Cai, W. A review on energy, environment and economic assessment in remanufacturing based on life cycle assessment method. J. Clean. Prod. 2020, 255, 120160. [Google Scholar] [CrossRef]
- Yusof, N.S.B.; Sapuan, S.M.; Sultan, M.T.; Jawaid, M. Life cycle analysis of hybrid oil palm/glass fibre-reinforced polyurethane composites for Automotive Crash Box. J. Mech. Eng. Sci. 2020, 14, 6393–6402. [Google Scholar] [CrossRef]
- Arnesen, T.; Kapiriri, L. Can the value choices in DALYs influence global priority-setting? Health Policy 2004, 70, 137–149. [Google Scholar] [CrossRef] [PubMed]
- Reidpath, D.D. Measuring health in a vacuum: Examining the disability weight of the DALY. Health Policy Plan. 2003, 18, 351–356. [Google Scholar] [CrossRef]
- Weiskopf, S.R.; Rubenstein, M.A.; Crozier, L.G.; Gaichas, S.; Griffis, R.; Halofsky, J.E.; Hyde, K.J.W.; Morelli, T.L.; Morisette, J.T.; Muñoz, R.C.; et al. Climate change effects on biodiversity, ecosystems, ecosystem services, and natural resource management in the United States. Sci. Total Environ. 2020, 18, 137782. [Google Scholar] [CrossRef]
- Lindley, S.J.; Cook, P.A.; Dennis, M.; Gilchrist, A. Biodiversity, Physical Health and Climate Change: A Synthesis of Recent Evidence. In Biodiversity and Health in the Face of Climate Change; Springer International Publishing: Cham, Switzerland, 2019; pp. 17–46. [Google Scholar]
- Okubo, M.; Kuwahara, T. Emission regulations. New Technologies for Emission Control in Marine Diesel Engines; Butterworth-Heinemann: Oxford, UK, 2020; pp. 25–51. [Google Scholar]
- Kampa, M.; Castanas, E. Human health effects of air pollution. Environ. Pollut. 2008. [Google Scholar] [CrossRef]
- Hertwich, E.G.; Mateles, S.F.; Pease, W.S.; McKone, T.E. Human toxicity potentials for life-cycle assessment and toxics release inventory risk screening. Environ. Toxicol. Chem. 2001, 20, 928–939. [Google Scholar] [CrossRef]
- Mazukhina, S.; Tereshchenko, P.; Drogobuzhskaya, S.; Pozhilenko, V. The speciation of chemical elements in water and their possible impact on human health. In Proceedings of the 16th International Symposium on Water-Rock Interaction (WRI-16) and 13th International Symposium on Applied Isotope Geochemistry (1st IAGC International Conference), Tomsk, Russia, 21–26 July 2019. [Google Scholar]
- Luderer, U.; Eskenazi, B.; Hauser, R.; Korach, K.S.; McHale, C.M.; Moran, F.; Rieswijk, L.; Solomon, G.; Udagawa, O.; Zhang, L.; et al. Proposed key characteristics of female reproductive toxicants as an approach for organizing and evaluating mechanistic data in hazard assessment. Environ. Health Perspect. 2019. [Google Scholar] [CrossRef] [Green Version]
- Barnes, P.W.; Williamson, C.E.; Lucas, R.M.; Robinson, S.A.; Madronich, S.; Paul, N.D.; Bornman, J.F.; Bais, A.F.; Sulzberger, B.; Wilson, S.R.; et al. Ozone depletion, ultraviolet radiation, climate change and prospects for a sustainable future. Nat. Sustain. 2019. [Google Scholar] [CrossRef] [Green Version]
- Tong, S.; Ebi, K. Preventing and mitigating health risks of climate change. Environ. Res. 2019. [Google Scholar] [CrossRef] [PubMed]
- Marselle, M.R.; Stadler, J.; Korn, H.; Irvine, K.N.; Bonn, A. Biodiversity and Health in the Face of Climate Change: Challenges, Opportunities and Evidence Gaps. In Biodiversity and Health in the Face of Climate Change; Springer International Publishing: Cham, Switzerland, 2019; pp. 1–13. [Google Scholar]
- Pecl, G.T.; Araújo, M.B.; Bell, J.D.; Blanchard, J.; Bonebrake, T.C.; Chen, I.C.; Clark, T.D.; Colwell, R.K.; Danielsen, F.; Evengård, B.; et al. Biodiversity redistribution under climate change: Impacts on ecosystems and human well-being. Science 2017, 1–13. [Google Scholar] [CrossRef] [PubMed]
- Patel, M.; Bastioli, C.; Marini, L.; Würdinger, E. Life-cycle Assessment of Bio-based Polymers and Natural Fiber Composites. Biopolym. Online 2003. [Google Scholar] [CrossRef]
- Peters, G.P.; Andrew, R.M.; Canadell, J.G.; Friedlingstein, P.; Jackson, R.B.; Korsbakken, J.I.; Le Quéré, C.; Peregon, A. Carbon dioxide emissions continue to grow amidst slowly emerging climate policies. Nat. Clim. Chang. 2020. [Google Scholar] [CrossRef]
- Müller-Wenk, R.; Brandão, M. Climatic impact of land use in LCA-carbon transfers between vegetation/soil and air. Int. J. Life Cycle Assess. 2010. [Google Scholar] [CrossRef]
- De Rosa, M. Land Use and Land-use Changes in Life Cycle Assessment: Green Modelling or Black Boxing? Ecol. Econ. 2018. [Google Scholar] [CrossRef]
- Haye, S.; Slaveykova, V.I.; Payet, J. Terrestrial ecotoxicity and effect factors of metals in life cycle assessment (LCA). Chemosphere 2007. [Google Scholar] [CrossRef] [PubMed]
- Tennøy, A.; Kværner, J.; Gjerstad, K.I. Uncertainty in environmental impact assessment predictions: The need for better communication and more transparency. Impact Assess. Proj. Apprais. 2006. [Google Scholar] [CrossRef] [Green Version]
Figure 1.
Final concept design of the sugar palm fiber (SPF)-reinforced sago starch biocomposite takeout food container.
Figure 1.
Final concept design of the sugar palm fiber (SPF)-reinforced sago starch biocomposite takeout food container.

Figure 2.
System boundary under investigation for the SPF-reinforced sago starch biocomposite takeout food container.
Figure 2.
System boundary under investigation for the SPF-reinforced sago starch biocomposite takeout food container.

Figure 3.
Transportation of raw materials to biocomposite manufacturing gate: (a) routes travelled for sago starch: Mukah-Kuching-Klang-Shah Alam and (b) route travelled for SPF (Kampung Kuala Jempol-Shah Alam; sources: google maps.com and ports.com).
Figure 3.
Transportation of raw materials to biocomposite manufacturing gate: (a) routes travelled for sago starch: Mukah-Kuching-Klang-Shah Alam and (b) route travelled for SPF (Kampung Kuala Jempol-Shah Alam; sources: google maps.com and ports.com).

Figure 4.
Contribution of each impact category to the total disability adjusted life year (DALY).

Figure 5.
Emissions contributed to the human health damage assessment of 1 kg of SPF-reinforced sago starch composite takeout food container analyzed (damage assessment/excluding long-term emissions).
Figure 5.
Emissions contributed to the human health damage assessment of 1 kg of SPF-reinforced sago starch composite takeout food container analyzed (damage assessment/excluding long-term emissions).

Figure 6.
Emissions contributed to the ‘Climate Change Human Health’ impact category (damage assessment/excluding long-term emissions).
Figure 6.
Emissions contributed to the ‘Climate Change Human Health’ impact category (damage assessment/excluding long-term emissions).

Figure 7.
Elements released in the air contributed to the ‘Particulate matter formation’ impact category (damage assessment/excluding long-term emissions).
Figure 7.
Elements released in the air contributed to the ‘Particulate matter formation’ impact category (damage assessment/excluding long-term emissions).

Figure 8.
Substances impacting human toxicity analyzed from 1 kg of SPF-reinforced sago starch composite takeout food containers.
Figure 8.
Substances impacting human toxicity analyzed from 1 kg of SPF-reinforced sago starch composite takeout food containers.

Figure 9.
Ozone depletion damage assessment of 1 kg of SPF-reinforced sago starch composite takeout food container (damage assessment/excluding long-term emissions/cut off 1%).
Figure 9.
Ozone depletion damage assessment of 1 kg of SPF-reinforced sago starch composite takeout food container (damage assessment/excluding long-term emissions/cut off 1%).

Figure 10.
Contribution of each impact category to the total ecosystem damage (species.yr) of 1 kg of SPF-reinforced sago starch composite takeout food container.
Figure 10.
Contribution of each impact category to the total ecosystem damage (species.yr) of 1 kg of SPF-reinforced sago starch composite takeout food container.

Figure 11.
Ecosystem damage assessment of 1 kg of SPF-reinforced sago starch composite takeout food container analyzed (damage assessment/excluding long-term emissions/cut off 1%).
Figure 11.
Ecosystem damage assessment of 1 kg of SPF-reinforced sago starch composite takeout food container analyzed (damage assessment/excluding long-term emissions/cut off 1%).

Figure 12.
Climate change ecosystem impact assessment of 1 kg of SPF-reinforced sago starch composite takeout food container analyzed (damage assessment/excluding long-term emissions/cut off 1%).
Figure 12.
Climate change ecosystem impact assessment of 1 kg of SPF-reinforced sago starch composite takeout food container analyzed (damage assessment/excluding long-term emissions/cut off 1%).

Figure 13.
Agricultural land occupation impact assessment of 1 kg of SPF-reinforced sago starch composite takeout food container analyzed (damage assessment/excluding long-term emissions/cut off 1%).
Figure 13.
Agricultural land occupation impact assessment of 1 kg of SPF-reinforced sago starch composite takeout food container analyzed (damage assessment/excluding long-term emissions/cut off 1%).

Figure 14.
Terrestrial toxicity impact category for a product system of 1 kg SPF-reinforced sago starch biocomposite takeout food container (damage assessment/excluding long-term emissions/cut off 1%).
Figure 14.
Terrestrial toxicity impact category for a product system of 1 kg SPF-reinforced sago starch biocomposite takeout food container (damage assessment/excluding long-term emissions/cut off 1%).


Table 1.
Inventory data used to analyze the cradle-to-grave of the 1 kg SPF-reinforced sago starch biocomposite takeout food container.
Table 1.
Inventory data used to analyze the cradle-to-grave of the 1 kg SPF-reinforced sago starch biocomposite takeout food container.
| Parameters | Description | Qty | Unit | Data Sources/References |
|---|---|---|---|---|
| Background data | ||||
| Raw materials—Sago starch | ||||
| Inputs from Nature | ||||
| Standing sago tree | Sago tree felling for sago starch production (9.449 kg for 1 kg sago starch), 70% of 1 kg SPF-reinforced Sago composite | 6.6143 | kg | [23,26,30] and USLCI database |
| Inputs from technosphere—Materials/Fuels | ||||
| Tap Water | Used in sago starch production (3.7 kg used for 1 kg of sago, 70% of 1 kg SPF-reinforced Sago composite) | 2.59 | kg | [23] and Agri-footprint database |
| Glycerol | Plasticizer for sago starch, 30% of 1 kg sago starch, (70%Sago starch content for 1 kg SPF-reinforced Sago composite | 0.21 | kg | [31,32] and USLCI database |
| Transportation | ||||
| Mill to storage | Mill to storage (Mukah-Kuching 463 km, Lorry 16–32 metric ton) per 0.7 kg sago starch, | 0.32411 | tkm | [33] and Ecoinvent 3 database |
| Borneo to Peninsular (Ports) | Ports (Kuching-Klang, 735 nautical miles, waterways freight, barge tanker) 0.7 kg sago starch, | 0.136122 | tkm | [33] and Ecoinvent 3 database |
| Port to plant | Port to Manufacturing, Klang-Shah Alam 35 km, Lorry 16–32 metric ton, 0.7 kg sago starch | 0.0245 | tkm | Ecoinvent 3 database |
| Raw materials—Sugar palm fiber | ||||
| Inputs from technosphere—Materials/Fuels | ||||
| Tap Water | Sugar palm fiber preparation (Assumed 10 kg water used to wash 1 kg sugar palm fiber), 30% SPF content of 1 kg SPF-reinforced Sago composite | 3 | kg | Agri-footprint database |
| Inputs from technosphere—Electricity/Heat | ||||
| Electricity—Sugar palm fiber production | Drying of sugar palm fiber (30% SPF content of 1 kg SPF-reinforced Sago composite) | 0.67 | kWh | Assume similar equipment used as in [25], Ecoinvent 3 database |
| Electricity—Sugar palm fiber production | Grinding of sugar palm fiber (30% SPF content of 1 kg SPF-reinforced Sago composite) | 0.25 | kWh | Assume similar equipment used as in [25], Ecoinvent 3 database |
| Transportation | ||||
| Transportation of sugar palm fiber | Mill to composite manufacture plant (Jempol-Shah Alam, Lorry 16–32 metric ton) (30% SPF content of 1 kg SPF-reinforced Sago composite) | 0.0462 | tkm | [27], Ecoinvent 3 database |
| Biocomposite manufacturing | ||||
| Inputs from technosphere—Electricity/Heat | ||||
| Electricity | Compounding—1 kg of SPF-reinforced Sago biocomposite | 5.59 | kWh | Assume similar equipment used in [25], Ecoinvent 3 database |
| Electricity | Drying of biocomposite | 0.67 | kWh | Assume similar equipment used in [25], Ecoinvent 3 database |
| Electricity | Extrusion and sheet forming | 1.35 | kWh | Ecoinvent 3 database |
| Container forming | ||||
| Inputs from technosphere—Electricity/Heat | ||||
| Electricity—Takeout Food container forming | Thermoforming | 2.9014 | kWh | Ecoinvent 3 database |
| End of life | ||||
| Inputs from technosphere—Materials/Fuels | ||||
| Diesel | Used for the equipment in the composting process, End-of-life: 17% to composting + 83% to landfill | 0.00257 | L | [29] and USLCI database |
| Direct Emissions | ||||
| Ammonia, NH3 | End-of-life: 17% to composting + 83% to landfill | 0.00922 | g | [29], Ecoinvent 3 database |
| Carbon dioxide, CO2 | End-of-life: 17% to composting + 83% to landfill | 0.02007 | kg | [29], Ecoinvent 3 database |
| Methane, CH4 | End-of-life: 17% to composting + 83% to landfill | 0.04953 | kg | [29], Ecoinvent 3 database |
| Nitrogen Oxides, NOx | End-of-life: 17% to composting + 83% to landfill | 0.25225 | g | [29], Ecoinvent 3 database |
| Particulates, PM | End-of-life: 17% to composting + 83% to landfill | 0.00094 | kg | [29], Ecoinvent 3 database |
| Sulfur Oxides, SOx | End-of-life: 17% to composting + 83% to landfill | 0.00003 | g | [29], Ecoinvent 3 database |
Table 2.
Damage assessment by damage category and its respective impact categories analyzed using World ReCiPe End Point (H), excluding long-term emissions.
Table 2.
Damage assessment by damage category and its respective impact categories analyzed using World ReCiPe End Point (H), excluding long-term emissions.
| Impact Category (IC) | Unit | Amount |
|---|---|---|
| Human Health Damage | ||
| Climate change human health | DALY | 1.58 × 10⁻⁵ |
| Ozone depletion | 0.000113 × 10⁻⁵ | |
| Human toxicity | 0.171 × 10⁻⁵ | |
| Photochemical oxidant formation | 0.000249 × 10⁻⁵ | |
| Particulate matter formation | 0.87 × 10⁻⁵ | |
| Ionizing radiation | 0.000824 × 10⁻⁵ | |
| TOTAL | 2.63 × 10⁻⁵ DALY | |
| Ecosystem Damage | ||
| Climate change ecosystem | species.yr | 8.97 × 10⁻⁸ |
| Terrestrial acidification | 0.0399 × 10⁻⁸ | |
| Freshwater eutrophication | 0.00296 × 10⁻⁸ | |
| Terrestrial ecotoxicity | 0.00382 × 10⁻⁸ | |
| Freshwater ecotoxicity | 0.00112 × 10⁻⁸ | |
| Marine ecotoxicity | 0.000244 × 10⁻⁸ | |
| Agricultural land occupation | 0.197 × 10⁻⁸ | |
| Urban land occupation | 0.0925 × 10⁻⁸ | |
| Natural land transformation | 0.158 × 10⁻⁸ | |
| TOTAL | 9.46 × 10⁻⁸ species.yr | |
| Resources scarcity | ||
| Metal depletion | $ | 0.00493 |
| Fossil depletion | $ | 0.486 |
| TOTAL | $0.491 | |
Publisher’s Note: MDPI stays neutral with regard to jurisdictional claims in published maps and institutional affiliations. |
© 2020 by the authors. Licensee MDPI, Basel, Switzerland. This article is an open access article distributed under the terms and conditions of the Creative Commons Attribution (CC BY) license (http://creativecommons.org/licenses/by/4.0/).
Share and Cite
MDPI and ACS Style
Salwa, H.N.; Sapuan, S.M.; Mastura, M.T.; Zuhri, M.Y.M. Life Cycle Assessment of Sugar Palm Fiber Reinforced-Sago Biopolymer Composite Takeout Food Container. Appl. Sci. 2020, 10, 7951. https://doi.org/10.3390/app10227951
AMA Style
Salwa HN, Sapuan SM, Mastura MT, Zuhri MYM. Life Cycle Assessment of Sugar Palm Fiber Reinforced-Sago Biopolymer Composite Takeout Food Container. Applied Sciences. 2020; 10(22):7951. https://doi.org/10.3390/app10227951
Chicago/Turabian StyleSalwa, H. N., S. M. Sapuan, M. T. Mastura, and M. Y. M. Zuhri. 2020. "Life Cycle Assessment of Sugar Palm Fiber Reinforced-Sago Biopolymer Composite Takeout Food Container" Applied Sciences 10, no. 22: 7951. https://doi.org/10.3390/app10227951
Note that from the first issue of 2016, this journal uses article numbers instead of page numbers. See further details here.