Benchmarking of Water, Energy, and Carbon Flows in Academic Buildings: A Fuzzy Clustering Approach


1
School of Engineering, University of British Columbia (Okanagan), 3333 University Way, Kelowna, BC V1V 1V7, Canada
2
Department of Civil Engineering, College of Engineering, Qassim University, Buraydah, Qassim 51452, Saudi Arabia
*
Author to whom correspondence should be addressed.
Sustainability 2020, 12(11), 4422; https://doi.org/10.3390/su12114422
Submission received: 23 April 2020
/
Revised: 21 May 2020
/
Accepted: 21 May 2020
/
Published: 29 May 2020
(This article belongs to the Special Issue Sustainable Assessment in Supply Chain and Infrastructure Management)
Abstract
:In Canada, higher educational institutions (HEIs) are responsible for a significant portion of energy consumption and anthropogenic greenhouse gas (GHG) emissions. Improving the environmental performance of HEIs is an important step to achieve nationwide impact reduction. Academic buildings are among the largest infrastructure units in HEIs. Therefore, it is crucial to improve the environmental performance of academic buildings during their operations. Identifying critical academic buildings posing high impacts calls for methodologies that can holistically assess the environmental performance of buildings with respect to water and energy consumption, and GHG emission. This study proposes a fuzzy clustering approach to classify academic buildings in an HEI and benchmark their environmental performance in terms of water, energy, and carbon flows. To account for the fuzzy uncertainties in partitioning, the fuzzy c-means algorithm is employed to classify the buildings based on water, energy, and carbon flow indicators. The application of the developed methodology is demonstrated by a case study of 71 academic buildings in the University of British Columbia, Canada. The assessed buildings are grouped into three clusters representing different levels of performances with different degrees of membership. The environmental performance of each cluster is then benchmarked. Based on the results, the environmental performances of academic buildings are holistically determined, and the building clusters associated with low environmental performances are identified for potential improvements. The subsequent benchmark will allow HEIs to compare the impacts of academic building operations and set realistic targets for impact reduction.
1. Introduction
The United Nations Paris Agreement set ambitious goals for 191 countries to reduce the anthropogenic greenhouse gases (GHG) emissions linked to climate change, in an aim to curb the global temperature increase by 1.5 °C above the pre-industrial levels [1]. Canada is among the nations that ratified the agreement and committed to reducing their emissions, by 2030, to a level that is 30% lower than level reported in 2005 [2]. In Canada, the building sector is the third largest GHG emitting source, and is responsible for 12% of the total emission [2]. Moreover, the building sector consumes 20–40% of the total produced energy in developed countries; for instance, in the US and EU this sector is the third largest in terms of energy usage [3]. Buildings are believed to be responsible for more than one-third of the GHG emissions and 32% of the total energy consumption [4]. A building emits GHG during different phases, but the largest portion of the GHG emissions is generally associated with the operational phase, i.e., about 80–94% of the entire lifecycle emissions of a building [5,6,7].
The educational sector stays among the largest public sectors of many countries around the world. For instance, being the largest public sector in China, it consumes 40% of the total energy supplied to the public sector [8]. Many large universities operate on a scale similar to a small city [9,10,11,12,13]. In Canada, higher educational institutions (HEIs) generally use 60% of the electricity allocated to the educational sector, equivalent to that consumed by a small city of 430,000 households [14]. In British Columbia (BC), Canada, the educational sector alone emitted 309,222 ton of CO2e as of 2018, accounting for 41.25% of the total public sector emissions in the province; specifically, HEIs in the province are responsible for 19% of the entire emissions from the public sector alone [15]. Moreover, in the United States, educational buildings use approximately 6% of the entire public water usage in the country [16]. HEIs are reported to have a larger impact than any other organizations or institutions in the educational sector. It is reported that HEIs use 3–4.9 more times of energy than schools [17]. In China, the energy and water consumed by university/college students are four and two times higher than the average consumptions [18]. In Norway, the emission per student at a university is significantly higher than the national average per citizen [19]. Many studies highlighted the significance and challenges of HEIs buildings in the overall environmental impact reduction in different countries, such as Australia [20], Spain [21], China [8,22], the UK [23], Norway [19], Saudi Arabia [24], and Canada [25]. These studies also pointed out challenges that universities are facing to achieve their goals, e.g., 43% of the HEIs in Canada fell behind their energy baseline targets [26].
The National Science Foundation defines an engineering system as “a combination of components that work in synergy to collectively perform a useful function.” [27] Infrastructures in HEIs like academic buildings can be considered as engineering systems because they require many different components, such as energy, water, lighting, and air circulation systems, in order to function properly. The operation of academic buildings is associated with significant amounts of water, energy, and carbon (WEC) flows. The current sustainability assessment tools aggregate the indicators of an HEI ’s performance regarding the social, economic, and environmental sustainability to a final score; however, this aggregated score may not be very useful to the improvement of the HEI’s environmental performance from an infrastructure management perspective. Thus, an assessment tool focusing on WEC flows is essential for enhancing the environmental performance of infrastructure in HEIs. To this end, this study aims to develop a methodology for environmental performance benchmarking of academic buildings through the lens of infrastructure management. Thus, the environmental performance in this paper is evaluated by assessing WEC flows in academic buildings [25].
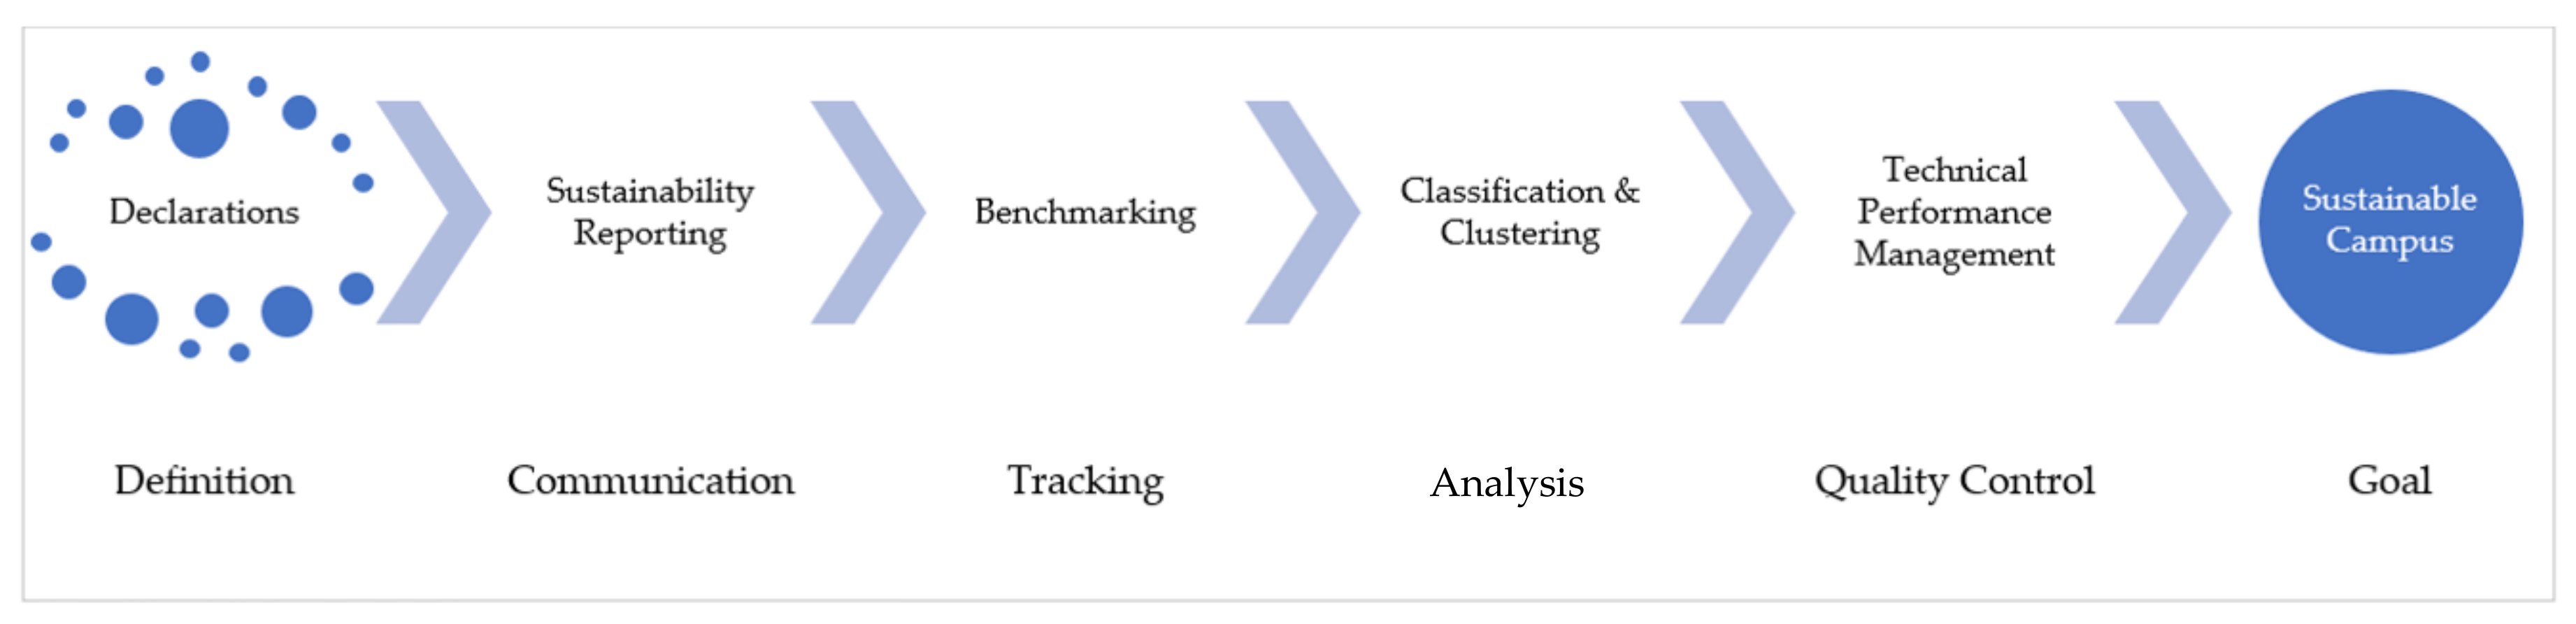
Significant WEC flows in HEIs make them a pivotal point of attraction for countries to meet the international emission reduction commitments and sustainable development targets [28]. Figure 1 shows a conceptual road map to improve the sustainability performance of HEIs. Attesting to declarations is the first step that HEIs acted upon to deal with the plethora of attempts to define, raise awareness, and communicate sustainable issues on campuses. These non-statutory declarations cover a wide range of topics in sustainability (pedagogical and operational), and they impact the sustainability in HEIs in three distinctive ways: (i) They help shape an instrumental argument of the surrounding role of a university in relation to sustainable development [29,30]; (ii) these declarations help formulate national legislations around resource utilization and highlight goals towards reducing the adverse impacts of HEIs; (iii) they pave the road towards the development of tools that help rank, assess, and communicate the progress of sustainability in HEIs [25,31]. As of 2011, there were 31 declarations in the context of education, and 1400 universities have signed them [31]. However, the number of universities that have signed these declarations is small comparing to the total number of HEIs worldwide. Furthermore, the declarations primarily focused on raising the awareness of sustainability in HEIs but did not provide any mechanism to assess sustainability performance [32].
HEIs began reporting their sustainability performances through reporting systems in early 2006. The first sector-specific reporting system was the Graphical Assessment of Sustainability in Universities (GASU) [33]. Many reporting systems were created afterwards, and the most used one is the sustainability tracking, assessment, and rating system (STARS) [34]. STARS evaluates an HEI’s performance in five categories: engagement, planning and administration, academics, innovation, and operations. Moreover, within those categories are subcategories and criteria of measurement. STARS assesses the HEI in terms of its performance in 247 areas and then provides with one of the overall performance ranks: platinum, gold, silver, or bronze [34]. STARS was firstly used to assess the HEIs in North America, and later its application was promulgated across the world. The system launched its first reporting version in 2010 with 149 HEIs and, to date, there are nearly 1000 registered institutions. Out of the registered HEIs, over 600 reports from 40 different countries. The number of reporting HEIs is still relatively small in comparison to the overall number of HEIs [35]. This can be due to certain challenges faced by the HEIs such, e.g., complexity of the sustainability assessment methods and the limitations in resources to complete the assessment within the allocated timeframe [34]. Another limitation of these reporting systems is related to the weighting structure used [35]. As these systems cover a wide array of areas, the direct impact on climate change (i.e., GHG emissions) can be underestimated by assigning higher weights to other socio-economic parameters [36]. One of such an example is the case of the University of Alberta: The university reported an increase of nearly 34% in emissions and at the same time received a Gold ranking [37].
HEIs face several challenges in reporting their sustainability performance, such as lacks of (i) interpretation of sustainability specifically in the area of climate change [38], (ii) guides or mechanisms to provide systematic roadmaps to a sustainable campus [39], and (iii) baseline values to create a cross-institutional performance comparison [40]. To overcome these limitations, Martin and Samels [41] proposed benchmarks as a means to establish a mechanism for disseminating key information, establishing best practices, and set baseline values for the industry [41]. The current methods consider a singularity approach in benchmarking buildings, i.e., building type. Such methods may come up with misleading outcomes because of their inability to consider opposing or multiple features of a building [42].
Benchmarking is a widely used tool to compare the performance of a building or a set of buildings to those of a larger pool of similar buildings under similar pressures (e.g., GHG emissions). There are two approaches of benchmarking: The top-down approach and the bottom-up approach, and the selection of a suitable approach depends on the purpose of assessment, type of data, and the level of information available. The top-down approach is suitable for evaluating the overall building performance, such as the total energy usage intensity (EUI) [43], while the bottom-up approach builds on the aggregated values of each inner component of the building at each zone, e.g., the summation of the total heating, ventilation and air condition (HVAC), and lighting [44]. Benchmarking consists of three stages: Planning (to define the objectives and scope), analysis (to identify performance gaps), and finally an integration step to continuously and systematically implement the findings [45]. There are several methods used to benchmark buildings performance depending on the data available and the degree of benchmarking to be completed: white-box, black-box, and grey-box. The first refers to data generated from simulations, the second is referred to when statistical approaches are used, and the final is a combination of the first two [46]. A number of studies conducted on educational buildings can be found in the recent literature [20,21,47,48].
Benchmarking for buildings should be performed in buildings with similar functions and characteristics. For instance, a residential building should not be compared with a commercial building due to the differences in internal factors (e.g., demand, scope, operational hours) and external factors (e.g., climatic conditions). Therefore, data need to be collected in ways that meet the definition, scope, and strategy of the benchmarking process. However, due to the large set of data collected, issues of misleading information may arise. For example, whether or not to include water used for irrigation as part of the total water usage could lead to a significant difference in water usage benchmarking of buildings because this part of water usage is heavily influenced by climate factors, area of the landscape, and the vegetation species. To minimize the uncertainty caused by dissimilar data, use of multi-dimensional features instead of one parameter/indicator is encouraged in performance benchmarking [42].
With a continuous and rigorous data collection, the need to compare the performances of buildings based on similarities in function, size, and climatic conditions becomes prominent. The act of measuring the performances of a group (i.e., cluster) of buildings, sharing similar features and characteristics, and compare those to other building groups has emerged as a new benchmarking approach [42,49,50]. Many studies used classification methods as a means to understand energy consumption patterns in HEIs. For example, Khoshbakht et al. [20] classified 80 HEI buildings in Griffith University, Australia into six classes—office, administration, library, research, teaching, and mixed buildings—based on the major activities that are carried out within those buildings. For instance, if 40% of the area in a building is allocated to laboratories, then the building will be classified into the research type. In another study, Chihib et al. [21] classified 33 buildings of the University of Almeria into six classes, i.e., research, administration, teaching, library, sports facilities, and restaurants, and compared their performances over a time span of 8 years using independent climate variables and other dependent variables like occupancy [21]. Both studies found that buildings classified into the research type (i.e., laboratory-intensive) use a higher ratio of energy than other building types. Tan et al. [22] analyzed Tongji University in China and broke down the energy consumption for student dorms, research buildings, classrooms, office, libraries, and others, and the results showed that dorms account for 29% of the total energy consumption [8,22].
Studies also highlighted that the research buildings equipped with many laboratories consume significantly higher amounts of energy than other research buildings [20,21]. This agrees with the findings reported by Mills et al. [51] that laboratorial buildings are 4–5 times more energy-intensive than commercial and institutional (non-laboratory) buildings. Another study by Federspiel et al. [52] reported similar findings. One reason for the high energy consumption could be that the air-exchange rate uses more energy in laboratory-intensive buildings than that traditional buildings [52]. Furthermore, natural science and engineering buildings are equipped with more laboratories than buildings designed for economic, law, and art sciences, and thus, they are associated with higher energy consumptions [53]. Federspiel et al. [52] applied a model-based benchmarking methodology on an academic building at the University of California, Berkeley campus and calculated the total building energy consumption based on the minimum amount of energy required to fulfill a set of functions in compliance with code-compliant environmental controls, then used the calculated energy consumption and compared it with the actual reported data to assess the efficiencies of the cooling equipment and identified the inefficient mechanical cooling designs. The results can help identify potentials for reducing energy consumption when devising a laboratory-intensive research building.
Finally, benchmarking is a technical performance tool used in liaison with a broader management strategy to help the leading organizations to improve their performance through identification of best in class, communication of performances, and to improve resource utilization systematically and dynamically [38,54]. However, benchmarking alone does not propose a set of solutions for an organization—benchmarking is a means to an end, not the final destination [55,56,57,58]. A number of studies focused on different approaches to underpin the cause and effect of inefficient energy use in universities. Some of the studies used classification approaches to determine the characteristics of buildings in terms of their intended uses (e.g., library, office, and laboratory) [20,21,22]. Others attempted to pinpoint the behavioral aspect by using stochastic approaches to define the influence of occupancy [48,57,58], and finally, a macro study analyzed the sector performance in terms of their ability to achieve their commitments to reduce GHG emissions [25].
To establish a benchmark for academic buildings, several issues must be considered. Firstly, the challenge of appropriate classification of buildings: Since only the performance of similar buildings can be compared, and there is no publicly accessible database to assist the classification, a methodology that uses unsupervised learning to derive the hidden patterns of building performance data is needed. Secondly, conventional crisp clustering approaches, such as the k-means clustering draw hard boundaries between the classified groups, which may bring uncertainties to the clustering results. For example, two buildings with similar performance may be classified into two different groups because of the hard boundary created by the crisp clustering. Fuzzy logic can address this issue by introducing the concept of “partial truth”. Thirdly, several studies have used fuzzy logic to help benchmark a building’s performance; however, the performance was benchmarked based on single-dimensional data (e.g., energy consumption or carbon emission) [42,59]. Limited attention has been placed to performance benchmarking by considering a multitude of a building’s characteristics (e.g., WEC flows). To address these issues, this study proposes an unsupervised fuzzy clustering analysis to reduce the uncertainty of the building classification results generated based on multi-dimensional data.
Fuzzy clustering analysis is used in the literature to limit the uncertainties that may arise from a large number of data and parameters used. Many studies applied fuzzy approaches to performance benchmarking of different systems; for example, Chung [60] applied fuzzy linear regression analysis to develop a benchmarking method for commercial buildings, Iliadis et al. [61] applied fuzzy c-means algorithms to determine the risk factors in a Greek forest, Krajnc et al. [62] applied fuzzy logic to compare performances between two plants, Santamouris [59] applied fuzzy clustering techniques to 320 schools in Greece to assess energy and environmental performance in school buildings. Kouloumpis and Azapagic [63] used fuzzy evaluation for life cycle-integrated sustainability assessment as a tool to evaluate five different sources of energy and identified the most sustainable sources of energy to help decision and policy makers. Haider et al. [64] used a fuzzy synthetic evaluation technique to develop a sustainability index for small-sized urban neighborhoods. However, limited studies have used fuzzy clustering analysis to classify academic buildings based on their WEC flows.
The objectives of this paper are to provide a review of the steps and studies taken historically to define, attain, and measure environmental performance in HEIs; to propose fuzzy clustering analysis-based framework for HEIs to benchmark the performance of academic buildings by holistically considering energy and water consumption and carbon emission. The developed framework is applied to a university in Canada, and based on the benchmarking results, potentials for environmental performance improvement in the university are recommended. The developed framework can aid decision-makers in setting, and achieving, environmental goals and targets in the context of HEIs.
2. Methodology
2.1. General Framework
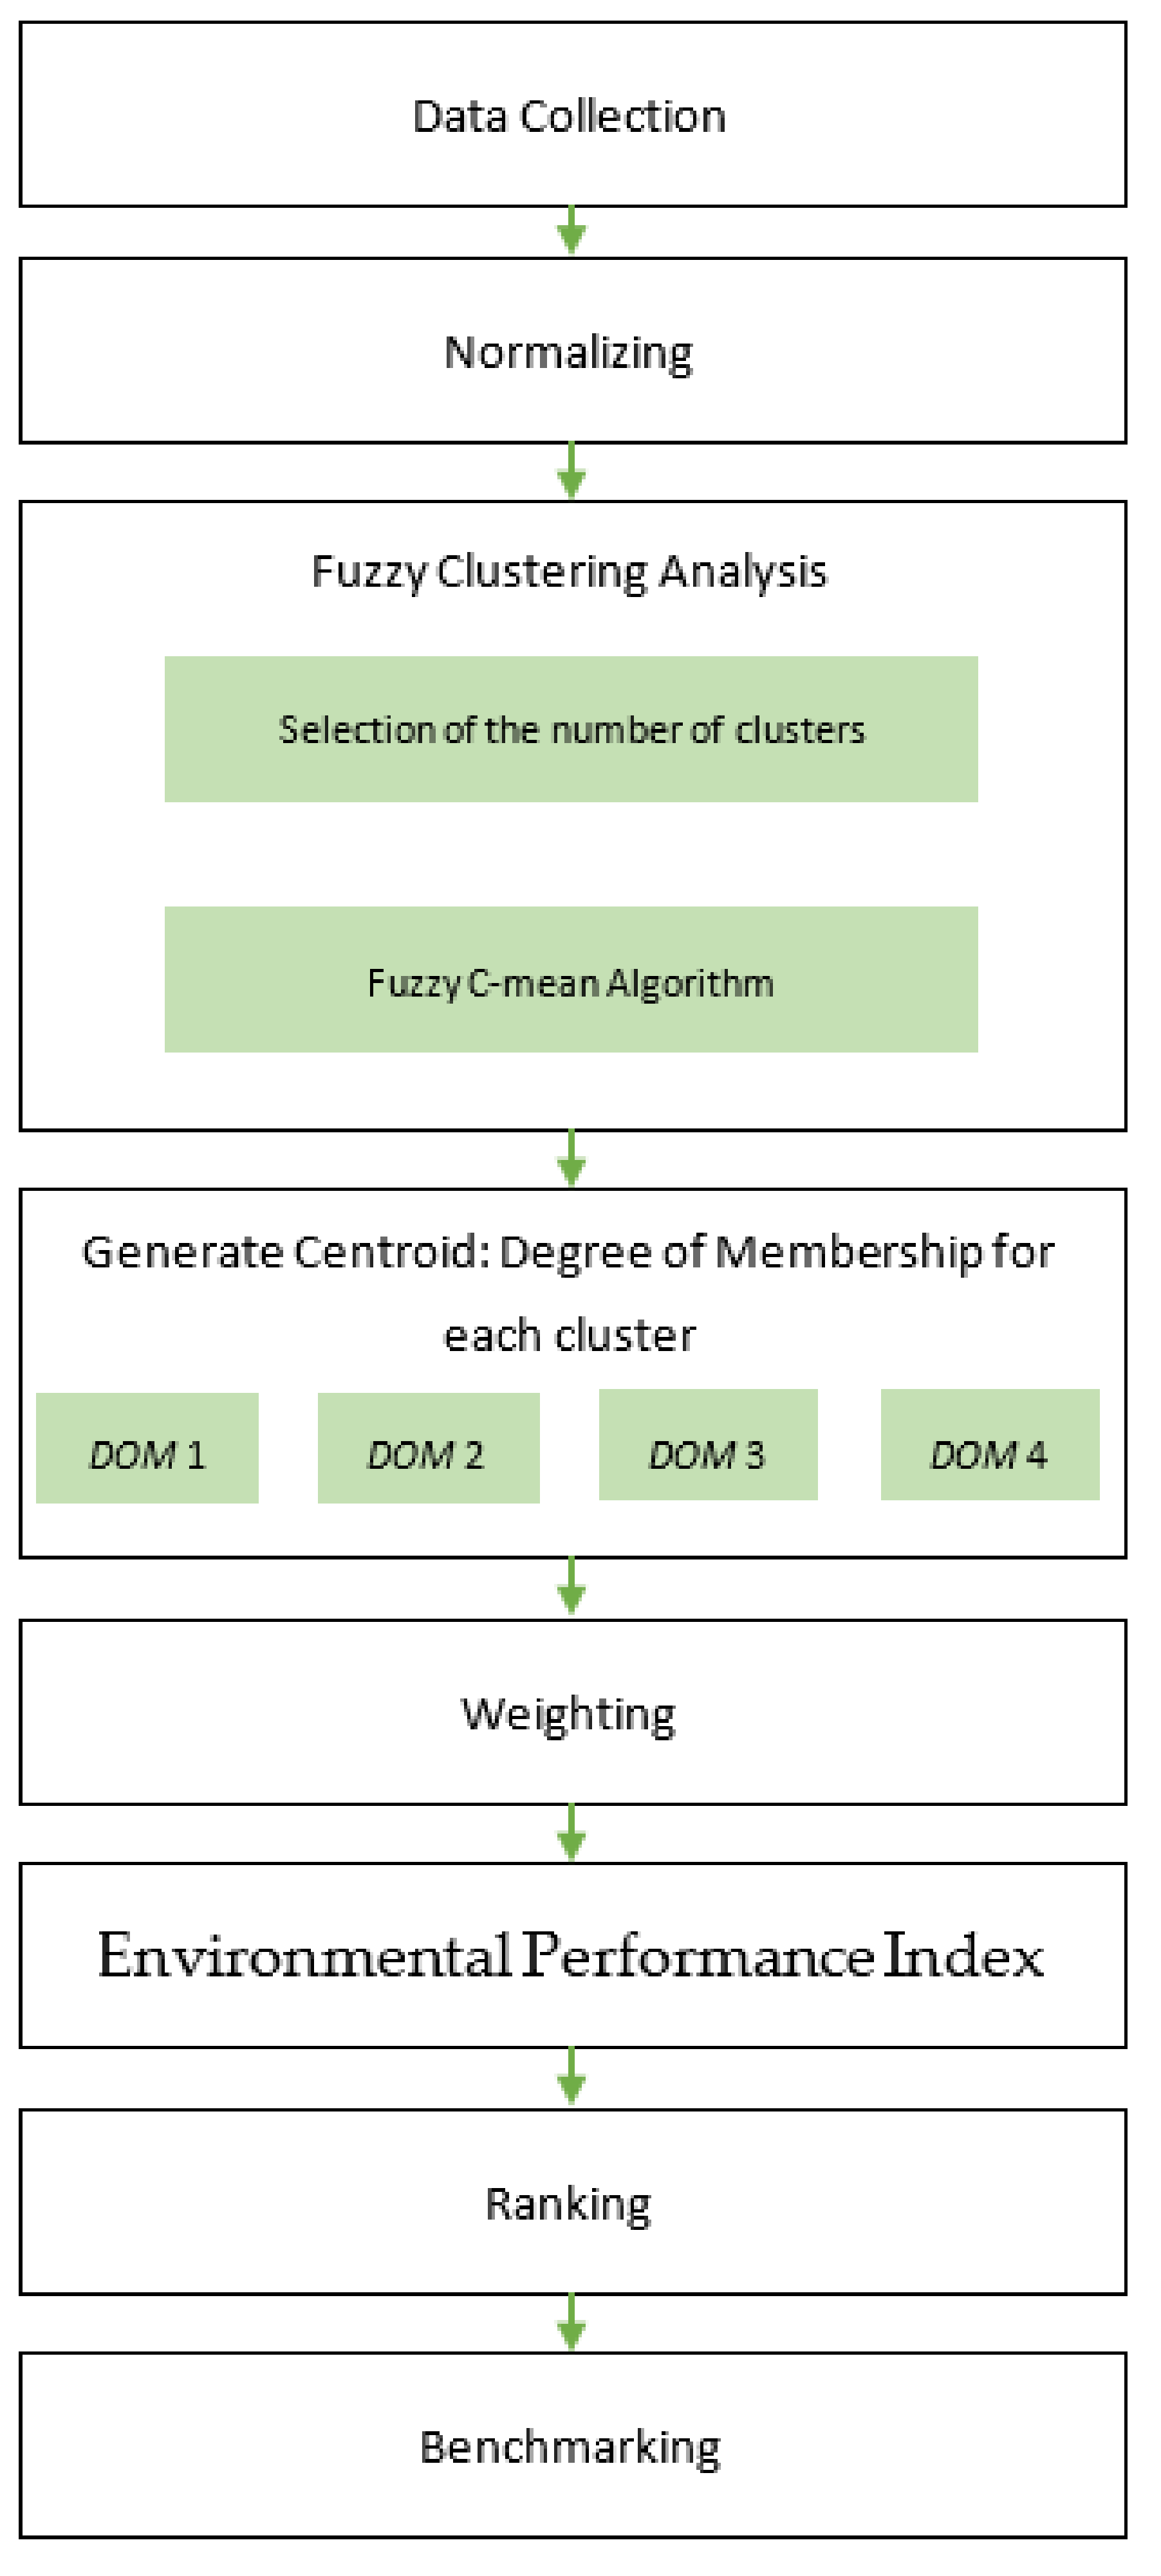
The proposed fuzzy clustering-based framework is outlined in Figure 2. The framework provides a local classification of different buildings within a university according to their similarities in resource consumption and GHG emissions, and then holistically benchmarks the environmental performance of individual buildings, among others within the same class. The first step is to select the performance indicators needed to be benchmarked. In the case of this study, energy and water consumption data were collected, and subsequently, the carbon emission was derived from the energy consumption data collected. These parameters relevant to water, energy and carbon are referred to as metabolic flows (MF). The MF are used as performance indicators because they are the most important aspects influencing the environmental impacts within the context of HEIs. The second step is to normalize MF data using a common factor, such as climatic factors, area, and a number of users. After normalization, MF data can be converted to several performance indices, such as water usage intensity (WUI), energy usage intensity (EUI), and carbon usage intensity (CUI).
The derived indices are used as inputs to the fuzzy clustering analysis using the fuzzy clustering algorithm. The optimal number of clusters is determined by using the elbow method. This method is used to evaluate the reduction of within-group variance that is brought by increasing the number of clusters. The reduction of within-group variation as a function of the increase of cluster number is graphically represented as an “elbow”, where the “elbow point” is often selected as the optimal number of clusters [42,65]. After the fuzzy clustering analysis, each building assessed will be assigned a degree of membership (DOM) to the clusters formed. The general environmental performance of each cluster, in terms of WUI, EUI, and CUI, will be evaluated and ranked. A weighting method may be needed if the performance indices do not follow the same direction. Finally, an environmental performance index is generated for each building based on its DOMs to different clusters using a weighted aggregation method. The environmental performance of individual buildings can be ranked according to their environmental performance indices.
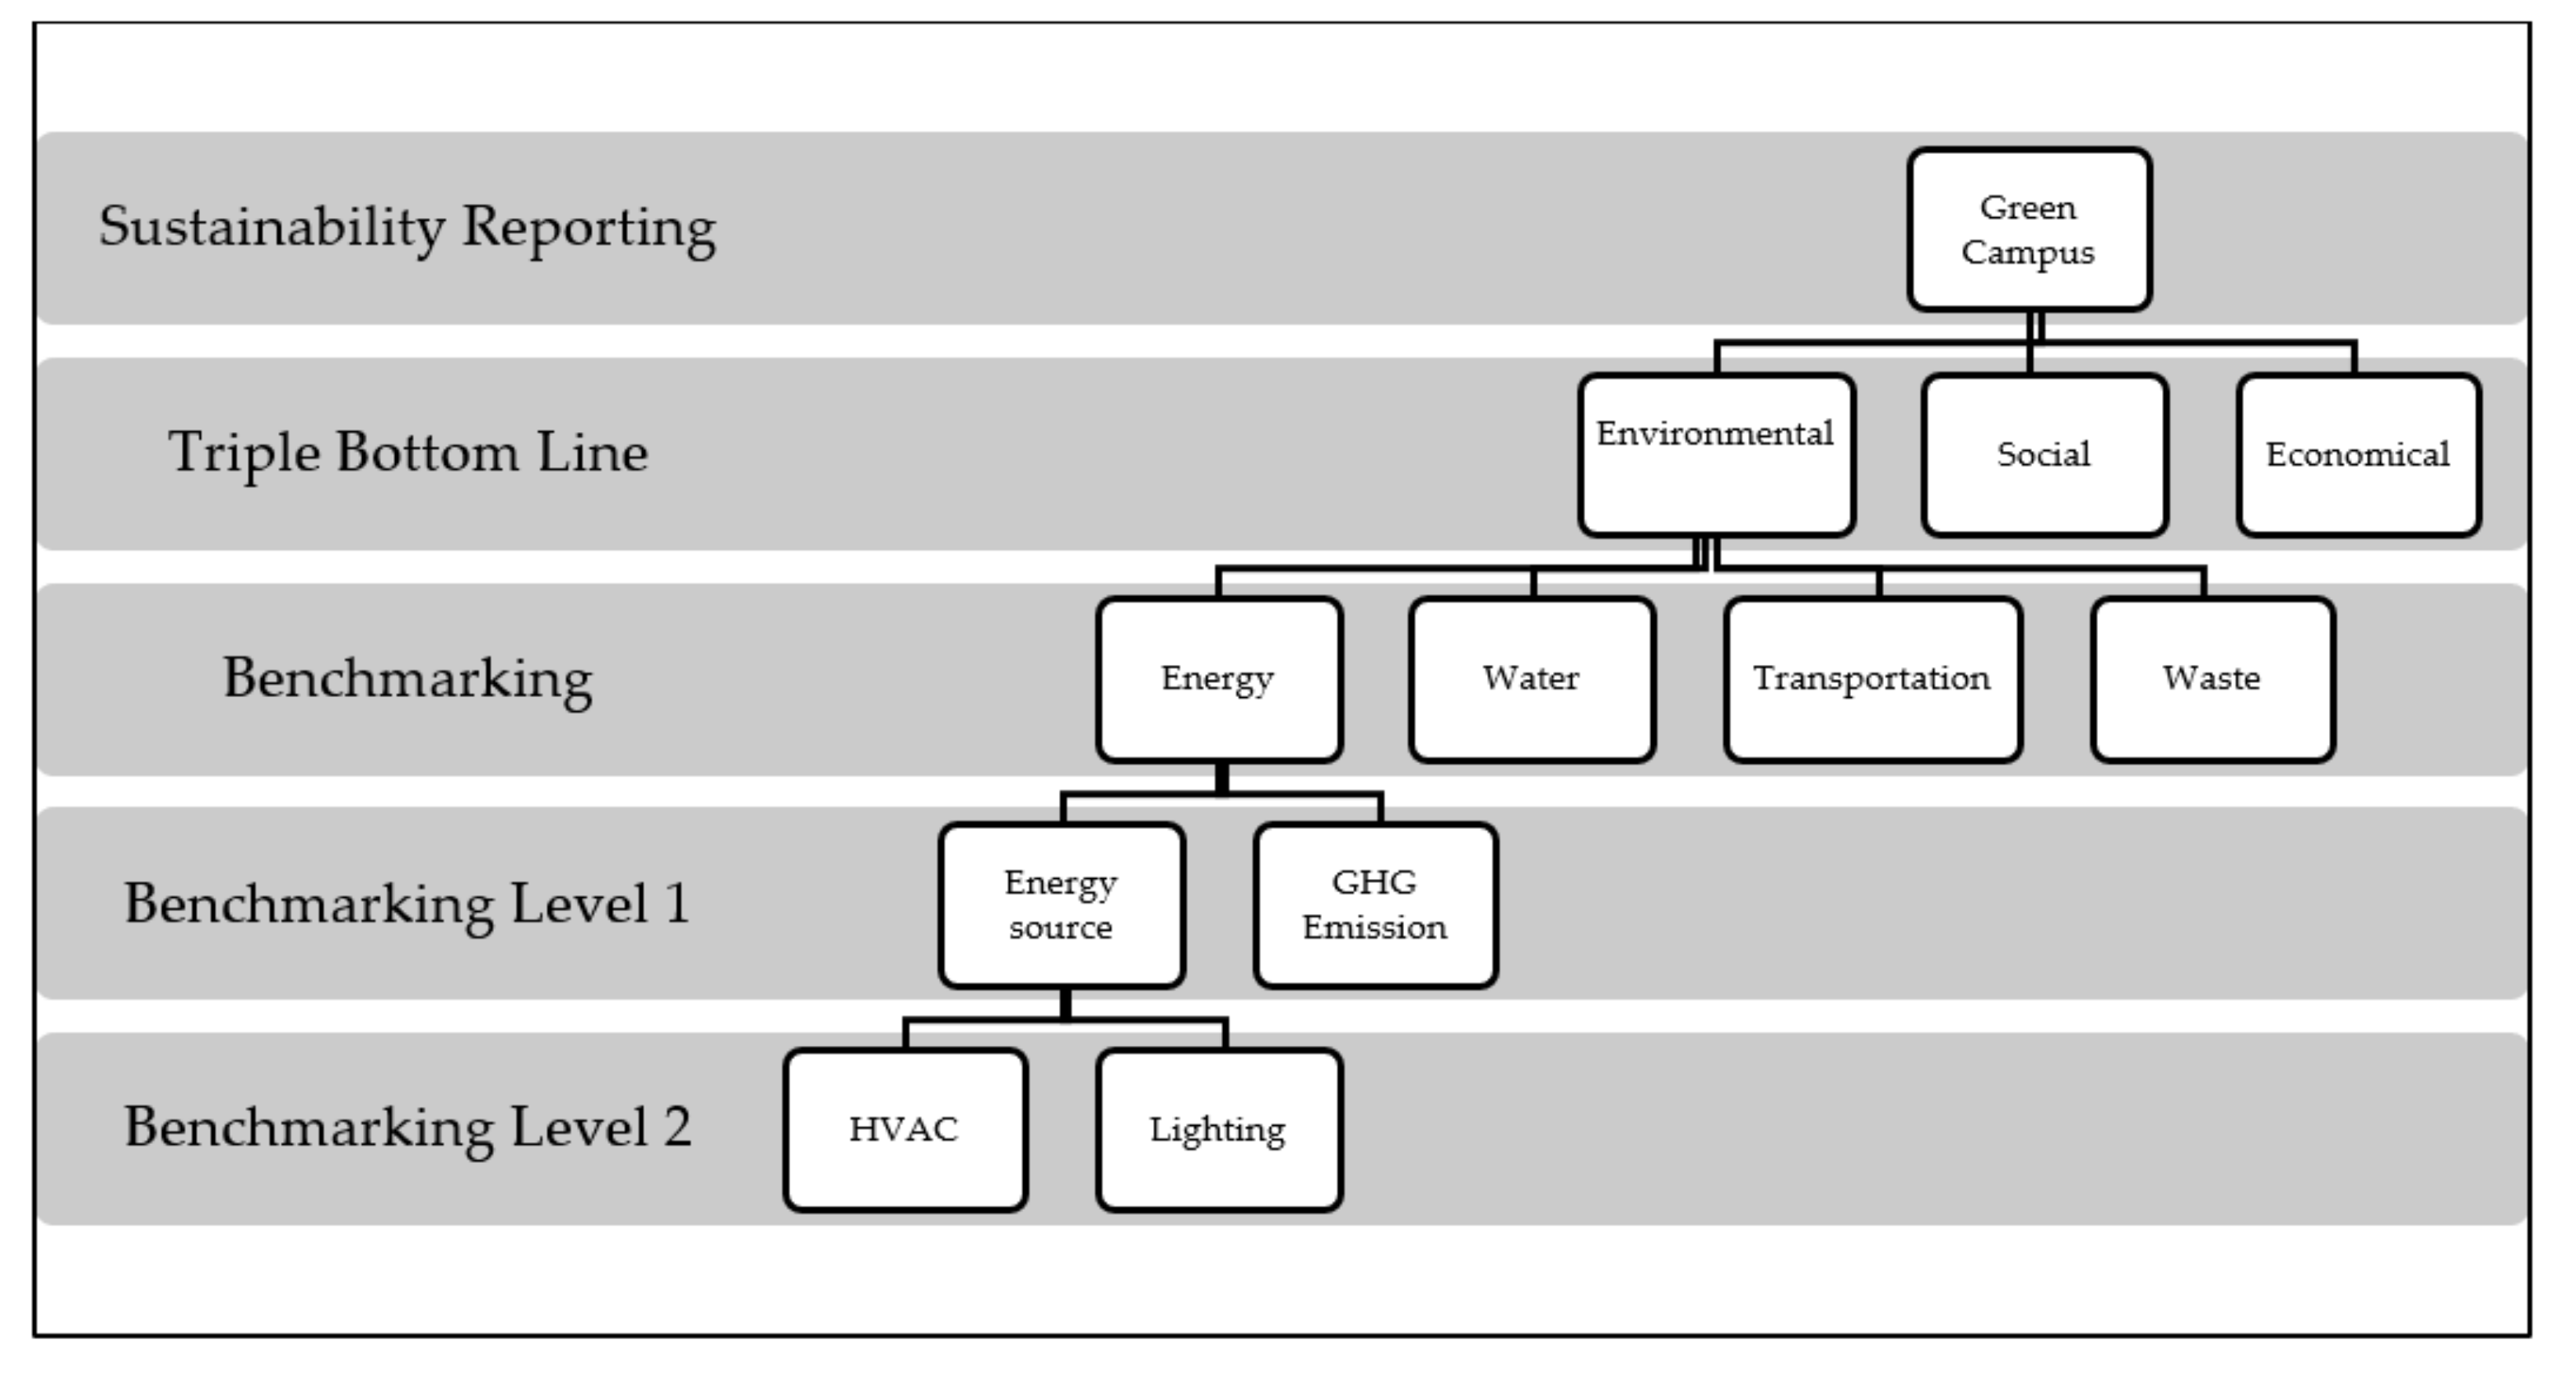
In this study, the framework is applied at the building level (top-down benchmarking) based on the available data and the type of study conducted [66]. However, the framework can be generalized further to include a bottom-up approach of benchmarking by aggregating data of building components (e.g., HVAC components and lighting type). By including this sort of data for each level of the building, a better understanding of these characteristics will be gained, and better information will be provided for the management to act upon (i.e., by determining inefficient components). The bottom-up approach is shown in Figure 3. As more data becomes available (through simulations and or measurements), better information can be gained which will help improve the quality of the data and subsequently improve the assessment results by pinpointing inefficiencies in a building (e.g., inefficient cooling method).
2.2. Case Study
The University of British Columbia (UBC) is investigated as a case study. UBC is one of the largest and highly ranked universities in Canada, and is home to 64,798 students and a total of 16,891 faculty and staff. UBC consists of two main campuses: The Vancouver campus (UBCV) and the Okanagan campus (UBCO) in two different yet close geographical regions. The first is in Vancouver where is a moderate oceanic climate, while the other campus in Kelowna is roughly 280 km inland towards the east. Kelowna is characterized as a subcontinental hemiboreal climate that is generally drier than Vancouver with warmer summers and colder winters. The annual precipitation in Vancouver is about 3.25 times more than Kelowna on average [67]. There are over 160 buildings in both the campuses, including classroom, laboratory, library, administration, residential, and recreational buildings. Due to the lack of continuous data recording for more than half of the buildings, only 71 buildings are included in the case study.
The university uses energy from several sources to operate buildings, such as electricity supplied by the service providers, natural gas, and biomass-derived energy. Close to 95% of BC’s electricity is generated from renewable sources, with hydro being the most dominant and important source [68]. There are other small energy sources, such as geothermal and biodiesel, and limited quantities of solar energy panels on the residential buildings. UBCV reports energy by source for general usage as electricity and for the source of energy used for heating as well, in addition to water usage in the Skyspark portal [66]. The portal provides the energy and water consumption data for most of the buildings, in days, week, months and years. In addition to the types of buildings (e.g., percentage of classrooms, laboratories, libraries, and offices), and the areas of buildings are also recorded in the Skyspark portal. The distributions of heating energy by sources used in this study are presented in Table 1.
The present study includes 11 buildings in UBCO. The sustainability office on campus provided the information of source wise energy distribution. Electricity from the main grid and natural gas are the two primary energy sources at UBCO. The geothermal plant consumes natural gas to increase the efficiencies of heating and cooling.
To derive the carbon emissions for each building, it is important to know the energy by source for calculating the carbon equivalent of each building. Energy supplying facilities, such as the central heating plants, for both campuses were not included in this study, due to their energy exporting nature.
Based on the available data, a total of 71 buildings at both campuses were evaluated. MF of water and energy consumption data from 1st April 2018 to 31st March 2019 were obtained for the benchmarking. Carbon equivalents were calculated using the method recommended in the BC Best Practices Methodology for Quantifying GHG Emissions [69]. The sources of emission factors are calculated from the relevant literature from the utility companies on the emission factors for the energy source supplied [70]. Table 2 summarizes the emission factors for different energy sources to estimate carbon emission. Table 3 shows the reported energy and water consumptions, and the calculated GHG emissions for Alumni Centre in UBCV as an example. By using the BC Best Practices Methodology for Quantifying GHG Emissions, the CO2e emissions were found to be 38.4 kg for Alumni Centre for both heating energy and electricity used.
The overall goal is to reduce the MFs in the buildings without compromising the operational efficiencies. Part of the MFs is related to water usage; the usage of water, throughout a building’s lifecycle, uses energy and emits GHGs. The upstream emissions associated with energy or water (production, transportation, and recycling) are neglected in this study because they do not fall within a university’s control or sphere of influence. The WEC data of all investigated buildings are summarized in Appendix A. Normalization of the WEC data was carried out by using the building floor area as the normalizing factor.
2.3. Fuzzy Clustering Analysis
The fuzzy clustering analysis conducted in this paper is used in Hu et al. [71]. Before the application of fuzzy clustering analysis, the MF data were normalized based on the building area. The resultant WUI, EUI, and CUI have values on a scale ranging from 0 to 1. The c-means fuzzy clustering algorithm (FCA) was used to group the index values based on their performance on the three factors. One of the FCA characteristics is that it offers each data point in a dataset a DOM to every cluster formed, indicating that each data point belongs to different clusters with a different level of association. The DOM is a unique feature that distinguishes FCA from other crisp clustering algorithms, such as the k-means clustering and hierarchical clustering. This feature offers FCA great flexibility in benchmarking of buildings because it can address fuzzy uncertainties (i.e., the concept of partial truth) and is suitable for grouping data points with weakly defined boundaries [61]. A widely accepted fuzzy clustering algorithm is fuzzy c-means. For a dataset comprising data points, the fuzzy c-means algorithm classifies the data points into predefined clusters based on measured similarities among the data points. Each cluster has a center , and the Euclidean distance between a data point and can be calculated as:
In this study, each additive was considered as a data point defined by three-dimensional values the metabolic flows (i.e., WUI, EUI, and CUI). Thus, the Euclidean distance between data point and in a three-dimensional space was calculated as:
At the beginning of fuzzy c-means, random centers (usually with a value of zero) are selected for the clusters. Based on the derived , a DOM () can be calculated as a measure of the similarity between a data point xi and the cluster:
where m is a fuzzification parameter to determine the degree of fuzziness between different clusters. A higher value of will lead to higher fuzziness between clusters. Commonly takes values between 1.25 and 2 [72,73]. In this study, value was set at 2. The parameter is the Euclidean distance between and the center of the cluster. The new centers of clusters can be calculated as:
Based on the new ej, μj(xi) will be updated. The iteration will continue until the minimum objective function is achieved:
A total of three clusters were formed based on the available factors. The FCA process was carried out using the statistical computing software R TM (version 1.0.136). Based on the value ranges of the three factors, the benchmark characteristics of each cluster can be interpreted. After the FCA, three DOMs can be generated for each value to show the degrees of similarity between the benchmark characteristics and the number of clusters. An environmental performance index can be calculated for each value based on the DOMs using Equation (6):
where is the specific quality-ordered weight of cluster , and is the total number of clusters. The values of were determined by the characteristics of different clusters. For example, values (i.e., the DOMs) can be assigned to the number of clusters ordered from the lowest to the highest benchmark, respectively. The values of were assigned subjectively, and they can be modified to accommodate different levels of the benchmark [74].
To determine the useful number of clusters, an elbow analysis is conducted to calculate within-cluster sum of squares or validity index (VI) as a function of the number of clusters. VI is calculated using the equation adapted from [42]:
where, is the mean of data values of dimension and is the number of data values of dimension that belongs to cluster .
3. Results
3.1. Benchmarking
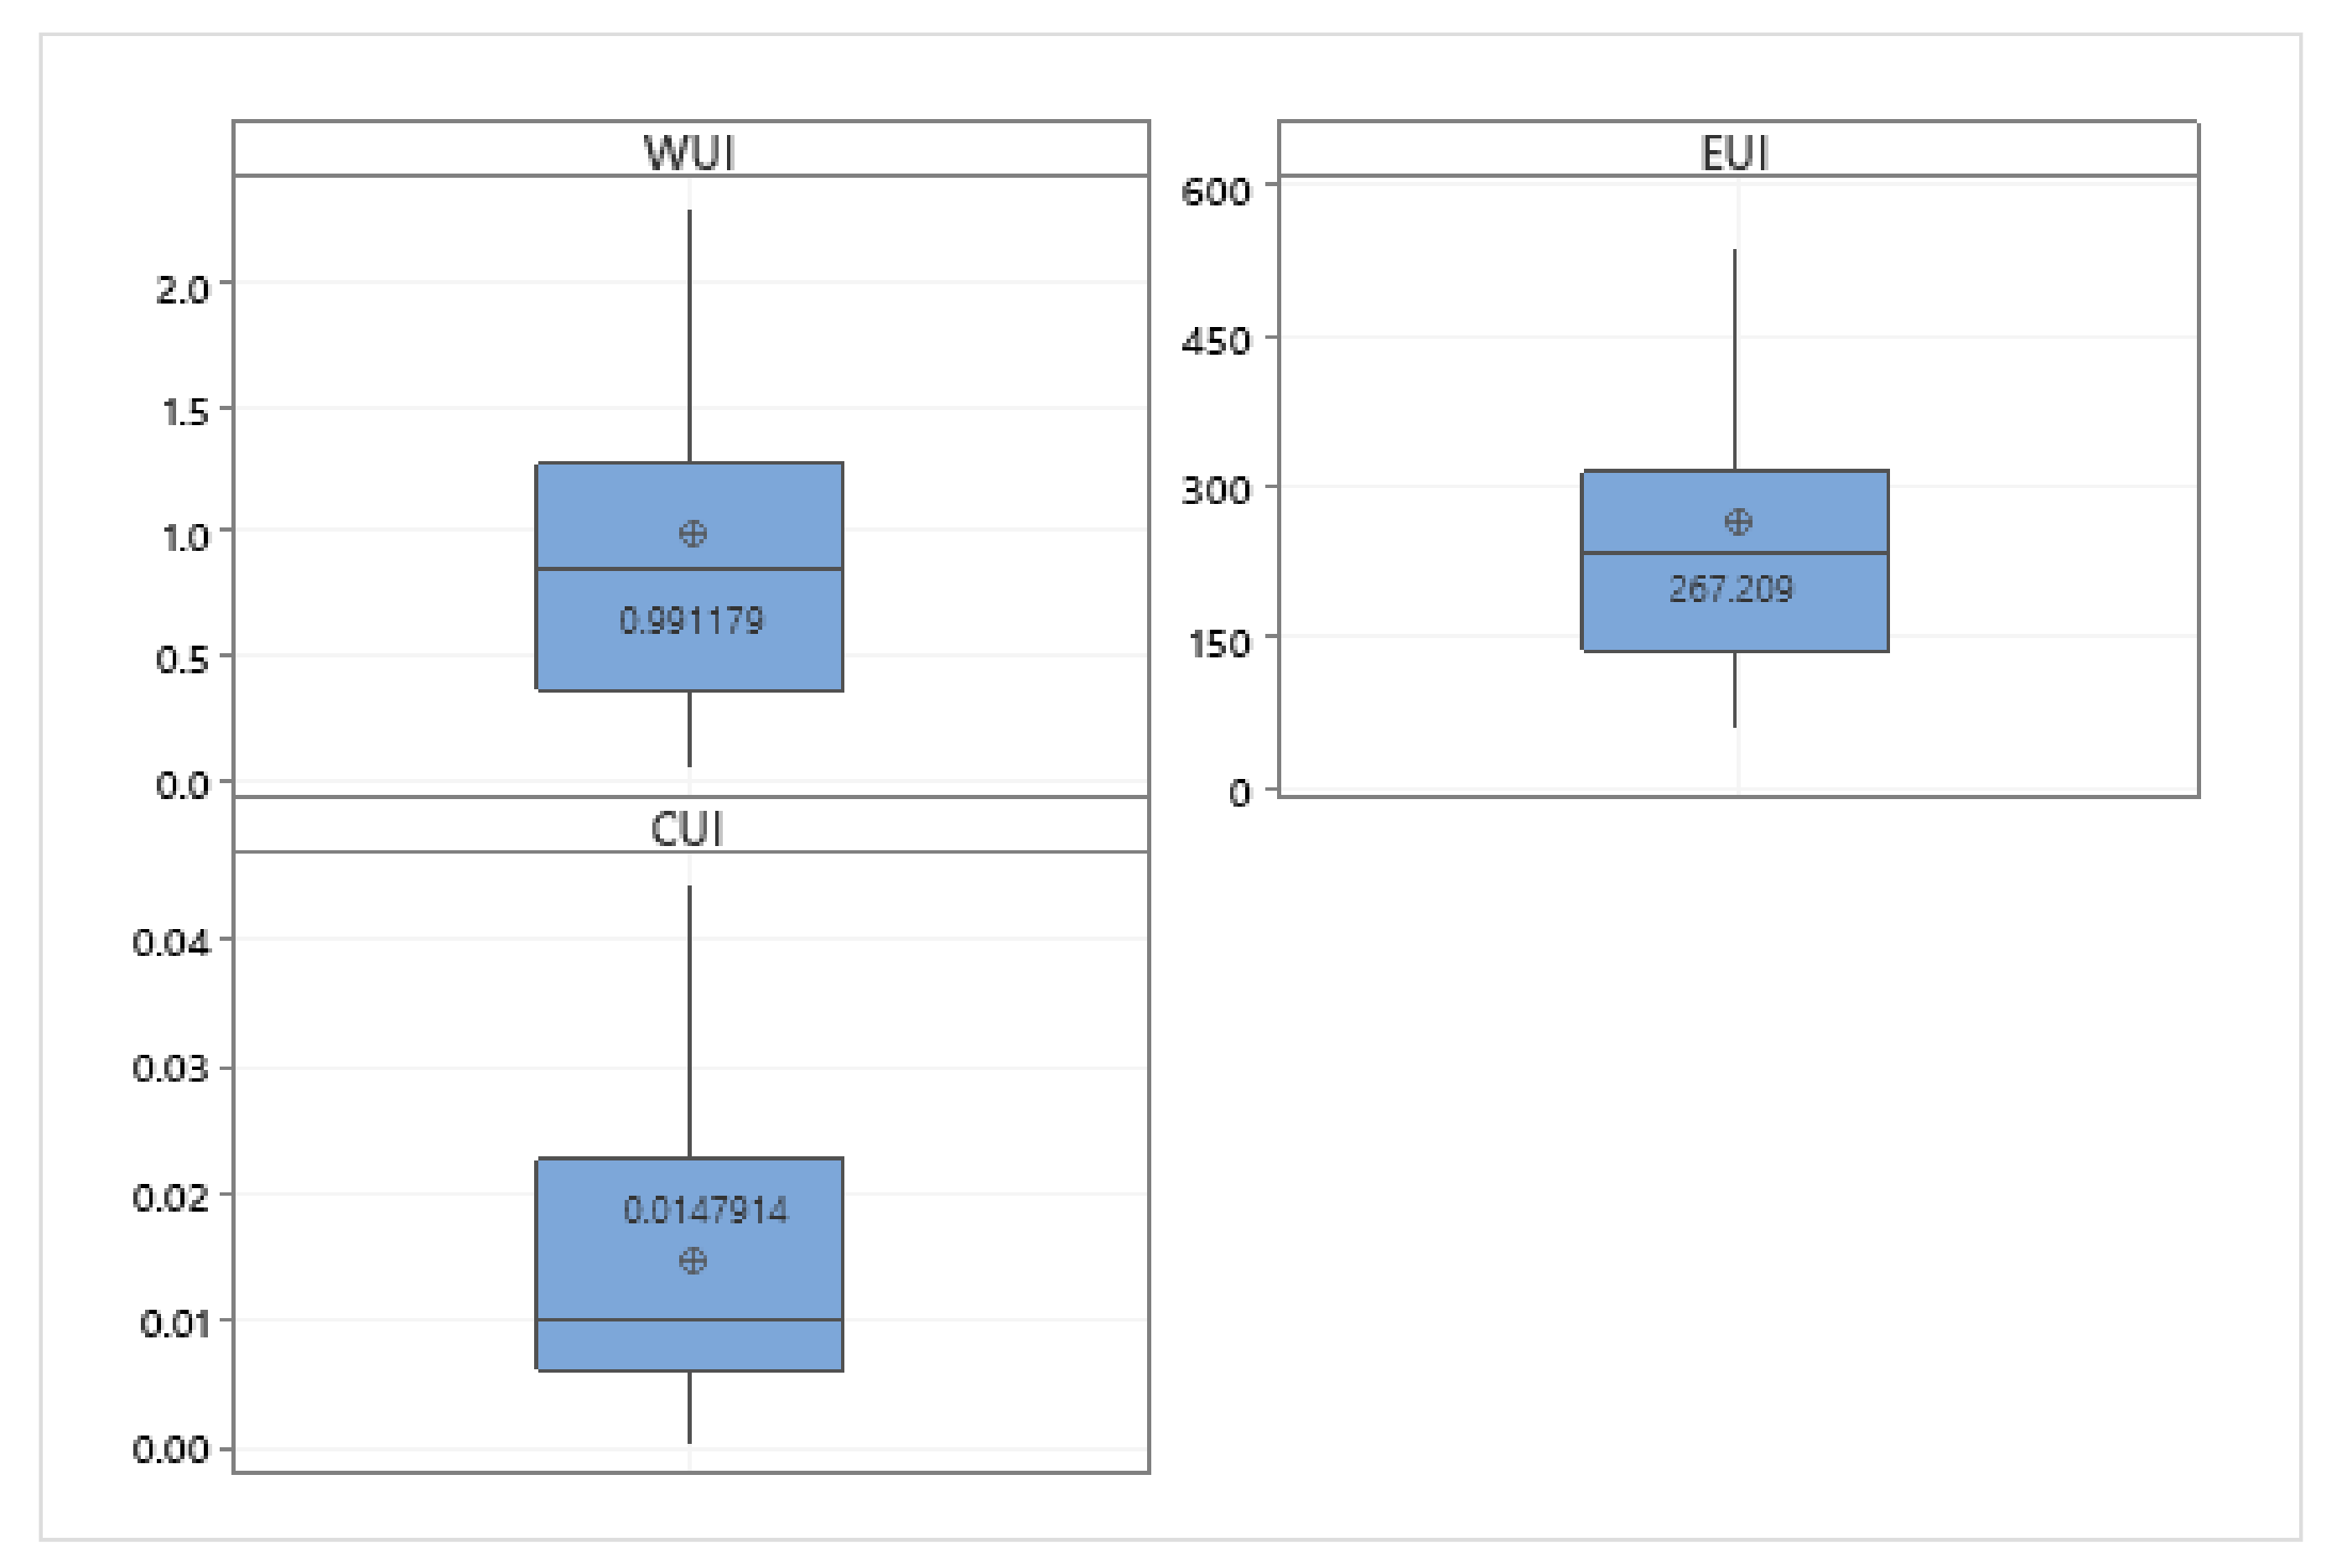
Boxplots of the normalized MF are shown in Figure 4. The mean values are also identified within the boxplots. All variables are not normally distributed, where CUI is more skewed than WUI and EUI. Thus, assuming the mean to be the reference point (benchmark), misleading information could be generated about the distribution of the data.
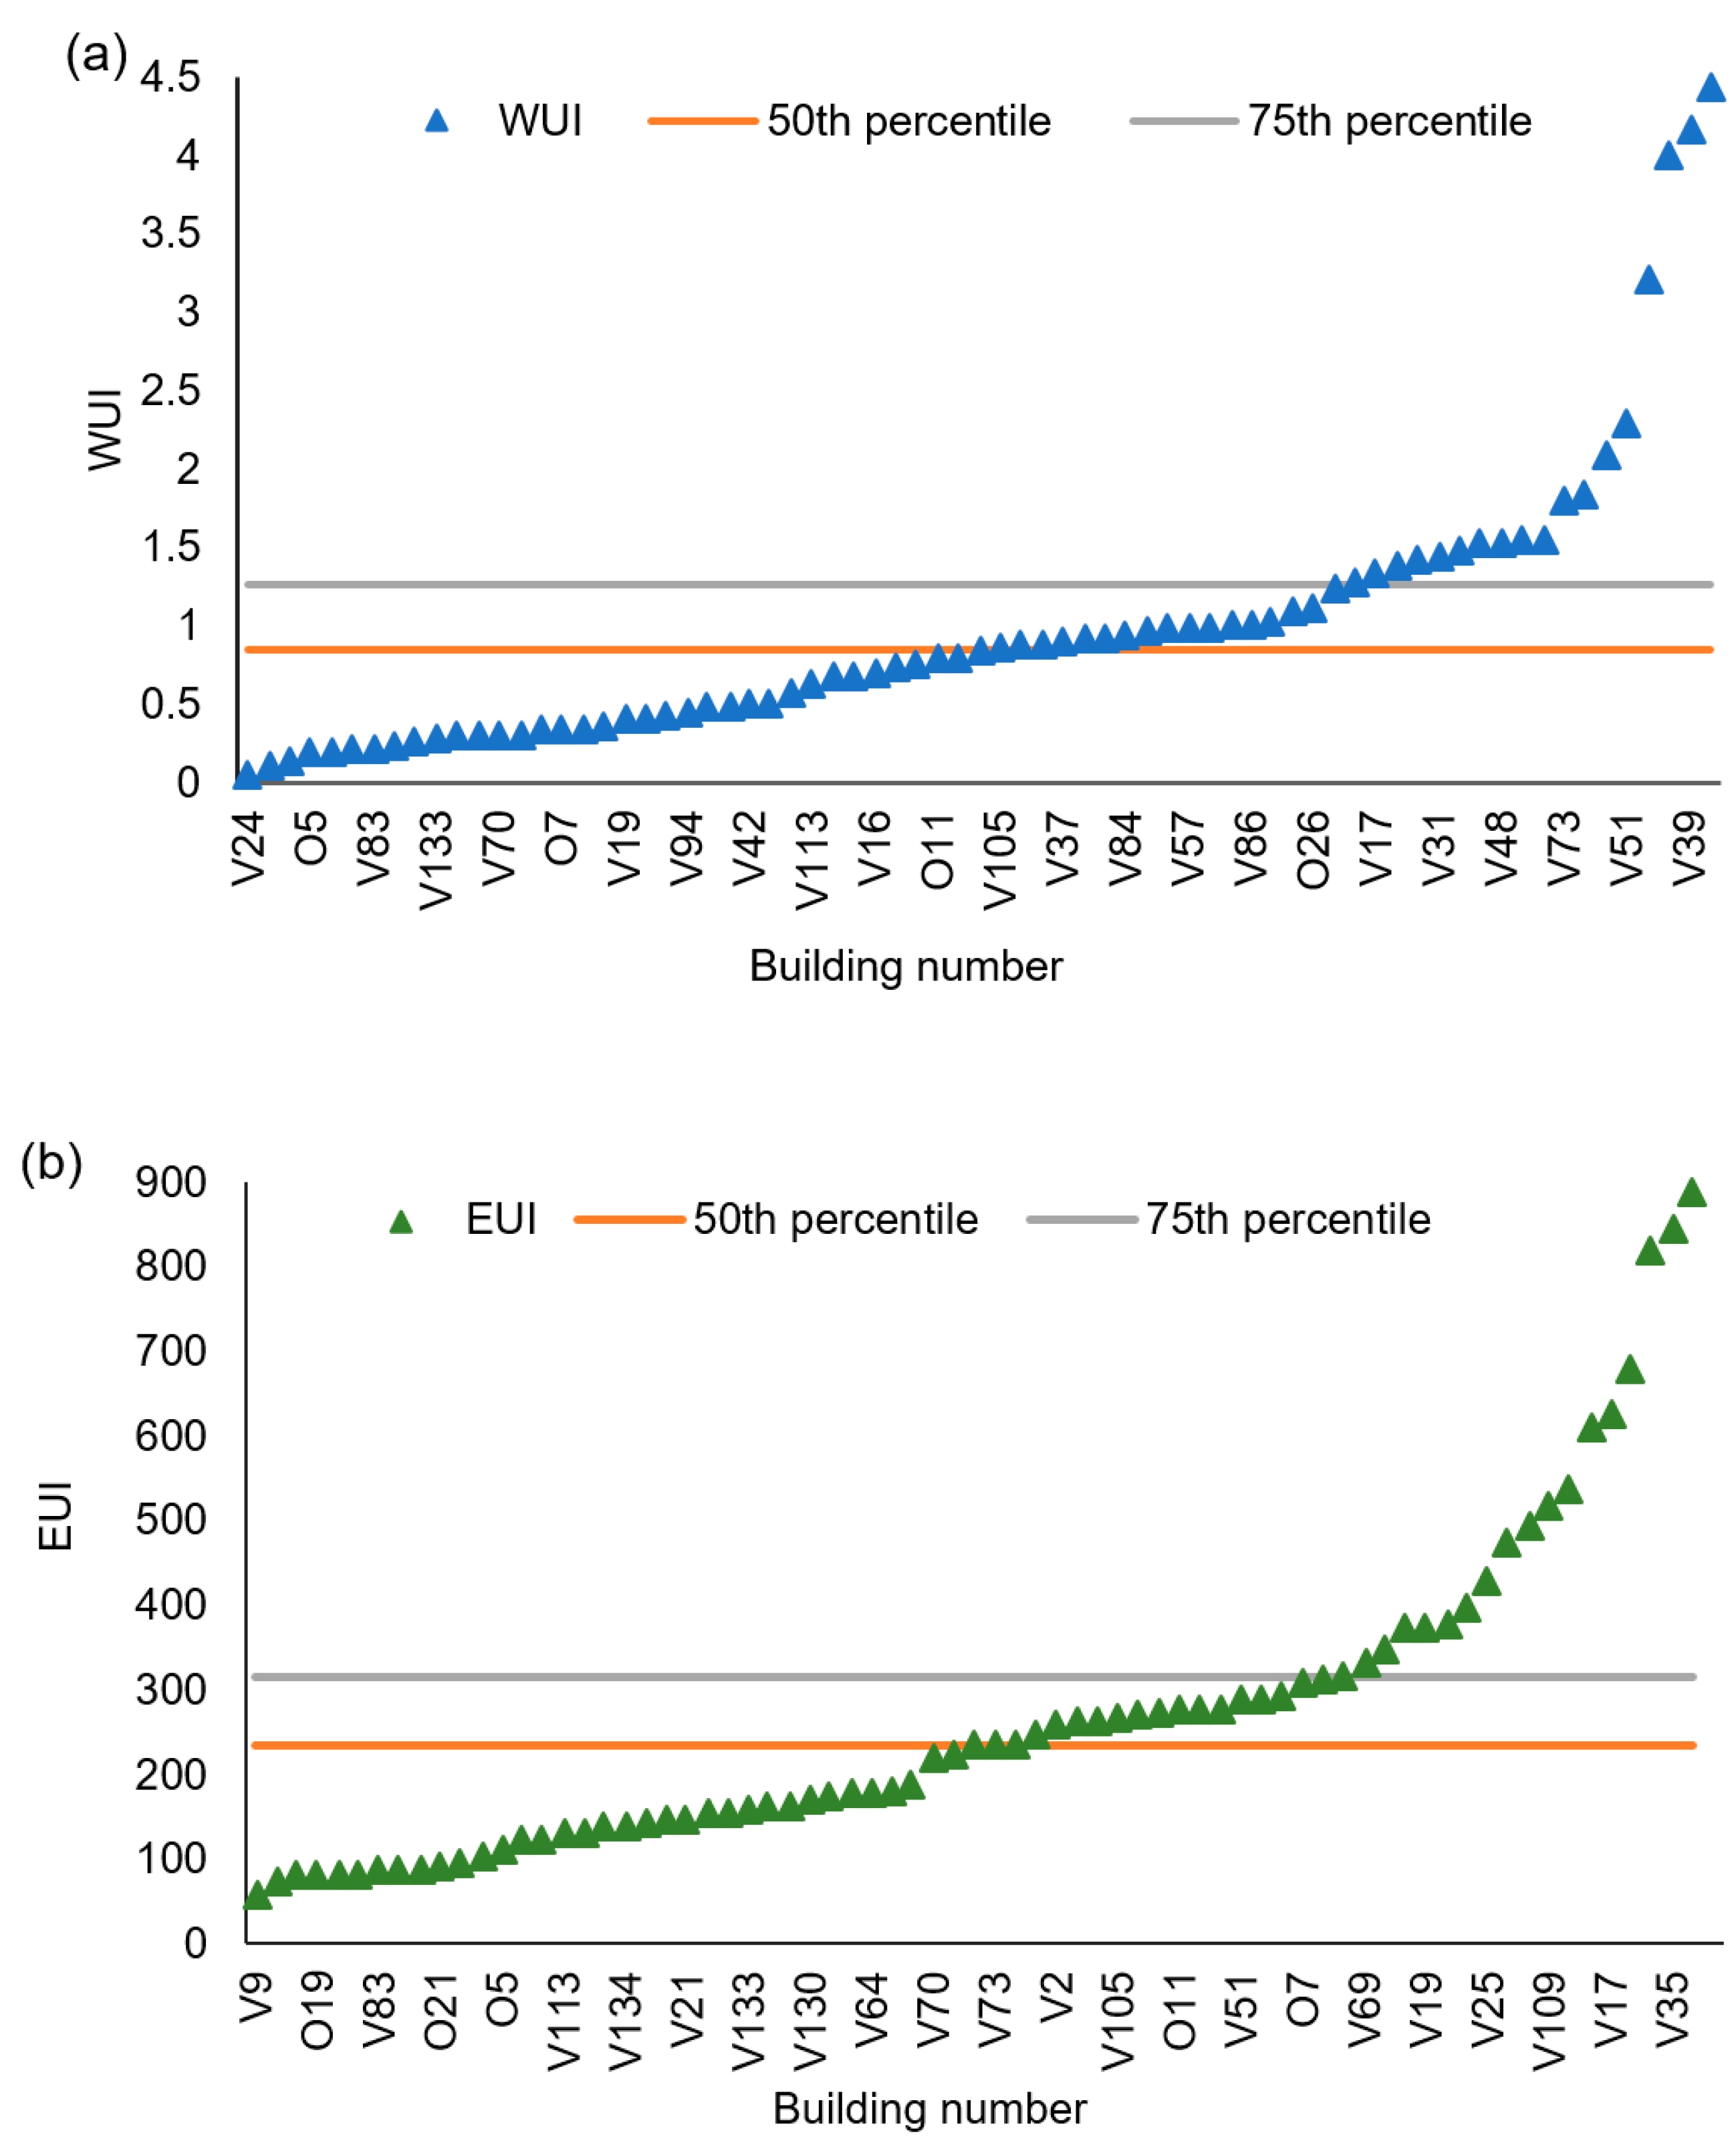
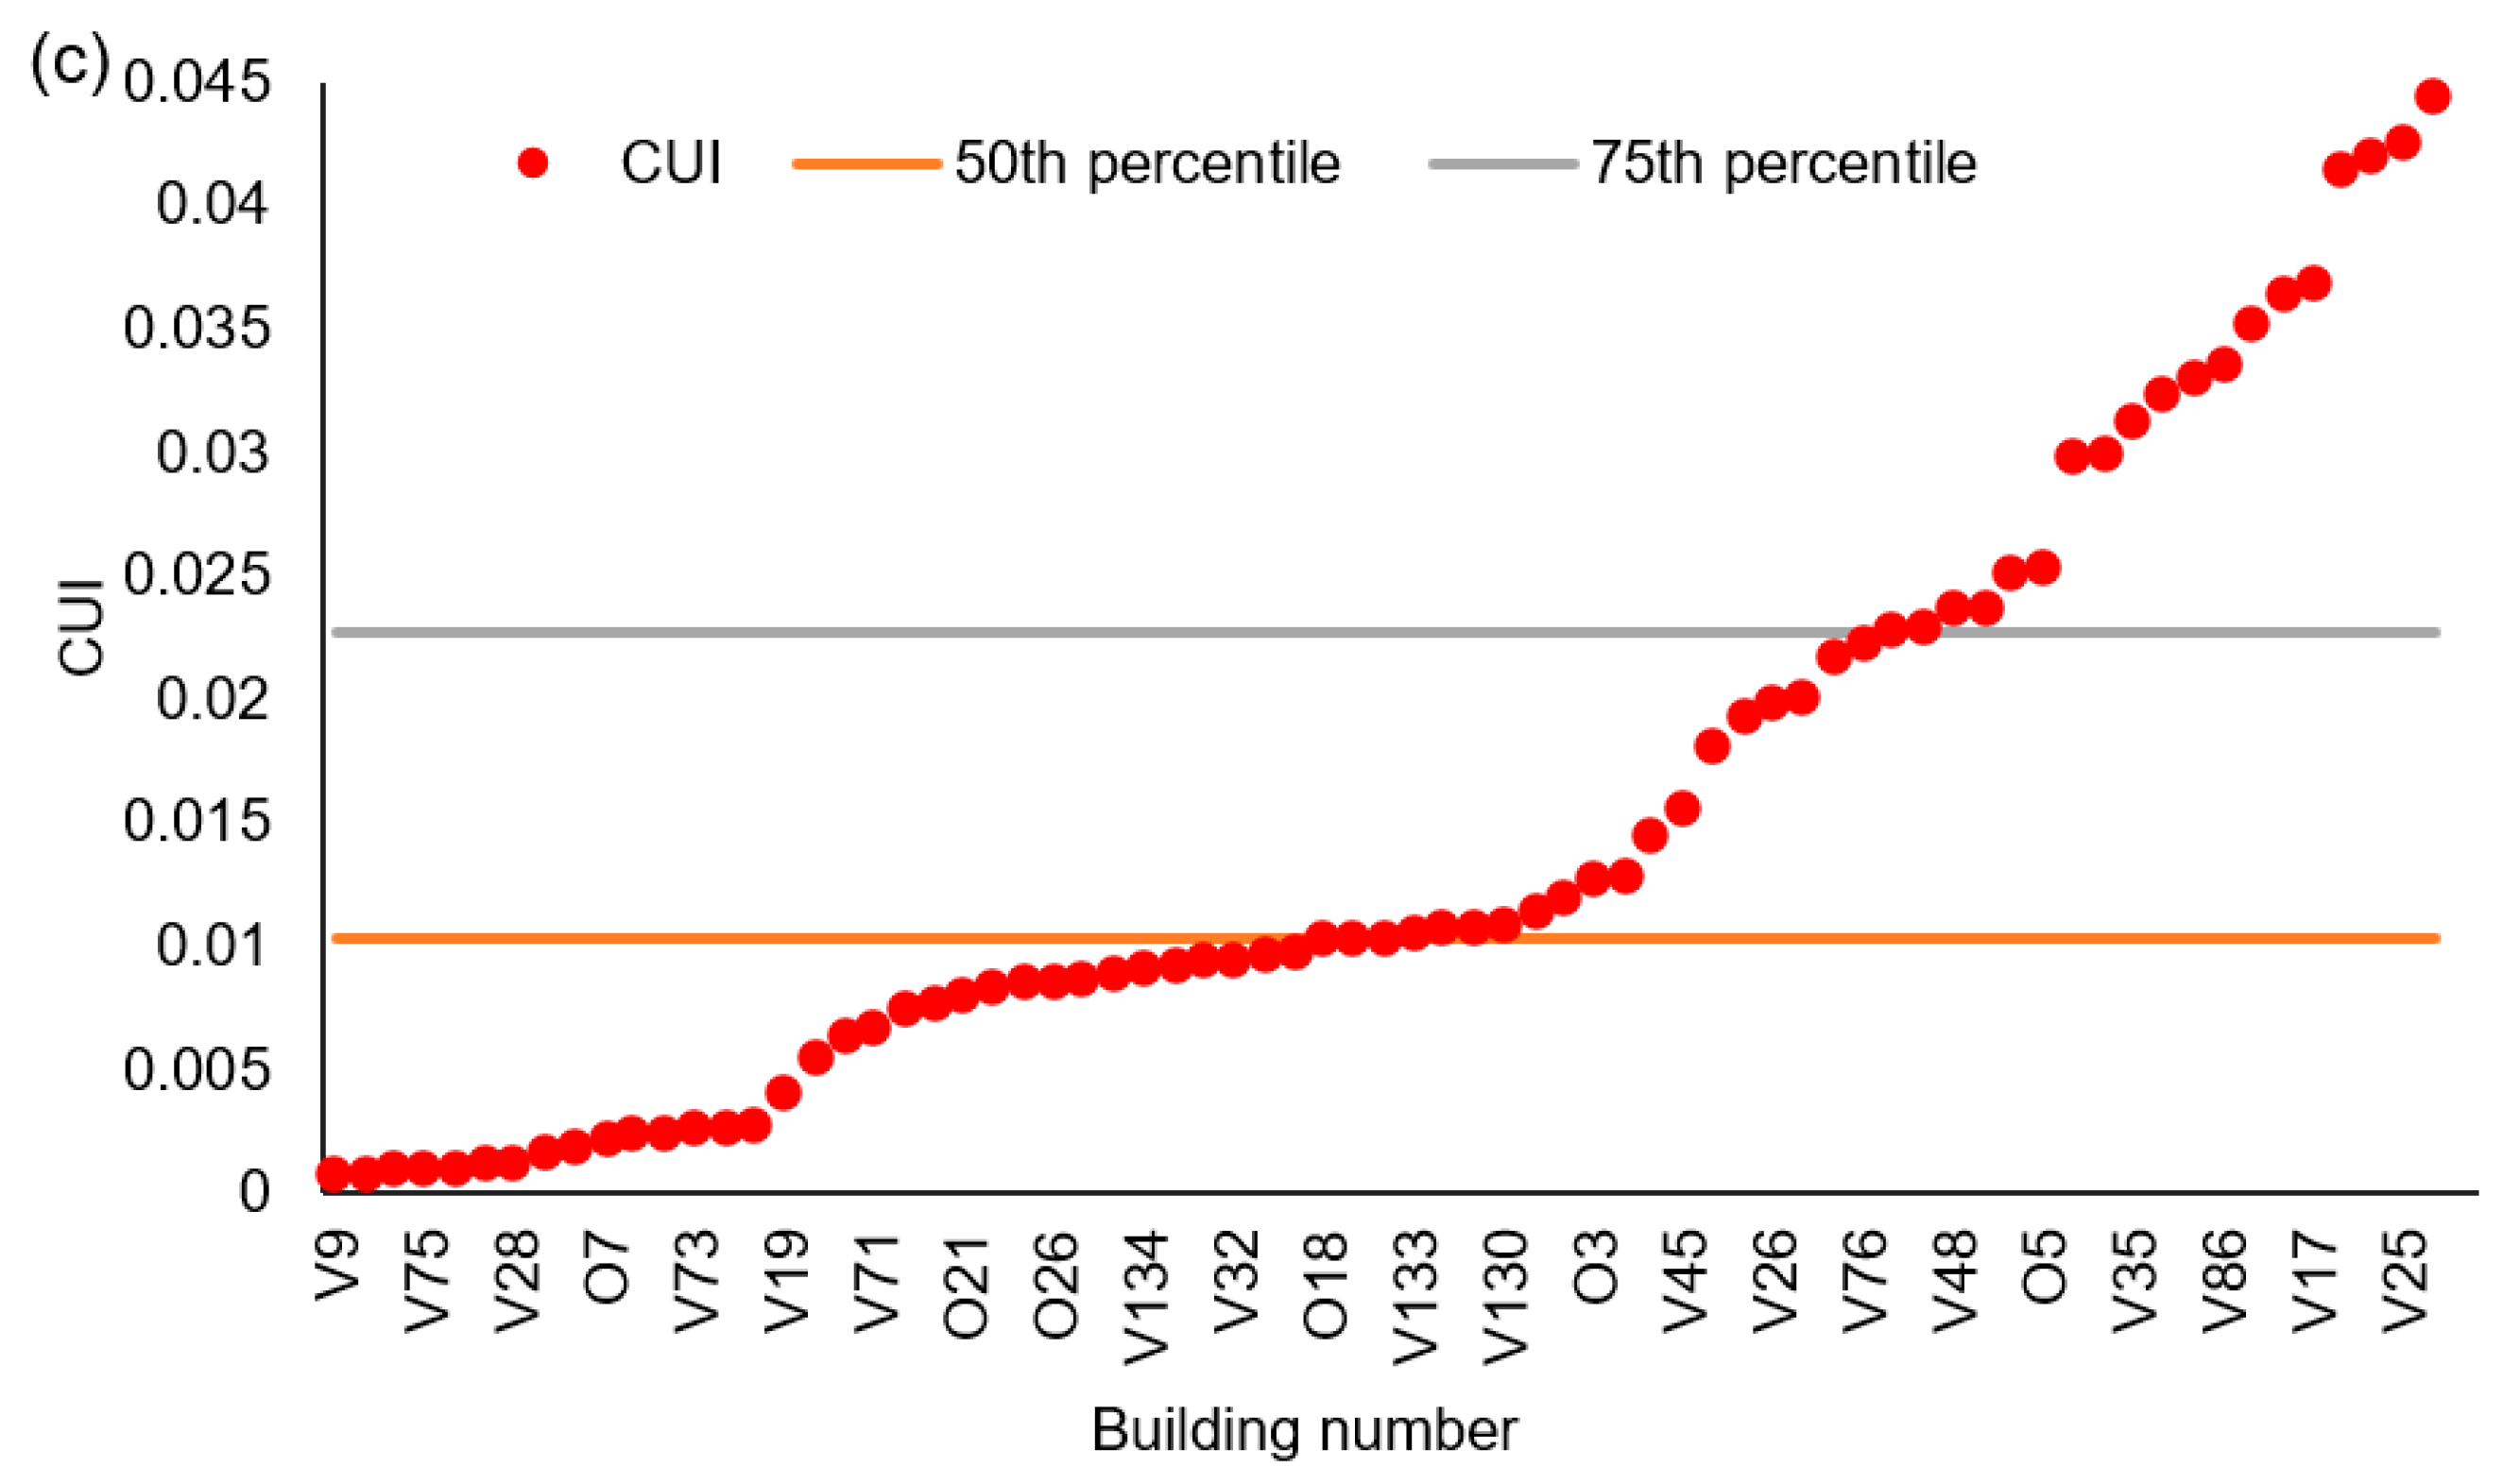
An alternative approach to use the mean as a benchmark for each normalized flow, a cumulative distribution function (CDF) was applied, and the 50th and 75th percentile ranges were used as the benchmarks. This will allow the nature of the distribution in the data to be better reflected and subsequently, give more meaning to the benchmarks. Table 4 shows the suggested benchmarks, the 50th and 75th percentiles, and the number of buildings above and below the benchmark levels. Buildings above the 75th percentiles are considered the buildings with low environmental performance, and buildings below the 50th percentile are considered as the high-environmental performance buildings. A graphical presentation for each normalized MF is presented in Figure 5a–c. By assuming the 75th percentile as a benchmark, all points (buildings) above would be identified with low environmental performance and require management attention.
Academic buildings were considered a subgroup of buildings as per the commercial and institutional building surveys in Canada. This raises two limitations when interpreting similar CDF benchmarking results. First, they cannot be compared against similar (academic) buildings in national reports. Second, it is difficult to conclude which set of buildings has satisfactory environmental performance in comparison with the overall population if the performance of the entire population is not satisfactory [52]. Comparing the best performers to a known high-environmental performance building may help determine whether the performance of the best performers is satisfactory or not. A clustering approach is used to resolve these two limitations.
3.2. Fuzzy Clustering
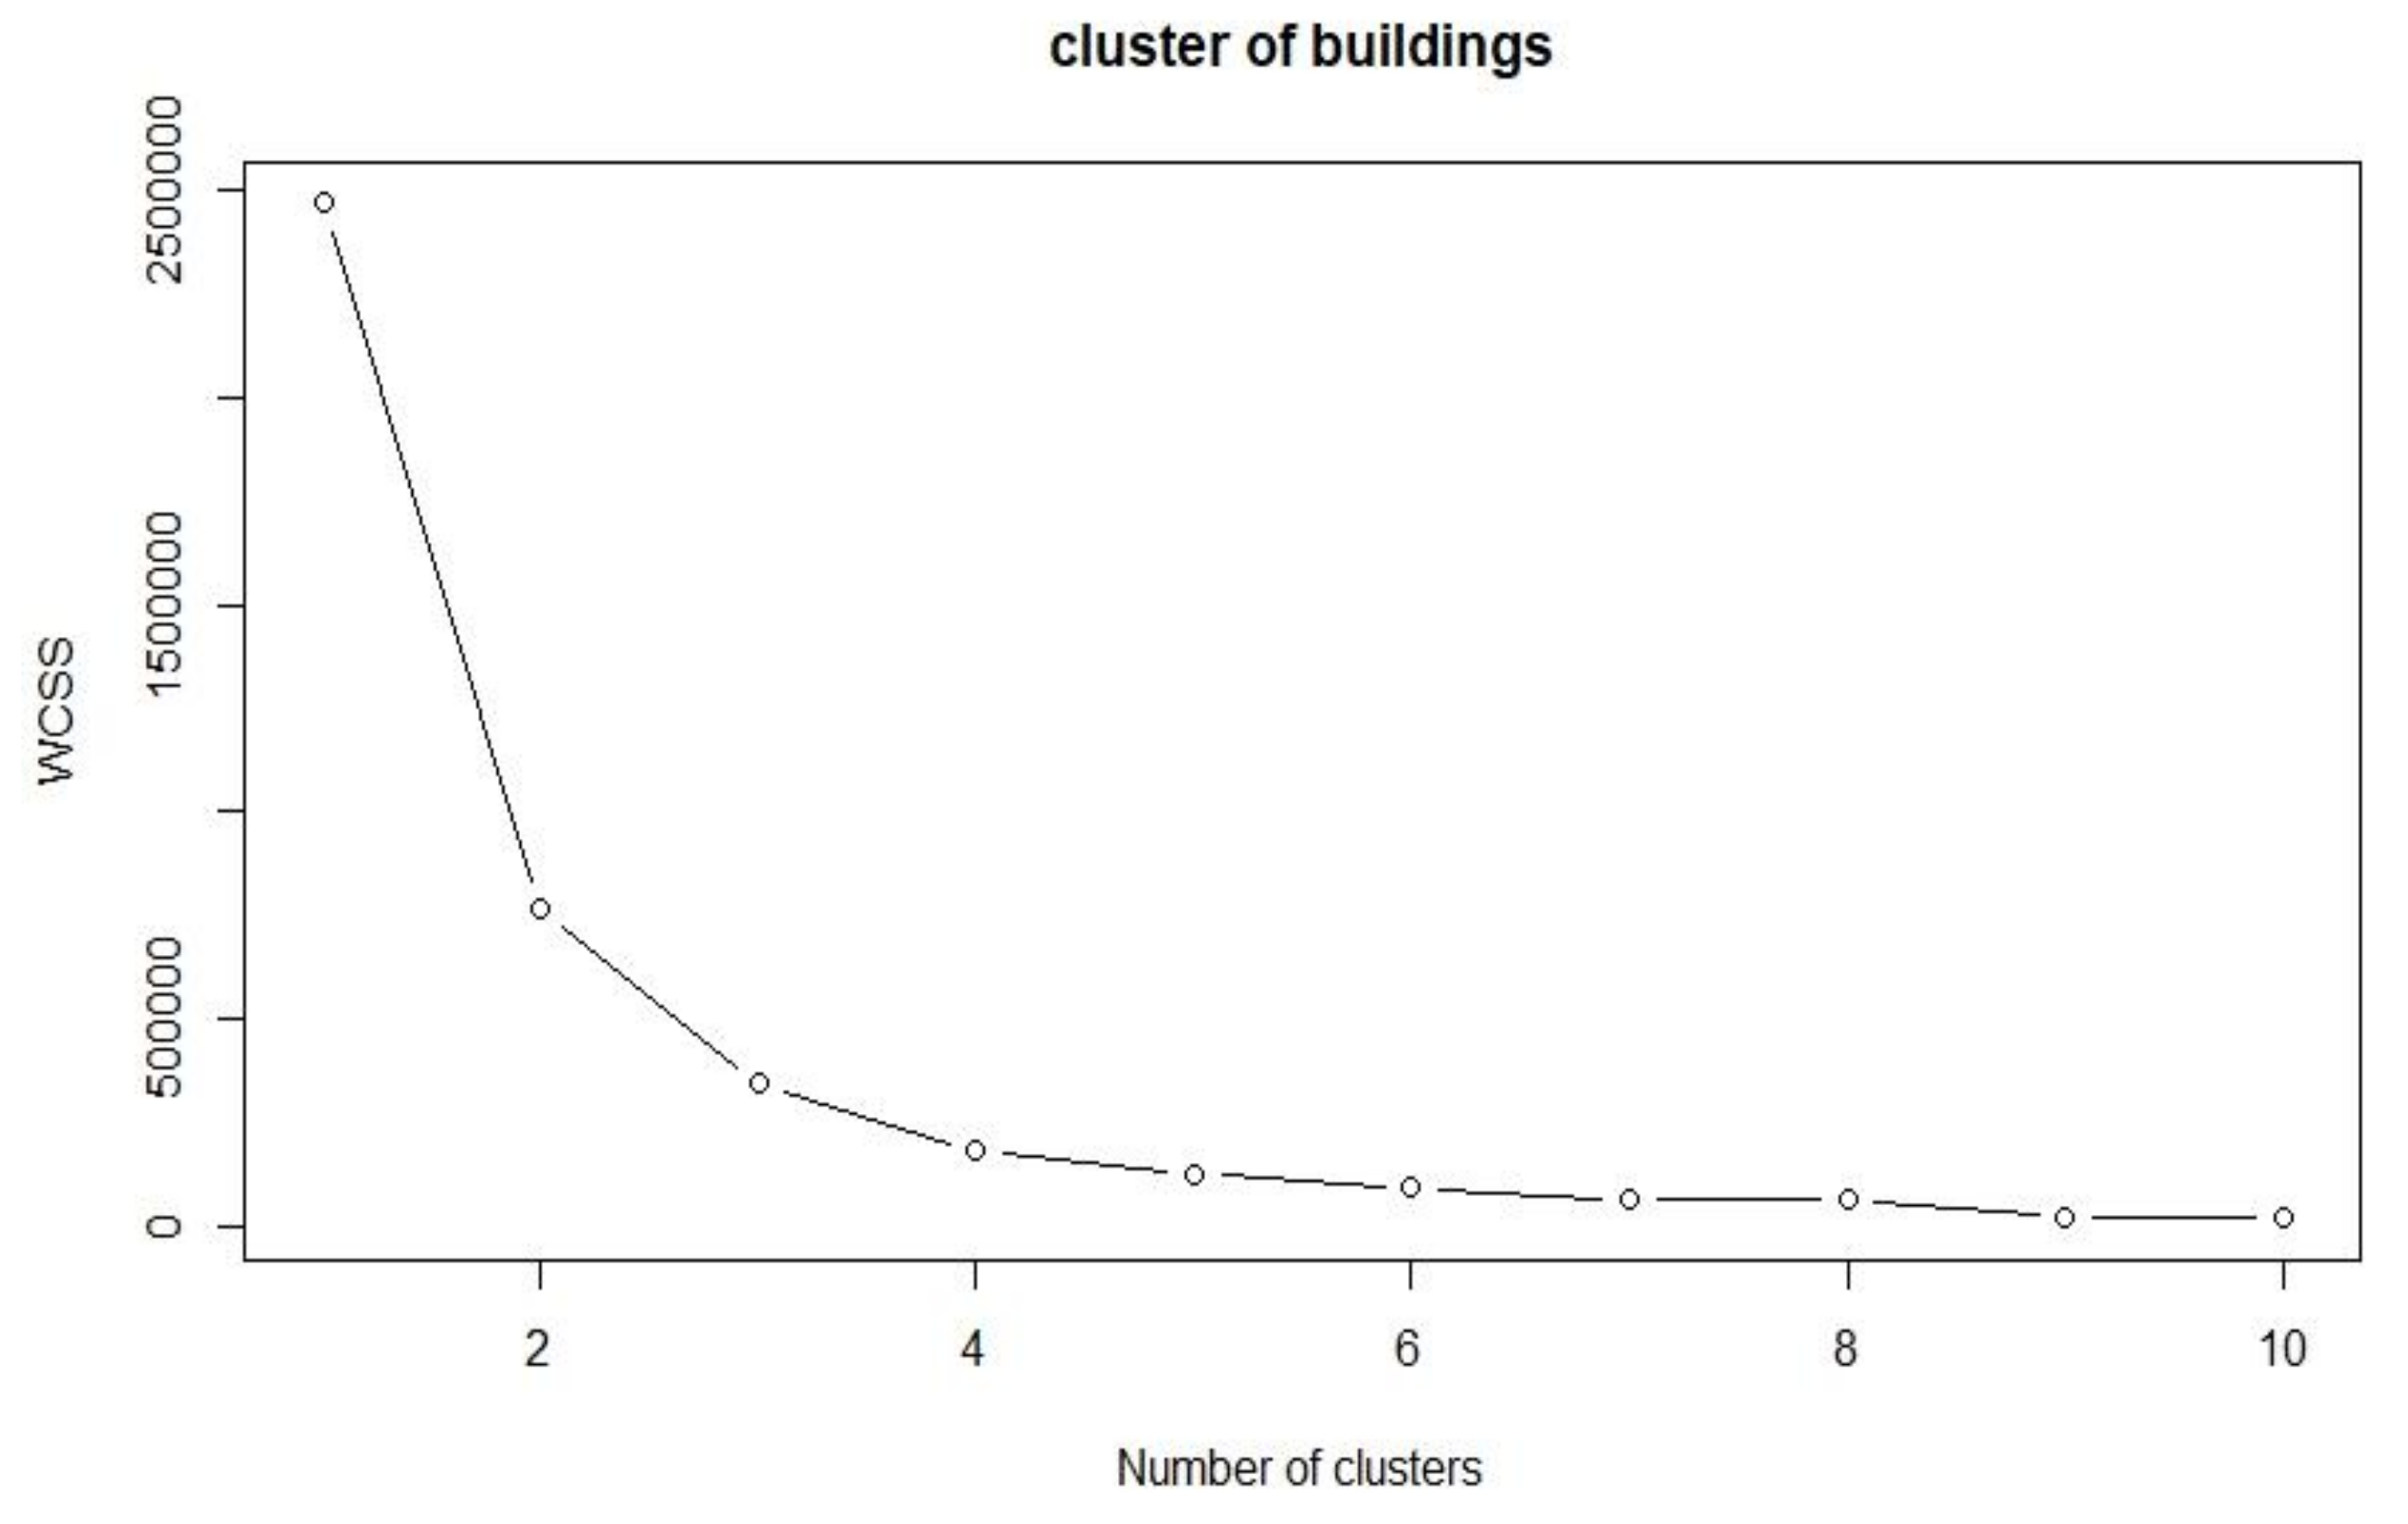
The suitable number of clusters is derived from Equation (7), and the variation of the within cluster sum of squares (WCSS) as a function of the number of clusters is shown in Figure 6. The sum of squares is the sum of the squared distance between each member of the cluster and its centroid. As can be seen in Figure 6, three clusters are selected to optimally represent this case study.
The cluster centers are shown in Table 5. The lower value of the index, the better performance of the cluster. Based on the centroids for the MF, cluster 2 is identified as the group with the highest environmental performance, followed by cluster 1 and cluster 3.
The detailed fuzzy clustering analysis results are shown in Appendix A. As shown in the appendix, the green shaded buildings are the buildings with a high environmental performance (cluster 2), and the red shaded are the buildings with low performance (cluster 3), while the orange being the moderately performed buildings (cluster 1). In addition to the building name, cluster number and the codes (which refers to the location of the building) of buildings are also listed in the appendix. Some buildings have information about the areas for specific functions, namely, classroom, laboratory, library, and office. For example, the given data from the portal shows that the Alumni Building has 18% of the area used as offices, 0% for libraries, 0% for laboratories, and 0% for classrooms. Similar information for the other buildings is also provided in Appendix A.
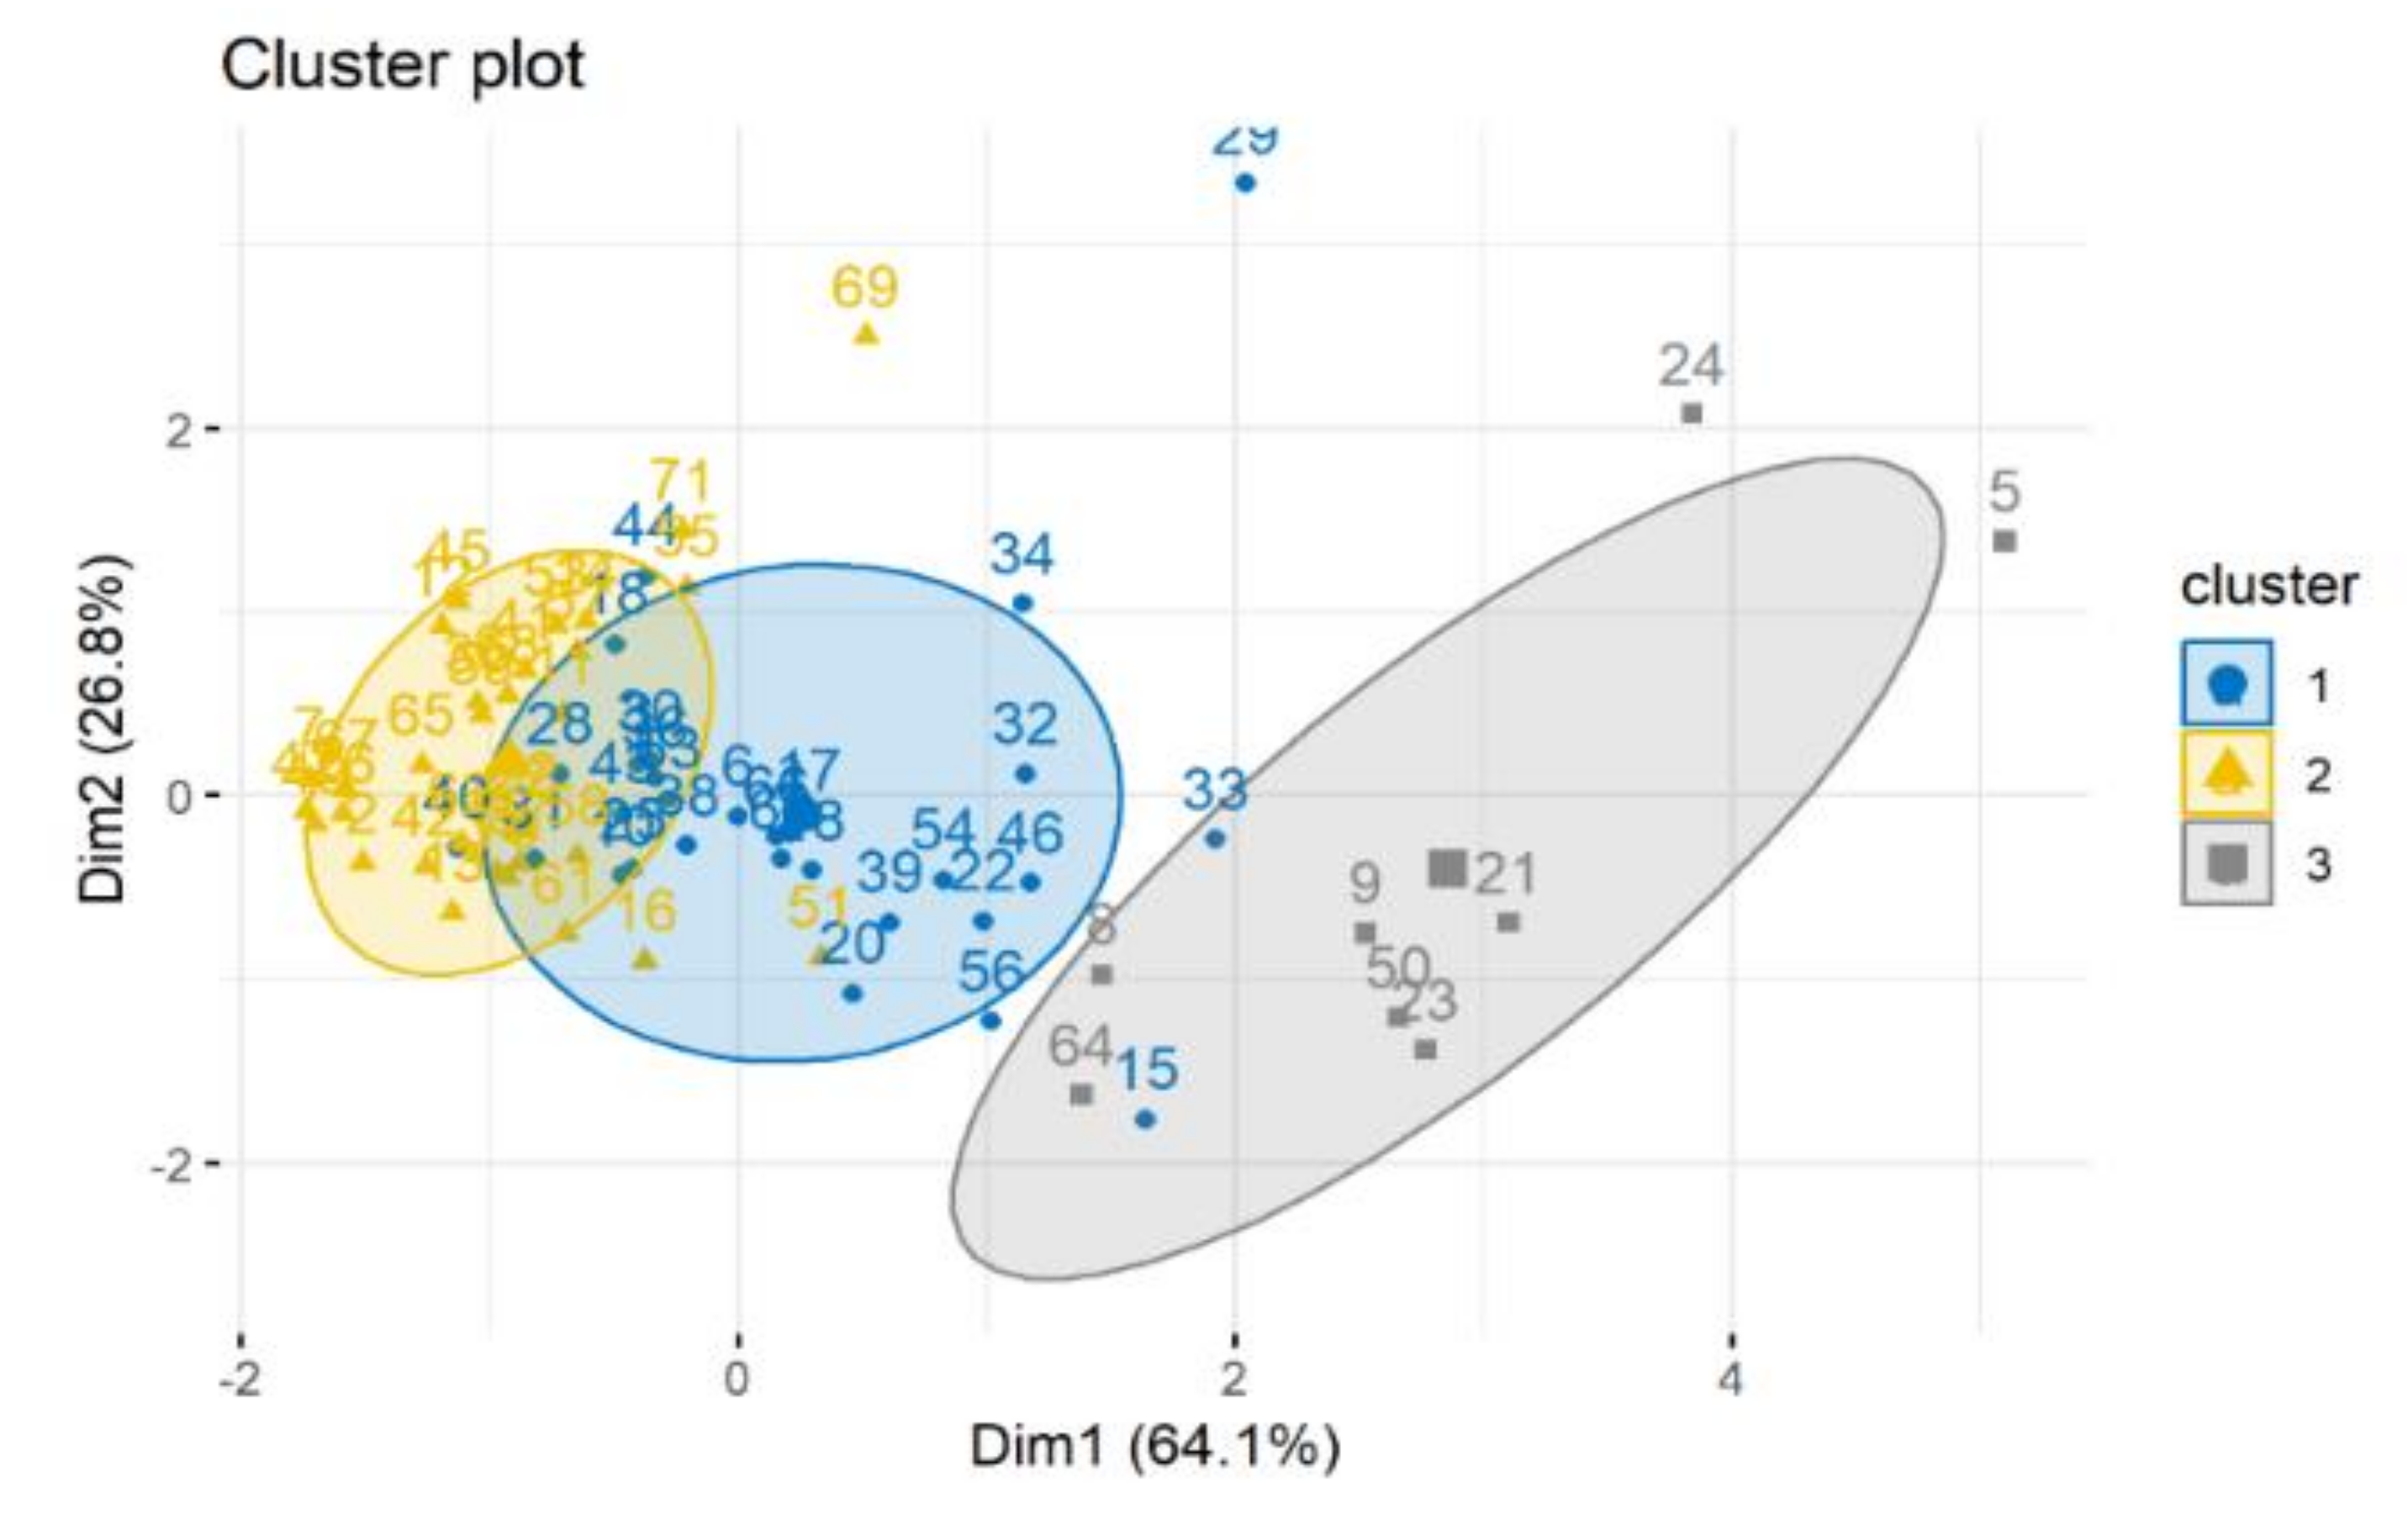
A building may serve multiple functions, e.g., one building may contain a library, classrooms, and administration offices. Therefore, to negate the intertwined effect of multiple areas within a building, a building is assumed to be a specific type of building (i.e., lab building) based on the function that most of the area is used for. For example, the Asian Centre building has 0% of area for classrooms, 3% of area for laboratories, 42% of area for a library and 14% of area for offices. Because most of its area serves as a library, it is considered as a library building. Figure 7 presents a plot of three clusters; each point in the figure represents a building and its proximity to the centroids of each cluster is presented by the distance.
To examine the variability in the data and set the benchmarks for the data in total and each cluster, a statistical summary of the obtained data is presented in Table 6. Cluster 1 has 30 buildings, cluster 2 has 33 buildings, and cluster 3 has eight buildings. The variability (IQR: Inter Quartile Range) in each cluster is a more accurate presentation than the overall buildings in combination. For example, The WUI values for cluster 1, 2, and 3 are 0.384, 0.970, and 2.620, respectively, and the value for all of the buildings is 0.917. This shows that the cluster analysis generates different water usage assessment results for different clusters, and the different results cannot be revealed by the average water use value generated by assessing all buildings together. Cluster 3 has a larger data variance in terms of the three indices, due to the larger number of outliers.
4. Discussion
The fuzzy clustering approach classifies buildings with similar WEC performances into the same group. It is found that buildings with a large portion of their areas allocated for laboratories are among the worst performing buildings in the university. Table 7 summarizes the area allocation per function and the averages per cluster with respect to the flows studied. The results show that the buildings in cluster 3 are predominantly laboratory-intensive with a higher percentage of the area dedicated to the laboratories than cluster 1. While cluster 2 was found to be the cluster with the highest environmental performance and the lowest area of laboratories per buildings on average.
Laboratory-intensive buildings are reported to be the assets with the highest environmental impact in a university, due to the high energy consumption [20,21]. Some research has attributed the high energy consumption to inefficient HVAC systems which are either outdated or providing flows more than needed as a precautionary measure [53]. The results of the present study also show that laboratory-intensive buildings are also responsible for high water consumption and carbon emissions.
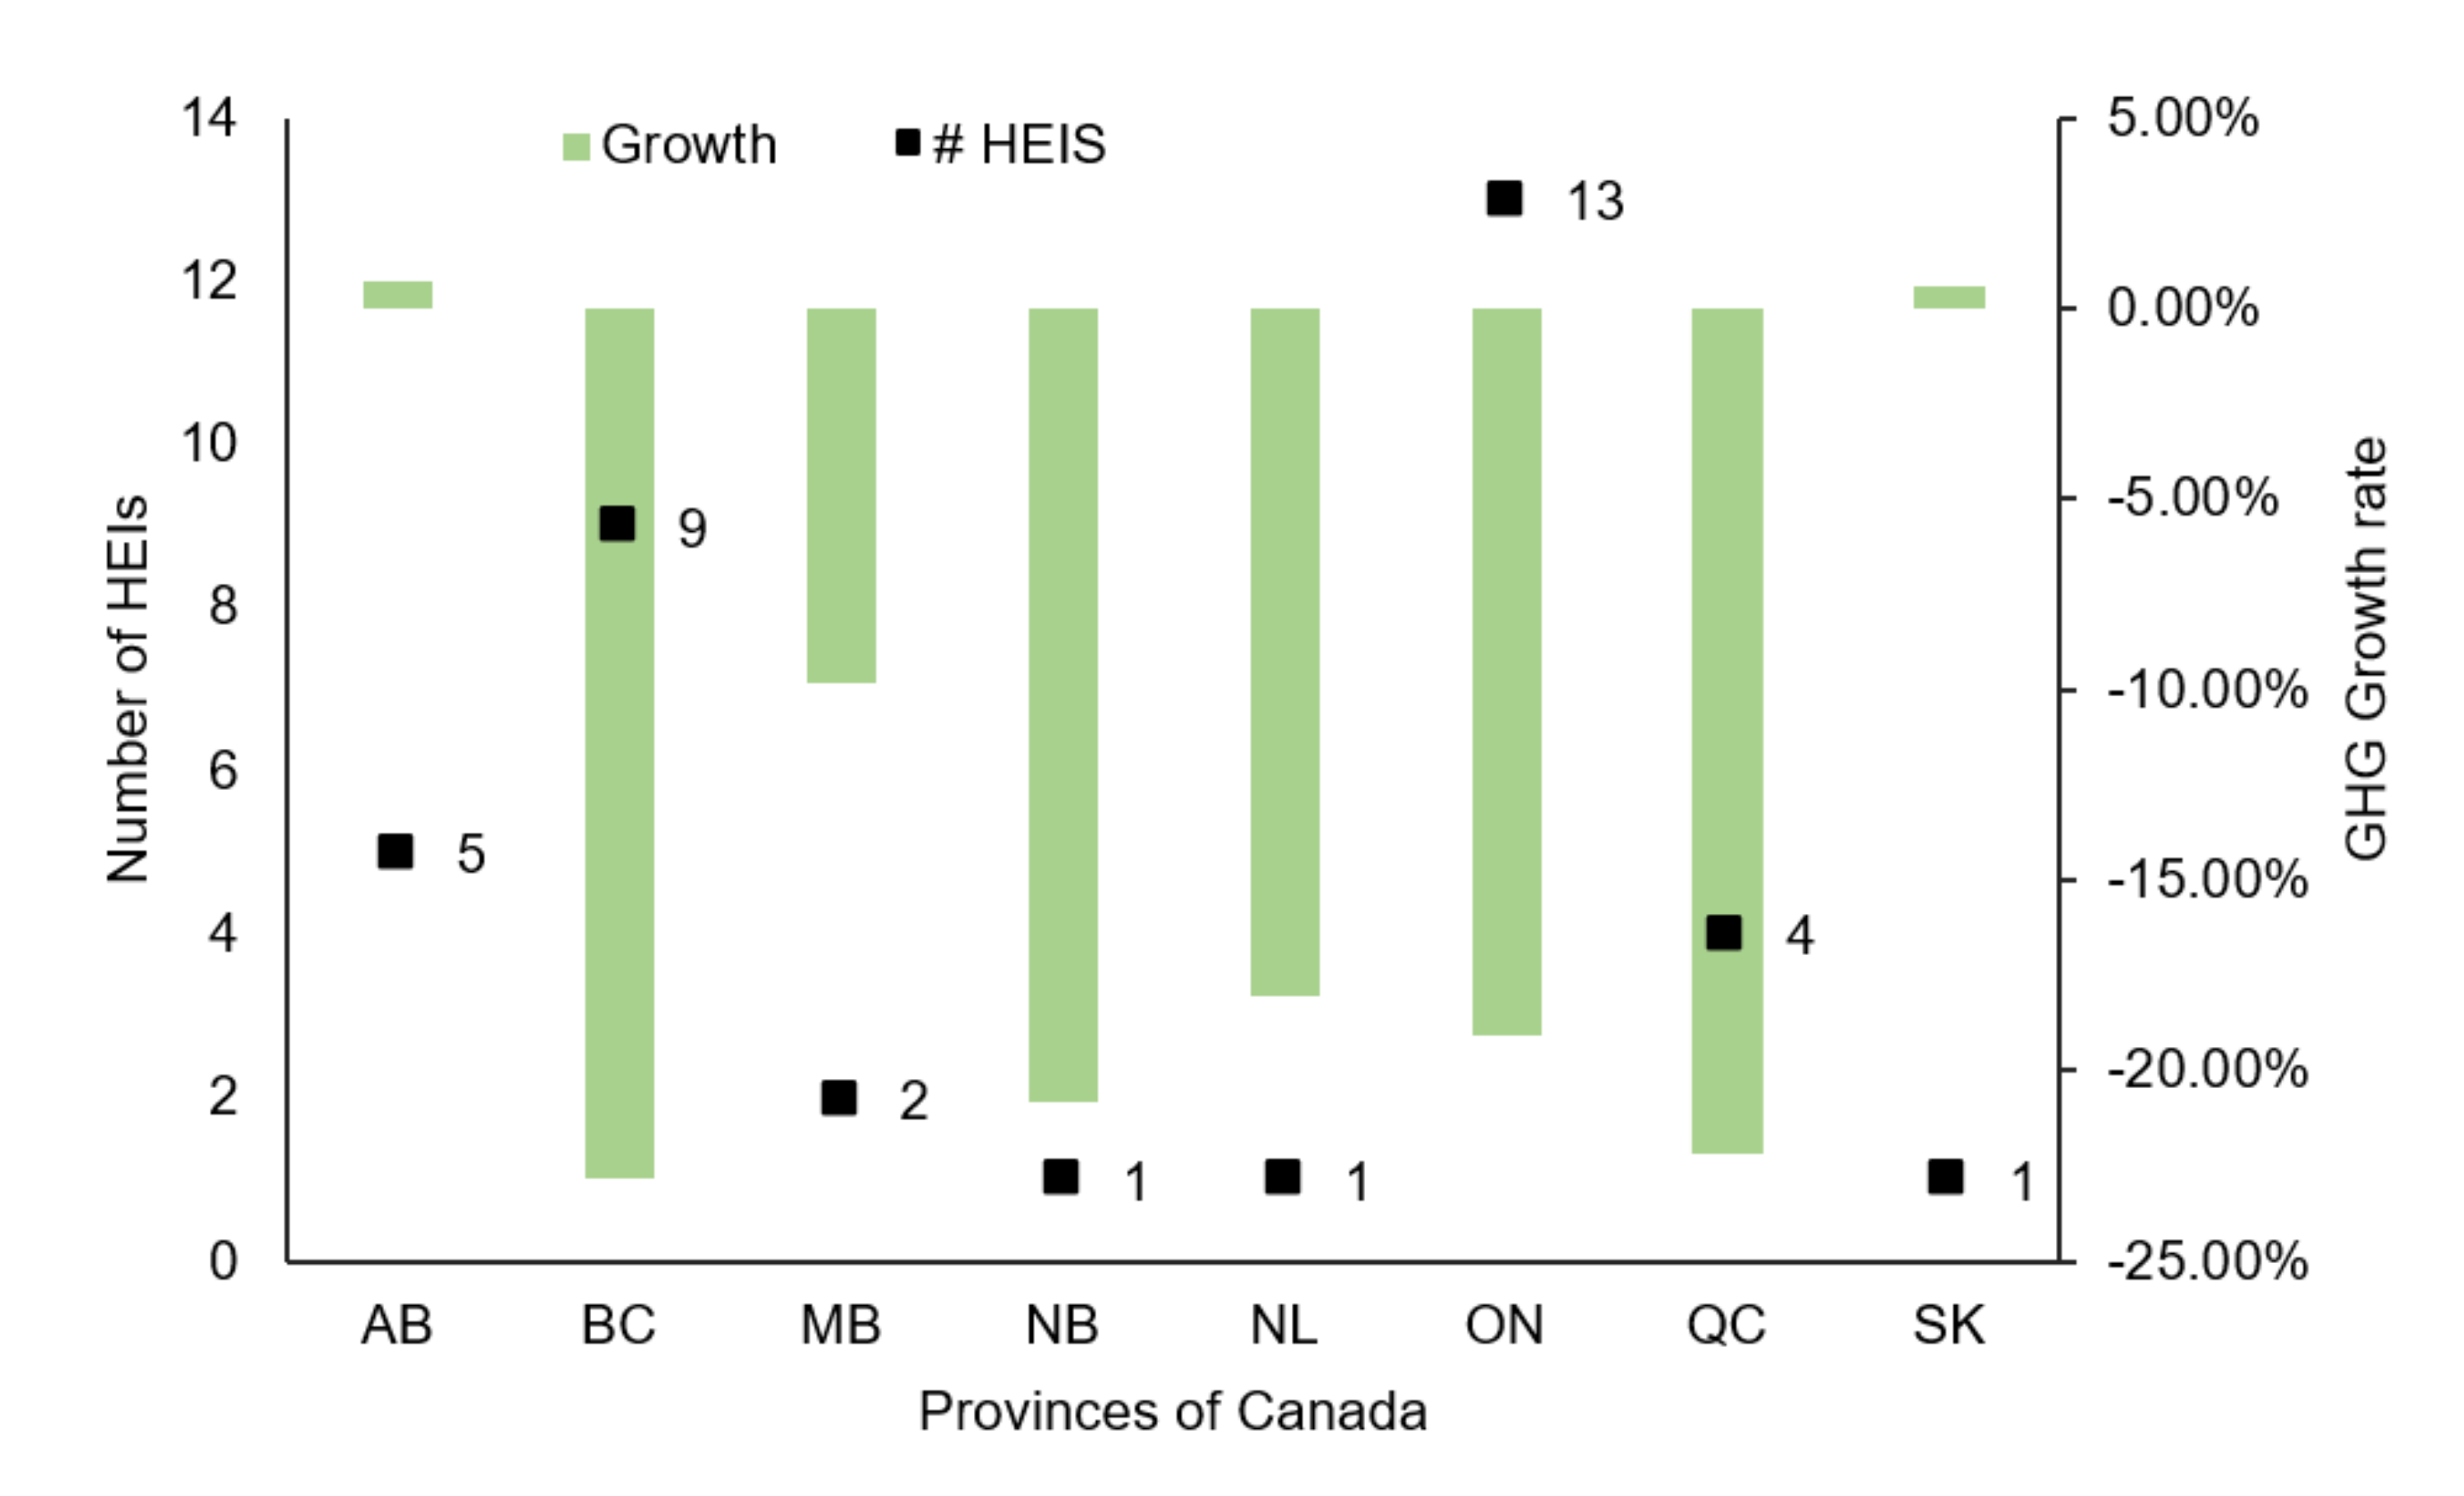
The national grid highly influences universities grid in the jurisdiction. Figure 8 illustrates the GHG growth per province and the number of universities in that province. By collecting the data (provided in Appendix B) for 36 Canadian HEIs in the STARS database, the baseline GHG values set by Canadian HEIs. The growth rate was calculated, aggregated by province, and plotted in the graph with the number of HEIs per province. Only one HEI obtained the platinum ranking (i.e., the most sustainable rank in STARS), while 16 HEIs obtained the gold, 17 HEIs obtained the silver, and two HEIs obtained the bronze rating from the STARS reporting system. Provinces that use renewables as their major source of energy (i.e., BC hydro projects and QB) have shown better performance in terms of GHG reductions, while AB and SK highly depended on fossil fuels as their main source of energy, thus, have shown little improvements from their baseline values. This could be attributed to the offset programs available in provinces like BC as well. For example, the University of Calgary and the University of Alberta is located in the same province (i.e., Alberta), and use similar electric grid systems. The former managed to reduce GHG emissions by 24%, while the latter had a 34% increase in emissions.
Finally, using holistic reporting systems, such as STARS, to communicate the overall sustainability may not yield the desirable momentum needed for universities to reach the desired goal of a sustainable campus. For instance, both universities (the University of Calgary and the University of Alberta) are ranked gold in the STARS reporting system. This is not to neglect the importance of holistic reporting, but to provide a mechanism within the holistic reporting systems for infrastructure management improvements. Furthermore, most reporting systems fail to capture this or reflect this into their weighing structure.
5. Conclusions
Holistic reporting systems, communicating the overall sustainability performance, may result in the same (high) performance for different universities based on meeting their overall socio-economic sustainability goals. While for technical level decision-making to practically optimize the WEC flows in HEIs, the environmental performance of individual academic buildings needs to be benchmarked.
Benchmarking academic buildings in HEIs is facing two main challenges. The first challenge is the lack of available national academic building database that is required to compare and determine a set of best practices in academic buildings; the second challenge is relevant to the conventional benchmarking methods that may yield misleading benchmarking results. By determining the environmental performance of academic buildings, the proposed fuzzy clustering-based framework allows efficient resource allocation for buildings that are identified with low environmental performance.
The proposed framework was applied to benchmark 71 academic buildings in two different campuses of UBC. The academic buildings were grouped into three clusters based on the reported MF in terms of energy and water consumption, as well as carbon emissions. Cluster 2 (33 buildings) is the group of buildings with the best environmental performance, followed by cluster 1 (30 buildings), and eight buildings associated with the lowest environmental performance are grouped into cluster 3. The average area of buildings per cluster is 11,528 m2 for cluster 1, 10,051 m2 for cluster 2, and 5,843 m2 for cluster 3. The average WUI and EUI per cluster are 1.01 m3/m2 and 308.21 kWh/m2 for cluster 1, 0.8 m3/m2 and 127.4 kWh/m2 for cluster 2, and 1.72 m3/m2 and 690.16 kWh/m2 for cluster 3, respectively. By comparing the results, the average EUI of buildings in cluster 3 is roughly four times higher than that of buildings in cluster 2 and nearly 120% more than that of cluster 1.
By grouping academic buildings into three clusters, and identifying a set of best performers and least performers (laboratory buildings), this study also identified the inner characteristics of academic buildings. The clustering analysis results showed that the environmental performances of predominant laboratory buildings are generally low, and this is in line with the results discovered in other studies.
There are several limitations to the proposed benchmarking methodology. The carbon emission factors for converting electricity consumption in two campuses are derived from the BC Best Practices Methodology for Quantifying GHG. The factor for the city of Kelowna, where UBCO is located, is reported as 0.719 kgCO2e/GJ, while the factor for the city of Vancouver is reported to be 2.964 kgCO2e/GJ. However, the values of carbon emission factors vary significantly from year to year. This could result in variations in the benchmarking results for the same buildings in different years. Moreover, the benchmarking results cannot provide detailed solutions to help HEIs improve the aspects that buildings are associated with low performance. Future research can apply a more aggressive data collection program to report detailed energy and water use behavior in the buildings which are identified poorly performed in the benchmarking. Based on the collected big data, system dynamic modeling and optimization can be used to help improve the performance of the buildings.
The developed methodology represents a new approach to track, assess, and aid retrofitting and/or decision making that best allocates the resources available in order to achieve low-impact infrastructure management in HEIs. By identifying a set of building performance, decision-makers can manage their resources more efficiently for further investigations and planning of interventions. Moreover, by identifying critical buildings, further information may be collected per floor or functional systems within a building. The flexible nature of the proposed framework allows the decision-makers to include further information for developing a more detailed decision support tool. The clustering results may also be used to help set attainable goals and plan future environmental commitments accordingly.
Author Contributions
A.A. collected the data, developed the methodology, performed detailed analysis and prepared the initial draft of the paper. G.H. contributed to the development of methodology and paper writing. H.H. contributed to conceptualization of the framework, development of methodology, and writing the final draft of the paper. K.H. contributed to the literature review and definition of the scope of the work. R.S. contributed to the conceptualization of the paper, methodology refinement, and the statistical analysis. All authors have read and agreed to the published version of the manuscript.
Funding
This research received no external funding.
Acknowledgments
The author gratefully acknowledges the supports of the STARS database and the sustainability office at the campus of University of British Columbia are highly appreciated.
Conflicts of Interest
The authors declare no conflict of interest.
Appendix A

Table A1.
A detailed fuzzy clustering analysis results.
| S/N | Name | Code | Cluster | WUI | EUI | CUI | DOM1 | DOM2 | DOM3 | Area m2 | Class | Lab | Library | Office | Office | Library | Lab | Class |
|---|---|---|---|---|---|---|---|---|---|---|---|---|---|---|---|---|---|---|
| 1 | Alumni Centre | V6 | 1 | 0.97 | 235.05 | 0.01 | 0.66 | 0.33 | 0.02 | 4106 | 0 | 0 | 0 | 0.18 | Office | |||
| 2 | AMS Nest | V2 | 1 | 0.93 | 259.53 | 0.02 | 0.86 | 0.13 | 0.01 | 22,933 | 0 | 0 | 0 | 0.07 | Office | |||
| 3 | ASC | O3 | 1 | 0.88 | 316.82 | 0.01 | 1.00 | 0.00 | 0.00 | 7801 | 0.11 | 0.38 | 0 | 0.12 | Lab | |||
| 4 | Brimacombe-QMI | V19 | 1 | 0.40 | 375.39 | 0.00 | 0.89 | 0.07 | 0.04 | 13,781 | 0 | 0.28 | 0 | 0.05 | Lab | |||
| 5 | CCM | V25 | 1 | 0.24 | 427.85 | 0.04 | 0.75 | 0.12 | 0.13 | 10,367 | 0 | 0.52 | 0 | 0.06 | Lab | |||
| 6 | CEME | V26 | 1 | 1.00 | 270.76 | 0.02 | 0.92 | 0.07 | 0.01 | 9361 | 0.06 | 0.29 | 0 | 0.32 | ||||
| 7 | Centre for Brain Health | V31 | 1 | 1.43 | 245.79 | 0.00 | 0.76 | 0.23 | 0.01 | 15,441 | 0 | 0.14 | 0 | 0.2 | Office | |||
| 8 | Chem Bio | V34 | 1 | 0.30 | 379.72 | 0.02 | 0.89 | 0.07 | 0.04 | 14,030 | 0.06 | 0.33 | 0 | 0.15 | Lab | |||
| 9 | Chem East | V36 | 1 | 0.85 | 348.95 | 0.03 | 0.96 | 0.03 | 0.01 | 3573 | 0.07 | 0.49 | 0 | 0.03 | Lab | |||
| 10 | CICSR | V27 | 1 | 0.49 | 262.79 | 0.01 | 0.88 | 0.11 | 0.01 | 10,097 | 0 | 0.47 | 0 | 0.16 | Lab | |||
| 11 | EME | O6 | 1 | 0.76 | 288.11 | 0.00 | 0.98 | 0.02 | 0.00 | 16,520 | 0.11 | 0.28 | 0 | 0.22 | ||||
| 12 | EOS | V45 | 1 | 4.44 | 374.11 | 0.02 | 0.90 | 0.06 | 0.03 | 10,799 | 0.01 | 0.55 | 0 | 0.15 | Lab | |||
| 13 | ESB | V46 | 1 | 0.98 | 272.83 | 0.01 | 0.93 | 0.06 | 0.01 | 17,755 | 0.06 | 0.22 | 0 | 0.25 | ||||
| 14 | Fipke | O7 | 1 | 0.35 | 308.63 | 0.00 | 1.00 | 0.00 | 0.00 | 6725 | 0.17 | 0.34 | 0 | 0.12 | Lab | |||
| 15 | FNH | V48 | 1 | 1.53 | 397.79 | 0.02 | 0.84 | 0.09 | 0.07 | 5962 | 0.08 | 0.26 | 0 | 0.17 | Lab | |||
| 16 | Forest Sci | V50 | 1 | 1.54 | 476.18 | 0.03 | 0.58 | 0.14 | 0.28 | 22,459 | 0.07 | 0.31 | 0 | 0.17 | Lab | |||
| 17 | Frank Forward | V51 | 1 | 2.30 | 287.50 | 0.02 | 0.98 | 0.02 | 0.00 | 7880 | 0.06 | 0.29 | 0 | 0.22 | Lab | |||
| 18 | Henry Angus | V62 | 1 | 0.93 | 262.63 | 0.01 | 0.88 | 0.11 | 0.01 | 16,922 | 0.11 | 0.01 | 0 | 0.42 | Office | |||
| 19 | ICICS | V65 | 1 | 0.68 | 294.79 | 0.01 | 0.99 | 0.01 | 0.00 | 10,583 | 0 | 0.28 | 0 | 0.3 | Office | |||
| 20 | J.B. MacDonald | V69 | 1 | 0.69 | 332.43 | 0.03 | 0.98 | 0.01 | 0.00 | 7328 | 0.02 | 0.2 | 0 | 0.28 | Office | |||
| 21 | Jack Bell | V70 | 1 | 0.30 | 221.14 | 0.00 | 0.51 | 0.48 | 0.02 | 2712 | 0.14 | 0.05 | 0.38 | 0 | Lib | |||
| 22 | Klinck | V72 | 1 | 0.73 | 236.09 | 0.01 | 0.67 | 0.32 | 0.02 | 10,720 | 0.11 | 0.02 | 0 | 0.33 | Office | |||
| 23 | Koerner Library | V73 | 1 | 1.79 | 235.58 | 0.00 | 0.66 | 0.32 | 0.02 | 7303 | 0 | 0 | 0.29 | 0.12 | Lib | |||
| 24 | Life Sci | V76 | 1 | 1.02 | 493.52 | 0.02 | 0.51 | 0.13 | 0.36 | 52,177 | 0.04 | 0.39 | 0 | 0.13 | Lab | |||
| 25 | Longhouse | V78 | 1 | 0.79 | 278.62 | 0.02 | 0.96 | 0.04 | 0.00 | 2352 | 0 | 0 | 0.09 | 0.34 | Office | |||
| 26 | NSDC-UBC | V86 | 1 | 1.01 | 224.54 | 0.03 | 0.55 | 0.44 | 0.02 | 3714 | 0 | 0 | 0 | 0 | ||||
| 27 | Pond East | V94 | 1 | 0.45 | 313.90 | 0.04 | 1.00 | 0.00 | 0.00 | 11,080 | 0 | 0.18 | 0 | 0.05 | Lab | |||
| 28 | RHS | O11 | 1 | 0.79 | 278.58 | 0.02 | 0.96 | 0.04 | 0.00 | 5021 | 0.17 | 0.19 | 0 | 0.23 | ||||
| 29 | Strangway | V105 | 1 | 0.86 | 267.52 | 0.01 | 0.91 | 0.08 | 0.01 | 12,403 | 0 | 0 | 0 | 0.25 | Office | |||
| 30 | University Centre | V117 | 1 | 0.88 | 279.16 | 0.02 | 0.96 | 0.04 | 0.00 | 3944 | 0.11 | 0 | 0 | 0.19 | Office | |||
| 31 | AERL | V1 | 2 | 0.33 | 142.44 | 0.01 | 0.01 | 0.99 | 0.00 | 5368 | 0.06 | 0.05 | 0 | 0.46 | Office | |||
| 32 | Allard Hall | V5 | 2 | 0.11 | 138.36 | 0.00 | 0.00 | 1.00 | 0.00 | 14,909 | 0.08 | 0 | 0.2 | 0.2 | ||||
| 33 | Asian Centre | V9 | 2 | 0.42 | 59.48 | 0.00 | 0.07 | 0.92 | 0.01 | 4926 | 0 | 0.03 | 0.42 | 0.14 | Lib | |||
| 34 | Buchanan A,B,C | V21 | 2 | 1.09 | 147.11 | 0.01 | 0.01 | 0.99 | 0.00 | 10,936 | 0.31 | 0.04 | 0 | 0.18 | Class | |||
| 35 | Buchanan D,E | V22 | 2 | 1.28 | 89.76 | 0.00 | 0.03 | 0.96 | 0.00 | 7134 | 0.28 | 0.01 | 0 | 0.25 | Class | |||
| 36 | C.K. Choi | V24 | 2 | 0.06 | 124.68 | 0.01 | 0.00 | 1.00 | 0.00 | 2912 | 0.01 | 0.03 | 0 | 0.42 | Office | |||
| 37 | Cassiar | O18 | 2 | 1.56 | 80.19 | 0.01 | 0.05 | 0.95 | 0.01 | 3951 | 0 | 0 | 0 | 0 | ||||
| 38 | CCS | O5 | 2 | 0.20 | 111.31 | 0.03 | 0.01 | 0.99 | 0.00 | 4797 | 0 | 0.44 | 0 | 0.23 | Lab | |||
| 39 | Chan Centre | V32 | 2 | 0.30 | 162.56 | 0.01 | 0.05 | 0.95 | 0.00 | 11,440 | 0 | 0 | 0 | 0.02 | Office | |||
| 40 | CIRS | V28 | 2 | 0.30 | 104.95 | 0.00 | 0.02 | 0.98 | 0.00 | 5454 | 0.08 | 0.04 | 0 | 0.27 | Office | |||
| 41 | Cunningham | V42 | 2 | 0.51 | 153.17 | 0.01 | 0.02 | 0.98 | 0.00 | 4901 | 0 | 0 | 0 | 0.07 | Office | |||
| 42 | Geography | V57 | 2 | 0.98 | 160.57 | 0.00 | 0.04 | 0.96 | 0.00 | 5525 | 0.17 | 0.22 | 0 | 0.35 | ||||
| 43 | I.K. Barber | V64 | 2 | 0.36 | 177.77 | 0.01 | 0.11 | 0.88 | 0.01 | 27,316 | 0.05 | 0.01 | 0.43 | 0.12 | Lib | |||
| 44 | Kalamalka | O19 | 2 | 1.24 | 79.77 | 0.01 | 0.05 | 0.95 | 0.01 | 4835 | 0 | 0 | 0 | 0 | ||||
| 45 | Kenny | V71 | 2 | 0.21 | 131.32 | 0.01 | 0.00 | 1.00 | 0.00 | 9613 | 0.02 | 0.31 | 0 | 0.16 | Lab | |||
| 46 | Lasserre | V75 | 2 | 1.42 | 88.64 | 0.00 | 0.03 | 0.96 | 0.00 | 4710 | 0.16 | 0.23 | 0 | 0.25 | ||||
| 47 | Liu | V77 | 2 | 0.26 | 73.22 | 0.00 | 0.05 | 0.94 | 0.01 | 1729 | 0 | 0 | 0.53 | 0 | Lib | |||
| 48 | Mathematics | V83 | 2 | 0.22 | 87.09 | 0.00 | 0.04 | 0.96 | 0.00 | 6140 | 0.15 | 0 | 0 | 0.28 | Office | |||
| 49 | MWO | O10 | 2 | 0.52 | 123.90 | 0.04 | 0.00 | 1.00 | 0.00 | 1681 | 0 | 0 | 0 | 0 | ||||
| 50 | Neville Scarfe | V88 | 2 | 0.56 | 146.85 | 0.01 | 0.01 | 0.99 | 0.00 | 19,382 | 0.12 | 0.02 | 0.15 | 0.19 | ||||
| 51 | Nicola | O21 | 2 | 1.48 | 91.53 | 0.01 | 0.03 | 0.97 | 0.00 | 5667 | 0 | 0 | 0 | 0 | ||||
| 52 | Orchard Commons | V90 | 2 | 1.83 | 179.87 | 0.01 | 0.13 | 0.86 | 0.01 | 43,194 | 0.04 | 0 | 0 | 0.03 | Class | |||
| 53 | Pond North | V95 | 2 | 1.38 | 153.86 | 0.01 | 0.02 | 0.98 | 0.00 | 27,922 | 0.02 | 0.01 | 0 | 0.05 | Office | |||
| 54 | Pond West | V96 | 2 | 0.50 | 177.47 | 0.01 | 0.11 | 0.88 | 0.01 | 18,779 | 0 | 0.03 | 0 | 0 | Lab | |||
| 55 | Purcell | O22 | 2 | 0.98 | 81.13 | 0.01 | 0.04 | 0.95 | 0.01 | 6208 | 0 | 0 | 0 | 0 | ||||
| 56 | Sing Tao | V103 | 2 | 0.14 | 189.10 | 0.01 | 0.19 | 0.80 | 0.01 | 1571 | 0.09 | 0.15 | 0 | 0.24 | ||||
| 57 | SPPH | V100 | 2 | 0.35 | 173.27 | 0.01 | 0.09 | 0.90 | 0.01 | 8442 | 0.05 | 0.06 | 0 | 0.48 | Office | |||
| 58 | Totem Infill | V113 | 2 | 0.64 | 130.24 | 0.00 | 0.00 | 1.00 | 0.00 | 15,756 | 0 | 0 | 0 | 0 | ||||
| 59 | USB | V116 | 2 | 0.41 | 96.07 | 0.00 | 0.03 | 0.97 | 0.00 | 11,598 | 0 | 0 | 0 | 0.2 | Office | |||
| 60 | Valhalla | O26 | 2 | 1.11 | 78.84 | 0.01 | 0.05 | 0.95 | 0.01 | 4797 | 0 | 0 | 0 | 0 | ||||
| 61 | Wesbrook Building | V130 | 2 | 3.22 | 170.72 | 0.01 | 0.08 | 0.92 | 0.01 | 10,272 | 0.06 | 0.29 | 0 | 0.08 | Lab | |||
| 62 | Woodward IRC | V133 | 2 | 0.29 | 159.68 | 0.01 | 0.04 | 0.96 | 0.00 | 12,049 | 0.08 | 0.01 | 0 | 0.15 | Office | |||
| 63 | Woodward Library | V134 | 2 | 2.09 | 139.34 | 0.01 | 0.00 | 1.00 | 0.00 | 7777 | 0 | 0 | 0.43 | 0 | Lib | |||
| 64 | Aquatic Centre | V8 | 3 | 3.99 | 889.49 | 0.04 | 0.08 | 0.05 | 0.87 | 8041 | 0 | 0 | 0 | 0 | ||||
| 65 | Bio Sci West | V16 | 3 | 0.70 | 609.39 | 0.02 | 0.11 | 0.04 | 0.85 | 8021 | 0.04 | 0.36 | 0 | 0.1 | Lab | |||
| 66 | Biomed | V17 | 3 | 1.33 | 624.05 | 0.04 | 0.07 | 0.03 | 0.90 | 4407 | 0 | 0.47 | 0 | 0.1 | Lab | |||
| 67 | Chem Centre | V35 | 3 | 1.52 | 847.20 | 0.03 | 0.06 | 0.03 | 0.91 | 7274 | 0.06 | 0.37 | 0 | 0.16 | Lab | |||
| 68 | Chem North | V37 | 3 | 0.91 | 680.79 | 0.04 | 0.01 | 0.00 | 0.99 | 2739 | 0 | 0.53 | 0 | 0.09 | Lab | |||
| 69 | Chem South | V39 | 3 | 4.16 | 536.41 | 0.04 | 0.34 | 0.11 | 0.55 | 5373 | 0.1 | 0.42 | 0 | 0.09 | Lab | |||
| 70 | Michael Smith | V84 | 3 | 0.94 | 818.22 | 0.03 | 0.04 | 0.02 | 0.94 | 8477 | 0.03 | 0.41 | 0 | 0.15 | Lab | |||
| 71 | Tennis Centre—Old | V109 | 3 | 0.20 | 515.76 | 0.03 | 0.42 | 0.12 | 0.46 | 2409 | 0 | 0 | 0 | 0.01 | Office |
Appendix B
Table A2.
Data collected for Canadian HEIs in the STARS database.
| HEI | Code | Province | Rank | Baseline YR | Baseline Value | Performance Year | Performance Value | Growth |
|---|---|---|---|---|---|---|---|---|
| MacEwan College | AB1 | Alberta | Silver | 13/14 | 30,754.00 | 16/17 | 28,068.00 | –8.7% |
| MRU | AB2 | Alberta | Silver | 14/15 | 29,294.60 | 16/17 | 34,393.31 | 17.4% |
| NAIT | AB3 | Alberta | Silver | 2007/2008 | 68,190.37 | 2013/2014 | 54,128.58 | –20.6% |
| University of Alberta | AB4 | Alberta | Gold | 2005/2006 | 212,190.20 | 2015/2016 | 285,815.00 | 34.7% |
| University of Calgary | AB5 | Alberta | Gold | 2008/2009 | 239,954.60 | 2017/2018 | 182,112.28 | –24.1% |
| Camosun College | BC1 | BC | Silver | 2010 | 1,826.26 | 2014 | 1371.32 | –24.9% |
| Okanagan College | BC2 | BC | Silver | 2015 | 1686.00 | 2018 | 1236.00 | –26.7% |
| Royal Roads University | BC3 | BC | Gold | 2010 | 1460.00 | 2017 | 1016.00 | –30.4% |
| Selkirk College | BC4 | BC | Silver | 2008 | 1698.80 | 2018 | 949.12 | –44.1% |
| Simon Fraser University | BC5 | BC | Gold | 2007 | 18,934.00 | 2017 | 15,235.43 | –19.5% |
| TRU | BC6 | BC | Platinum | 2016 | 3359.00 | 2018 | 3715.00 | 10.6% |
| UBC | BC7 | BC | Gold | 2007 | 60,100.00 | 2017 | 42,786.00 | –28.8% |
| UNBC | BC8 | BC | Silver | 2010 | 5688.73 | 2018 | 7199.00 | 26.5% |
| University of Victoria | BC9 | BC | Gold | 2010 | 15,545.90 | 2018 | 11,603.00 | –25.4% |
| University of Manitoba | MB1 | MB | Gold | 1990/1991 | 38,442.00 | 2016/2017 | 35,304.00 | –8.2% |
| University of Winnipeg | MB2 | MB | Silver | 2009/2010 | 3883.00 | 2017/2018 | 2860.40 | –26.3% |
| UNBF | NB1 | NB | Silver | 2007/2008 | 39,070.00 | 2015/2016 | 30,947.00 | –20.8% |
| Dalhousie University | NS1 | NS | Gold | 2009/2010 | 106,178.00 | 2016/2017 | 87,056.00 | –18.0% |
| Carleton University | ON1 | ON | Silver | 2012 | 26,729.00 | 2015 | 26,203.00 | –2.0% |
| Durham College | ON2 | ON | Silver | 2012 | 5600.00 | 2013 | 5369.00 | –4.1% |
| Fanshawe College | ON3 | ON | Gold | 2005 | 5366.76 | 2017 | 5200.04 | –3.1% |
| Fleming College | ON4 | ON | Gold | 2012/2013 | 4614.00 | 2017/2018 | 4506.00 | –2.3% |
| George Brown College | ON5 | ON | Silver | 2006/2007 | 3703.00 | 2012/2013 | 4192.00 | 13.2% |
| Loyalist College | ON6 | ON | Bronze | 2013 | 2488.10 | 2014 | 2484.60 | –0.1% |
| Mohawk College | ON7 | ON | Gold | 2007 | 8521.00 | 2017 | 3235.00 | –62.0% |
| Sheridan College | ON8 | ON | Silver | 2010/2011 | 8136.00 | 2016/2017 | 7306.90 | –10.2% |
| St Lawrence College | ON9 | ON | Bronze | 2010 | 4078.50 | 2017 | 3373.30 | –17.3% |
| University of Ottawa | ON10 | ON | Silver | 2005/2006 | 37,317.00 | 2016 | 27,918.94 | –25.2% |
| University of waterloo | ON11 | ON | Silver | 2010 | 38,710.92 | 2017 | 39,495.34 | 2.0% |
| Western University | ON12 | ON | Gold | 2009 | 84,417.50 | 2016 | 55,524.00 | –34.2% |
| Wilfrid Laurier University | ON13 | ON | Gold | 2009 | 10,875.61 | 2018 | 9901.96 | –9.0% |
| Concordia University | QC1 | QC | Gold | 2010/2011 | 10,362.09 | 2014/2015 | 9665.33 | –6.7% |
| HEC Montreal | QC2 | QC | Silver | 2005/2007 | 1909.66 | 2016 | 1105.57 | –42.1% |
| McGill University | QC3 | QC | Gold | 2002/2003 | 57,590.00 | 2014 | 43,249.00 | –24.9% |
| Polytechnique Montreal | QC4 | QC | Gold | 2004/2005 | 3596.90 | 2016/2017 | 3152.60 | –12.4% |
| University of Saskatchewan | SK1 | SK | Silver | 2005/2006 | 151,541.50 | 2015/2016 | 152,453.80 | 0.6% |
References
- IPCC. Climate Change 2014: Mitigation of Climate Change; Cambridge University Press: Cambridge, UK, 2014. [Google Scholar]
- Canada, E. Pan-Canadian Framework on Clean Growth and Climate Change: Canada’s Plan to Address Climate Change and Grow the Economy. Environment and Climate Change Canada 2016: Gatineau, Quebec. 2016. Available online: http://publications.gc.ca/site/eng/9.828774/publication.html (accessed on 15 January 2020).
- Pérez-Lombard, L.; Ortiz, J.; Pout, C. A review on buildings energy consumption information. Energy Build. 2008, 40, 394–398. [Google Scholar] [CrossRef]
- Papadopoulos, S.; Kontokosta, C.E. Grading buildings on energy performance using city benchmarking data. Appl. Energy 2019, 233–234, 244–253. [Google Scholar] [CrossRef]
- Collinge, W.; Landis, A.; Jones, A.; Schaefer, L.; Bilec, M. Dynamic life cycle assessment: Framework and application to an institutional building. Int. J. Life Cycle Assess. 2013, 18, 538–552. [Google Scholar] [CrossRef]
- Junnila, S.; Horvath, A.; Guggemos, A. Life-Cycle Assessment of Office Buildings in Europe and the United States. Journal of Infrastructure Systems 2006, 12, 10–17. [Google Scholar] [CrossRef]
- Scheuer, C.; Keoleian, G.A.; Reppe, P. Life cycle energy and environmental performance of a new university building: modeling challenges and design implications. Energy and Buildings 2003, 35, 1049–1064. [Google Scholar] [CrossRef]
- Li, X.; Tan, H.; Rackes, A. Carbon footprint analysis of student behavior for a sustainable university campus in China. J. Cleaner Prod. 2015, 106, 97–108. [Google Scholar] [CrossRef]
- Robinson, J.; Berkhout, T. The University as an Agent of Change for Sustainability; Policy Horizons Canada: Ottawa, ON, Canada, 2011.
- Verhoef, L.; Graamans, L.; Gioutsos, D.; van Wijk, A.; Geraedts, J.; Hellinga, C. ShowHow: A flexible, structured approach to commit university stakeholders to sustainable development. In Handbook of Theory and Practice of Sustainable Development in Higher Education; Springer: Berlin/Heidelberg, Germany, 2017; pp. 491–508. [Google Scholar]
- Lo-Iacono-Ferreira, V.G.; Torregrosa-López, J.I.; Capuz-Rizo, S.F. Use of Life Cycle Assessment methodology in the analysis of Ecological Footprint Assessment results to evaluate the environmental performance of universities. J. Clean. Prod. 2016, 133, 43–53. [Google Scholar] [CrossRef] [Green Version]
- Abidin, N.I.; Zakaria, R.; Aminuddin, E.; Abdul Hamid, A.R.; Munikanan, V.; Sahamir, S.R.; Shamsuddin, S.M. Factor Analysis on Criteria Affecting Lean Retrofit for Energy Efficient Initiatives in Higher Learning Institution Buildings. MATEC Web Conf. 2017, 138, 02025. [Google Scholar] [CrossRef] [Green Version]
- Bouscayrol, A.; Castex, E.; Delarue, P.; Desreveaux, A.; Ferla, O.; Frotey, J.; German, R.; Klein, J.; Lhomme, W.; Sergent, J.F. Campus of University with Mobility Based on Innovation and Carbon Neutral. In Proceedings of the 2017 IEEE Vehicle Power and Propulsion Conference (VPPC), Belfort, France, 11–14 December 2017; pp. 1–5. [Google Scholar]
- NRC. Consumption of Energy Survey for Universities, Colleges and Hospitals 2003. 2004. Available online: http://oee.nrcan.gc.ca/corporate/statistics/neud/dpa/data_e/consumption03/universities.cfm?attr=0 (accessed on 17 September 2017).
- BC. 2018 Carbon Neutral Government Year in Review 2018: Summary, Environment, B.M.o., Ed. 2018. Available online: https://www2.gov.bc.ca/assets/gov/environment/climate-change/cnar/2018/347953_attachment_cng_annual_report_summary_2018.pdf (accessed on 12 February 2019).
- EPA. EnviroAtlas. In Educational Facilities; 2012. Available online: https://www.epa.gov/watersense/types-facilities (accessed on 10 January 2020).
- Wang, J.C. A study on the energy performance of school buildings in Taiwan. Energy Build. 2016, 133, 810–822. [Google Scholar] [CrossRef]
- Tan, H.; Chen, S.; Shi, Q.; Wang, L. Development of green campus in China. J. Clean. Prod. 2014, 64, 646–653. [Google Scholar] [CrossRef]
- Larsen, H.N.; Pettersen, J.; Solli, C.; Hertwich, E.G. Investigating the Carbon Footprint of a University—The case of NTNU. J. Clean. Prod. 2013, 48, 39–47. [Google Scholar] [CrossRef]
- Khoshbakht, M.; Goumartinbur, Z.; Dupre, K. Energy use characteristics and benchmarking for higher education buildings. Energy Build. 2018, 164, 61–76. [Google Scholar] [CrossRef] [Green Version]
- Chihib, M.; Salmerón-Manzano, E.; Manzano-Agugliaro, F. Benchmarking Energy Use at University of Almeria (Spain). Sustainability 2020, 12, 1336. [Google Scholar] [CrossRef] [Green Version]
- Tan, H.; Chen, S.; Zhang, N. Annual Report of Green Campus Development in China. 2012. China Green University Network. Available online: http://www.cgun.org/down.aspx?info_lb=120%26flag=120 (accessed on 11 April 2016).
- Ward, I.; Ogbonna, A.; Altan, H. Sector review of UK higher education energy consumption. Energy Policy 2008, 36, 2939–2949. [Google Scholar] [CrossRef]
- Alghamdi, N. Calm Before the Storm: Assessing Climate Change and Sustainability in Saudi Arabian Universities. In Handbook of Climate Change Communication: Volume 2: Practice of Climate Change Communication; Leal Filho, W., Manolas, E., Azul, A.M., Azeiteiro, U.M., McGhie, H., Eds.; Springer International Publishing: Cham, Switzerland, 2018; pp. 317–340. [Google Scholar] [CrossRef]
- Alghamdi, A.; Haider, H.; Hewage, K.; Sadiq, R. Inter-University Sustainability Benchmarking for Canadian Higher Education Institutions: Water, Energy, and Carbon Flows for Technical-Level Decision-Making. Sustainability 2019, 11, 2599. [Google Scholar] [CrossRef] [Green Version]
- AASHE. The Sustainability Tracking, Assessment & Rating System. Available online: https://reports.aashe.org/institutions/participants-and-reports/?sort=country (accessed on 11 March 2019).
- NSF. What’s an Engineered System? Available online: http://erc-assoc.org/content/what%E2%80%99s-engineered-system (accessed on 28 November 2018).
- Alshuwaikhat, H.M.; Abubakar, I. An integrated approach to achieving campus sustainability: Assessment of the current campus environmental management practices. J. Clean. Prod. 2008, 16, 1777–1785. [Google Scholar] [CrossRef] [Green Version]
- Calder, W.; Clugston, R.M. Progress Towards Sustainability in Higher Education; Envionmental Law Institute: Washington, DC, USA, 2003; Available online: http://www.ulsf.org/pdf/dernbach_chapter_short.pdf (accessed on 18 November 2017).
- Fischer, D.; Jenssen, S.; Tappeser, V. Getting an empirical hold of the sustainable university: A comparative analysis of evaluation frameworks across 12 contemporary sustainability assessment tools. Assess. Eval. High. Educ. 2015, 40, 785–800. [Google Scholar] [CrossRef] [Green Version]
- Grindsted, T.S. Sustainable universities–from declarations on sustainability in higher education to national law. Environ. Econ. 2011, 2, 29–36. Available online: https://forskning.ruc.dk/en/publications/sustainable-universities-from-declarations-on-sustainability-in-h (accessed on 21 March 2015). [CrossRef] [Green Version]
- Clarkson, R.E.; Samson, K.; Bekessy, S.A. The failure of non-binding declarations to achieve university sustainability: A need for accountability. Int. J. Sustain. High. Educ. 2007, 8, 301–316. [Google Scholar] [CrossRef]
- Lozano, R. A tool for a Graphical Assessment of Sustainability in Universities (GASU). J. Clean. Prod. 2006, 14, 963–972. [Google Scholar] [CrossRef]
- Shi, H.; Lai, E. An alternative university sustainability rating framework with a structured criteria tree. J. Clean. Prod. 2013, 61, 59–69. [Google Scholar] [CrossRef]
- Adams, C.A. Sustainability reporting and performance management in universities: Challenges and benefits. Sustain. Account. Manag. Policy J. 2013, 4, 384–392. [Google Scholar] [CrossRef]
- Renard, Y.J.S.; Maria, C.A.B.; David, G.C. A review of building/infrastructure sustainability reporting tools (SRTs). Smart Sustain. Built Environ. 2013, 2, 106–139. [Google Scholar] [CrossRef]
- AASHE. STARS Participants & Reports. Available online: https://reports.aashe.org/institutions/participants-and-reports/?sort=country (accessed on 12 January 2020).
- Urbanski, M.; Filho, W.L. Measuring sustainability at universities by means of the Sustainability Tracking, Assessment and Rating System (STARS): Early findings from STARS data. Environ. Dev. Sustain. 2015, 17, 209–220. [Google Scholar] [CrossRef]
- Shriberg, M. Institutional assessment tools for sustainability in higher education: Strengths, weaknesses, and implications for practice and theory. Int. J. Sustain. High. Educ. 2002, 3, 254–270. [Google Scholar] [CrossRef] [Green Version]
- McIntosh, M.; Cacciola, K.; Clermont, S.; Keniry, J. State of the Campus Environment: A National Report Card on Environmental Performance and Sustianability in Higher Education. Available online: https://www.nwf.org/EcoLeaders/Campus-Ecology-Resource-Center/Reports/State-of-the-Campus-Environment (accessed on 2 February 2020).
- Martin, J.; Samels, J.E. The Sustainable University: Green Goals and New Challenges for Higher Education Leaders; Johns Hopkins University Press: Baltimore, MD, USA, 2012. [Google Scholar]
- Gao, X.; Malkawi, A. A new methodology for building energy performance benchmarking: An approach based on intelligent clustering algorithm. Energy Build. 2014, 84, 607–616. [Google Scholar] [CrossRef]
- Hong, S.-M.; Paterson, G.; Burman, E.; Steadman, P.; Mumovic, D. A comparative study of benchmarking approaches for non-domestic buildings: Part 1—Top-down approach. Int. J. Sustain. Built Environ. 2014, 2, 119–130. [Google Scholar] [CrossRef] [Green Version]
- Burman, E.; Hong, S.-M.; Paterson, G.; Kimpian, J.; Mumovic, D. A comparative study of benchmarking approaches for non-domestic buildings: Part 2—Bottom-up approach. Int. J. Sustain. Built Environ. 2014, 3, 247–261. [Google Scholar] [CrossRef] [Green Version]
- Camp, R.C. Benchmarking—The search for industry best practices that lead to superior performance. Qual. Prog. 1989, 22, 66–68. [Google Scholar]
- Sartor, D.; Piette, M.A.; Tschudi, W. Strategies for Energy Benchmarking in Cleanrooms and Laboratory-Type Facilities; Lawrence Berkeley National Laboratory: Berkeley, CA, USA, 2000.
- Turner, D. Benchmarking in universities: League tables revisited. Oxf. Rev. Educ. 2005, 31, 353–371. [Google Scholar] [CrossRef]
- Yang, J.; Santamouris, M.; Lee, S.E.; Deb, C. Energy performance model development and occupancy number identification of institutional buildings. Energy Build. 2016, 123, 192–204. [Google Scholar] [CrossRef]
- Nikolaou, T.; Kolokotsa, D.; Stavrakakis, G. Review on methodologies for energy benchmarking, rating and classification of buildings. Adv. Build. Energy Res. 2011, 5, 53–70. [Google Scholar] [CrossRef]
- Pérez-Lombard, L.; Ortiz, J.; González, R.; Maestre, I.R. A review of benchmarking, rating and labelling concepts within the framework of building energy certification schemes. Energy Build. 2009, 41, 272–278. [Google Scholar] [CrossRef]
- Mills, E.; Bell, G.D.S.; Chen, A.; Avery, D.; Siminovitch, M.; Greenberg, S.; Marton, G.; de Almeida, A.; Lock, L.E. Energy Efficiency in California Laboratory-Type Facilities; Berkeley Lab: Berkeley, CA, USA, 1997; p. 359.
- Federspiel, C.; Zhang, Q.; Arens, E. Model-based benchmarking with application to laboratory buildings. Energy Build. 2002, 34, 203–214. [Google Scholar] [CrossRef] [Green Version]
- Huizenga, C.; Liere, W.; Bauman, F.; Arens, E. Development of Low-Cost Monitoring Protocols for Evaluating Energy Use in Laboratory Buildings; Center for Environmental Design Research, University of California: Berkeley, CA, USA, 1996. [Google Scholar]
- Baboulet, O.; Lenzen, M. Evaluating the environmental performance of a university. J. Clean. Prod. 2010, 18, 1134–1141. [Google Scholar] [CrossRef]
- He, Y.; Kvan, T.; Liu, M.; Li, B. How green building rating systems affect designing green. Build. Environ. 2018, 133, 19–31. [Google Scholar] [CrossRef]
- Lauder, A.; Sari, R.F.; Suwartha, N.; Tjahjono, G. Critical review of a global campus sustainability ranking: GreenMetric. J. Clean. Prod. 2015, 108, 852–863. [Google Scholar] [CrossRef]
- Boer, P. Assessing Sustainability and Social Responsibility in Higher Education Assessment Frameworks Explained. In Sustainability Assessment Tools in Higher Education Institutions: Mapping Trends and Good Practices Around the World; Caeiro, S., Filho, W.L., Jabbour, C., Azeiteiro, U.M., Eds.; Springer International Publishing: Cham, Switzerland, 2013; pp. 121–137. [Google Scholar] [CrossRef]
- Davis, J.A.; Nutter, D.W. Occupancy diversity factors for common university building types. Energy Build. 2010, 42, 1543–1551. [Google Scholar] [CrossRef]
- Santamouris, M.; Mihalakakou, G.; Patargias, P.; Gaitani, N.; Sfakianaki, K.; Papaglastra, M.; Pavlou, C.; Doukas, P.; Primikiri, E.; Geros, V.; et al. Using intelligent clustering techniques to classify the energy performance of school buildings. Energy Build. 2007, 39, 45–51. [Google Scholar] [CrossRef]
- Chung, W.; Hu, Y.V.; Lam, Y.M. Benchmarking the energy efficiency of commercial buildings. Appl. Energy 2004, 83, 1–14. [Google Scholar] [CrossRef]
- Iliadis, L.S.; Vangeloudh, M.; Spartalis, S. An intelligfent system employing an enhanced fuzzy c-means clustering model: Application in the case of forest fires. Comput. Electron. Agric. 2010, 70, 276–284. [Google Scholar] [CrossRef]
- Krajnic, D.; Mele, M.; Glavic, P. Fuzzy Logic Model for the performance benchmarking of sugar plants by considering best available techniques. Resour. Conserv. Recycl. 2007, 52, 314–330. [Google Scholar] [CrossRef]
- Kouloumpis, V.; Azapagic, A. Integrated life cycle sustainability assessment using fuzzy inference: a novel FELICITA model. Sustain. Product. Consumption 2018, 15, 25–34. [Google Scholar] [CrossRef] [Green Version]
- Haider, H.; Hewage, K.; Umer, A.; Ruparathna, R.; Chhipi-Shrestha, G.; Culver, K.; Holland, M.; Kay, J.; Sadiq, R. Sustainability Assessment Framework for Small-sized Urban Neighbourhoods: An Application of Fuzzy Synthetic Evaluation. Sustain. Cities Soc. 2018, 36, 21–32. [Google Scholar] [CrossRef]
- Hu, G.; Kaur, M.; Hewage, K.; Sadiq, R. An integrated chemical management methodology for hydraulic fracturing: A fuzzy-based indexing approach. J. Clean. Product. 2018, 187, 63–75. [Google Scholar] [CrossRef]
- UBC. SkySpark. Available online: https://skyspark.energy.ubc.ca/user/login (accessed on 1 January2019).
- Climatemps. Vancouver British Columbia and Kelowna BC Climate & Distance in Between. Available online: http://www.vancouver.climatemps.com/vs/kelowna.php (accessed on 18 January 2020).
- CER. Canada’s Renewable Power Landscape 2016-Energy Market Analysis- British Columbia. Available online: https://www.cer-rec.gc.ca/nrg/sttstc/lctrct/rprt/2016cndrnwblpwr/prvnc/bc-eng.html (accessed on 19 January 2020).
- Environment, B.M. 2016/2017 B.C. Best Practices Methodology for Quanitifying Greenhouse Gas Emissions; Ministry of Environment: Victoria, BC, Canada, 2016.
- FortisBC. Public Sector Organizations: Reducing GHF emissions with RNG. Available online: https://www.fortisbc.com/services/sustainable-energy-options/renewable-natural-gas/public-sector-organizations-reducing-ghg-emissions-with-rng (accessed on 9 January 2020).
- Hu, G.; Kaur, M.; Hewage, K.; Sadiq, R. Fuzzy clustering analysis of hydraulic fracturing additives for environmental and human health risk mitigation. Clean Technol. Environ. Policy 2019, 21, 39–53. [Google Scholar] [CrossRef]
- Cox, E. Chapter 7—Fuzzy Clustering. In Fuzzy Modeling and Genetic Algorithms for Data Mining and Exploration; Cox, E., Ed.; Morgan Kaufmann: San Francisco, CA, USA, 2005; pp. 207–263. [Google Scholar] [CrossRef]
- Sadiq, R.; Rodriguez, M.J.; Imran, S.A.; Najjaran, H. Communicating human health risks associated with disinfection by-products in drinking water supplies: A fuzzy-based approach. Stoch. Environ. Res. Risk Assess. 2007, 21, 341–353. [Google Scholar] [CrossRef] [Green Version]
- Lu, R.-S.; Lo, S.-L.; Hu, J.-Y. Analysis of reservoir water quality using fuzzy synthetic evaluation. Stoch. Environ. Res. Risk Assess. 1999, 13, 327–336. [Google Scholar] [CrossRef]
Figure 1.
Roadmap to a sustainable campus [28].
Figure 1.
Roadmap to a sustainable campus [28].

Figure 2.
The framework of fuzzy clustering-based environment performance benchmarking of academic buildings.
Figure 2.
The framework of fuzzy clustering-based environment performance benchmarking of academic buildings.

Figure 3.
Scalability of the framework.

Figure 4.
Boxplots of the normalized metabolic flows (MF).

Figure 5.
The 50th and 75th percentile benchmarks for (a) water usage intensity (WUI), (b) energy usage intensity (EUI), and (c) carbon usage intensity (CUI).
Figure 5.
The 50th and 75th percentile benchmarks for (a) water usage intensity (WUI), (b) energy usage intensity (EUI), and (c) carbon usage intensity (CUI).


Figure 6.
Within cluster sum of squares (WCSS) plot to select the number of clusters.

Figure 7.
The three cluster layout.

Figure 8.
GHG Growth rate per province and the number of HEIs per province.

Table 1.
Distribution of energy source for building heating in University of British Columbia Vancouver campus (UBCV).
Table 1.
Distribution of energy source for building heating in University of British Columbia Vancouver campus (UBCV).
| Energy Source | Percent |
|---|---|
| Renewable Gas | 10% |
| Biomass | 25% |
| Natural Gas | 65% |
Table 2.
Carbon emission factors by energy source. UBCO, University of British Columbia Okanagan campus.
Table 2.
Carbon emission factors by energy source. UBCO, University of British Columbia Okanagan campus.
| Source | kg CO2e/GJ | UBCV kg CO2e/kWh | UBCO kg CO2e/kWh |
|---|---|---|---|
| Renewable Gas | 0.29 | 0.0010 | 0.0010 |
| Biomass | 0 | 0.0000176 | 0.0000176 |
| Natural Gas | 49.87 | 0.1795 | 0.1795 |
| Electricity | 0 | 0.0107 | 0.0026 |
Table 3.
Metabolic flow data of Alumni Centre, UBCV.
| Source | Value |
|---|---|
| Electricity (kWh) | 713,572 |
| Heating (kWh) | 229,117 |
| Water (m3) | 3968 |
| Natural gas (m3) | 2025 |
| GHG (kg, CO2e) | 38 |
Table 4.
Cumulative distribution of functional benchmarking.
| Parameter | Percentile | Value | No. of Buildings Above | No. of Buildings Below |
|---|---|---|---|---|
| WUI | 50th Percentile | 0.84584 | 35 | 35 |
| 75th Percentile | 1.262188 | 18 | 53 | |
| EUI | 50th Percentile | 235.05355 | 35 | 35 |
| 75th Percentile | 315.3586 | 18 | 53 | |
| CUI | 50th Percentile | 0.01029 | 35 | 35 |
| 75th Percentile | 0.02273 | 18 | 35 |
Table 5.
Cluster centroids.
| Cluster | WUI | EUI | CUI |
|---|---|---|---|
| 1 | 1.008317 | 308.9435 | 0.016878 |
| 2 | 0.796999 | 130.3005 | 0.008255 |
| 3 | 1.603258 | 714.9797 | 0.034582 |
Table 6.
Statistical summary of the cluster results.
| Variable | Total | Mean | Standard Error Mean | Standard Deviation | Variance | Sum | Minimum | Q1 | Median | Q3 | Maximum | IQR Interquartile Range |
|---|---|---|---|---|---|---|---|---|---|---|---|---|
| WUI_C1 | 30 | 1.01 | 0.15 | 0.8 | 0.63 | 30.3 | 0.2 | 0.6 | 0.87 | 1.02 | 4.4 | 0.38 |
| EUI_C1 | 30 | 308.2 | 13.1 | 71.9 | 5170.9 | 9246 | 221.1 | 261.9 | 283.3 | 355.2 | 493.5 | 93.4 |
| CUI_C1 | 30 | 0.02 | 0.002 | 0.01 | 0.0001 | 0.5 | 0.002 | 0.01 | 0.017 | 0.02 | 0.043 | 0.014 |
| WUI_C2 | 33 | 0.8 | 0.12 | 0.7 | 0.5 | 26.3 | 0.06 | 0.292 | 0.5 | 1.3 | 3.22 | 0.97 |
| EUI_C2 | 33 | 127.4 | 6.58 | 37.8 | 1429.6 | 4204 | 59.5 | 89.20 | 131.3 | 160.1 | 189.1 | 70.92 |
| CUI_C2 | 33 | 0.008 | 0.001 | 0.007 | 0.00005 | 0.3 | 0.0006 | 0.00198 | 0.008 | 0.01 | 0.035 | 0.008 |
| WUI_C3 | 8 | 1.7 | 0.5 | 1.5 | 2.3 | 13.7 | 0.2 | 0.754 | 1.1 | 3.4 | 4.16 | 2.62 |
| EUI_C3 | 8 | 690.2 | 51 | 144.3 | 20833 | 5521 | 515.8 | 554.7 | 652.4 | 840.0 | 889.5 | 285.3 |
| CUI_C3 | 8 | 0.03 | 0.003 | 0.007 | 0.00005 | 0.28 | 0.03 | 0.03 | 0.03 | 0.04 | 0.04 | 0.01 |
Table 7.
Benchmarking results.
| Cluster | No. of Buildings | Average Area | Avg WUI | Avg EUI | Avg CUI | Office % | Library % | Laboratory % | Classroom % |
|---|---|---|---|---|---|---|---|---|---|
| C1 | 30 | 11,528 | 1.01 | 308.21 | 0.02 | 33.33 | 6.67 | 43.33 | 0 |
| C2 | 33 | 10,051 | 0.8 | 127.4 | 0.01 | 30.3 | 12.12 | 12.12 | 9.08 |
| C3 | 8 | 5,843 | 1.72 | 690.16 | 0.04 | 12.5 | 0 | 75 | 0 |
© 2020 by the authors. Licensee MDPI, Basel, Switzerland. This article is an open access article distributed under the terms and conditions of the Creative Commons Attribution (CC BY) license (http://creativecommons.org/licenses/by/4.0/).
Share and Cite
MDPI and ACS Style
Alghamdi, A.; Hu, G.; Haider, H.; Hewage, K.; Sadiq, R. Benchmarking of Water, Energy, and Carbon Flows in Academic Buildings: A Fuzzy Clustering Approach. Sustainability 2020, 12, 4422. https://doi.org/10.3390/su12114422
AMA Style
Alghamdi A, Hu G, Haider H, Hewage K, Sadiq R. Benchmarking of Water, Energy, and Carbon Flows in Academic Buildings: A Fuzzy Clustering Approach. Sustainability. 2020; 12(11):4422. https://doi.org/10.3390/su12114422
Chicago/Turabian StyleAlghamdi, Abdulaziz, Guangji Hu, Husnain Haider, Kasun Hewage, and Rehan Sadiq. 2020. "Benchmarking of Water, Energy, and Carbon Flows in Academic Buildings: A Fuzzy Clustering Approach" Sustainability 12, no. 11: 4422. https://doi.org/10.3390/su12114422
Note that from the first issue of 2016, this journal uses article numbers instead of page numbers. See further details here.