Evaluating the Performance of a Non-Bonded Cu2+ Model Including Jahn−Teller Effect into the Binding of Tyrosinase Inhibitors

 , ,
, ,  ,
,
Abstract
:
1. Introduction
2. Results and Discussion
2.1. Molecular Docking Simulations
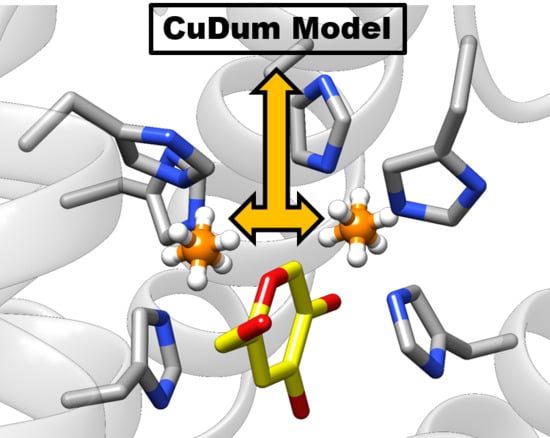
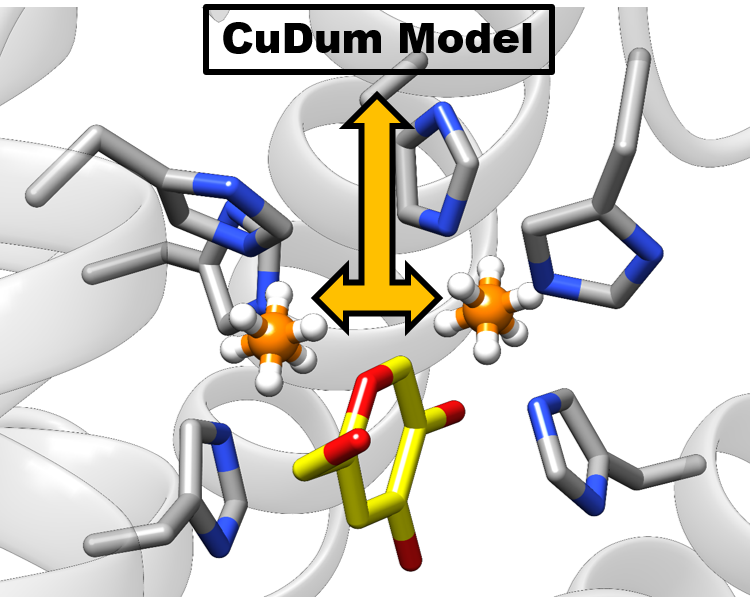
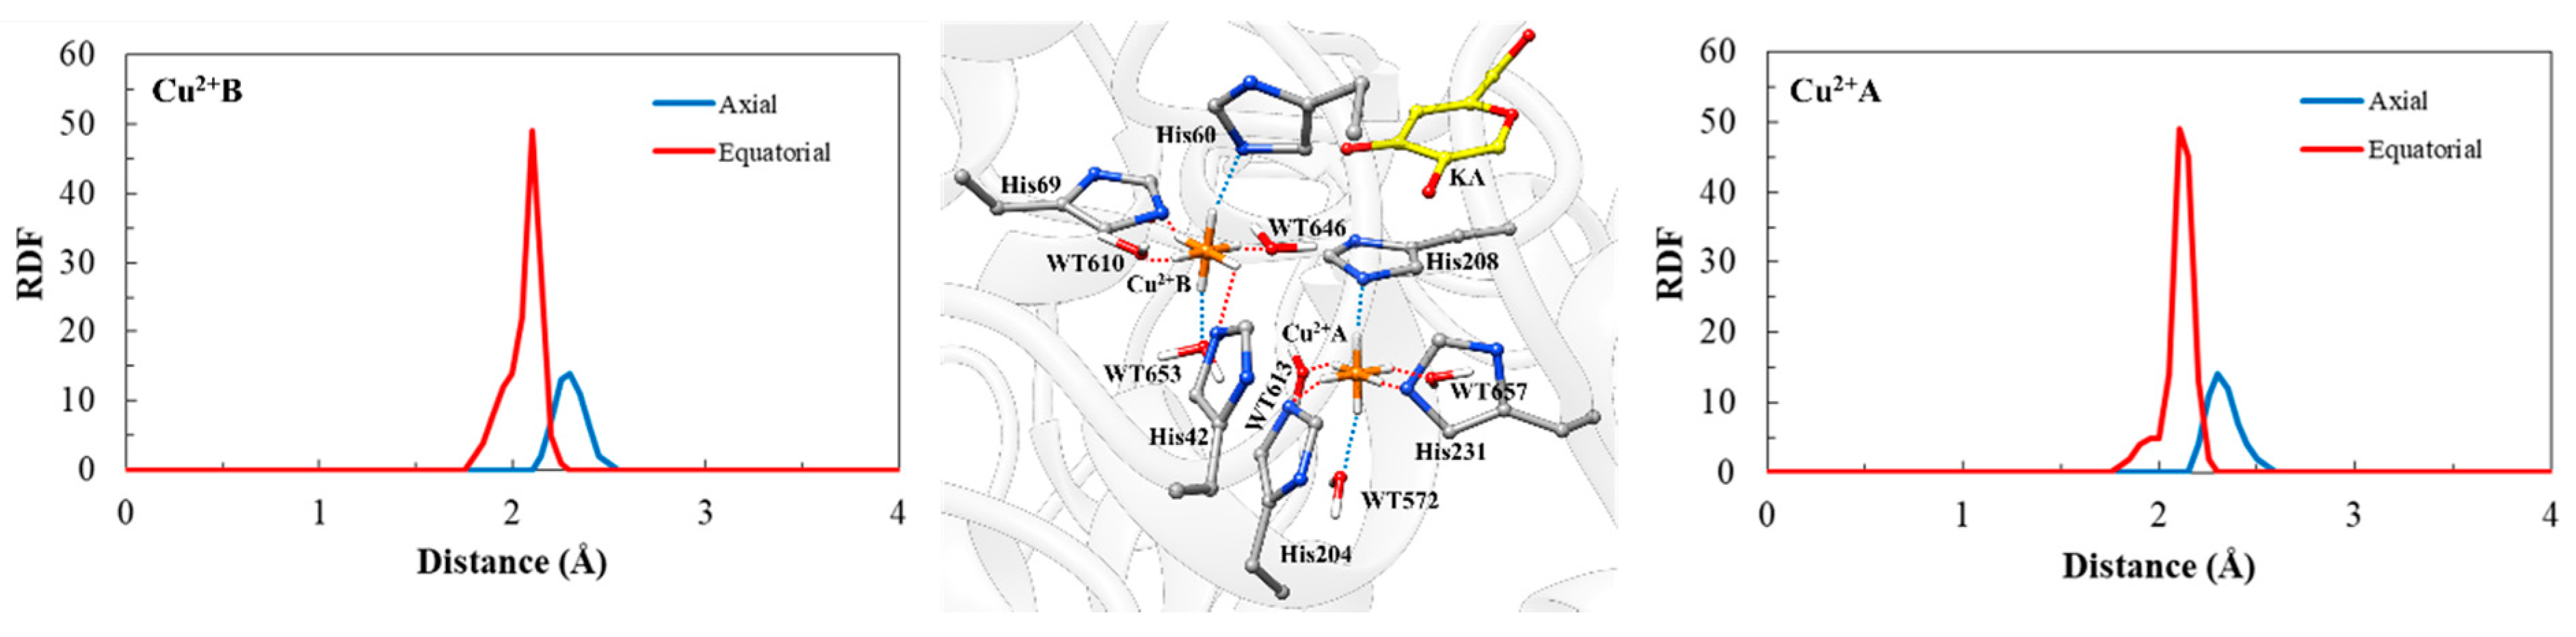
2.2. Molecular Dynamics (MD) Simulation and CuDum Model
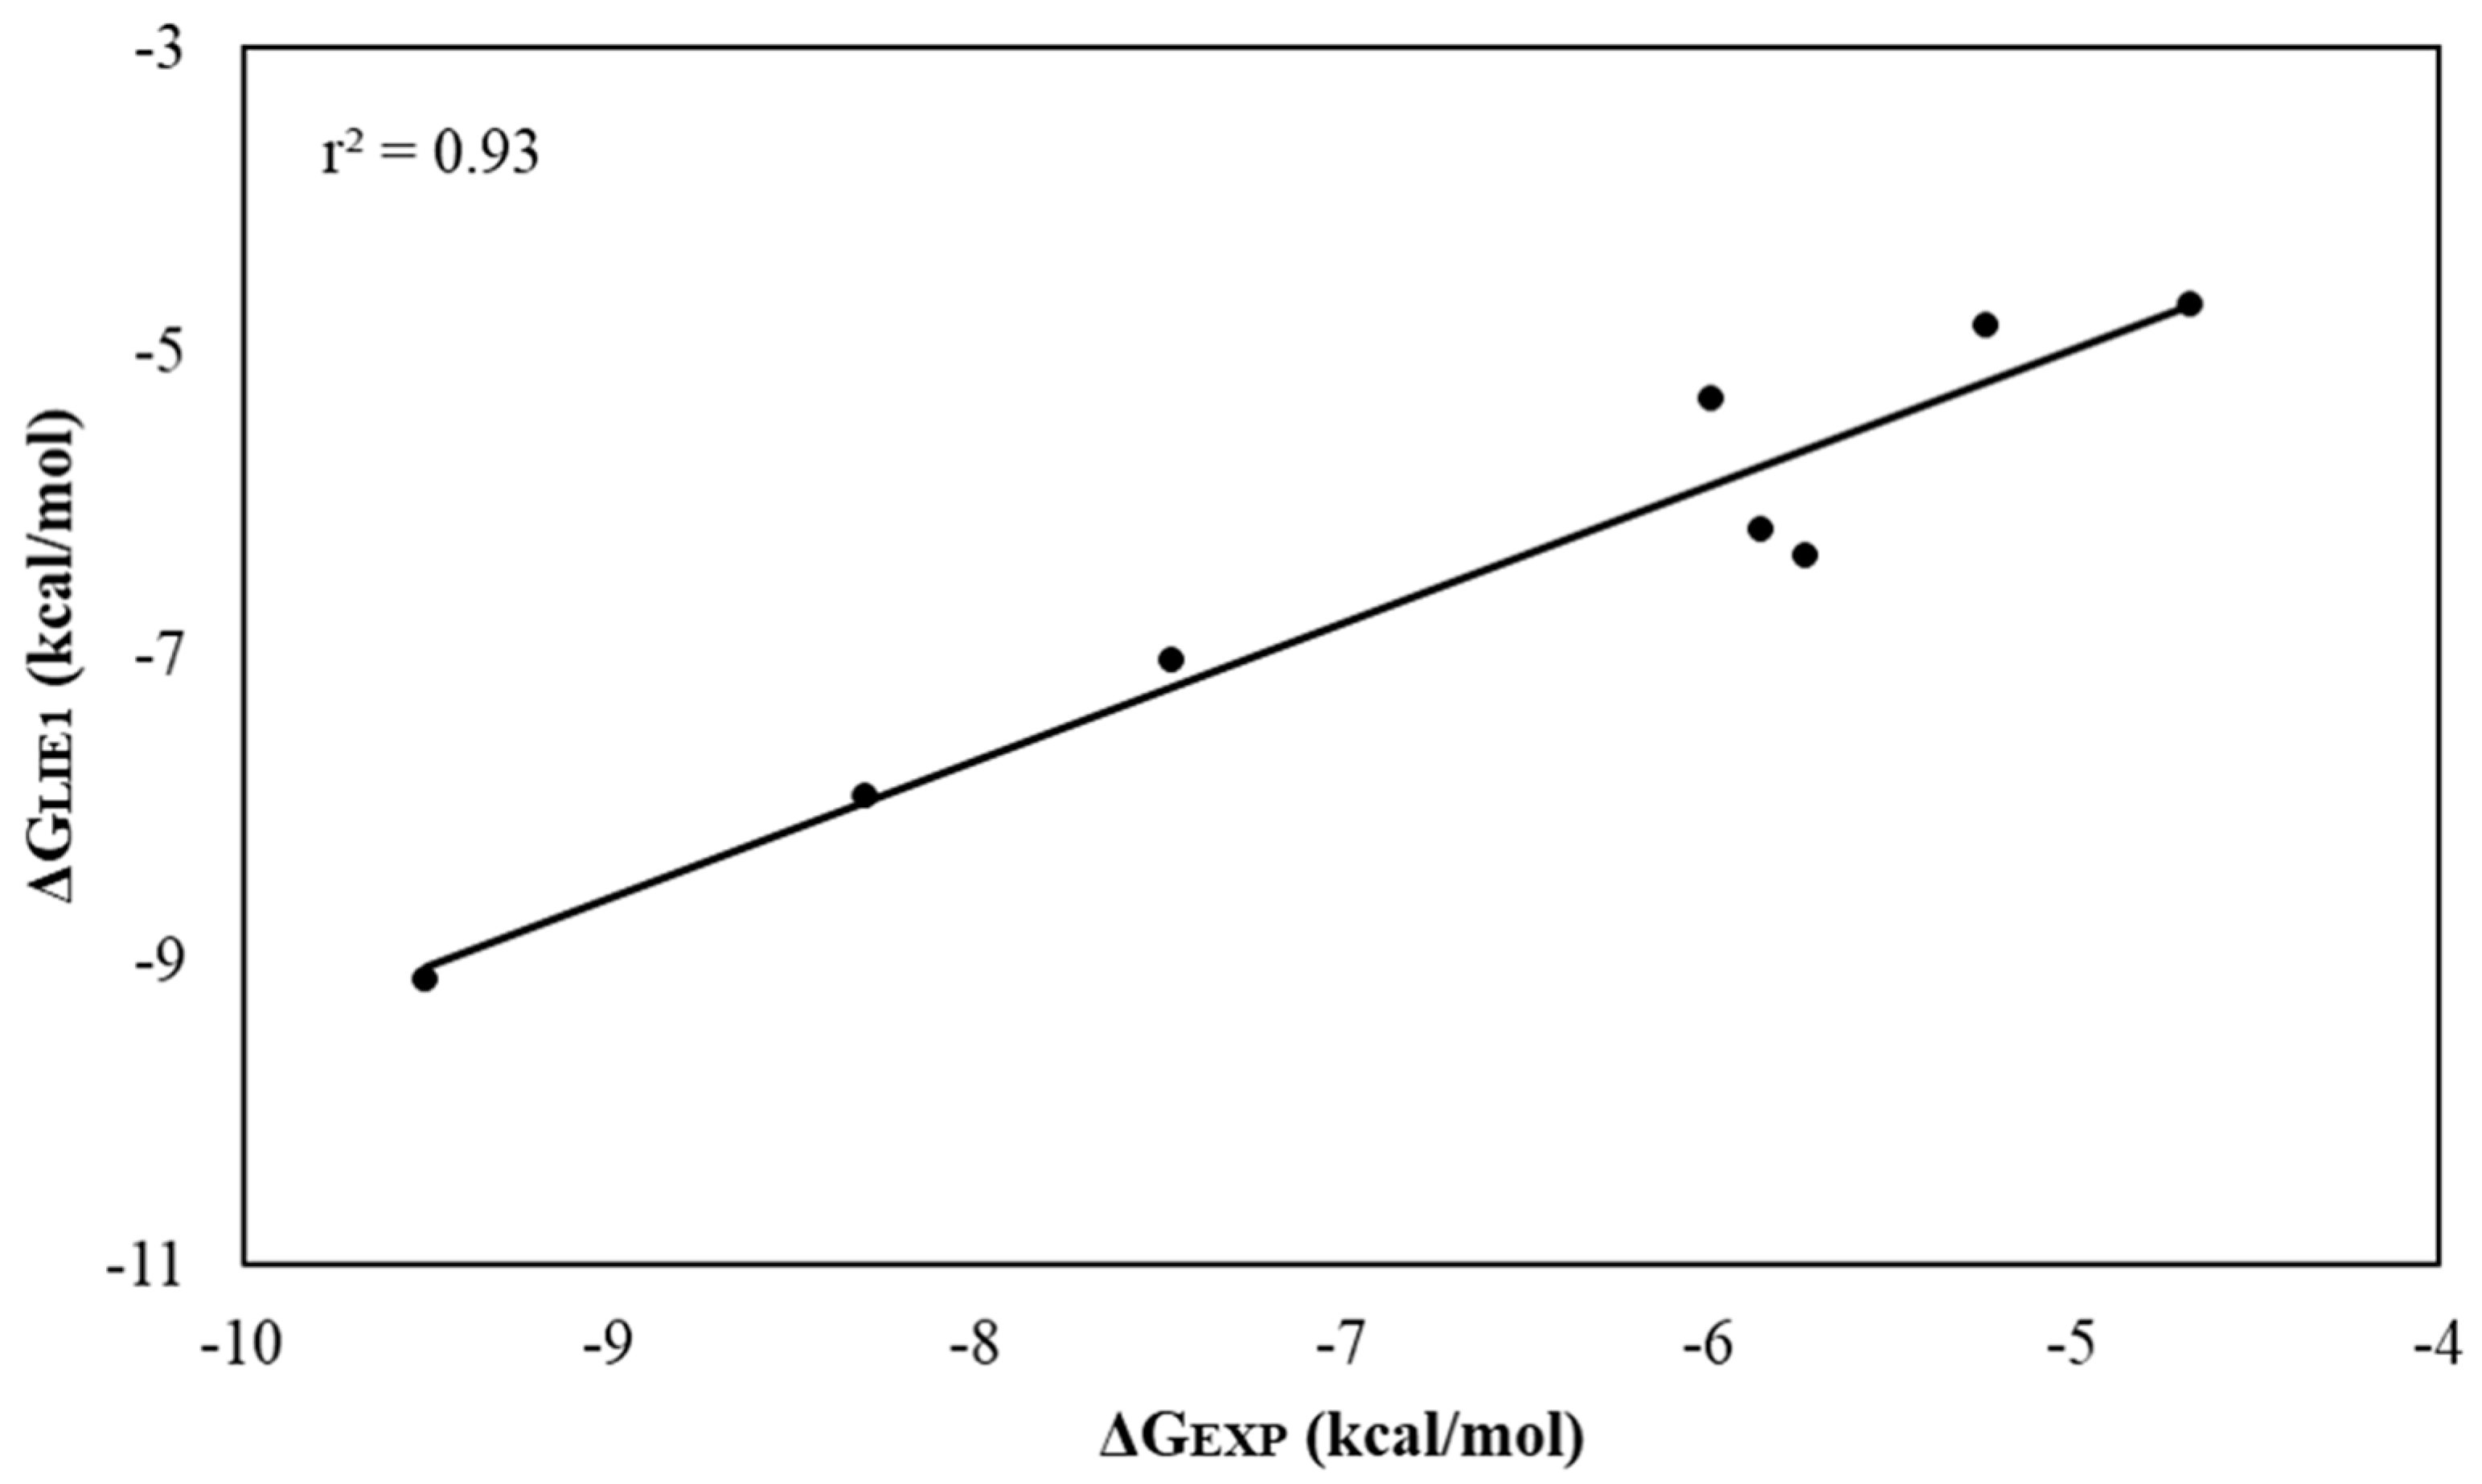
2.3. Linear Interaction Energy (LIE)
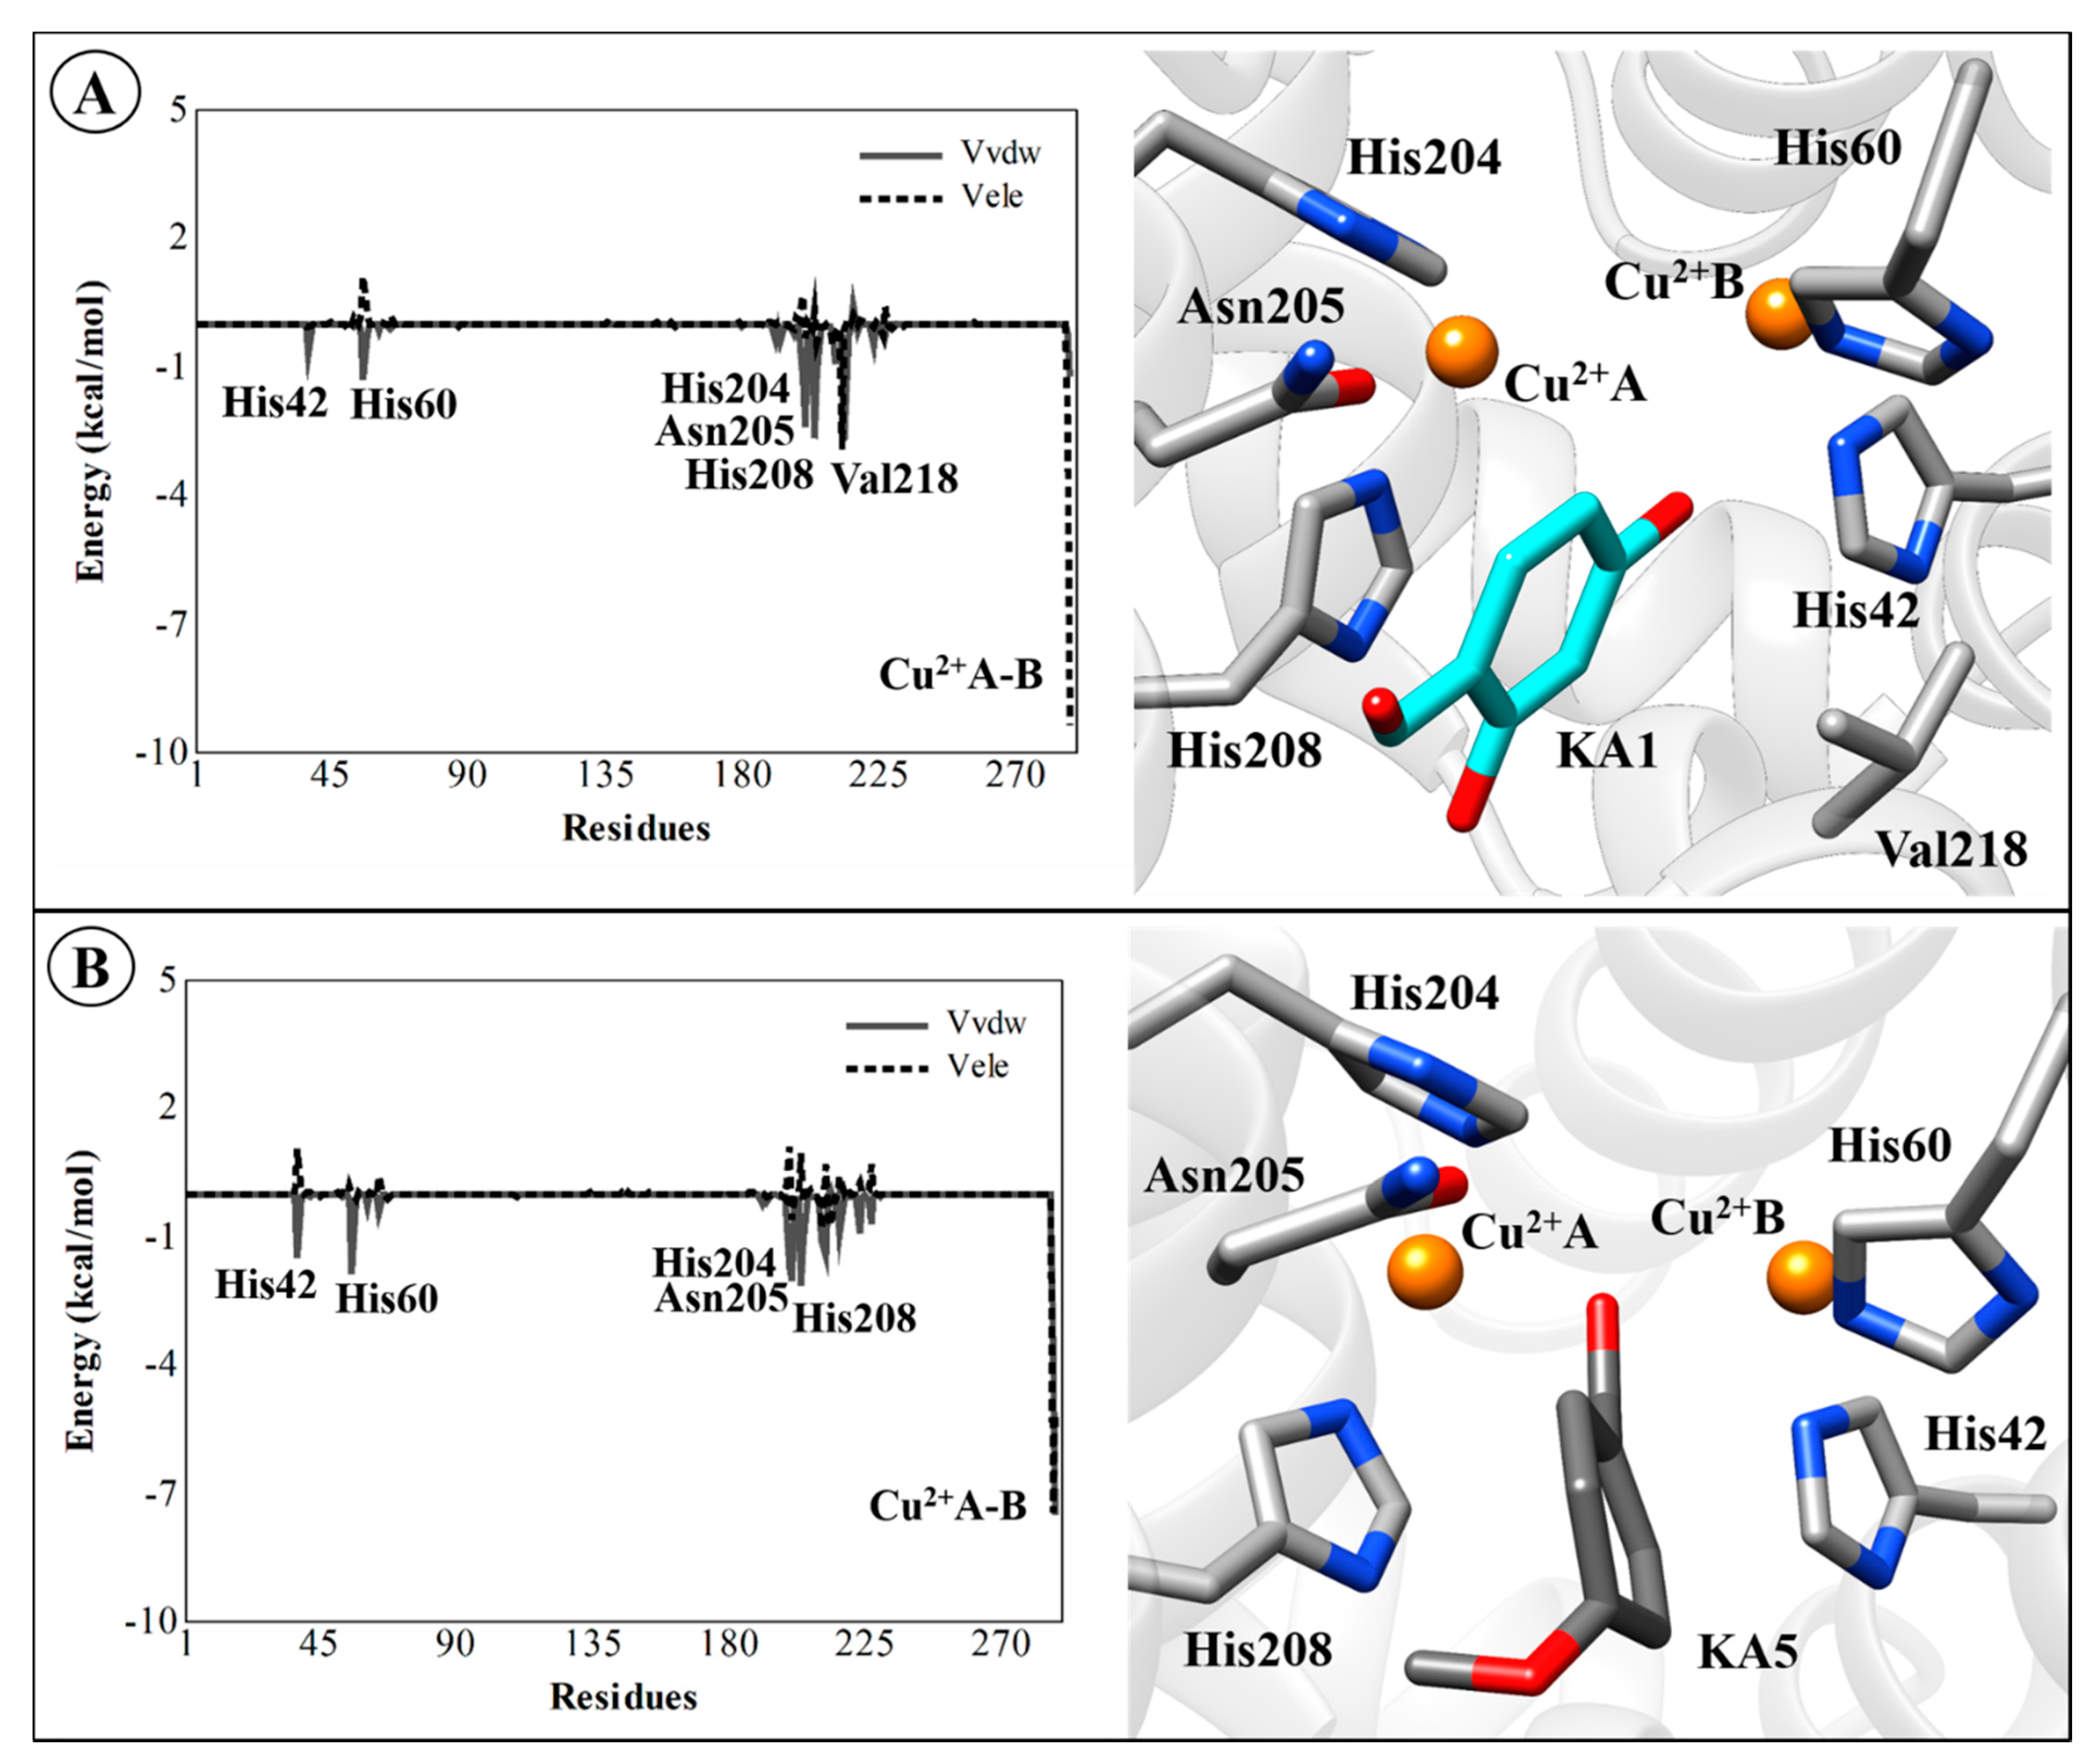
2.4. Residual Decomposition Analysis
3. Materials and Methods
3.1. Molecular Docking Simulations
3.2. Molecular Dynamics (MD) Simulations
3.3. Linear Interaction Energy (LIE) Approach
4. Conclusions
Supplementary Materials
Author Contributions
Funding
Acknowledgments
Conflicts of Interest
References
- Chang, T.-S. An Updated Review of Tyrosinase Inhibitors. Int. J. Mol. Sci. 2009, 10, 2440–2475. [Google Scholar] [CrossRef] [PubMed] [Green Version]
- Kim, Y.-J.; Uyama, H. Tyrosinase inhibitors from natural and synthetic sources: Structure, inhibition mechanism and perspective for the future. Cell. Mol. Life Sci. 2005, 62, 1707–1723. [Google Scholar] [CrossRef] [PubMed]
- Saghaie, L.; Pourfarzam, M.; Fassihi, A.; Sartippour, B. Synthesis and tyrosinase inhibitory properties of some novel derivatives of kojic acid. Res. Pharm. Sci. 2013, 8, 233–242. [Google Scholar] [PubMed]
- Brenner, M.; Hearing, V.J. The protective role of melanin against UV damage in human skin. Photochem. Photobiol. 2008, 84, 539–549. [Google Scholar] [CrossRef] [PubMed] [Green Version]
- Cestari, T.F.; Dantas, L.P.; Boza, J.C. Acquired hyperpigmentations. An. Bras. Dermatol. 2014, 89, 11–25. [Google Scholar] [CrossRef] [PubMed] [Green Version]
- Nayak, C.S.; Nouveau, S.; Agrawal, D.; Kohli, M.; Bernerd, F.; Misra, N. Skin hyperpigmentation in Indian population: Insights and best practice. Indian J. Dermatol. 2016, 61, 487–495. [Google Scholar] [CrossRef]
- Dogra, S.; Sarangal, R. Pigmentary disorders: An insight. Pigment. Int. 2014, 1, 5. [Google Scholar] [CrossRef]
- Tief, K.; Hahne, M.; Schmidt, A.; Beermann, F. Tyrosinase, the Key Enzyme in Melanin Synthesis, is Expressed in Murine Brain. JBIC J. Boil. Inorg. Chem. 1996, 241, 12–16. [Google Scholar] [CrossRef]
- Hearing, V.J.; Tsukamoto, K. Enzymatic control of pigmentation in mammals. FASEB J. 1991, 5, 2902–2909. [Google Scholar] [CrossRef] [Green Version]
- Zolghadri, S.; Bahrami, A.; Khan, M.T.H.; Muñoz-Muñoz, J.L.; Garcia-Molina, F.; Garcia-Canovas, F.; Saboury, A.A. A comprehensive review on tyrosinase inhibitors. J. Enzym. Inhib. Med. Chem. 2019, 34, 279–309. [Google Scholar] [CrossRef] [Green Version]
- Coates, C.J.; Nairn, J. Diverse immune functions of hemocyanins. Dev. Comp. Immunol. 2014, 45, 43–55. [Google Scholar] [CrossRef]
- Khanom, F.; Kayahara, H.; Tadasa, K. Tyrosinase Inhibitory Activity of Bangladeshi Indigenous Medicinal Plants. Biosci. Biotechnol. Biochem. 2000, 64, 1967–1969. [Google Scholar] [CrossRef] [PubMed]
- Olianas, A.; Sanjust, E.; Pellegrini, M.; Rescigno, A. Tyrosinase activity and hemocyanin in the hemolymph of the slipper lobster Scyllarides latus. J. Comp. Physiol. B 2005, 175, 405–411. [Google Scholar] [CrossRef] [PubMed]
- Decker, H.; Schweikardt, T.; Nillius, D.; Salzbrunn, U.; Jaenicke, E.; Tuczek, F. Similar enzyme activation and catalysis in hemocyanins and tyrosinases. Gene 2007, 398, 183–191. [Google Scholar] [CrossRef] [PubMed]
- Kanteev, M.; Goldfeder, M.; Fishman, A. Structure–function correlations in tyrosinases. Protein Sci. 2015, 24, 1360–1369. [Google Scholar] [CrossRef] [PubMed]
- Halaban, R.; Patton, R.S.; Cheng, E.; Svedine, S.; Trombetta, E.S.; Wahl, M.L.; Ariyan, S.; Hebert, D.N. Abnormal Acidification of Melanoma Cells Induces Tyrosinase Retention in the Early Secretory Pathway. J. Boil. Chem. 2002, 277, 14821–14828. [Google Scholar] [CrossRef] [Green Version]
- Claus, H.; Decker, H. Bacterial tyrosinases. Syst. Appl. Microbiol. 2006, 29, 3–14. [Google Scholar] [CrossRef]
- Kobayashi, Y.; Kayahara, H.; Tadasa, K.; Tanaka, H. Synthesis of N-kojic-amino acid and N-kojic-amino acid-kojiate and their tyrosinase inhibitory activity. Bioorganic Med. Chem. Lett. 1996, 6, 1303–1308. [Google Scholar] [CrossRef]
- Kahn, V.; Andrawis, A. Inhibition of mushroom tyrosinase by tropolone. Phytochemistry 1985, 24, 905–908. [Google Scholar] [CrossRef]
- Liu, J.; Wu, F.; Chen, L.; Zhao, L.; Zhao, Z.; Wang, M.; Lei, S. Biological evaluation of coumarin derivatives as mushroom tyrosinase inhibitors. Food Chem. 2012, 135, 2872–2878. [Google Scholar] [CrossRef]
- Bagheri-Kalmarzi, M.; Sajedi, R.; Asadollahi, E.; Mahmoodi, N.O.; Haji-Hosseini, R. Effect of vanillin and its acid and alcohol derivatives on the diphenolase activity of mushroom tyrosinase. Mol. Biol. Res. Commun. 2013, 1, 74–82. [Google Scholar] [CrossRef]
- Cabanes, J.; Chazarra, S.; Garcia-Carmona, F. Kojic Acid, a Cosmetic Skin Whitening Agent, is a Slow-binding Inhibitor of Catecholase Activity of Tyrosinase. J. Pharm. Pharmacol. 1994, 46, 982–985. [Google Scholar] [CrossRef] [PubMed]
- Rodrigues, A.P.D.; Carvalho, A.S.C.; Santos, A.S.; Alves, C.N.; Nascimento, J.L.M.D.; da Silva, E.O. Kojic acid, a secondary metabolite from Aspergillus sp., acts as an inducer of macrophage activation. Cell Boil. Int. 2011, 35, 335–343. [Google Scholar] [CrossRef] [PubMed]
- García-Gavín, J.; González-Vilas, D.; Fernández-Redondo, V.; Toribio, J. Pigmented contact dermatitis due to kojic acid. A paradoxical side effect of a skin lightener. Contact Dermat. 2010, 62, 63–64. [Google Scholar] [CrossRef]
- Hashemi, S.M.; Emami, S. Kojic acid-derived tyrosinase inhibitors: Synthesis and bioactivity. Pharm. Biomed. Res. 2015, 1, 1–17. [Google Scholar] [CrossRef] [Green Version]
- Kim, H.; Choi, J.; Cho, J.; Kim, S.Y.; Lee, Y.-S. Solid-phase synthesis of kojic acid-tripeptides and their tyrosinase inhibitory activity, storage stability, and toxicity. Bioorganic Med. Chem. Lett. 2004, 14, 2843–2846. [Google Scholar] [CrossRef]
- Araújo, J.D.O.; dos Santos, A.M.; Lameira, J.; Alves, C.N.; E Lima, A.H.L. Computational Investigation of Bisphosphate Inhibitors of 3-Deoxy-d-manno-octulosonate 8-phosphate Synthase. Molecules 2019, 24, 2370. [Google Scholar] [CrossRef] [Green Version]
- da Costa, C.H.S.; Bichara, T.W.; Gomes, G.C.; dos Santos, A.M.; da Costa, K.S.; E Lima, A.H.L.; Alves, C.N.; Lameira, J. Unraveling the conformational dynamics of glycerol 3-phosphate dehydrogenase, a nicotinamide adenine dinucleotide-dependent enzyme of Leishmania mexicana. J. Biomol. Struct. Dyn. 2020, 25, 1–12. [Google Scholar] [CrossRef]
- Pereira, P.R.M.; Araújo, J.D.O.; Silva, J.R.A.; Alves, C.N.; Lameira, J.; E Lima, A.H.L. Exploring Chloride Selectivity and Halogenase Regioselectivity of the SalL Enzyme through Quantum Mechanical/Molecular Mechanical Modeling. J. Chem. Inf. Model. 2020, 60, 738–746. [Google Scholar] [CrossRef]
- Sanusi, Z.K.; Lawal, M.M.; Govender, T.; Maguire, G.E.M.; Honarparvar, B.; Kruger, H.G. Theoretical Model for HIV-1 PR That Accounts for Substrate Recognition and Preferential Cleavage of Natural Substrates. J. Phys. Chem. B 2019, 123, 6389–6400. [Google Scholar] [CrossRef]
- Sanusi, Z.K.; Govender, T.; Maguire, G.E.M.; Maseko, S.B.; Johnson, L.; Kruger, H.G.; Honarparvar, B. An insight to the molecular interactions of the FDA approved HIV PR drugs against L38L↑N↑L PR mutant. J. Comput. Mol. Des. 2018, 32, 459–471. [Google Scholar] [CrossRef] [PubMed]
- Sanusi, Z.K.; Lawal, M.M.; Govender, T.; Baijnath, S.; Naicker, T.; Maguire, G.E.M.; Honarparvar, B.; Kruger, H.G. Concerted hydrolysis mechanism of HIV-1 natural substrate against subtypes B and C-SA PR: Insight through molecular dynamics and hybrid QM/MM studies. Phys. Chem. Chem. Phys. 2020, 22, 2530–2539. [Google Scholar] [CrossRef] [PubMed]
- Silva, J.R.A.; Cianni, L.; Araújo, D.; Batista, P.H.J.; de Vita, D.; Rosini, F.; Leitao, A.; Lameira, J.; Montanari, C.A. Assessment of the Cruzain Cysteine Protease Reversible and Irreversible Covalent Inhibition Mechanism. J. Chem. Inf. Model. 2020, 60, 1666–1677. [Google Scholar] [CrossRef] [PubMed]
- Tolufashe, G.F.; Halder, A.K.; Ibeji, C.U.; Lawal, M.M.; Ntombela, T.; Govender, T.; Maguire, G.E.M.; Lamichhane, G.; Kruger, H.G.; Honarparvar, B. Inhibition of Mycobacterium tuberculosis l,d-Transpeptidase 5 by Carbapenems: MD and QM/MM Mechanistic Studies. Chemistry 2018, 3, 13603–13612. [Google Scholar] [CrossRef]
- Fakhar, Z.; Govender, T.; Lamichhane, G.; Maguire, G.E.M.; Kruger, H.G.; Honarparvar, B. Computational model for the acylation step of the β-lactam ring: Potential application for l,d-transpeptidase 2 in mycobacterium tuberculosis. J. Mol. Struct. 2017, 1128, 94–102. [Google Scholar] [CrossRef]
- Lameira, J.; Bonatto, V.; Cianni, L.; Rocho, F.D.R.; Leitão, A.; Montanari, C.A. Predicting the affinity of halogenated reversible covalent inhibitors through relative binding free energy. Phys. Chem. Chem. Phys. 2019, 21, 24723–24730. [Google Scholar] [CrossRef]
- Lawal, M.M.; Sanusi, Z.K.; Govender, T.; Tolufashe, G.F.; Maguire, G.E.M.; Honarparvar, B.; Kruger, H.G. Unraveling the concerted catalytic mechanism of the human immunodeficiency virus type 1 (HIV-1) protease: A hybrid QM/MM study. Struct. Chem. 2018, 30, 409–417. [Google Scholar] [CrossRef]
- Lockhat, H.A.; Silva, J.R.A.; Alves, C.N.; Govender, T.; Lameira, J.; Maguire, G.E.M.; Sayed, Y.; Kruger, H.G.; Kruger, H.G. Binding Free Energy Calculations of Nine FDA-approved Protease Inhibitors Against HIV-1 Subtype C I36T↑T Containing 100 Amino Acids Per Monomer. Chem. Boil. Drug Des. 2016, 87, 487–498. [Google Scholar] [CrossRef]
- Ntombela, T.; Fakhar, Z.; Ibeji, C.U.; Govender, T.; Maguire, G.E.M.; Lamichhane, G.; Kruger, H.G.; Honarparvar, B. Molecular insight on the non-covalent interactions between carbapenems and l,d-transpeptidase 2 from Mycobacterium tuberculosis: ONIOM study. J. Comput. Mol. Des. 2018, 32, 687–701. [Google Scholar] [CrossRef] [Green Version]
- Liao, Q.; Kamerlin, S.C.L.; Strodel, B. Development and Application of a Nonbonded Cu2+ Model That Includes the Jahn–Teller Effect. J. Phys. Chem. Lett. 2015, 6, 2657–2662. [Google Scholar] [CrossRef]
- Duarte, F.; Bauer, P.; Barrozo, A.; Amrein, B.A.; Purg, M.; Åqvist, J.; Kamerlin, S.C.L. Force Field Independent Metal Parameters Using a Nonbonded Dummy Model. J. Phys. Chem. B 2014, 118, 4351–4362. [Google Scholar] [CrossRef] [PubMed]
- Oelschlaeger, P.; Klahn, M.; Beard, W.A.; Wilson, S.H.; Warshel, A. Magnesium-cationic Dummy Atom Molecules Enhance Representation of DNA Polymerase β in Molecular Dynamics Simulations: Improved Accuracy in Studies of Structural Features and Mutational Effects. J. Mol. Boil. 2006, 366, 687–701. [Google Scholar] [CrossRef] [Green Version]
- Saxena, A.; Sept, D. Multisite Ion Models That Improve Coordination and Free Energy Calculations in Molecular Dynamics Simulations. J. Chem. Theory Comput. 2013, 9, 3538–3542. [Google Scholar] [CrossRef] [PubMed]
- Aqvist, J.; Medina, C.; Samuelsson, J.-E. A new method for predicting binding affinity in computer-aided drug design. Protein Eng. Des. Sel. 1994, 7, 385–391. [Google Scholar] [CrossRef] [PubMed]
- Deri, B.; Kanteev, M.; Goldfeder, M.; Lecina, D.; Guallar, V.; Adir, N.; Fishman, A. The unravelling of the complex pattern of tyrosinase inhibition. Sci. Rep. 2016, 6, 34993. [Google Scholar] [CrossRef] [PubMed] [Green Version]
- Benouis, S.; Ferkous, F.; Kraim, K.; Allali, A.; Saihi, Y. Molecular docking studies on arbutin analogues as inhibitors of tyrosinase enzyme. Synth. Rev. Sci. Technol. 2019, 25. [Google Scholar]
- Gong, Y.; Qin, X.-Y.; Zhai, Y.-Y.; Hao, H.; Lee, J.; Park, Y.-D. Inhibitory effect of hesperetin on α-glucosidase: Molecular dynamics simulation integrating inhibition kinetics. Int. J. Boil. Macromol. 2017, 101, 32–39. [Google Scholar] [CrossRef] [PubMed]
- Gou, L.; Lee, J.; Yang, J.-M.; Park, Y.-D.; Zhou, H.-M.; Zhan, Y.; Lü, Z.-R. The effect of alpha-ketoglutaric acid on tyrosinase activity and conformation: Kinetics and molecular dynamics simulation study. Int. J. Boil. Macromol. 2017, 105, 1654–1662. [Google Scholar] [CrossRef]
- Lima, C.R.; Silva, J.R.A.; Cardoso, E.D.T.C.; da Silva, E.O.; Lameira, J.; Nascimento, J.D.; Brasil, D.D.S.B.; Alves, C.N. Combined Kinetic Studies and Computational Analysis on Kojic Acid Analogs as Tyrosinase Inhibitors. Molecules 2014, 19, 9591–9605. [Google Scholar] [CrossRef] [Green Version]
- Wan, J.-X.; Lim, G.; Lee, J.; Sun, X.-B.; Gao, D.-Y.; Si, Y.-X.; Shi, X.-L.; Qian, G.-Y.; Wang, Q.; Park, Y.-D. Inhibitory effect of phloroglucinol on α-glucosidase: Kinetics and molecular dynamics simulation integration study. Int. J. Boil. Macromol. 2019, 124, 771–779. [Google Scholar] [CrossRef]
- Xiong, S.-L.; Lim, G.T.; Yin, S.-J.; Lee, J.; Si, Y.-X.; Yang, J.-M.; Park, Y.-D.; Qian, G. The inhibitory effect of pyrogallol on tyrosinase activity and structure: Integration study of inhibition kinetics with molecular dynamics simulation. Int. J. Boil. Macromol. 2019, 121, 463–471. [Google Scholar] [CrossRef] [PubMed]
- Deeth, R.J.; Diedrich, C. Structural and mechanistic insights into the oxy form of tyrosinase from molecular dynamics simulations. JBIC J. Boil. Inorg. Chem. 2009, 15, 117–129. [Google Scholar] [CrossRef] [PubMed]
- Goldfeder, M.; Kanteev, M.; Isaschar-Ovdat, S.; Adir, N.; Fishman, A. Determination of tyrosinase substrate-binding modes reveals mechanistic differences between type-3 copper proteins. Nat. Commun. 2014, 5, 4505. [Google Scholar] [CrossRef]
- Chen, J.; Yu, X.; Huang, Y. Inhibitory mechanisms of glabridin on tyrosinase. Spectrochim. Acta Part A Mol. Biomol. Spectrosc. 2016, 168, 111–117. [Google Scholar] [CrossRef]
- Ii, K.L.Y.; Kassouf, C.; Dolinska, M.B.; Anderson, D.E.; Sergeev, Y.V. Human Tyrosinase: Temperature-Dependent Kinetics of Oxidase Activity. Int. J. Mol. Sci. 2020, 21, 895. [Google Scholar] [CrossRef] [Green Version]
- Huang, X.-X.; Yan, Z.-Y.; Liu, S.; Wang, X.-B.; Song, S. Investigation of chemical constituents of safflower and their tyrosinase inhibitory activity. J. Asian Nat. Prod. Res. 2018, 21, 248–256. [Google Scholar] [CrossRef]
- Nokinsee, D.; Shank, L.; Lee, V.S.; Nimmanpipug, P. Estimation of Inhibitory Effect against Tyrosinase Activity through Homology Modeling and Molecular Docking. Enzym. Res. 2015, 2015, 1–12. [Google Scholar] [CrossRef] [Green Version]
- Espín, J.C.; Wichers, H.J. Slow-Binding Inhibition of Mushroom (Agaricusbisporus) Tyrosinase Isoforms by Tropolone. J. Agric. Food Chem. 1999, 47, 2638–2644. [Google Scholar] [CrossRef]
- Ismaya, W.T.; Rozeboom, H.J.; Weijn, A.; Mes, J.J.; Fusetti, F.; Wichers, H.J.; Dijkstra, B.W. Crystal Structure ofAgaricus bisporus Mushroom Tyrosinase: Identity of the Tetramer Subunits and Interaction with Tropolone. Biochemistry 2011, 50, 5477–5486. [Google Scholar] [CrossRef] [Green Version]
- da Silva, A.P.; Silva, N.D.F.; Andrade, E.H.D.A.; Gratieri, T.; Setzer, W.N.; Maia, J.G.S.; da Silva, J. Tyrosinase inhibitory activity, molecular docking studies and antioxidant potential of chemotypes of Lippia origanoides (Verbenaceae) essential oils. PLoS ONE 2017, 12, e0175598. [Google Scholar] [CrossRef]
- Si, Y.-X.; Yin, S.-J.; Park, D.; Chung, H.Y.; Yan, L.; Lü, Z.-R.; Zhou, H.-M.; Yang, J.-M.; Qian, G.-Y.; Park, Y.-D. Tyrosinase inhibition by isophthalic acid: Kinetics and computational simulation. Int. J. Boil. Macromol. 2011, 48, 700–704. [Google Scholar] [CrossRef] [PubMed]
- Matoba, Y.; Kihara, S.; Bando, N.; Yoshitsu, H.; Sakaguchi, M.; Kayama, K.; Yanagisawa, S.; Ogura, T.; Sugiyama, M. Catalytic mechanism of the tyrosinase reaction toward the Tyr98 residue in the caddie protein. PLoS Boil. 2018, 16, e3000077. [Google Scholar] [CrossRef] [PubMed]
- Monzani, E.; Quinti, L.; Perotti, A.; Casella, L.; Gullotti, M.; Randaccio, L.; Geremia, S.; Nardin, G.; Faleschini, P.; Tabbi’, G. Tyrosinase Models. Synthesis, Structure, Catechol Oxidase Activity, and Phenol Monooxygenase Activity of a Dinuclear Copper Complex Derived from a Triamino Pentabenzimidazole Ligand. Inorg. Chem. 1998, 37, 553–562. [Google Scholar] [CrossRef]
- Persson, I.; Persson, P.; Sandström, M.; Ullström, A.-S. Structure of Jahn–Teller distorted solvated copper(ii) ions in solution, and in solids with apparently regular octahedral coordination geometry. J. Chem. Soc. Dalton Trans. 2002, 1256. [Google Scholar] [CrossRef]
- Rulıisek, L.; Vondrášek, J. Coordination geometries of selected transition metal ions (Co2+, Ni2+, Cu2+, Zn2+, Cd2+, and Hg2+) in metalloproteins. J. Inorg. Biochem. 1998, 71, 115–127. [Google Scholar] [CrossRef]
- Orio, M.; Bochot, C.; Dubois, C.; Gellon, G.; Hardré, R.; Jamet, H.; Luneau, D.; Philouze, C.; Reglier, M.; Serratrice, G.; et al. The Versatile Binding Mode of Transition-State Analogue Inhibitors of Tyrosinase towards Dicopper (II) Model Complexes: Experimental and Theoretical Investigations. Chem. A Eur. J. 2011, 17, 13482–13494. [Google Scholar] [CrossRef]
- Bochot, C.; Gouron, A.; Bubacco, L.; Milet, A.; Philouze, C.; Reglier, M.; Serratrice, G.; Jamet, H.; Belle, C. Probing kojic acid binding to tyrosinase enzyme: Insights from a model complex and QM/MM calculations. Chem. Commun. 2014, 50, 308–310. [Google Scholar] [CrossRef]
- Zou, C.; Huang, W.; Zhao, G.K.; Wan, X.; Hu, X.; Jin, Y.; Li, J.; Liu, J. Determination of the Bridging Ligand in the Active Site of Tyrosinase. Molecules 2017, 22, 1836. [Google Scholar] [CrossRef] [Green Version]
- Nomura, M.; Yamaguchi, T. Concentration dependence of EXAFS and XANES of copper (II) perchlorate aqueous solution: Comparison of solute structure in liquid and glassy states. J. Phys. Chem. 1988, 92, 6157–6160. [Google Scholar] [CrossRef]
- Murcko, M.A. Computational Methods to Predict Binding Free Energy in Ligand-Receptor Complexes. J. Med. Chem. 1995, 38, 4953–4967. [Google Scholar] [CrossRef]
- Kirkwood, J.G. Statistical Mechanics of Fluid Mixtures. J. Chem. Phys. 1935, 3, 300. [Google Scholar] [CrossRef]
- Zwanzig, R.W. High? Temperature Equation of State by a Perturbation Method. I. Nonpolar Gases. J. Chem. Phys. 1954, 22, 1420. [Google Scholar] [CrossRef]
- Kitchen, D.; Decornez, H.; Furr, J.R.; Bajorath, J. Docking and scoring in virtual screening for drug discovery: Methods and applications. Nat. Rev. Drug Discov. 2004, 3, 935–949. [Google Scholar] [CrossRef] [PubMed]
- Amaro, R.E.; Baron, R.; McCammon, J.A. An improved relaxed complex scheme for receptor flexibility in computer-aided drug design. J. Comput. Mol. Des. 2008, 22, 693–705. [Google Scholar] [CrossRef] [PubMed] [Green Version]
- Shoichet, B.K.; McGovern, S.L.; Wei, B.; Irwin, J.J. Lead discovery using molecular docking. Curr. Opin. Chem. Boil. 2002, 6, 439–446. [Google Scholar] [CrossRef]
- Genheden, S.; Ryde, U. The MM/PBSA and MM/GBSA methods to estimate ligand-binding affinities. Expert Opin. Drug Discov. 2015, 10, 449–461. [Google Scholar] [CrossRef]
- de Ruiter, A.; Oostenbrink, C. Free energy calculations of protein–ligand interactions. Curr. Opin. Chem. Boil. 2011, 15, 547–552. [Google Scholar] [CrossRef]
- Christ, C.D.; Mark, A.E.; van Gunsteren, W.F. Basic ingredients of free energy calculations: A review. J. Comput. Chem. 2009, 31, 1569–1582. [Google Scholar] [CrossRef]
- Hansen, N.; van Gunsteren, W.F. Practical Aspects of Free-Energy Calculations: A Review. J. Chem. Theory Comput. 2014, 10, 2632–2647. [Google Scholar] [CrossRef]
- Mobley, D.L.; Dill, K.A. Binding of Small-Molecule Ligands to Proteins: “What You See” Is Not Always “What You Get”. Structure 2009, 17, 489–498. [Google Scholar] [CrossRef] [Green Version]
- Aqvist, J.; Luzhkov, V.B.; Brandsdal, B.-O. Ligand Binding Affinities from MD Simulations. Accounts Chem. Res. 2002, 35, 358–365. [Google Scholar] [CrossRef] [PubMed]
- Brückner, S.; Boresch, S. Efficiency of alchemical free energy simulations. I. A practical comparison of the exponential formula, thermodynamic integration, and Bennett’s acceptance ratio method. J. Comput. Chem. 2010, 32, 1303–1319. [Google Scholar] [CrossRef]
- Tofoleanu, F.; Lee, J.; Pickard, F.C.; König, G.; Huang, J.; Baek, M.; Seok, C.; Brooks, B.R. Absolute binding free energies for octa-acids and guests in SAMPL5. J. Comput. Mol. Des. 2016, 31, 107–118. [Google Scholar] [CrossRef] [PubMed]
- de Alencar, N.A.N.; Sousa, P.R.M.; Silva, J.R.A.; Lameira, J.; Alves, C.N.; Martí, S.; Moliner, V. Computational Analysis of Human OGA Structure in Complex with PUGNAc and NAG-Thiazoline Derivatives. J. Chem. Inf. Model. 2012, 52, 2775–2783. [Google Scholar] [CrossRef] [Green Version]
- Chen, J.; Wang, R.; Taussig, M.; Houk, K.N. Quantitative Calculations of Antibody−Antigen Binding: Steroid−DB3 Binding Energies by the Linear Interaction Energy Method. J. Org. Chem. 2001, 66, 3021–3026. [Google Scholar] [CrossRef] [PubMed]
- Ljungberg, K.B.; Marelius, J.; Musil, D.; Svensson, P.; Norden, B.; Aqvist, J. Computational modelling of inhibitor binding to human thrombin. Eur. J. Pharm. Sci. 2001, 12, 441–446. [Google Scholar] [CrossRef]
- Hansson, T.; Marelius, J.; Aqvist, J. Ligand binding affinity prediction by linear interaction energy methods. J. Comput. Mol. Des. 1998, 12, 27–35. [Google Scholar] [CrossRef]
- Maghsoudi, S.; Adibi, H.; Hamzeh, M.; Ashrafi-Kooshk, M.R.; Rezaei-Tavirani, M.; Khodarahmi, R. Kinetic of mushroom tyrosinase inhibition by benzaldehyde derivatives. J. Rep. Pharm. Sci. 2013, 2, 156–164. [Google Scholar]
- Kubo, I.; Chen, Q.-X.; Nihei, K.-I.; Calderón, J.S.; Cespedes-Acuña, C.L. Tyrosinase Inhibition Kinetics of Anisic Acid. Z. Naturforschung C 2003, 58, 713–718. [Google Scholar] [CrossRef]
- Smith, P.E.; van Gunsteren, W.F. When Are Free Energy Components Meaningful? J. Phys. Chem. 1994, 98, 13735–13740. [Google Scholar] [CrossRef]
- Mark, A.E.; van Gunsteren, W.F. Decomposition of the Free Energy of a System in Terms of Specific Interactions. J. Mol. Boil. 1994, 240, 167–176. [Google Scholar] [CrossRef]
- Yin, S.-J.; Si, Y.-X.; Qian, G.-Y. Inhibitory Effect of Phthalic Acid on Tyrosinase: The Mixed-Type Inhibition and Docking Simulations. Enzym. Res. 2011, 2011, 1–7. [Google Scholar] [CrossRef]
- Muñoz-Muñoz, J.L.; Garcia-Molina, F.; Varón, R.; Garcia-Ruiz, P.A.; Tudela, J.; Garcia-Canovas, F.; Rodriguez-Lopez, J.N. Suicide inactivation of the diphenolase and monophenolase activities of tyrosinase. IUBMB Life 2010, 62, 539–547. [Google Scholar] [CrossRef] [PubMed]
- Khatib, S.; Nerya, O.; Musa, R.; Shmuel, M.; Tamir, S.; Vaya, J. Chalcones as potent tyrosinase inhibitors: The importance of a 2,4-substituted resorcinol moiety. Bioorganic Med. Chem. 2005, 13, 433–441. [Google Scholar] [CrossRef] [PubMed]
- Carlsson, J.; Aqvist, J. Calculations of solute and solvent entropies from molecular dynamics simulations. Phys. Chem. Chem. Phys. 2006, 8, 5385–5395. [Google Scholar] [CrossRef]
- Thomsen, R.; Christensen, M.H. MolDock: A New Technique for High-Accuracy Molecular Docking. J. Med. Chem. 2006, 49, 3315–3321. [Google Scholar] [CrossRef] [PubMed]
- MarvinSketch (Version 17.27, Calculation Module Developed by ChemAxon). Available online: https://chemaxon.com/products/marvin (accessed on 11 June 2020).
- Stewart, J.J.P. Optimization of parameters for semiempirical methods V: Modification of NDDO approximations and application to 70 elements. J. Mol. Model. 2007, 13, 1173–1213. [Google Scholar] [CrossRef] [Green Version]
- Frisch, M.J.; Trucks, G.W.; Schlegel, H.B.; Scuseria, G.E.; Robb, M.A.; Cheeseman, J.R.; Scalmani, G.; Barone, V.; Mennucci, B.; Petersson, G.A.; et al. Gaussian 09; Gaussian, Inc.: Wallingford, CT, USA, 2009. [Google Scholar]
- Marelius, J.; Kolmodin, K.; Feierberg, I.; Aqvist, J. Q: A molecular dynamics program for free energy calculations and empirical valence bond simulations in biomolecular systems. J. Mol. Graph. Model. 1998, 16, 213–225. [Google Scholar] [CrossRef]
- Jorgensen, W.L.; Maxwell, D.S.; Tirado-Rives, J. Development and Testing of the OPLS All-Atom Force Field on Conformational Energetics and Properties of Organic Liquids. J. Am. Chem. Soc. 1996, 118, 11225–11236. [Google Scholar] [CrossRef]
- Jorgensen, W.L.; Chandrasekhar, J.; Madura, J.; Impey, R.W.; Klein, M.L. Comparison of simple potential functions for simulating liquid water. J. Chem. Phys. 1983, 79, 926–935. [Google Scholar] [CrossRef]
- Schrödinger Schrödinger Release 2020-1: MacroModel; Schrödinger LLC: New York, NY, USA, 2020.
- Li, H.; Robertson, A.D.; Jensen, J.H. Very fast empirical prediction and rationalization of protein pKa values. Proteins Struct. Funct. Bioinform. 2005, 61, 704–721. [Google Scholar] [CrossRef] [PubMed]
- Dolinsky, T.J.; Nielsen, J.E.; McCammon, J.A.; Baker, N.A. PDB2PQR: An automated pipeline for the setup of Poisson–Boltzmann electrostatics calculations. Nucleic Acids Res. 2004, 32, 665–667. [Google Scholar] [CrossRef]
- King, G.; Warshel, A. A surface constrained all-atom solvent model for effective simulations of polar solutions. J. Chem. Phys. 1989, 91, 3647–3661. [Google Scholar] [CrossRef]
- Díaz, L.; Bujons, J.; Delgado, A.; Gutiérrez-De-Terán, H.; Aqvist, J. Computational Prediction of Structure−Activity Relationships for the Binding of Aminocyclitols to β-Glucocerebrosidase. J. Chem. Inf. Model. 2011, 51, 601–611. [Google Scholar] [CrossRef] [PubMed]
- Ryckaert, J.-P.; Ciccotti, G.; Berendsen, H.J. Numerical integration of the cartesian equations of motion of a system with constraints: Molecular dynamics of n-alkanes. J. Comput. Phys. 1977, 23, 327–341. [Google Scholar] [CrossRef] [Green Version]


| Compound | MOLDOCK | RMSD |
|---|---|---|
| l-Tyr | −89.77 | 0.22 |
| l-DOPA | −90.25 | 0.29 |
| KA | −69.26 | 0.31 |
| Inhibitor | MOLDOCK |
|---|---|
| TRO | −72.31 |
| KA | −69.26 |
| KA1 | −68.72 |
| KA2 | −67.26 |
| KA3 | −62.76 |
| KA4 | −65.45 |
| KA5 | −55.47 |
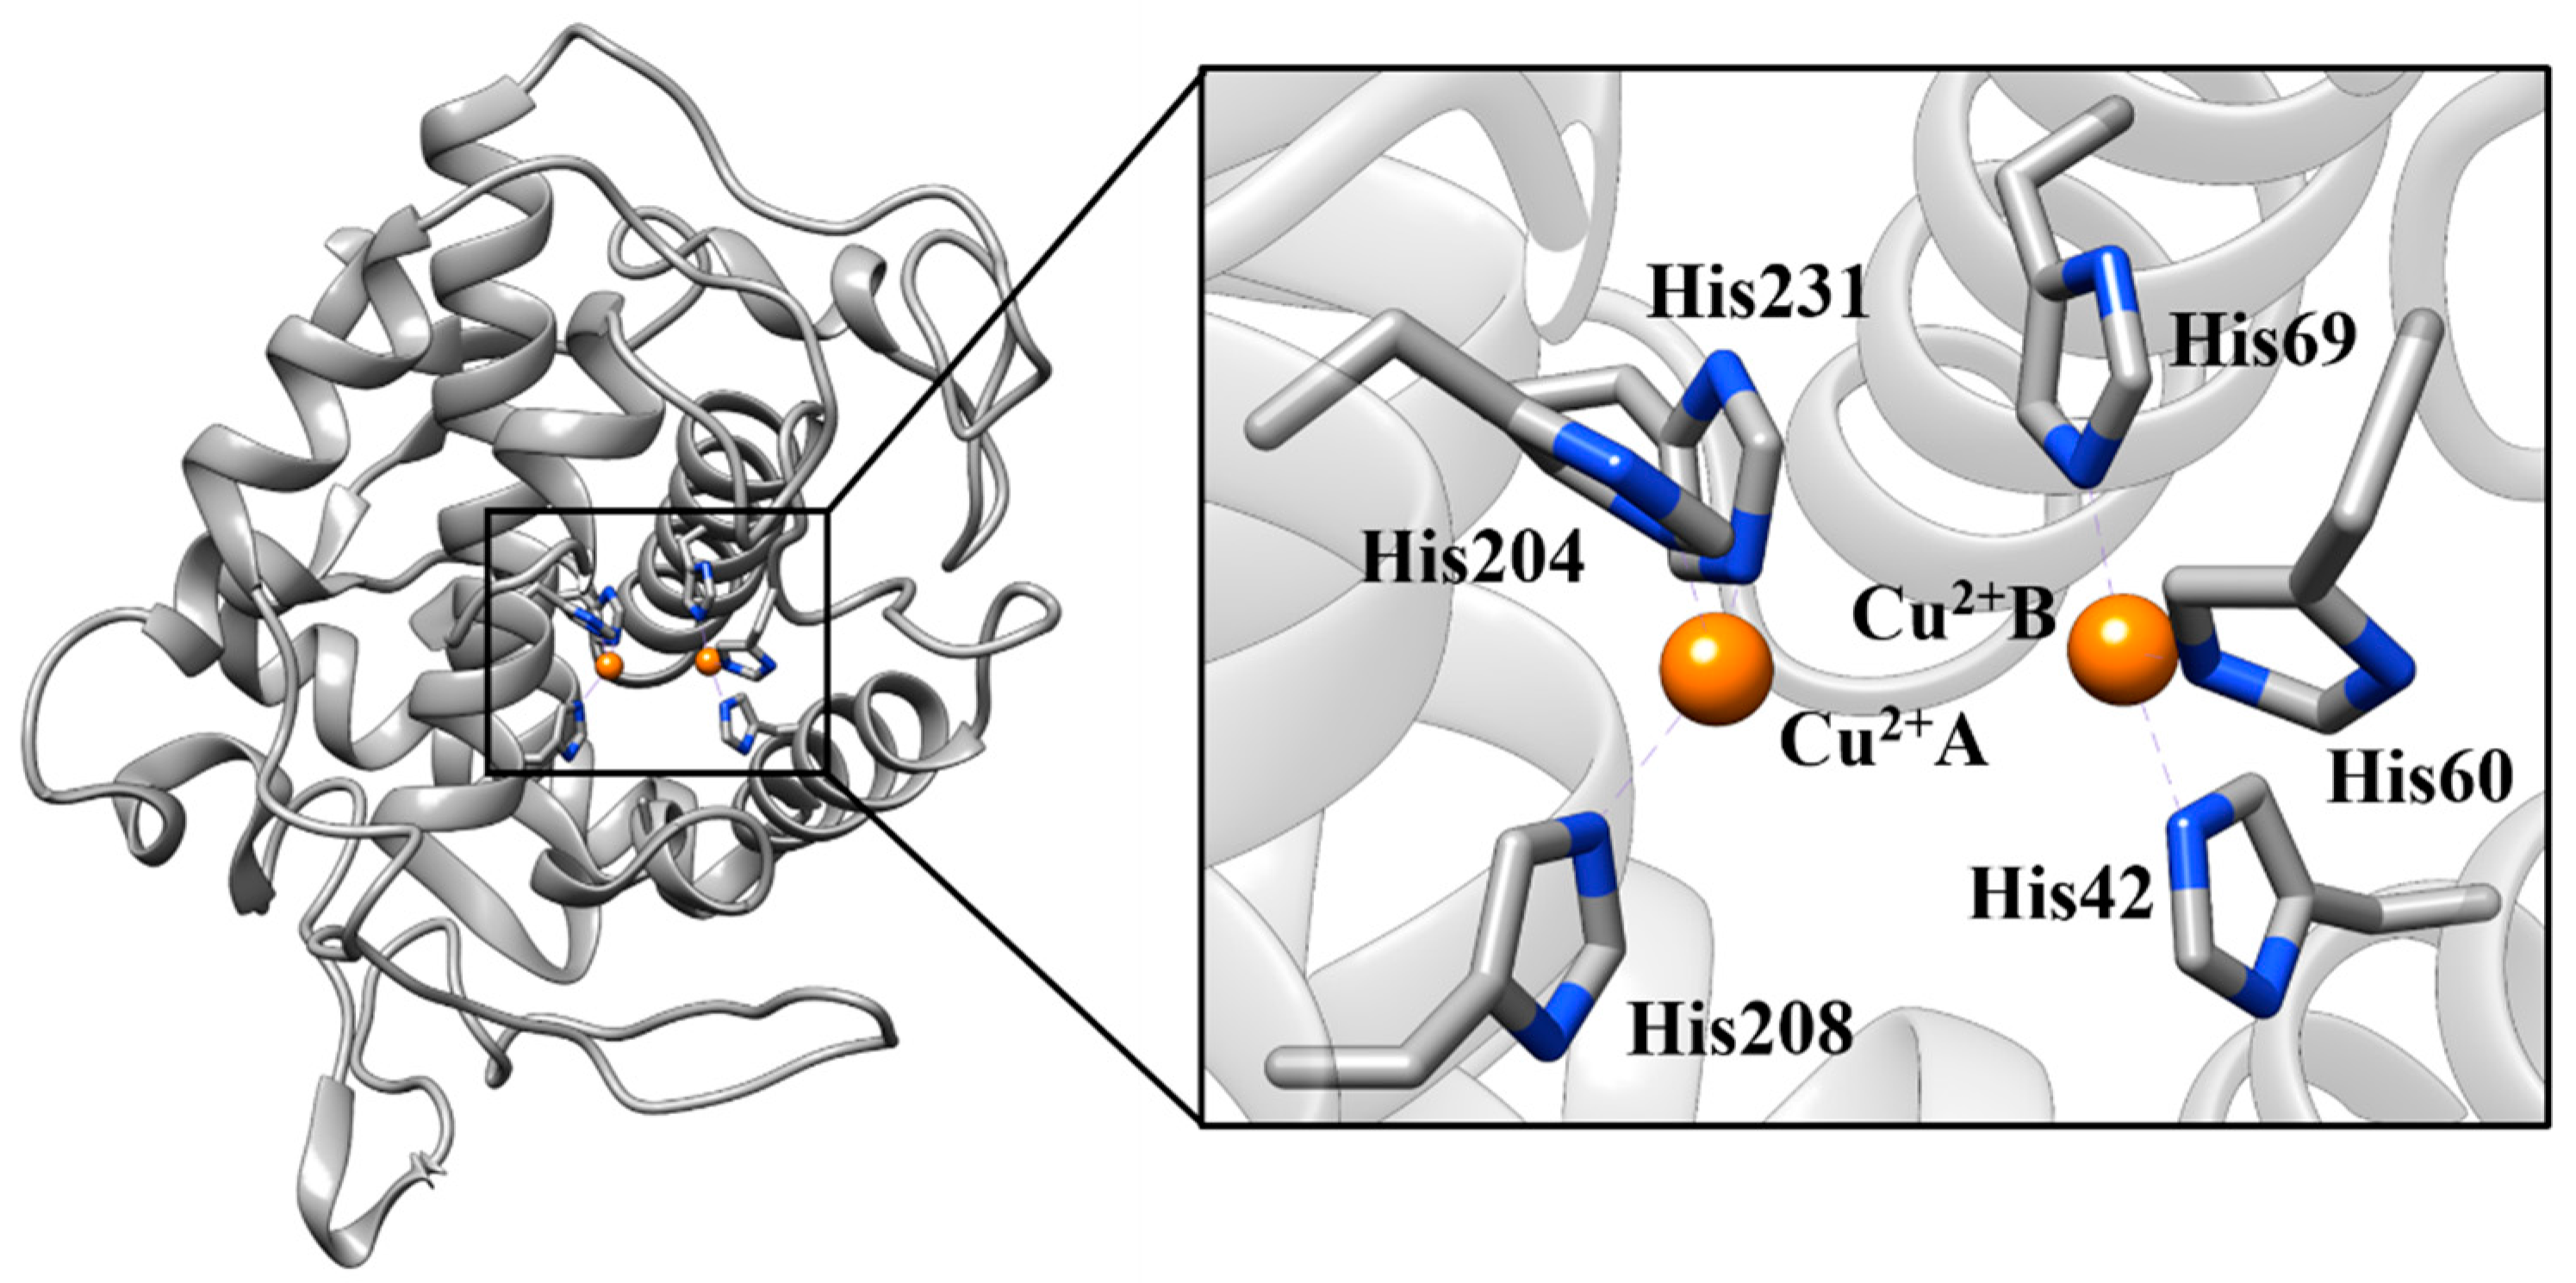
| Residue (Atom) | Ion | Experimental Distance | Average Simulated Distances |
|---|---|---|---|
| His204 (NE2) | Cu2+A | 2.09 | 2.15 ± 0.07 |
| His208 (NE2) | 2.07 | 2.30 ± 0.07 | |
| His231 (NE2) | 2.02 | 2.02 ± 0.11 | |
| WT572 (O) | 2.28 | 2.34 ± 0.07 | |
| WT613 (O) | 1.96 | 2.11 ± 0.04 | |
| WT657 (O) | 1.96 | 2.12 ± 0.03 | |
| His42 (NE2) | Cu2+B | 2.09 | 2.00 ± 0.09 |
| His60 (NE2) | 2.07 | 2.33 ± 0.06 | |
| His69 (NE2) | 2.02 | 2.01 ± 0.10 | |
| WT610 (O) | 1.96 | 2.11 ± 0.03 | |
| WT646 (O) | 1.96 | 2.12 ± 0.03 | |
| WT653 (O) | 2.28 | 2.26 ± 0.06 |
| Molecule | ΔVvdW | ΔVele | ΔGLIE1 | ΔGLIE2 | ΔGEXP |
|---|---|---|---|---|---|
| l-DOPA | −17.95 ± 0.53 | −22.93 ± 1.02 | −10.79 ± 0.32 | −11.20 ± 0.33 | |
| l-Tyr | −12.44 ± 0.37 | −20.91 ± 0.82 | −9.13 ± 0.24 | −9.47 ± 0.22 | −9.50 |
| TRO | −12.9 ± 0.19 | −15.16 ± 0.97 | −7.93 ± 0.53 | −7.60 ± 0.48 | −8.30 |
| KA | −5.68 ± 0.08 | −18.24 ± 0.26 | −7.04 ± 0.27 | −7.28 ± 0.28 | −7.46 |
| KA1 | −8.76 ± 0.30 | −11.32 ± 0.53 | −5.31 ± 0.24 | −5.51 ± 0.25 | −5.99 |
| KA2 | −12.91 ± 0.03 | −11.68 ± 0.12 | −6.17 ± 0.15 | −6.42 ± 0.15 | −5.85 |
| KA3 | −6.09 ± 0.44 | −14.19 ± 0.18 | −6.34 ± 0.80 | −5.98 ± 0.72 | −5.73 |
| KA4 | −16.68 ± 0.05 | −5.56 ± 0.10 | −4.83 ± 0.66 | −5.05 ± 0.68 | −5.24 |
| KA5 | −17.14 ± 0.10 | −3.75 ± 0.08 | −4.69 ± 0.03 | −4.53 ± 0.02 | −4.68 |
| Complex | Dummy Atom | Distance (Ligand—Cu2+) | Vele |
|---|---|---|---|
| TYRBm—l-DOPA | Cu2+A | 2.79 | −17.63 |
| Cu2+B | 4.45 | −4.16 | |
| TYRBm—l-Tyr | Cu2+A | 3.75 | −10.81 |
| Cu2+B | 4.69 | −7.39 | |
| TYRBm—TRO | Cu2+A | 2.21 | −15.04 |
| Cu2+B | 4.73 | −1.98 | |
| TYRBm—KA | Cu2+A | 5.27 | −5.70 |
| Cu2+B | 4.82 | −11.88 | |
| TYRBm—KA1 | Cu2+A | 4.56 | −9.37 |
| Cu2+B | 5.46 | −2.26 | |
| TYRBm—KA2 | Cu2+A | 3.09 | −8.59 |
| Cu2+B | 3.76 | −1.42 | |
| TYRBm—KA3 | Cu2+A | 3.71 | −9.91 |
| Cu2+B | 3.68 | −7.77 | |
| TYRBm—KA4 | Cu2+A | 3.68 | −2.50 |
| Cu2+B | 3.46 | −1.07 | |
| TYRBm—KA5 | Cu2+A | 3.59 | −5.22 |
| Cu2+B | 3.64 | −7.47 |
| Molecules | Nomenclature IUPAC | Structure 2D | Ki (Kd) |
|---|---|---|---|
| l-DOPA | (2S)-2-amino-3-(3,4-dihydroxyphenyl)propanoic acid |  | - |
| l-Tyr | (2S)-2-amino-3-(4-hydroxyphenyl)propanoic acid |  | * (0.1 µM) [45] |
| TRO | 2-Hydroxy-2,4,6-cycloheptatrien-1-one |  | 0.8 µM [58] |
| KA | 5-Hydroxy-2-(hydroxymethyl)-4H-pyran-4-one |  | 3.5 µM [45] |
| KA1 | 2,4-dihydroxybenzaldehyde |  | 41.55 µM [88] |
| KA2 | 3,4-dihydroxybenzaldehyde |  | 52.96 µM [88] |
| KA3 | 3-hydroxy-1,2-dimethyl-4(1h)-pyridone |  | 64 μM [49] |
| KA4 | 5-hydroxy-4-oxo-4h-pyran-2-carboxylic acid |  | 145 μM [49] |
| KA5 | 4-Methoxybenzaldehyde |  | 376 μM [89] |
© 2020 by the authors. Licensee MDPI, Basel, Switzerland. This article is an open access article distributed under the terms and conditions of the Creative Commons Attribution (CC BY) license (http://creativecommons.org/licenses/by/4.0/).
Share and Cite
Martins, L.S.; Lameira, J.; Kruger, H.G.; Alves, C.N.; Silva, J.R.A. Evaluating the Performance of a Non-Bonded Cu2+ Model Including Jahn−Teller Effect into the Binding of Tyrosinase Inhibitors. Int. J. Mol. Sci. 2020, 21, 4783. https://doi.org/10.3390/ijms21134783
Martins LS, Lameira J, Kruger HG, Alves CN, Silva JRA. Evaluating the Performance of a Non-Bonded Cu2+ Model Including Jahn−Teller Effect into the Binding of Tyrosinase Inhibitors. International Journal of Molecular Sciences. 2020; 21(13):4783. https://doi.org/10.3390/ijms21134783
Chicago/Turabian StyleMartins, Lucas Sousa, Jerônimo Lameira, Hendrik G. Kruger, Cláudio Nahum Alves, and José Rogério A. Silva. 2020. "Evaluating the Performance of a Non-Bonded Cu2+ Model Including Jahn−Teller Effect into the Binding of Tyrosinase Inhibitors" International Journal of Molecular Sciences 21, no. 13: 4783. https://doi.org/10.3390/ijms21134783