Changing Trends in Rainfall Extremes in the Metropolitan Area of São Paulo: Causes and Impacts
 Jose A. Marengo1*†
  Tercio Ambrizzi2†
  Lincoln M. Alves3†
  Naurinete J. C. Barreto3†
  Michelle Simões Reboita4† Andrea M. Ramos5
- 1CEMADEN, Brazilian National Center for Monitoring and Early Warning of Natural Disaster, São José dos Campos, Brazil
- 2Department of Atmospheric Sciences, IAG USP, University of São Paulo, São Paulo, Brazil
- 3CCST/INPE, Earth System Science Center/National Institute for Space Research INPE/CCST, São José dos Campos, Brazil
- 4UNIFEI, Instituto de Recursos Naturais, Universidade Federal de Itajubá, Itajubá, Brazil
- 5INMET-National Institute of Meteorology, Brasilia, Brazil
This study analyses observed trends in extreme rainfall events in the Metropolitan Area of São Paulo (MASP). Rainfall data sets with more than 60 years of record in MASP are used. In MASP, extreme rainfall events represent hydro meteorological hazards that trigger flash floods and landslides. Changes in rainfall extremes can be partly due to natural climate variability. In addition, it can also be related to global warming and/or urbanization. Total annual precipitation and the number of days with precipitation of 20 mm exhibit the largest significant increase during 1930–2019. This is better noticed during summer. This tendency is also noticed in the number of days with precipitation of 100 mm or more. Therefore, the positive trend in annual precipitation is mainly due to an increase in the frequency of extreme precipitation events. On the other hand, our analysis shows that the number of consecutive dry days increased. Though these results appear to be contradictory, they indicate an important climate change in recent times. Intense precipitation is concentrated in few days, separated by longer dry spells. The focus is on how atmospheric circulation variations are contributing to these changes. During 1960–2019 the South Atlantic Subtropical Anticyclone has intensified and slightly moved southwestward of its normal position. This change influences the transport of humidity and therefore impact precipitation. This can explain the increase in the precipitation extremes in the MASP. However, other atmospheric systems may also be important.
Introduction
Episodes of heavy rainfall and wet and dry spells impact urban and rural areas worldwide. These extremes trigger natural disasters such as floods, flash floods, or droughts. These produce significant damage to the population, particularly in developing countries (IPCC, 2012, 2013, 2014). Significant modifications in weather systems have led to changes in extremes (Giorgi et al., 2014; Diffenbaugh et al., 2017). Extremes of weather and climate affect mainly risk areas where vulnerable people live (Bouwer, 2019), like urban areas, where most of the population is concentrated. Globally, more people live in urban areas (54%) than in rural ones, and by 2030, it is projected to the world to have 41 mega-cities with 10 million inhabitants or more (UN-Habitat, 2015). This is not going to improve with urbanization and occupation of risk areas under climate change. Megacities in Latin America would be among the most affected (Vergara, 2008; Magrin et al., 2014).
Several studies have focused on changes in mean and extreme precipitation trends worldwide. These show that for the last 50–60 years, warming trends are accompanied by more heavy rainfall episodes. These trends are particularly noticed during the summer and fall seasons (e.g., Seneviratne et al., 2012; Donat et al., 2013; Ren et al., 2013; Sillmann et al., 2013; Sun et al., 2018 and references quoted in).
Southeastern Brazil is the region that host the states that most contributes to the Brazilian economy. It shows an increase in total annual rainfall and in the frequency of intense rain events above a given threshold or percentile level (Alexander et al., 2006; Haylock et al., 2006; Teixeira and Satyamurty, 2011; Donat et al., 2013; Skanski et al., 2013). Since 2015 the states in southeastern Brazil (São Paulo, Minas Gerais, Espirito Santo, and Rio de Janeiro) have experienced 1,373 events of extreme rainfall. Extreme rainfall events were defined as those with precipitation above 50 mm/h. From those, 730 were detected in the state of São Paulo (EM-DAT 2019). According to the Center for Weather Forecasts and Climate Studies of Brazil (CPTEC-INPE; G1, 2020) among the municipalities with a population above 100,000 people, more than half of rainfall peaks during the last 5 years have occurred in the state of São Paulo. A combination of heavy rainfall and high population density is a lethal recipe for floods, flash floods, and landslides, resulting in fatalities and displaced people (Ávila et al., 2016).
A number of studies have focused on rainfall extremes in the MASP (Xavier et al., 1994; Carvalho et al., 2002, 2004; Dufek and Ambrizzi, 2008; Vasconcellos and Cavalcanti, 2010; Nobre et al., 2011; Sugahara et al., 2012; Marengo et al., 2013, 2020; Silva Dias et al., 2013; Magrin et al., 2014; Obregon et al., 2014; Ramires and Mello-Thery, 2018). These studies show an increase in the seasonal and annual precipitation. They also show increase in frequency and intensity of extreme rainfall events. This has contributed to more natural hydrometeorological disasters. In addition, it has been detected a reduction in the frequency of light rain events.
Changes in rainfall extremes have been identified in many sectors of the MASP. Decadal analysis of rain extremes from the IAG USP station (see Figure 1 for its location). In the last 20 years the number of days with rainfall above 30 mm has varied between 10 and 15 days. In comparison, this number varies from 5 to 12 days in 1940–1960 (Nobre et al., 2011; Ramires and Mello-Thery, 2018). The data of the IAG USP station shows that in the city of São Paulo the number of days with rainfall >50 mm during the 1950's was almost non-existent. By 2000–2010 these events occurred between 2 and 5 times per year (Nobre et al., 2011). As for rainfall of 100 mm or above, data from the IAG USP and Mirante de Santana stations shows that they occurred three times during 1960–1980 and eight times in 2000–2018 (Marengo et al., 2020).
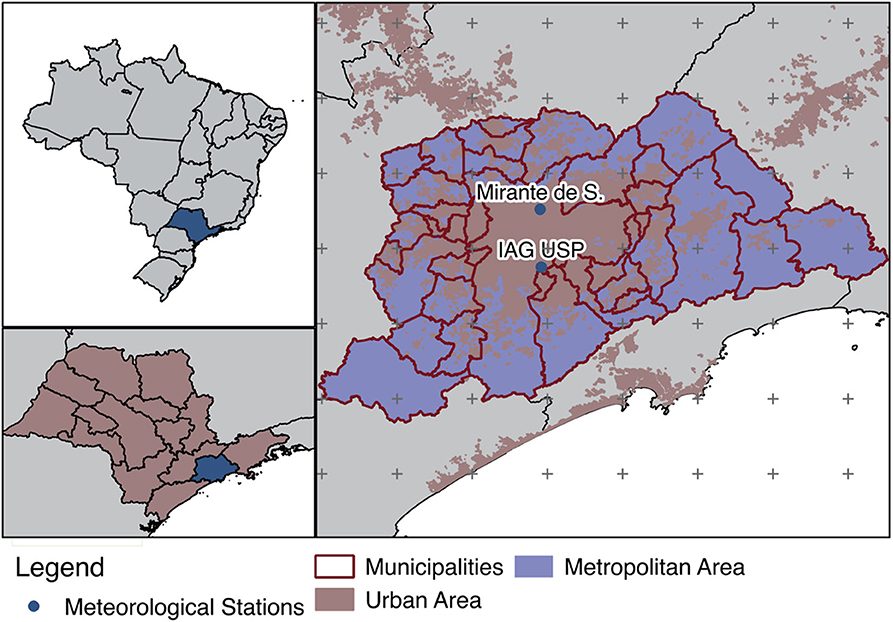
Figure 1. Location of the Metropolitan Area of São Paulo (in red) in the state of São Paulo. Location of the two meteorological stations used of this study in the MASP region are shown by blue dots.
In MASP, rainfall trends are influenced by variations and changes in major systems affecting precipitation. Among them we have changes in the intensity and position of the South Atlantic Convergence Zone (SACZ). Furthermore, we have the intensity and position of the Subtropical South Atlantic High. Another factor in MASP is the Urban Heat Island effect UHI (Vemado and Pereira Filho, 2016; Zilli et al., 2016), due to its proximity of large urban centers and topographic features. The urbanization process in the MASP has been affecting the local climate Ruv et al. (under review). The intensification of the UHI effect resulted in a local climate with a 2–3°C warming difference between urban and rural areas (Nobre et al., 2011; Barros and Lombardo, 2016; Vemado and Pereira Filho, 2016, Ruv et al. under review). According to INMET, the Mirante de Santana and IAG-USP data show warming from 1 to 1.5°C in 1998–2018 when compared to 1961–1990. Abreu et al. (2019) estimate that the observed warming trend of 1.1°C between 1955 and 2004 is largely due to increasing greenhouse gases.
The water crisis in the MASP during 2014/15 is a good example of water insecurity and vulnerability of a megacity to seasonal droughts (Marengo et al., 2015; Otto et al., 2015; Nobre et al., 2016). Previous major droughts occurred in the region in 1953/54, 1962/63, 1970/71, and 2001 (Cavalcanti and Kousky, 2002; Drumond and Ambrizzi, 2005). In all those years the summer wet season was deficient in rainfall, mainly due to a weakening of the SACZ. This is the main mechanism responsible for the region's rainfall (Nobre et al., 2016). In the drought of 1953/54, rainfall deficit prompted construction of the largest water supply system (Cantareira) used for São Paulo city (Porto et al., 2014). The 2001 drought was associated an energy crisis and risk of blackouts (Cavalcanti and Kousky, 2002). During the 2014 summer, as in the other drought events, a complete absence of SACZ episodes was observed. This was due to a weak moisture transport that usually occurs from the tropical north Atlantic, crossing the Amazon Basin, to southeastern Brazil. This, together with a record maximum temperature worsened the water crisis (Nobre et al., 2016).
CMIP5 and regional climate change projections show an expected warming between 2 and 3°C in the MASP for the RCP4.5 and 8.5. It is projected a doubling of the number of days with heavy precipitation by 2,100 (Chou et al., 2014; Rosenzweig et al., 2018). Most of the natural disasters in Brazil are related to intense rainfall. According to CEPED UFSC (2013), the highest mortality rate in MASP is due either floods or landslides. In the last decade, more than half a million people became homeless because of these events.
In this study we provide updated information on trends in total and extreme rainfall events over the MASP until 2019. This is done through the analysis of different extreme rainfall indices. Observational data from two stations is available with more than 60 years of information. From the analysis of trends in rainfall extremes there were identify periods when rainfall regime changed. To investigate possible causes of trends, we investigate variations in the large-scale circulation in the South Atlantic sector. Details on consequences of rainfall extremes on natural disasters and impacts in vulnerable people living in risk areas are discussed in other studies (Nobre et al., 2011; IPCC, 2012; CEPED UFSC, 2013; Marengo et al., 2020).
Methodology and Data
The Megacity of São Paulo
MASP is located in south-eastern Brazil. It is the third-largest urban conglomerate in the world, with 39 municipalities totalling an area of 7,944 km2. São Paulo city is the largest in terms of population and economic development (UN-Habitat, 2016). In 1872, it had just over 31 thousand inhabitants; in 1920, its population was already 580,000. Population of around 20 million inhabitants (Instituto Brasileiro de Geografía e Estatística, 2011). More than 11 million people living in the city of São Paulo in an area of 1,530 km2 (Figure 1). São Paulo is the leading state on climate adaptation strategies in Brazil (Simões et al., 2017). As pointed out by Di Giulio et al. (2018), São Paulo struggles with land-use planning and curbing CO2 emissions as well as preventing and responding to climate-related impacts.
Data
The data set used in here is the daily rainfall data from the Água Funda meteorological station of the Institute of Astronomy, Geophysics, and Atmospheric Sciences (IAG) from the University of São Paulo-USP (23.65°S, 46.61°W, 800 m above sea level, Figure 1). The second station is Mirante de Santana station from the National Institute for Meteorology (INMET; 23°29′ S 46°37′ W, 792 m above sea level, Figure 1). The Agua Funda station is located in the middle of an urban park separated from built urban areas. Mirante de Santana station in the urban area being representative of local climate of São Paulo city.
Concerning Água Funda meteorological station (hereafter IAG-USP), data is available since 1931. This data has been used in several studies (Nobre et al., 2011; Marengo et al., 2013, 2020; Silva Dias et al., 2013). About the homogeneity of the IAG-USP data, Sugahara et al. (2012) indicated that the data may have been contaminated by instrument replacement in 1958. However, there was no need for correction after the middle 1950's. Obregon et al. (2014) show that there is no evidence of “jumps” in rainfall from the middle 1950's, observing instead oscillations that can be associated to the Pacific Decadal Oscillation PDO in the 1970–1980 period, and other variations during 1955–1965 and 1980–1995 that they discuss in meteorological terms. The period of data for IAG-USP is from 1931 to 2019 and from Mirante de Santana is from 1960 to 2019.
Climate Indices
The indices used to define long extreme rainfall events in this study are defined by Frich et al. (2002):
• Annual total precipitation (PRCPTOT): total annual accumulated precipitation (in mm),
• Consecutive dry days (CDD): the annual maximum number of consecutive days when daily precipitation was <1 mm (in days),
• Maximum 5 days precipitation (Rx5D): the annual maximum consecutive 5 days precipitation total that could lead to flooding (in mm),
• Extreme rainfall (R95P): the annual total PRCPTOT, when precipitation is >95th percentile of the 1961–1990 daily precipitation distribution (in mm),
• Wet days (R10, R20, R25, R30, R50, R80, R100): the number of days in a year with precipitation >10, 20, 25, 30, 50, 80, and 100 mm, respectively.
In addition, we defined other indices:
• Light rain (R1): the number of days with precipitation between 0.1 and 1 mm.
• Light rain (R5): the number of days with precipitation between 1 and 5 mm.
Our focus is from light rain (R1, R5) to heavy rainfall events (R50, R100, R95P, Rx5D) in the MASP. CDD is an indicator of dry spells that eventually could generate drought. Rx5D represents accumulated rainfall for 5 days that could potentially trigger landslides and flash floods.
We used non-parametric statistical tests to assess the significance of some metrics at the 90% level. The linear trend was assessed using the Mann–Kendall (MK) test (Kendall, 1975; Mann, 2008). This is done to compare the sample means using the Wilcoxon's Rank Sum test was used. The Kruskal-Wallis test was used to compare the sample variances. Non-parametric tests were used because such tests do not require a normality assumption.
Regional Atmospheric Circulation Characteristics
The UHI is an important factor for heavy rain during the rainy season (Vemado and Pereira Filho, 2016). In addition, changes in the atmospheric circulation can also contribute to variations moisture transport and rainfall in southeastern Brazil. Then, one hypothesis is that the South Atlantic Subtropical Anticyclone (SASA) can experience anomalies in its climatological position and intensity. This in turn can intensify the moisture transport to MASP. To investigate this hypothesis, we applied the methodology from Reboita et al. (2019) to identify the SASA central position in each month of the year. Monthly mean sea level pressure data comes from the ERA-20C (Poli et al., 2016) and ERA5 reanalyses from the European Center for Medium-Range Weather Forecast (ECMWF). The spatial resolution of 1° lat-lon. The analyzed period was from 1900 to 2009 for ERA-20C and from 1979 to 2019 for ERA5. The position of the core pressure SASA was identified using the nearest neighbor technique. This method compares a grid point with those around it to find the highest-pressure value than the neighbors. This methodology was applied to the monthly data in the area of 40° S−20° S e 42° W−12° E. The final result is the latitude, longitude, and pressure of the grid point with the highest-pressure value. The detailed explanation of the methodology is presented in Reboita et al. (2019). We compared time series of extreme rainfall indices and the SASA position and intensity. This is done to find a possible correlation among them.
Results: Observed Rainfall Extremes in MASP
Observed trends of rainfall extreme indices at the IAG-USP and the Mirante de Santana stations are shown in Figure 2. This analysis has been updated until 2019. Total precipitation in both stations has been increasing steadily, with a pronounced interannual variability. The rate is +53 mm/10 year at Mirante de Santana and at IAG-USP the change is about +55 mm/10 year, and those trends reach statistical significance as shown by the Mann-Kendall test. CDD shows almost no significant change since the beginning of the records in both stations. However, in the last 20 years CDD featured positive trends (Figures 2A,B), i.e., the number of consecutive dry days is increasing, from 30 in 200 to 50 between 2019. R95p and Rx5D (Figures 2C,D) show a steady increase, being statistically significant for R95p. Changes in CDD and Rx5D are not significant in both stations. We found that the most significant linear trends were for increases in R95P until 2019. One conclusion from Figure 2 is that there are signals of change in the rainfall pattern. The increase in total precipitation is accompanied by more intense rainfall episodes. These heavy precipitation events occur with long dry spells in between tendencies in rainfall extremes at Mirante de Santana and IAG-USP stations are shown in Figures 3A–F. The number of days with precipitation from 10 to 50 mm (R10 to R50) has been increasing. The largest values are shown after 2000 in both Mirante de Santana and IAG-USP. The number of days with R10 at Mirante de Santana and IAG-USP varied from 40 to 60 during the last 20 years. It shows a positive significant trend. R20 and R25 also show positive trends (statistically non-significant) and with a strong interannual variability. The figure shows a positive non-significant trend in R30, and during the last 20 years, it has varied between 10 and 20 days, as compared to 5 to 10 days in 1940–1960. There is a positive and significant trend in R50 (Figures 3B,E) but perhaps the most important feature is the relatively large number of days with R80 and R100 from 2000 to 2019 as compared to the 1960's (Figures 3C,F). It can be concluded that all climate indices had increasing trend across the whole period of study. The results also have shown non-significant trends for most of the climate indices at recent period (2000–2019), despite rising trends observed in RX5day for IAG-USP and R80 for Mirante de Santana. Overall these trend results reveal the increasing tendency in heavy precipitation.
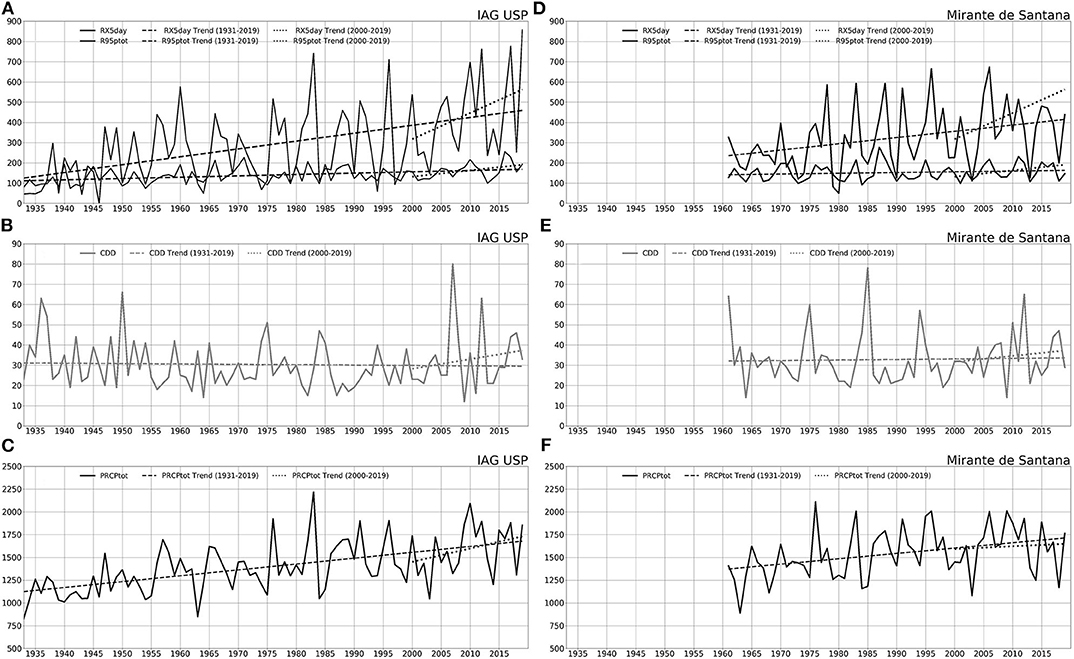
Figure 2. Time series of heavy precipitation (R95P); 5 days accumulated precipitation (R5xD); consecutive dry days (CDD) and total annual precipitation (PRECTOT) during 1931–2019 for IAG-USP (A–C) and Mirante de Santana during 1961–2019 (D–F). Linear trends are shown with full (since 1961) and broken (2000–2019) lines.
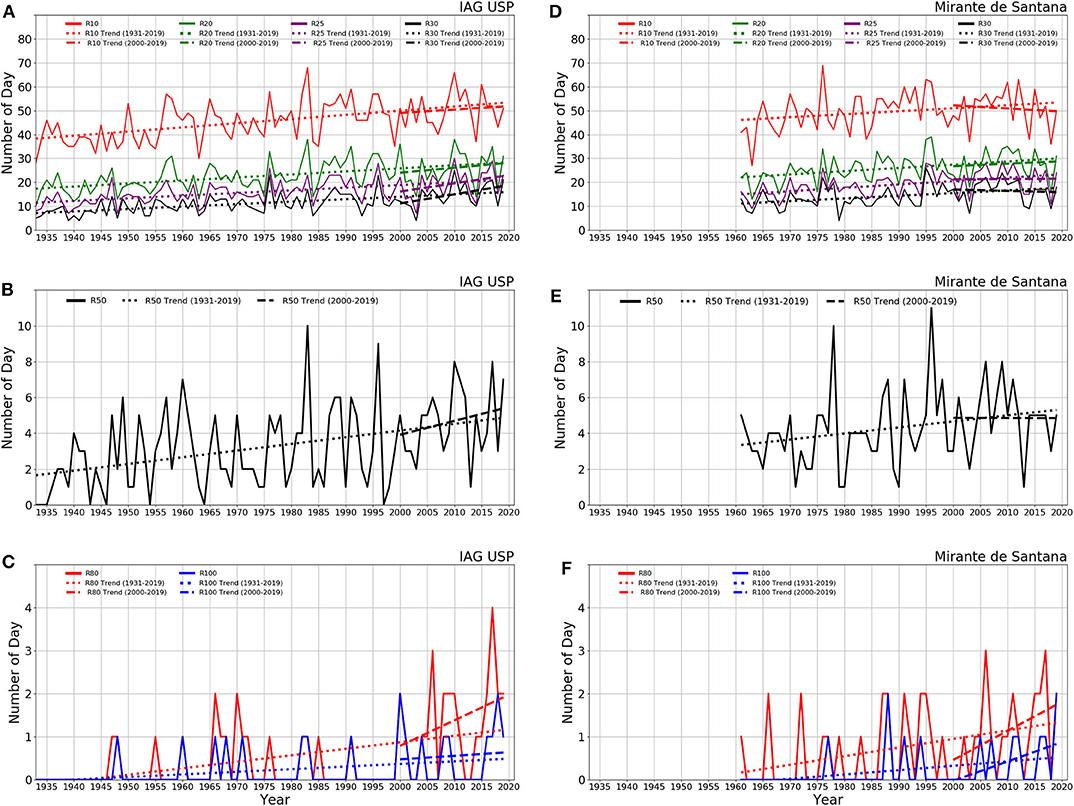
Figure 3. Time series of numbers of days with precipitation above 10 mm (R10), 20 mm (R20), 25 mm (R25), 30 mm (R30), 50 mm (R50), 80 mm (R80), and 100 mm (R100) for IAG-USP during 1931–2019 (A–C) and Mirante de Santana during 1961–2018 (D–F). Linear trends are shown with full (since 1961) and broken (2000–2019) lines. Linear trends are shown with full (since 1961) and broken (2000–2019) lines.
At the decadal level, there is a tendency for a reduction in number of days with light rain (R1, R5) in the last 20 years. Figures 4A–F shows decadal accumulations of CDD, Rx5day and R95p, as well as the number of days with rainfall exceeding 10, 20, 25, 30, 50, 80, and 100 mm in both stations in São Paulo. The mean number of days with CDD and Rx5d has not changed along the last six decades, but there is a strong year-to-year variability. An analysis performed by INMET with the Mirante de Santana station showed that in the 1960's there were periods with 15 days with no rain, and by 2012 this number reached 51 days. During the water crisis in the summer of 2014, there was a period of 47 days with no rain in the MASP during January-February 2014, with a heatwave with 26 consecutive days with temperatures above 30°C in February 2014 (Nobre et al., 2016). R95P has increased most particularly since the 1980's. The number of days with 50 mm or more has gradually increased. It varies from 52 days in 1960–1980 to 88 in 2000–2019 at the IAG USP and from 71 days in 1960–1980 to 94 in 2000–2019 at Mirante de Santana. Daily rainfall above 100 mm/day has the potential to trigger natural disasters.
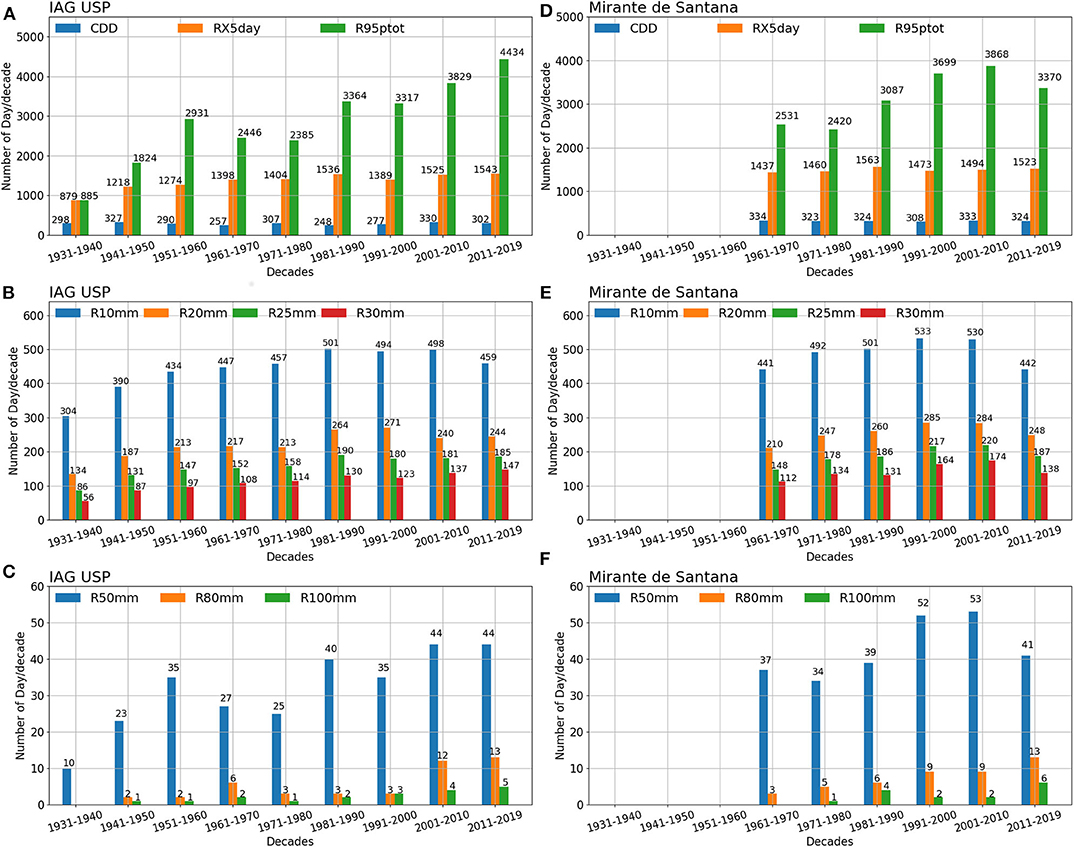
Figure 4. Decadal accumulation of CDD (consecutive dry days), heavy precipitation (R95P), and 5 days accumulated precipitation (R5xD) for (A) IAG-USP and (D) Mirante de Santana; for numbers of days with precipitation above 10 mm (R10), 20 mm (R20), 25 mm (R25), and 30 mm (R30) for (B) IAG-USP and (E) Mirante de Santana; and for number of days with precipitation above 50 mm (R50), 80 mm (R80), and 100 mm (R100) for (C) IAG-USP, and (F) Mirante de Santana, with number showing the corresponding decadal numerical values.
As shown in Figures 5A,E there is a reduction on the number of days with light rain (5 mm) during the last 20 years. This is better observed during DJF. At IAG-USP, the number of days with precipitation above 5 mm has decreased in, from 310 in the 1990's to 260 after 2010. In Mirante de Santana the reduction is more pronounced, with 310 in the 1990 to 250 after 2010. According to INMET, relative humidity in Mirante de Santana has been reduced by about 6% from 1960 to 2010. This is because the vegetation coverage is lower than in IAG-USP, suggesting impacts of urbanization. In addition, changes in the frequency of light rain have been linked to warming MASP (Conti, 1979; Tarifa and Armani, 2001; Pereira Filho et al., 2007).
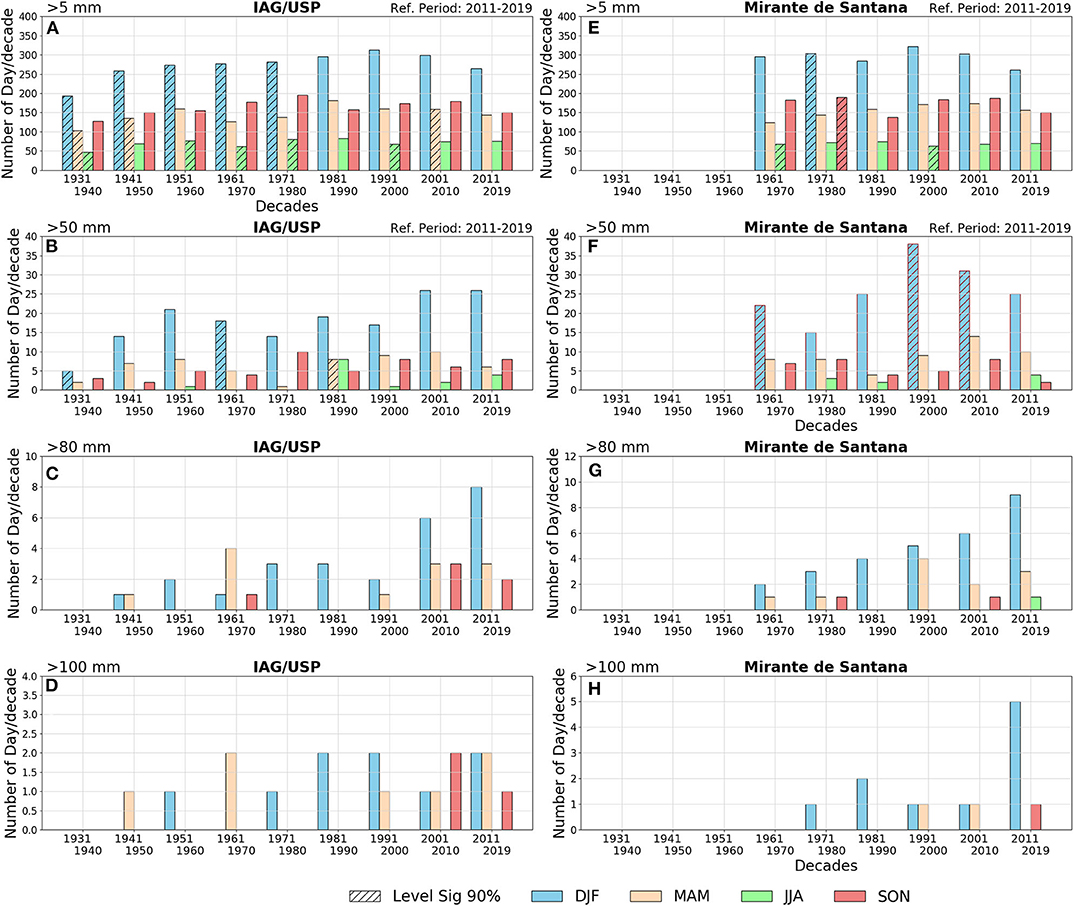
Figure 5. Decadal accumulation of above 5 mm for fore the four seasons of the year in (A) IAG-USP and (E) Mirante de Santana; for numbers of days with precipitation above 50 mm for (B) IAG-USP and (F) Mirante de Santana; for number of days with precipitation above 80 mm (C) IAG-USP and (G) Mirante de Santana, and number of days with precipitation above 80 mm (D) IAG-USP and (H) Mirante.
At seasonal level (Figures 5B–D,F–H), the increase in the number of days with rainfall above 50, 80, and 100 mm is more intense in summer DJF. For rainfall above 50 mm in IAG-USP, in DJF there were identified 26 events in 1960–1980 and 11 events in 2001–2019. In Mirante de Santana, these numbers varied between 9 in 1980–2000, and 53 after 2000. Changes in the number of days with rain above 50 and 100 mm have been identified in the two transition seasons MAM and SON, after the 1980's.
There is an observed increase in number of days with precipitation above 80 and 100 mm in the last two decades. These changes are statistically significant at 95% level. Marengo et al. (2020) show that for both stations the number of days with rainfall above 80 and 100 mm has increased by a factor of four during the last 20 years as compared to 1940–1960. Between 1960 and 1980 the number of days with precipitation above 80/100 mm was 9/3 at IAG USP and 8/1 for Mirante de Santana. For the period 2001–2019, these numbers were 25/11 and 20/6. Two events with rainfall above 100 mm were detected in January and February 2020 at the IAG USP station.
The results from Vemado and Pereira Filho (2016) show that the warmer urban environment in MASP produces a UHI effect that interacts with the sea breeze. This intensifies thunderstorms that lead to flash floods and landslides. Therefore, the increase in rainfall extremes can be explained by the UHI and by changes in atmospheric circulation (see section Large Scale Circulation and Regional Influences).
In sum, we can affirm that:
• Total precipitation and frequency of days with extreme rainfall values are increasing
• There is a small negative trend of the number of days with light precipitation from the beginning of the 2000's.
• The number of days 80 and 100 mm has almost doubled in 2011–2019 as compared to 1971–1980, mainly in DJF.
• It is also worth mentioning that the precipitation above 80/100 mm started to be observed after the 2000's during austral winter (JJA).
Large Scale Circulation and Regional Influences
Zilli et al. (2019) and Jorgetti et al. (2014) identify underlying mechanisms associated with changes in precipitation intensity and position of the SACZ since 1979. They show evidence of increasing average daily precipitation along the poleward side of the SACZ. This likely related to a poleward shift of the convergence zone. These changes in circulation and moisture could be related to the poleward expansion of the SASA. The variability of the SACZ caused great natural disasters in Southeast Brazil at various time scales. In the past, SACZ's related intense rainfall triggered landslides that killed people in Serra do Mar (Seluchi and Chou, 2009) and in Rio de Janeiro state in 2011, causing 947 fatalities (Nielsen et al., 2016).
In terms of synoptic scale, the SASA action over Brazil differs between the wet and dry seasons. During the dry season (JJA), SASA is more zonally expanded reaching southeastern Brazil. This is responsible for inhibiting convection and the passage of frontal systems (Reboita et al., 2019). During the wet season (DJF) the SASA shrinks eastward. This favors moisture transport into southeastern Brazil. This moisture is important for the SACZ maintenance, for example. Reboita et al. (2019) observed during 1979–2005 a slightly southward displacement of the SASA core pressure center. This is in agreement with studies that indicate a poleward expansion of the Hadley cell in the present climate (Hu et al., 2018) and of the oceanic gyres (Yang et al., 2020).
Figure 6 shows the variability of the SASA position (Figures 6A–C) and the intensity and total and extreme rainfall events (Figures 6D–F). There is a negative trend in latitude (indicating southern displacement) and longitude (indicating westward displacement) of the SASA core. Additionally, there is a positive trend in the intensity of pressure at the core of SASA (significant at the 90% level). This is accompanied by positive trends in total precipitation at Mirante de Santana and IAG USP (significant level of 95%). The trends in the SASA features are not statistically robust. These suggest that the observed trends in total and extreme rainfall in the long term may be partially related to variations in the circulation in the adjacent South Atlantic Ocean, which is reflected by changes in position and intensity of SASA.
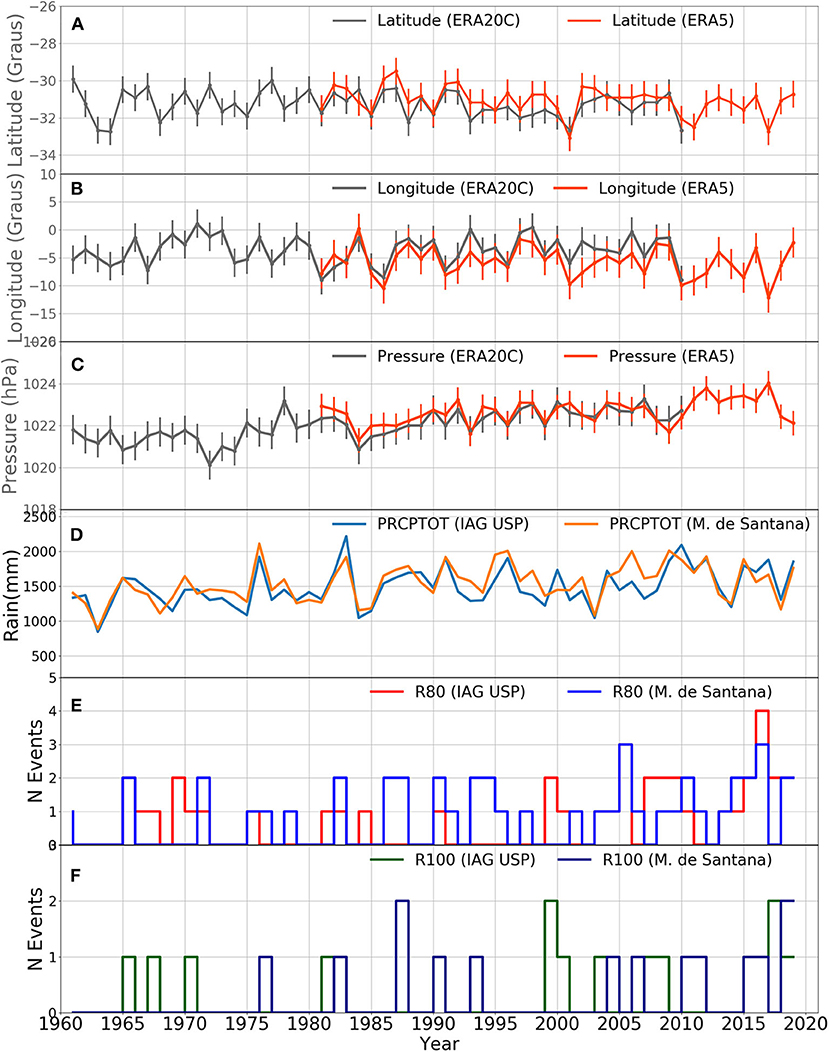
Figure 6. SASA indicators: (A) Latitude, (B) Longitude, (C) Sea level pressure; (D) Annual precipitation PRPCTOT, (E) R80, and (F) R100. Vertical dashes represent the total standard deviation of the SASA series (A–C).
Negative correlation is found between latitude at the core of SASA and precipitation in DJF in MASP. This suggests a southward position of SASA with more rain in MASP and eastern São Paulo state (Figure 7A). Positive correlation is found between longitude of SASA and precipitation, which indicates a westward SASA position during episodes with less precipitation over São Paulo (Figure 7B). Figure 7C shows that combining information, i.e., when SASA is concomitantly displaced southward and westward, it is observed that the intensity of the precipitation (mm/day) is higher than the seasonal mean over MASP and north sector of Southern Brazil. This can be a consequence of increased moisture transport from the northwestern sector of SASA as shown by the northeast winds (Figure 7C). This circulation pattern is consistent with results from a seasonal analysis performed by Silva et al. (2019) considering the five cases in which the ASAS was north (south) of its average position and the five cases in the west (east).
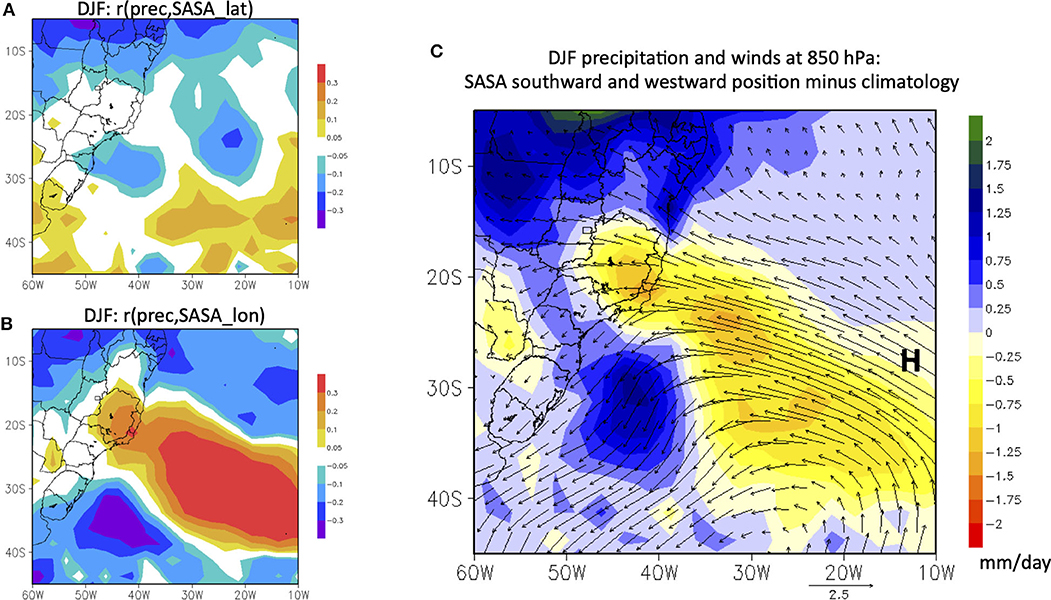
Figure 7. (A) Linear correlation between monthly precipitation and SASA latitude in austral summer months (DJF) from 1979 to 2019; (B) the same as (A) but for SASA longitude and (C) anomaly of the monthly precipitation (mm/day) and wind direction at 850 hPa considering, concomitantly, the most southward and westward position of the SASA in relation to the DJF climatology (shaded).
SASA position should be influenced by the Southern Annular Mode (SAM). Consequently, it also impacts precipitation over southeastern Brazil. In the SAM positive phase, there is higher frequency of cyclones near Antarctica and southeastern coast of Brazil and lower frequency near 45°S (Reboita et al., 2019). These cyclones near the southeastern coast of Brazil can influence the intensity and/or the displacement of the SASA, i.e., it can weak SASA or displaced southward. To evaluate this hypothesis, we calculated the correlation between the SAM index and SASA latitude (similar analysis was done for longitude). There is a negative and significant (α = 0.05) correlation (−0.25) between these two variables, which means that in the SAM positive phase the SASA is displaced southward. This correlation can explain, at least in part, the extreme events of precipitation over São Paulo state and the north sector of the southern Brazilian region. The precipitation signal shown here is in agreement with Reboita et al. (2009), Vasconcellos and Cavalcanti (2010), and Gozzo et al. (2019) who observed that anomalous positive precipitation occurs in the South Atlantic Convergence Zone region during the SAM positive phase, and at the same time there is anomalous negative rainfall over the south of Brazil. Opposite pattern occurs during SAM negative phase.
Final Discussion and Recommendations
This study presents an updates analysis of trend of annual precipitation and rainfall extreme indices for two meteorological stations in the MASP region. The MASP is prone to severe weather. Heavy precipitation can trigger natural disasters with major impacts on society. In general, annual total and heavy precipitation shows a positive significant trend during 1930–2019, mainly during summer. The increase in total precipitation is related to the increase in frequency of extreme precipitation. On the other hand, the number of consecutive dry days (CDD) increased besides the increase in the number of days with very heavy precipitation (from R20 to R100 mm). Although these results appear to be contradictory, they indicate an important climate change in recent times. Intense precipitation is becoming concentrated in a few days across the period separated by longer dry spells, that vary from 30 to 50 dry days since 2000.
Changes in extremes can be partly due to natural climate variability. In other words, changes in the position and intensity of the South Atlantic Subtropical Anticyclone (SASA) are responsible for changes in the atmospheric circulation.
These changes affect rainfall extremes. It is clear from the analysis of its position and intensify considering the period of 1960 to 2019 that the SASA has slightly moved to the west and southward. This new climatological position can influence the transport of humidity and therefore impact the precipitation and extremes. This is a possible physical explanation for the increase in the precipitation extremes in the MASP besides the consecutive dry variability periods observed. A thorough study of this atmospheric dynamical aspect are currently been done and it will be presented elsewhere. However, the correlations between SASA features and total and extreme rainfall may be low even though significant.
The South Atlantic regional circulation changes work together with regional scale changes in the MASP region. However, changes can also be related to global warming and/or urbanization. Urban heat islands created by the concrete and lack of vegetation in big cities increase temperatures. When it is hotter, it rains more, and this gets worse if you have urban areas of concrete and asphalt. The lack of permeable ground means more flooding. This is in addition to a background signal of regional scale circulation. Such changes are probably related to regional warming. The UHI and land use change also affect the regional circulation in the form of sea breeze. As shown in previous studies urbanization intensifies thunderstorms in MASP (Lombardo, 1985; Pereira Filho et al., 2007; Barros and Lombardo, 2016). These produce intense rainfall that trigger landslides, flash floods, and floods. Attribution studies to identify if the causes of changes in extremes are due to natural or anthropogenic influences in MASP are being developed.
While positive trends in rainfall extremes represent hazards, they do not constitute a disaster itself. However, if these hazards impact population living in vulnerable areas, they constitute a disaster. An increase in extreme rain events is accompanied by an inappropriate occupation of vulnerable areas, such as slopes and banks of watercourses. This increases the risk of inundation, flooding, and landslides.
Changes have been identified in the frequency and intensity of light and heavy precipitation and dry spells in Figures 2–6. This pattern, as well as the observed changes in maximum and minimum temperature reported in previous studies, suggest that the MASP is experiencing more pronounced changes during the last 20 years. Since 2000, climate extreme weather and climate events that were rare 50–60 years ago they are now becoming the more frequent. More heavy rainfall episodes could increase the risk of frequent and flash floods and landslides in exposed areas, where vulnerable population and infrastructure may be allocated.
On February 10, 2020, intense rainfall affected the city of São Paulo, and floods, flashfloods, and landslides were recorded. According to the Civil Defense of São Paulo, four people died and 63 were left homeless due to landslides. Roads and highways were affected, and people were ordered to remain at home. Firefighters registered 796 floods, 140 landslides, and 120 trees fell in different neighborhoods of the MASP. In some places, it rained over 3 h the expected average for the whole month of February. The volume of rainfall reached 100 mm in a few hours–more than 50% of the average for the entire month. The Mirante de Santana station recorded 114 mm of rain between February 9th afternoon and Monday 10th. This is the largest amount of rain in 24 h for the month of February recorded in 37 years. Furthermore, February of 2020 was the wettest February since 1943 (INMET).
According to the Commerce Federation of the State of São Paulo (Agencia Brasil, 2020), the intense rainfall of February 10, 2020 produced economical losses of the order of $US 40 million mainly in the MASP.
The MASP urban area is expected to double in size by 2030. Under that scenario, up to 12% of the total area would become highly vulnerable to landslides if rainfall extremes increase by then (Nobre et al., 2011). The planning of large urban centers such as MASP requires a network of global articulation. This involves financial and economic interests. As recommendations, contingency plans are needed and must consider extreme rainfall with extended dry spells among some climate extremes. Rainfall climatology in several meteorological stations must be updated across the entire MASP and the state of São Paulo region, allowing for better studies to see if we have already entered into a “new normal” regime in MASP concerning heavy precipitation trends. There is a need for procedures to be adopted by governments and agencies working with disaster risk management consequence of weather and climate extremes. The main objective is to cope with the impacts of natural disasters in a warming climate with more rainfall extremes and people more vulnerable.
Data Availability Statement
The raw data supporting the conclusions of this article will be made available by the authors, without undue reservation.
Author Contributions
NB and MS provided important analyses of the atmospheric and oceanic fields as well as processing of data from rainfall for calculations of the indices of rainfall extremes and their statistical analyses of rainfall data. AR provided, organized, and processed all data used in this study. JM, TA, LA, NB, and MS wrote the paper. All authors contributed to the article and approved the submitted version.
Funding
This work was supported by the National Institute of Science and Technology for Climate Change Phase 2 under CNPq Grant 465501/2014-1, FAPESP Grants 2014/50848-9, 2015/50122-0. 2015/03804-9, and 2017/09659-6; the National Coordination for High Level Education and Training (CAPES) Grant 88887.136402/2017-00, and the Deutsche Forschungsgemeinschaf Grant DFG-GRTK 1740/2. This study derives from the Newton Fund through the collaboration between INPE, CEMADEN, and the UK Met Office for the Climate Science for Service Partnership Brazil (UKCSSP Brazil).
Conflict of Interest
The authors declare that the research was conducted in the absence of any commercial or financial relationships that could be construed as a potential conflict of interest.
References
Abreu, R. C., Tett, S. F. B., Schurer, A., and Rocha, H. R. (2019). Attribution of detected temperature trends in southeast Brazil. Geophys. Res. Lett. 46, 8407–8414. doi: 10.1029/2019GL083003
Agencia Brasil (2020). Agencia Brasil. Available online at: agenciabrasil.ebc.com.br/economia/noticia/2020-02/impacto-da-chuva-em-sp-pode-ser-de-r-110-milhoes-para-o-comercio (accessed April 5, 2020).
Alexander, L. V., Zhang, X., Peterson, T. C., Caesar, F., Gleason, B., Klein Tank, A., et al. (2006). Global observed changes in daily climate extremes of temperature and precipitation. J. Geophys. Res. Atmos. 111:D05109. doi: 10.1029/2005JD006290
Ávila, A., Justino, F., Wilson, A., Justino, F., Wilson, A., Bromwich, D., et al. (2016). Recent precipitation trends, flash floods and landslides in southern Brazil. Environ. Res. Lett. 11:114029. doi: 10.1088/1748-9326/11/11/114029
Barros, H. H., and Lombardo, M. A. (2016). A ilha de calor urbana e o uso e cobertura do solo em São Paulo-SP. GEOUSP Espaço e Tempo 20, 160–177. doi: 10.11606/issn.2179-0892.geousp.2016.97783
Bouwer, L. M. (2019). “Observed and projected impacts from extreme weather events: implications for loss and damage,” in Loss and Damage from Climate Change. Climate Risk Management, Policy and Governance, eds R. Mechler, L. M. Bouwer, T. Schinko, S. Surminski, and J. Linnerooth-Baye, (New York, NY: Springer), 63–82. doi: 10.1007/978-3-319-72026-5_3
Carvalho, L. M. V., Jones, C., and Liebmann, B. (2002). Extreme precipitation events in southern South America and large-scale convective patterns in the South Atlantic convergence zone. J. Clim. 15, 2377–2394. doi: 10.1175/1520-0442(2002)015<2377:EPEISS>2.0.CO;2
Carvalho, L. M. V., Jones, C., and Liebmann, B. (2004). The South Atlantic convergence zone: intensity, form, persistence, relationships with intraseasonal to interannual activity and extreme rainfall. J. Clim. 17, 88–108. doi: 10.1175/1520-0442(2004)017<0088:TSACZI>2.0.CO;2
Cavalcanti, I. F. A., and Kousky, V. (2002). Drought in Brazil during summer and fall and 2001 and associated atmospheric circulation features. Climanalise 1, 10–12.
CEPED UFSC (2013). Atlas Brasileiro de Desastres Naturais: 1991-2012, Universidade Federal de Santa Catarina, Florianopolis.
Chou, S., Lyra, A., Mourao, C., Claudine, C., Pilotto, I., Gomes, J., et al. (2014). Evaluation of the eta simulations nested in three global climate models. Am. J. Clim. Change 3, 438–454. doi: 10.4236/ajcc.2014.35039
Di Giulio, G. M., Bedran-Martins, A. M. B., da Penha Vasconcellos, M., Ribeiro, W. C., and Lemos, M. C. (2018). Mainstreaming climate adaptation in the megacity of São Paulo, Brazil. Cities 72, 237–244. doi: 10.1016/j.cities.2017.09.001
Diffenbaugh, N. S. D., Singh, J. S., Mankin, S., Horton, D. E., Swain, D. L., Touma, D., et al. (2017). Quantifying the influence of global warming on unprecedented extreme climate events. Proc. Atl. Acad. Sci. U.S.A. 114, 4881–4886. doi: 10.1073/pnas.1618082114
Donat, M. G., Alexander, L. V., Yang, H., Durre, I., Vose, R., Dunn, R. J. H., et al. (2013). Updated analyses of temperature and precipitation extreme indices since the beginning of the twentieth century: the HadEX2 dataset. J. Geophys. Res. Atmos. 118, 2098–2118. doi: 10.1002/jgrd.50150
Drumond, A., and Ambrizzi, T. (2005). The role of SST on the South American atmospheric circulation during January, February and March 2001. Clim. Dyn. 24, 781–791. doi: 10.1007/s00382-004-0472-3
Dufek, A., and Ambrizzi, T. (2008). Precipitation variability in São Paulo state, Brazil. Theor. Appl. Climatol. 93, 167–178. doi: 10.1007/s00704-007-0348-7
Frich, P., Alexander, L. V., Della-Marta, B., Gleason, B., Haylock, M., Klein Tank, A., et al. (2002). Observed coherent changes in climatic extremes during the second half of the twentieth century. Clim. Res. 19, 193–212. doi: 10.3354/cr019193
G1 (2020). No Sudeste, estado de SP tem mais registros de eventos extremos em novo padrão de chuvas, diz Inpe. Available online at: g1.globo.com/natureza/noticia/2020/02/11/no-sudeste-estado-de-sp-tem-mais-registros-de-eventos-extremos-em-novo-padrao-de-chuvas-diz-inpe.ghtml (accessed March 12, 2020).
Giorgi, F., Coppola, E., and Raffaele, F. (2014). A consistent picture of the hydroclimatic response to global warming from multiple indices: models and observations. J. Geophys. Res. 119, 11695–11708. doi: 10.1002/2014JD022238
Gozzo, L. F., Palma, M., Custodio, M., and Machado, M. P. (2019). Climatology and trend of severe drought events in the state of São Paulo, Brazil, during the 20th century. Atmosphere 10:190. doi: 10.3390/atmos10040190
Haylock, M. R., Peterson, T. C., Alves, L. M., Ambrizzi, T., Anunciacao, Y. M. T., Baez, J., et al. (2006). Trends in total and extreme South American rainfall 1960–2000 and links with sea surface temperature. J. Clim. 19, 1490–1512. doi: 10.1175/JCLI3695.1
Hu, Y., Huang, H., and Zhou, C. (2018). Widening and weakening of the hadley circulation under global warming. Sci. Bull. 63, 640–644. doi: 10.1016/j.scib.2018.04.020
Instituto Brasileiro de Geografía e Estatística (2011). Sinopse Do Censo Demográfico 2010. Available online at: www.ibge.gov.br (accessed March 10, 2019).
IPCC (2012). “Managing the risks of extreme events and disasters to advance climate change adaptation,” in A Special Report of Working Groups I and II of the Intergovernmental Panel on Climate Change, eds C. B. Field, V. Barros, T. F. Stocker, D. Qin, D. J. Dokken, K. L. Ebi, M. D. Mastrandrea, K. J. Mach, G.-K. Plattner, S. K. Allen, M. Tignor, and P. M. Midgley (Cambridge; New York, NY: Cambridge University Press), 582.
IPCC (2013). “Climate change 2013: the physical science basis,” in Contribution of Working Group I to the Fifth Assessment Report of the Intergovernmental Panel on Climate Change, eds T. F. Stocker, D. Qin, G.-K. Plattner, M. Tignor, S. K. Allen, J. Boschung, A. Nauels, Y. Xia, V. Bex, and P. M. Midgley (Cambridge: Cambridge University Press), 1535.
IPCC (2014). “Climate change 2014: impacts, adaptation, and vulnerability,” in Part B:Regional Aspects. Contribution of Working Group II to the Fifth AssessmentReport of the Intergovernmental Panel on Climate Change, eds V. R. Barros, C. B. Field, D. J. Dokken, M. D. Mastrandrea, K. J. Mach, T. E. Bilir, M. Chatterjee, K. L. Ebi, Y. O. Estrada, R. C. Genova, B. Girma, E. S. Kissel, A. N. Levy, S. MacCracken, P. R. Mastrandrea, and L. L. White (Cambridge; New York, NY: Cambridge University Press), 688.
Jorgetti, T., Silva Dias, P. L., and Freitas, E. D. (2014). The relationship between South Atlantic SST and SACZ intensity and positioning. Clim. Dyn. 42, 3077–3086. doi: 10.1007/s00382-013-1998-z
Lombardo, M. A. (1985). A ilha de calor nas metrópoles: o exemplo de São Paulo. São Paulo: Editoria Hucitec.
Magrin, G. O., Marengo, J. A., Boulanger, J. P., Buckeridge, M., Castellanos, E., Nobre, C., et al. (2014). “Central and South America,” in IPCC. Intergovernmental Panel on Climate Change. Climate Change 2014: Impacts, Adaptation and Vulnerability. Contribution of Working Group II to the Fifth Assessment Report of the Intergovernmental Panel on Climate Change (Cambridge: Cambridge University Press), 1499–1566.
Mann, M. E. (2008). Smoothing of climate time series revisited. Geophys. Res. Lett. 35:L16708. doi: 10.1029/2008GL034716
Marengo, J. A., Alves, L., Ambrizzi, T., Young, A., Barreto, N., and Ramos, A. (2020). Trends in extreme rainfall and hydrogeometeorological disasters in the metropolitan area of São Paulo: a review. Ann. N.Y. Acad. Sci. 1471, 1–16. doi: 10.1111/nyas.14307
Marengo, J. A., Nobre, C. A., Seluchi, M. E., Cuartas, A., Alves, L. M., Mendiondo, E. M., et al. (2015). A seca e a crise hídrica de 2014–2105 em São Paulo. Revista USP 106, 31–44. doi: 10.11606/issn.2316-9036.v0i106p31-44
Marengo, J. A., Valverde, M. C., and Obregon, G. (2013). Observed and projected changes in rainfall extremes in the metropolitan area of São Paulo. Clim. Res. 57, 61–72. doi: 10.3354/cr01160
Nielsen, D. M., Cataldi, M., Belém, A. L., and Albuquerque, A. L. (2016). Local indices for the South American monsoon system and its impacts on Southeast Brazilian precipitation patterns. Nat. Hazards 83, 909–928. doi: 10.1007/s11069-016-2355-4
Nobre, C. A., Marengo, J. A., and Seluchi, M. E. (2016). Some characteristics and impacts of the drought and water crisis in Southeasters Brazil during 2014 and 2015. J. Water Res. Prot. 8, 252–262. doi: 10.4236/jwarp.2016.82022
Nobre, C. A., Young, A., Saldiva, P., and Marengo, J. A. (2011). “Vulnerabilidades das megacidades brasileiras às mudanças climáticas: região metropolitana de São Paulo,” in São Paulo: Instituto Nacional de Pesquisas Espaciais and Universidade Estadual de Campinas, eds C. A. Nobre and A. F. Young (Campinas: Universidade Estadual de Campinas Núcleo de Estudos de População), 188.
Obregon, G. O., Marengo, J. A., and Nobre, C. A. (2014). Rainfall and climate variability: long-term trends in the metropolitan area of São Paulo in the 20th century. Clim. Res. 61, 93–107. doi: 10.3354/cr01241
Otto, F., Coelho, C. A. S., King, A., de Perez, E. C., Wada, Y., Van Oldenborgh, G. J., et al. (2015). Factors other than climate change, main drivers of 2014/15 water shortage in southeast Brazil. Bull. Amer. Meteor. Soc. 96, S35–S40. doi: 10.1175/BAMS-D-15-00120.1
Pereira Filho, A. J., dos Santos, P. M., Camargo, R., Festa, M., Funari, F. L., Salum, S. L., et al. (2007). “Caracterização do clima e sua evolução na região metropolitana de São Paulo,” in Evolução do tempo e do clima na Região Metropolitana de São Paulo, ed T. M. B. S. Xavier (São Paulo: Editora Linear B), 299.
Poli, P., Hersbach, H., Dee, D. P., Berrisford, P., Simmons, A. J., Vitart, F., et al. (2016). ERA-20C: an atmospheric reanalysis of the twentieth century. J. Clim. 29, 4083–4097. doi: 10.1175/JCLI-D-15-0556.1
Porto, R. L., Porto, M. F. A., and Palermo, M. (2014). A ressurreição do volume morto do sistema cantareira na quaresma. Revista DAE 62, 18–25. doi: 10.4322/dae.2014.131
Ramires, J. Z. C., and Mello-Thery, N. A. (2018). Uso e ocupação do solo em São Paulo, alterações climáticas e os riscos ambientais contemporaneous. Confins. 34, 1–19. doi: 10.4000/confins.12779
Reboita, M. S., Ambrizzi, T., and Rocha, R. P. (2009). Relationship between the southern annular mode and southern hemi-sphere atmospheric systems. Rev. Bras. Meteorol. 24, 48–55. doi: 10.1590/S0102-77862009000100005
Reboita, M. S., Ambrizzi, T., Silva, B. A., Pinheiro, R. F., and da Rocha, R. P. (2019). The south atlantic subtropical anticyclone: present and future climate. Front. Earth Sci. 7:8. doi: 10.3389/feart.2019.00008
Ren, L., Arkin, P., Smith, T., and Shen, S. S. P. (2013). Global precipitation trends in 1900–2005 from a reconstruction and coupled model simulations. J. Geophys. Res. Atmos. 118, 1679–1689. doi: 10.1002/jgrd.50212
Rosenzweig, C., Solecki, W., Romero-Lankao, P., Mehrotra, S., Dhakal, S., and Ali Ibrahim, S. (2018). Climate Change and Cities Second Assessment Report of the Urban Climate Change Research Network. Cambridge University Press. 46. doi: 10.1017/9781316563878
Seluchi, M. E., and Chou, S. C. (2009). Synoptic patterns associated with landslide events in the Serra do Mar, Brazil. Theor. Appl. Climatol. 98, 67–77. doi: 10.1007/s00704-008-0101-x
Seneviratne, S. I., Nicholls, N., Easterling, D., Kanae, S., Kossin, J., Luo, J., et al. (2012). “Changes in climate extremes and their impacts on the natural physical environment,” in Managing the Risks of Extreme Events and Disasters to Advance Climate Change Adaptation. A Special Report of Working Groups I and II of the Intergovernmental Panel on Climate Change (IPCC), eds C. B. Field, V. Barros, T. F. Stocker, D. and Qin (Cambridge; New York, NY: Cambridge University Press), 109–230.
Sillmann, J., Kharin, V. V., Zhang, X., Zwiers, F. W., and Bronaugh, D. (2013). Climate extremes indices in the CMIP5 multimodal ensemble: part 1. Model evaluation in the present climate. J. Geophys. Res. Atmos. 118, 1716–1733. doi: 10.1002/jgrd.50203
Silva Dias, M. A. F., Dias, J., Carvalho, L. M. V., Freitas, E. D., and Silva Dias, P. L. (2013). Changes in extreme daily rainfall for São Paulo, Brazil. Clim. Change 116, 705–722. doi: 10.1007/s10584-012-0504-7
Silva, B. A., Reboita, M. S., and Pinheiro, R. F. (2019). “Influência do anticiclone subtropical do atlântico sul nos ventos da América do sul,” in Seminário de Meio Ambeinte e Recursos Naturais (SEMEAR) (Itajubá: UNIFEI). Available online at: http://seminariosemear.com/assets/docs/trabalhos_revisados/semear.2019.52.pdf (accessed March 23, 2020).
Simões, E., de Sousa, W. Jr., de Freitas, D., Mills, M., Iwama, A., Goncalves, I., et al. (2017). Barriers and opportunities for adapting to climate change on the North Coast of São Paulo, Brazil. Reg. Environ. Change 17, 1739–1750. doi: 10.1007/s10113-017-1133-5
Skanski, M. M., Brunet, M., Sigro, J., Aguilar, E., Arevalo Groening, J. A., Bentancur, O. J., et al. (2013). Warming and wetting signals emerging from analysis of changes in climate extreme indices over South America. Global Planet. Change 100, 295–307. doi: 10.1016/j.gloplacha.2012.11.004
Sugahara, S., da Rocha, R. P., and Ynoue, R. Y. (2012). Homogeneity assessment of a station climate series (1933–2005) in the metropolitan area of São Paulo: instrument change and urbanization effects. Theor. Appl. Climatol. 107, 361–374. doi: 10.1007/s00704-011-0485-x
Sun, Q., Miao, C., Duan, Q., Ashouri, H., Sorooshian, S., and Hsu, K. L. (2018). A review of global precipitation data sets: data sources, estimation, and intercomparisons. Rev. Geophys. 56, 79–107. doi: 10.1002/2017RG000574
Tarifa, J. R., and Armani, G. (2001). “Os climas naturais,” in GEOUSP-Novos Caminhos. eds J. R. Tarifa and T. R. Azevedo (São Paulo), 34–46.
Teixeira, M. S., and Satyamurty, P. (2011). Trends in the frequency of intense precipitation events in Southern and Southeastern Brazil during 1960–2004. J. Climate 24, 1913–1921. doi: 10.1175/2011JCLI3511.1
UN-Habitat (2015). Increasing Synergy for Greater National Ownership, United Nations Human Settlements Programme. UN-Habitat Global Activities Report 2015. UN-Habitat, Nairobi.
UN-Habitat (2016). Urbanization and Development. Emerging Futures. World Cities Report 2016 United Nations Human Settlements Programme. UN-Habitat, Nairobi.
Vasconcellos, F. C., and Cavalcanti, I. F. A. (2010). Extreme precipitation over Southeastern Brazil in the austral summer and relations with the Southern Hemisphere annular mode. Atmos. Sci. Lett. 11, 21–26. doi: 10.1002/asl.247
Vemado, F., and Pereira Filho, A. J. (2016). Severe weather caused by heat island and sea breeze effects in the metropolitan area of São Paulo, Brazil. Adv. Meteorol. 2016, 1–13. doi: 10.1155/2016/8364134
Vergara, W., (ed.). (2008). “Climate hotspots: climate-induced ecosystem damage in Latin America,” in Assessing the Potential Consequences of Climate Destabilization in Latin America. LCR Sustainable Development Working Paper No. 32, (Washington, DC: World Bank), 14.
Xavier, T. M. B. S., Xavier, A., and Silva Dias, M. A. F. (1994). Evolução da precipitação diária num ambiente urbano: o caso da cidade de São Paulo. Rev. Bras. Meteorol. 9, 44–53.
Yang, H., Lohmann, G., Krebs-Kanzow, U., Ionita, M., Shi, X., Sidorenko, D., et al. (2020). Poleward shift of the major ocean gyres detected in a warming climate. Geophys. Res. Lett. 47:e2019GL085868. doi: 10.1029/2019GL085868
Zilli, M. T., Carvalho, L. M. V., Liebmann, B., and Silva Dias, M. A. (2016). A comprehensive analysis of trends on extreme precipitation over southeastern coast of Brazil. Int. J. Climatol. 37, 2269–2279. doi: 10.1002/joc.4840
Keywords: climate extremes, natural disasters, climate change, South Atlantic Subtropical Anticyclone, São Paulo
Citation: Marengo JA, Ambrizzi T, Alves LM, Barreto NJC, Simões Reboita M and Ramos AM (2020) Changing Trends in Rainfall Extremes in the Metropolitan Area of São Paulo: Causes and Impacts. Front. Clim. 2:3. doi: 10.3389/fclim.2020.00003
Received: 29 April 2020; Accepted: 29 June 2020;
Published: 07 August 2020.
Edited by:
Chris C. Funk, United States Geological Survey (USGS), United StatesReviewed by:
Johnna Maria Infanti, National Oceanic and Atmospheric Administration (NOAA), United StatesUdit Bhatia, Indian Institute of Technology Gandhinagar, India
Copyright © 2020 Marengo, Ambrizzi, Alves, Barreto, Simões Reboita and Ramos. This is an open-access article distributed under the terms of the Creative Commons Attribution License (CC BY). The use, distribution or reproduction in other forums is permitted, provided the original author(s) and the copyright owner(s) are credited and that the original publication in this journal is cited, in accordance with accepted academic practice. No use, distribution or reproduction is permitted which does not comply with these terms.
*Correspondence: Jose A. Marengo, jose.marengo@cemaden.gov.br
†ORCID: Jose A. Marengo orcid.org/0000-0001-8578-7639
Tercio Ambrizzi orcid.org/0000-0001-8796-7326
Lincoln M. Alves orcid.org/0000-0001-8259-2262
Naurinete J. C. Barreto orcid.org/0000-0001-5167-6228
Michelle Reboita orcid.org/0000-0002-1734-2395