


Abstract
Searches for electromagnetic counterparts of gravitational-wave signals have redoubled since the first detection in 2017 of a binary neutron star merger with a gamma-ray burst, optical/infrared kilonova, and panchromatic afterglow. Yet, one LIGO/Virgo observing run later, there has not yet been a second, secure identification of an electromagnetic counterpart. This is not surprising given that the localization uncertainties of events in LIGO and Virgo's third observing run, O3, were much larger than predicted. We explain this by showing that improvements in data analysis that now allow LIGO/Virgo to detect weaker and hence more poorly localized events have increased the overall number of detections, of which well-localized, gold-plated events make up a smaller proportion overall. We present simulations of the next two LIGO/Virgo/KAGRA observing runs, O4 and O5, that are grounded in the statistics of O3 public alerts. To illustrate the significant impact that the updated predictions can have, we study the follow-up strategy for the Zwicky Transient Facility. Realistic and timely forecasting of gravitational-wave localization accuracy is paramount given the large commitments of telescope time and the need to prioritize which events are followed up. We include a data release of our simulated localizations as a public proposal planning resource for astronomers.
Export citation and abstract BibTeX RIS
1. Introduction
The detection of the first binary neutron star (BNS) merger GW170187 (Abbott et al. 2017a) by the Advanced Laser Interferometer Gravitational-wave Observatory (LIGO; LIGO Scientific Collaboration et al. 2015) and Virgo (Acernese et al. 2015), its short gamma-ray burst (GRB) 170817A (Goldstein et al. 2017), its afterglow (e.g., Hallinan et al. 2017; Troja et al. 2017), and its kilonova (KN) AT2017gfo (e.g., Evans et al. 2017; Kasliwal et al. 2017; Kilpatrick et al. 2017; Pian et al. 2017; Shappee et al. 2017; Smartt et al. 2017) has shown significant promise for multimessenger constraints on many areas of physics, including the neutron star (NS) equation of state (e.g., Bauswein et al. 2017; Abbott et al. 2018; Radice et al. 2018; Coughlin et al. 2019a, 2018a, 2020; Dietrich et al. 2020), cosmology (e.g., Abbott et al. 2017b; Hotokezaka et al. 2019; Dietrich et al. 2020), and nucleosynthesis (e.g., Chornock et al. 2017; Coulter et al. 2017; Cowperthwaite et al. 2017; Pian et al. 2017).
By the end of Advanced LIGO's and Advanced Virgo's second observing run (O2), GW170187 was merely one of 11 gravitational wave (GW) events reported in the First GW Transient Catalog (GWTC-1; Abbott et al. 2019a). The tally has already climbed to many tens of events from just the first half of O3 in GWTC-2 (Abbott et al. 2021a). O3 saw the detection of a second BNS merger (Abbott et al. 2020a) and the first two neutron star–black holes (NSBHs; Abbott et al. 2021b). These events and others were followed up by many teams (e.g., Coughlin et al. 2019b; Antier et al. 2020; Gompertz et al. 2020; Anand et al. 2021). But while hopes ran high in O3 after the success of GW170817, no further electromagnetic (EM) counterparts have yet been confirmed (although see Graham et al. 2020; Pozanenko et al. 2020).
One possible explanation is that the KN AT2017gfo, like many objects in astronomy that are the first of their kind, may have been anomalously bright compared to the rest of its class. However, aggregate analysis of many KN searches (with one detection and several upper limits) does not currently require AT2017gfo to have been an outlier (Antier et al. 2020; Gompertz et al. 2020; Kasliwal et al. 2020). Rather, the lack of KN detections in O3 can mostly be explained by the GW localization uncertainties in O3, which were much larger than predicted.
Accurate forecasting of the sensitivity, detection rate, and localization accuracy of the global GW detector network based on commissioning and observing scenarios is vitally important to the astronomy community for planning observing campaigns, requesting time allocations on existing facilities, and designing and building new telescopes and space missions. Early estimates of GW localization performance for compact binary coalescences (CBCs) were based on analytical analysis of the uncertainty in triangulation from time delay on arrival (e.g., Fairhurst 2011). Leading up to Advanced LIGO and Virgo, there were more realistic forecasts based on analyzing simulated CBC signals using the full end-to-end real-time detection and coherent localization software stack (Singer et al. 2014) and realistic noise (Berry et al. 2015). In recent years, LIGO, Virgo, and the KAmioka GRAvitationa-wave observatory (KAGRA) have maintained an official Living Reviews in Relativity (Abbott et al. 2020b; henceforth LRR) describing their commissioning and observing schedules and expected localization precision. LRR had predicted a median localization precision in O3 of ∼300 deg2, but the actual median during O3 was an order of magnitude larger, ∼2000 deg2. Why?
In this paper, we show that the discrepancy between the predicted and as-built localization performance in O3 was largely due to differences between the signal-to-noise ratio (S/N) threshold for detection that was assumed in LRR versus what was used in practice. In past observing runs, CBC searches relied completely on finding coincident triggers in multiple detectors to eliminate false positives due to instrumental and environmental glitches. But improvements in flagging and excision of bad data and the estimation of false alarm rates (FARs) made it possible in O3 to detect CBC signals in just a single detector (Callister et al. 2017; Sachdev et al. 2019; Godwin et al. 2020; Nitz et al. 2020), or with a reduced network S/N threshold when multiple detectors were online. These advances had the positive impact of increasing LIGO and Virgo's astrophysical reach in O3 and increasing the number of candidates detected. However, they had relatively little effect on the rate of detection of nearby, well-localized, gold-plated events, which thereby made up a much smaller fraction of events than predicted in LRR.
Because LRR is used by astronomers planning observing programs, facilities, and missions for follow-up of GW events, this inconsistency led to overly optimistic expectations about the sky localization areas and therefore the telescope time required. We present updated observing scenarios similar to LRR but using S/N thresholds that are more comparable to what was done in practice in O3. We find good agreement with the statistics of public GW alerts that were sent during O3. We carry forward the S/N thresholds and provide predicted detection and localization performance for the next two observing runs, O4 (expected to begin in mid-2022) and O5 (expected to begin in 2025). We provide a data release of our thousands of simulated detections and sky localizations for O3, O4, and O5, as a public resource to support observing, proposal planning, and mission formulation.
Due to the need to rapidly tile localization regions of up to thousands of square degrees, KN searches are largely the province of wide field of view (FOV), synoptic, time-domain optical survey facilities like the Panoramic Survey Telescope and Rapid Response System (Morgan et al. 2012), the Dark Energy Camera (DECam; Flaugher et al. 2015), Zwicky Transient Facility (ZTF; Bellm et al. 2019; Graham et al. 2019; Masci et al. 2019; Dekany et al. 2020), and (soon) the Vera C. Rubin Observatory (Rubin; Ivezić et al. 2019); or arrays of many smaller-aperture robotic telescopes such as the Global Rapid Advanced Network Devoted to the Multi-messenger Addicts (Antier et al. 2020) and the Gravitational-wave Optical Transient Observer (Gompertz et al. 2020). To illustrate the impact of realistic, data-driven predictions of GW localization performance, we simulate observation planning and KN detection rates in the context of ZTF.
This paper is organized as follows. Section 2 describes the simulations. The simulations are compared with O3 public alerts in Section 3 while the projections are given in Section 4. The effect that the observing scenarios have on wide-field optical surveys are demonstrated in Section 5. Our conclusions are presented in Section 6.
2. Simulation
Our setup and tools are similar to those used for the CBC simulations in LRR. At a high level, we first draw a sample of simulated compact binaries with a realistic astrophysical distributions of masses, spins, distances, and sky locations. Then we simulate their GW signals, add them to Gaussian noise, and recover them with a matched filter. Finally, we make sky maps for those events that pass the threshold for detection. Scripts and instructions for reproducing our simulations on an HTCondor or PBS computing cluster are publicly available on GitHub 11 and Zenodo (Singer 2021a). All of the simulated detections and localizations have been release publicly on Zenodo (Singer 2021b, 2021c, 2021d, 2021e).
Analysis tools: We used the same analysis tools as LRR, employing the rapid localization code, BAYESTAR (Singer & Price 2016). We ran the same tools to draw sources from the astrophysical population 12 , to simulate the matched filter pipeline and detection thresholds 13 , to perform sky localization 14 , and to gather summary statistics for the sky maps. 15
Detector configurations: We adopt the same GW detector network configuration, noise curves, and duty cycles as LRR, which described three observing runs, O3, O4, and O5. The O3 run includes the LIGO Hanford, LIGO Livingston, and Virgo, all with their as-built sensitivities. O4 and O5 includes LIGO, Virgo, and KAGRA, with predicted sensitivities based on planned future upgrades and commissioning. Although all three observing runs were included in Figures 1 and 2 of LRR, only O3 and O4 were included in detection and localization simulations. We include results for all three observing runs. 16 We use the same noise power spectral density data files as LRR, which were released in O'Reilly et al. (2020) 17 . Each detector had a duty cycle of 70%, uncorrelated with the other detectors.

Figure 1. Comparison of simulations with O3 public alerts. In each panel, the vertical axis is the cumulative fraction of events. Model distributions from LRR are shown as thin colored curves and model distributions from this work as thick colored curves. The empirical distributions of O3 public alerts are represented by black stepped lines. For comparison to modern sky surveys, the FOVs of DECam, Rubin, and ZTF are indicated in the left panels.
Download figure:
Standard image High-resolution imageMass and spin distributions: LRR employed three separate GW source populations: BNS, NSBH, and binary black hole (BBH). NS component masses were normally distributed with mean 1.33 M☉ and standard deviation 0.09 M☉; NS component spin magnitudes were uniformly distributed in [0, 0.05]. BH masses were drawn from the interval [5, 50] M☉ according to a Salpeter-like power-law distribution (Salpeter 1955), p(m) ∝ m−2.3; black hole (BH) component spin magnitudes were uniformly distributed in [0, 0.99]. Component masses were drawn independently without any constraint on mass ratio. All spins were either aligned or anti-aligned with the orbital angular momentum, with equal probability. Although state-of-the-art population modeling (Abbott et al. 2021c) now uses more detailed mass and spin distributions than were available at the time of the publication of LRR, we adopt the original distributions for ease of comparison.
Spatial distributions: As in LRR, positions and orientations were distributed isotropically. Redshifts were drawn uniformly in co-moving rate density,

employing cosmological parameters from Planck Collaboration et al. (2016).
Astrophysical rate density: The astrophysical rate density does not affect the distributions of events, but does affect the predicted detection rate. LRR used observational estimates of the BNS and BBH merger rate densities from O2 (Abbott et al. 2019a, 2019b), and pre-Advanced LIGO constraints on the NSBH merger rate density (Abadie et al. 2010). The values were  . Here, we use the latest published observational rate density estimates from O3 (Abbott et al. 2021c, 2021b) of
  ,
,  , and
, and  , respectively.
Sample size: For each combination of detector configuration and source population, we drew 106 simulated mergers, 10 times the sample size used in LRR.
Minimum number of detectors: Our simulations differ from LRR in only two important ways: the minimum number of detectors and the minimum S/N threshold for detection. LRR required a single-detector S/N > 4 in at least two detectors. This assumption did not accurately represent O3 because some of the CBC search pipelines that were participating in public alerts only needed a signal to be present in a single detector (Callister et al. 2017; Sachdev et al. 2019; Godwin et al. 2020; Nitz et al. 2020). Indeed, GWTC-2 (Abbott 2021a) lists four public alerts in the first half of O3 (S190718y, S190901ap, S190910h, and S190930t) that were detected in a single detector. For these reasons, in the present work we drop LRR's requirement of a coincidence in two or more detectors.
S/N threshold for detection: LRR required a network S/N (square root of the sum of the squares of the S/Ns of the individual detectors) >12 for detection, but this did not accurately describe O3 either. In reality, the threshold for a public alert is based on FAR, which depends on time and data quality in complicated ways that are hard to predict or model. Both LRR and this work follow a longstanding convention of using a network S/N threshold as a proxy because FAR tends to vary monotonically with network S/N. But it remains difficult to pin down a value for the network S/N threshold from publicly available information because LIGO and Virgo do not release the S/Ns in public alerts. GWTC-2 (Abbott 2021a) lists S/Ns for a subset of public alerts that were recovered in offline re-analysis with FARs ≤ 2 yr−1; the lowest was S190426c with a network S/N of 10.1. However, there are new events that were first published in Abbott et al. (2020b) that have a network S/Ns as low as 8.0. We varied the network S/N threshold in our simulation until we obtained reasonable agreement with the localization area and luminosity distance distributions of O3 alerts; we arrived at a network S/N > 9 for BBHs or >8 for BNSs and NSBHs. We confirmed that this was a reasonable description of how the online GstLAL compact binary search pipeline was operated in O3; the threshold was intentionally made looser for BNS and NSBH than BBH in order to favor alerts for binaries that were likely to produce EM counterparts (R. Magee, private communication). In short, based on discussions with the search teams and comparison with the public alert distributions, we require a network S/N > 9 for BBHs or > 8 for BNSs and NSBHs.
3. Comparison with O3 Public Alerts
We check our simulation by comparing the predicted distribution for O3 to the measured empirical distribution of LIGO/Virgo public alerts. The script that we used to query LIGO and Virgo's public GRAvitational-wave Candidate Event DataBase (GraceDB) is available on GitHub. 18 All of the retrieved alerts are listed in Table 1.
Table 1. Public Alerts in O3
| Dist. a | Area b | Vol. c | Properties (%) | Classification (%) | ||||||
|---|---|---|---|---|---|---|---|---|---|---|
| Superevent | (Mpc) | (deg2) | (106 Mpc3) | NS | Rem | BNS | NSBH | BBH | MG | Terr |
| BNS (8 events) | ||||||||||
| S190425z | 150 | 10000 | 9.7 | 100 | 100 | 100 | 0 | 0 | 0 | 0 |
| S190426c | 370 | 1300 | 18 | 100 | 100 | 49 | 13 | 0 | 24 | 14 |
| S190510g | 260 | 3500 | 22 | 100 | 100 | 42 | 0 | 0 | 0 | 58 |
| S190718y | 190 | 7200 | ∞ | 100 | 100 | 2 | 0 | 0 | 0 | 98 |
| S190901ap | 240 | 14000 | 53 | 100 | 100 | 86 | 0 | 0 | 0 | 14 |
| S190910h | 240 | 24000 | 79 | 100 | 100 | 61 | 0 | 0 | 0 | 39 |
| S191213g | 190 | 1400 | 2.9 | 100 | 100 | 77 | 0 | 0 | 0 | 23 |
| S200213t | 220 | 2600 | 13 | 100 | 100 | 63 | 0 | 0 | 0 | 37 |
| NSBH (7 events) | ||||||||||
| S190814bv | 280 | 38 | 0.17 | 100 | 0 | 0 | 100 | 0 | 0 | 0 |
| S190910d | 600 | 3800 | 170 | 100 | 0 | 0 | 98 | 0 | 0 | 2 |
| S190923y | 430 | 2100 | 39 | 100 | 0 | 0 | 68 | 0 | 0 | 32 |
| S190930t | 110 | 24000 | 7.4 | 100 | 0 | 0 | 74 | 0 | 0 | 26 |
| S191205ah | 360 | 6400 | 150 | 100 | 0 | 0 | 93 | 0 | 0 | 7 |
| S200105ae | 260 | 7700 | 33 | 98 | 0 | 0 | 3 | 0 | 0 | 97 |
| S200115j | 320 | 910 | 9.3 | 100 | 100 | 0 | 0 | 0 | 100 | 0 |
| BBH (40 events) | ||||||||||
| S190408an | 1500 | 390 | 140 | 0 | 12 | 0 | 0 | 100 | 0 | 0 |
| S190412m | 820 | 160 | 13 | 0 | 12 | 0 | 0 | 100 | 0 | 0 |
| S190421ar | 2300 | 1900 | 1800 | 0 | 0 | 0 | 0 | 97 | 0 | 3 |
| S190503bf | 420 | 450 | 7.7 | 0 | 0 | 0 | 0 | 96 | 3 | 0 |
| S190512at | 1300 | 400 | 120 | 0 | 0 | 0 | 0 | 99 | 0 | 1 |
| S190513bm | 2000 | 690 | 500 | 0 | 0 | 0 | 1 | 94 | 5 | 0 |
| S190517h | 2800 | 940 | 1900 | 0 | 0 | 0 | 0 | 98 | 2 | 0 |
| S190519bj | 3100 | 970 | 1800 | 0 | 0 | 0 | 0 | 96 | 0 | 4 |
| S190521g | 660 | 1200 | 61 | 0 | 0 | 0 | 0 | 97 | 0 | 3 |
| S190521r | 1100 | 490 | 84 | 0 | 0 | 0 | 0 | 100 | 0 | 0 |
| S190602aq | 780 | 1200 | 100 | 0 | 0 | 0 | 0 | 99 | 0 | 1 |
| S190630ag | 1000 | 8500 | 1500 | 0 | 0 | 0 | 1 | 94 | 5 | 0 |
| S190701ah | 1000 | 67 | 11 | 0 | 0 | 0 | 0 | 93 | 0 | 7 |
| S190706ai | 5700 | 1100 | 6300 | 0 | 0 | 0 | 0 | 99 | 0 | 1 |
| S190707q | 800 | 1400 | 120 | 0 | 0 | 0 | 0 | 100 | 0 | 0 |
| S190720a | 1100 | 1500 | 250 | 0 | 0 | 0 | 0 | 99 | 0 | 1 |
| S190727h | 1100 | 1400 | 280 | 0 | 0 | 0 | 0 | 92 | 3 | 5 |
| S190728q | 790 | 540 | 44 | 0 | 0 | 0 | 0 | 95 | 5 | 0 |
| S190828j | 1800 | 590 | 330 | 0 | 0 | 0 | 0 | 100 | 0 | 0 |
| S190828l | 1600 | 950 | 470 | 0 | 0 | 0 | 0 | 100 | 0 | 0 |
| S190915ak | 1500 | 530 | 220 | 0 | 0 | 0 | 0 | 99 | 0 | 1 |
| S190924h | 510 | 510 | 15 | 30 | 0 | 0 | 0 | 0 | 100 | 0 |
| S190930s | 740 | 2000 | 170 | 0 | 0 | 0 | 0 | 0 | 95 | 5 |
| S191105e | 1200 | 1300 | 320 | 0 | 0 | 0 | 0 | 95 | 0 | 5 |
| S191109d | 1700 | 1500 | 880 | 0 | 0 | 0 | 0 | 100 | 0 | 0 |
| S191129u | 760 | 1000 | 74 | 0 | 0 | 0 | 0 | 100 | 0 | 0 |
| S191204r | 680 | 100 | 5.5 | 0 | 0 | 0 | 0 | 100 | 0 | 0 |
| S191215w | 2200 | 920 | 920 | 0 | 0 | 0 | 0 | 100 | 0 | 0 |
| S191216ap | 320 | 300 | 2 | 19 | 0 | 0 | 0 | 99 | 1 | 0 |
| S191222n | 860 | 2300 | 230 | 0 | 0 | 0 | 0 | 100 | 0 | 0 |
| S200112r | 1100 | 6200 | 1300 | 0 | 0 | 0 | 0 | 100 | 0 | 0 |
| S200128d | 4000 | 2500 | 7600 | 0 | 0 | 0 | 0 | 97 | 0 | 3 |
| S200129m | 920 | 53 | 4.4 | 0 | 0 | 0 | 0 | 100 | 0 | 0 |
| S200208q | 2800 | 1100 | 2400 | 0 | 0 | 0 | 0 | 99 | 0 | 1 |
| S200219ac | 1500 | 1300 | 540 | 0 | 0 | 0 | 0 | 96 | 0 | 4 |
| S200224ca | 1600 | 71 | 29 | 0 | 0 | 0 | 0 | 100 | 0 | 0 |
| S200225q | 1200 | 670 | 150 | 0 | 0 | 0 | 0 | 96 | 0 | 4 |
| S200302c | 1700 | 6700 | 3800 | 0 | 0 | 0 | 0 | 89 | 0 | 11 |
| S200311bg | 930 | 52 | 5.7 | 0 | 0 | 0 | 0 | 100 | 0 | 0 |
| S200316bj | 1200 | 1100 | 320 | 1 | 0 | 0 | 0 | 0 | 100 | 0 |
Notes.
a Mean a posteriori luminosity distance. b 90% credible area. c 90% credible co-moving volume.A machine-readable version of the table is available.
Download table as: DataTypeset image
We selected all superevents (aggregated candidates from different templates and pipelines in a narrow sliding time window) from O3 that were not retracted and for which the preferred event was a CBC trigger and not an un-modeled burst trigger. For each event, we took the last BAYESTAR sky map that was sent rather than the last sky map because we are interested in the precision of rapid localization for follow-up purposes, rather than the precision of the final parameter estimation. We took the source classification and properties from the last alert that was sent. See the LIGO/Virgo Public Alerts User Guide (LIGO Scientific Collaboration & Virgo Collaboration 2020; henceforth User Guide ) for further explanation of the contents of the public alerts.
During O3, the LIGO/Virgo public alerts communicated the source classification as five numbers representing the probabilities of the source belonging to the following fiducial classes: BNS (defined as having two components of masses 1–3 M☉), NSBH (one component with a mass of 1–3 M☉ and the other >5 M☉), BBH (both component masses >5 M☉), MassGap (one or both components have masses of 3–5 M☉), and Terrestrial (non-astrophysical). The alerts also contained two source property probabilities, both conditioned upon the source being astrophysical: HasRemnant, providing the probability that the source contained an NS that was tidally disrupted without immediately plunging into a final BH; and HasNS, the probability that at least one of the compact objects had a mass <3 M⊙.
Since the four astrophysical O3 alert source classes did not match the three LRR simulation populations, we make a best attempt to assign each superevent to an LRR source population as follows. If the highest-probability astrophysical class was BNS, NSBH, or BBH, then the superevent was assigned to the population of the same name. If the highest-ranked class was MassGap, then we assigned the superevent to the NSBH population if HasNS ≥ 0.5, or BBH otherwise. Although the LRR source populations do not allow for the possibility of a compact object with a mass of 2–5 M⊙, this ad hoc prescription assigns GW190814, with component masses of  and
and  M⊙ (Abbott et al. 2020c), to the NSBH category.
In Figure 1, we show the empirical distributions of the 90% credible areas, 90% credible co-moving volumes, and estimated luminosity distances of O3 public alerts. We also show the simulated distributions of these quantities from LRR and from this work. LRR severely underpredicted the distributions of the localization uncertainty and distance provided by the public alerts, whereas the simple change of adjusting the S/N thresholds results in much better agreement. For example, LRR predicted a median 90% credible area for BBHs in O3 of  deg2, whereas we find
  deg2; the sample median of O3 BBH alerts was 960 deg2. The agreement is improved, but not perfect; for example, for BNSs, LRR predicted
  deg2, whereas we find
  deg2, and the sample median was 5400 deg2.
4. Projections for Future Observing Runs
We now carry forward the new S/N threshold in our simulation to provide updated predictions of the detection rate and localization precision for O4 and O5. Figure 2 shows the cumulative annual detection rate distribution as a function of 90% credible area, 90% credible co-moving volume, and distance for these next several observing runs. Shaded bands represent 5%–95% variation due to the uncertainty in the astrophysical merger rate density. Table 2 presents summary statistics: the median localization area, volume, and distance, as well as the sensitive volume and the annual number of detections. Below, we highlight the most salient features of Figure 2 and Table 2.
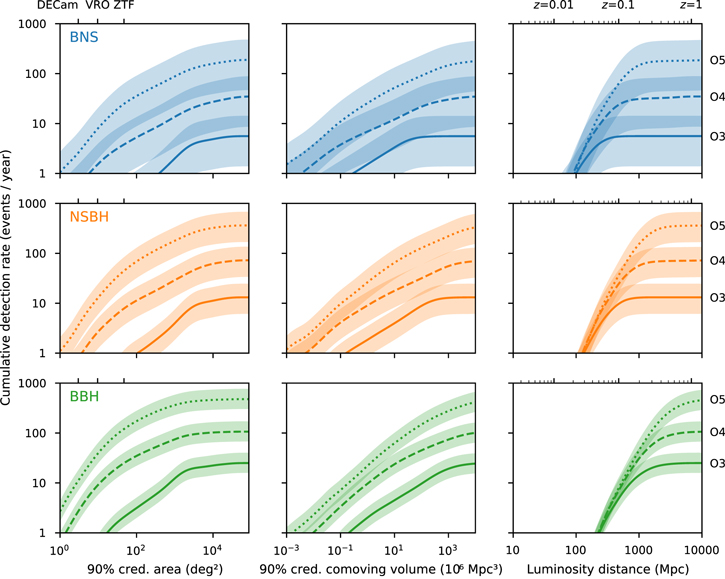
Figure 2. Localization and distance distributions for O3, O4, and O5. In each panel, the vertical axis is the cumulative annual detection rate. The lightly filled bands around the curves represent the 5%–95% confidence interval due to uncertainty in the astrophysical merger rate density.
Download figure:
Standard image High-resolution imageTable 2. Summary Statistics for O3, O4, and O5
| Run | BNS | NSBH | BBH |
|---|---|---|---|
| Median 90% credible area (deg2) i | |||
| O3 |

|

|

|
| O4 |

|

|

|
| O5 |

|

|

|
| Median 90% credible co-moving volume (106 Mpc3) i | |||
| O3 |

|

|

|
| O4 |

|

|

|
| O5 |

|

|

|
| Median luminosity distance (Mpc) i | |||
| O3 |

|

|

|
| O4 |

|

|

|
| O5 |

|

|

|
| Sensitive volume (106 Mpc3) i ii | |||
| O3 |

|

|

|
| O4 |

|

|

|
| O5 |

|

|

|
| Annual number of detections iii iv | |||
| O3 |

|

|

|
| O4 |

|

|

|
| O5 |

|

|

|
Notes. We provide 90% credible intervals in the form  , where a is the 50th percentile, a–c is the 5th percentile, and b–a is the 95th percentile.
Download table as: ASCIITypeset image
The detection rate grows by an order of magnitude in each observing run. This is entirely due to the increasing sensitivity of the GW detector network. The growth in the detection rate is similar to what was found in LRR, although the numbers themselves are a little different due to the updated astrophysical merger rate density estimates and the updated S/N threshold. We find a rate of BNS detections of 1–14 yr−1 in O3, 9–88 in O4, and 47–478 yr in O5. This work predicts that the median annual number of BNS detections during O5 increases by a factor of ∼38 from O3, and a factor of ∼6 from O4. By mid-decade, we predict between tens and hundreds of BNS detections per year.
The detection rate of well-localized events grows by an order of magnitude in each observing run. The rate of detections of well-localized events, with 90% credible areas ≤100 deg2, also grows by an order of magnitude in each observing run. For BNS, we estimate 0–1 yr−1 in O3 (consistent with the true outcome in O3 of zero alerts fitting these criteria), 1–13 yr−1 in O4, and 9–90 yr−1 in O5. Although events that are localized to ≤100 deg2 constitute a modest fraction of all events, there should be up to tens of them per year by mid-decade.
The median localization area is thousands of square degrees, and does not improve significantly between observing runs. This is the most striking impact of the updated S/N thresholds. It is plain to see from Figure 1 or by comparing Table 5 from LRR with Table 2 in the present work. LRR predicted median 90% credible areas for BNS events of  deg2 in O3 and
  deg2 in O4, an order of magnitude improvement. We predict a median area of
  deg2 in O3,
  deg2 in O4, and
  deg2 in O5: orders of magnitude worse than LRR, and relatively static between observing runs.
The sensitive volume is 3–7 times larger than estimated by
LRR
. Table 2 also shows the sensitive volume, which is a measure of the space within the universe that is probed by the GW detector network, and is defined as the detection rate divided by the astrophysical merger rate density.
19
Although LRR itself does not quote values for the sensitive volume, the User Guide does quote values from the same simulations. Depending on the source class and observing run, we estimate a sensitive volume that is 3–7 times larger. This is partly due to the change in the network S/N threshold: if detections were isotropic, we would expect the volume to change by the cube of the ratio of the old and new network S/N thresholds, (12/8)3 = 3.375 for BNS and NSBH, (12/9)3 = 2.370 for BBH. A minor fraction of the improvement comes from the increased live time due to the added capability of detecting events when only a single GW detector is online: given three detectors with independent duty cycles of 70%, there is only one detector online 3 × 70% × (30%)2 = 18.9% of the time. A more significant fraction of the improvement in sensitive volume comes from the increased isotropy in the sensitivity of the GW detector network when two or more detectors are online due to the effective removal of the single-detector S/N threshold. For example, a signal that is near the maximum of LIGO Hanford's antenna pattern but near the minimum of Virgo's might register single-detector S/Ns of 12 and 1 respectively, and a network S/N of  while LRR would not have considered this a detection, the simulations in this work would. Consequently, the reduction in S/N thresholds allows the GW detector network to probe 3–7 times more of the Local Universe.
5. Impact on Optical Searches
We now study the impact on prospects for EM counterpart searches in O4 and O5. We focus on ZTF (Bellm et al. 2019; Graham et al. 2019; Masci et al. 2019; Dekany et al. 2020) because it is especially well adapted to EM counterpart searches (e.g., Coughlin et al. 2019b; Anand et al. 2021). ZTF consists of an optical camera with an exceptionally large 47 deg2 FOV on the fully robotic, meter-class Palomar 48 inch Oschin telescope. When interrupted from its preplanned surveys by a GW target of opportunity (TOO), it can rapidly tile large swaths of the sky. The fast 3 day cadence of the ZTF Northern Sky Survey provides up-to-date premerger images, aiding in ruling out foreground false positives over the entire accessible sky.
Observing strategy: ZTF typically observes GW TOOs in both the g and r bands when time permits, but for simplicity we simulate only r-band observations because the peak absolute magnitude of the KN is similar in the two bands. ZTF has generally used ∼120–300 s exposures for TOOs (Kasliwal et al. 2020), reaching a limiting magnitude of ∼21.5–22.4. We adopt an exposure time of 300 s. We require two exposures separated by 30 minutes in order to rule out faint, uncatalogued, moving solar system objects. In order to be detected, the apparent magnitude of the KN must be above the limiting magnitude in both exposures.
Observation planning: We generate optimal ZTF observing plans for the simulated GW events using the same software that is used to plan real ZTF GW observations, gwemopt (Coughlin et al. 2018b, 2019c). It optimizes the selection of fields and the allocation of available observing time based on the sensitivity and observing constraints of the telescope, the GW sky map, and the expected light curve of the transient.
Light-curve model: We use KN light-curve models generated by the radiative transfer code POSSIS (Bulla 2019) and first presented in Dietrich et al. (2020). The model is axisymmetric and has two ejecta components: a lanthanide-rich dynamical component with mass Mdyn extending above and below the merger plane by half-angle Φ, and a lanthanide-free wind component with mass Mwind at higher latitudes. We consider optimistic and conservative model parameters for the BNS and NSBH mergers listed in Table 3. The optimistic BNS parameters are at the high end of plausible KN scenarios and more than twice the total best-fit values for AT2017gfo (Dietrich et al. 2020). Depending on mass and spin, some NSBH mergers may not produce any KN emission. Of those that do, they are generally expected to produce more dynamical ejecta than BNS mergers (Andreoni et al. 2020) and therefore longer-lasting emission.
Table 3. KN Model Parameters
| Optimistic | Conservative | |||
|---|---|---|---|---|
| BNS | NSBH | BNS | NSBH | |
| Dynamical ejecta mass (M⊙) | 0.005 | 0.08 | 0.01 | 0.01 |
| Wind ejecta mass (M⊙) | 0.11 | 0.09 | 0.01 | 0.01 |
| Half opening angle | 45° | 30° | 45° | 30° |
| Peak g-band absolute magnitude | −15.7 | −15.2 | −15.1 | −14.3 |
| Peak r-band absolute magnitude | −16.0 | −15.4 | −15.7 | −14.8 |
Download table as: ASCIITypeset image
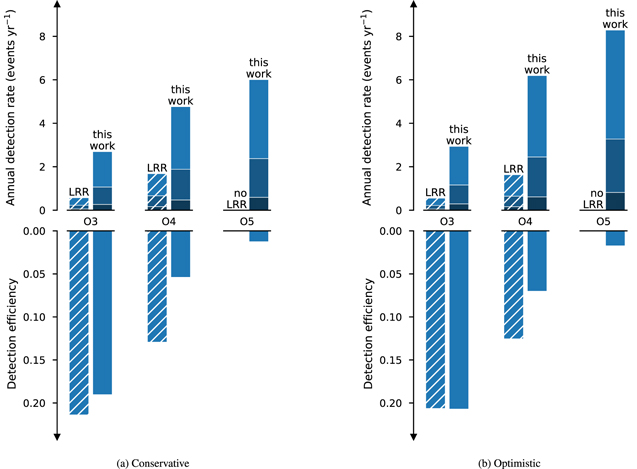
In Figures 3(a) and (b), we present the results of the optical observing simulation under the conservative and optimistic KN models, respectively. The top panels show the rate of detectable KNe, while the bottom panels show the KN detection efficiency—the fraction they represent of all detectable GW events in the given observing run. We show the outcome under the S/N threshold assumptions from both LRR and this work while adopting the modern astrophysical rate density estimates for both cases.
Figure 3. Bar chart of predicted KN detections of BNS events with ZTF in O3, O4, and O5. The left panels (a) are for the conservative KN model, whereas the right panels (b) are for the optimistic case. For comparison, predictions from LRR are shown with diagonal hashing. The top panels show the annual detection rate; each bar is further divided into three shaded bands for the 5th, 50th, and 95th percentiles of the astrophysical rate density. The bottom panels show the detection efficiency, defined as the the fraction of GW-detected BNS events for which KNe are detected.
Download figure:
Standard image High-resolution image
We do not show the NSBH detection rates and efficiencies in Figure 3 because such a small fraction is detected that the Monte Carlo sampling error is very high. Three things work against NSBHs. First, our KN model predicts that NSBHs are intrinsically 0.5–0.9 mag fainter in the optical than BNSs. Second, the GW luminosity increases with the binary total mass, leading to a pronounced Malmquist bias (Malmquist 1922) toward heavier BHs and more distant GW detections. Even with the steeply falling BH mass function assumed in LRR, NSBH detections are on average about twice as far away as BNSs. Third, if the BH is too massive, there should be no KN at all because the NS must be swallowed by the BH before it can be tidally disrupted, although this effect is not captured by our light-curve model. Although these three effects make the prospects for NSBH KNe look bleak, there is room for hope because the two known NSBH mergers to date both had relatively low mass BHs of  and
and  M⊙, respectively.
The main impacts of the more realistic S/N thresholds on KN searches are higher detection rates but lower detection efficiencies. For example, in O4, the (conservative KN model) detection rate nearly triples from 0.2–1.7 events yr−1 to 0.5–4.8 events yr−1 while the detection efficiency is more than cut half from 13% to 5%. Both effects are a direct consequence of the trends that are evident in Figure 1: the less selective S/N threshold for GW detection in this work as compared to LRR leads to more events overall, but events that are in general more distant, more coarsely localized, and consequently more challenging to follow up. The optimistic KN model predicts about 1.3 times as many detections in O4; the detection rate increases to 0.6–6.2 events yr−1 and the efficiency increases to 7%.
Two trends with time are apparent in Figure 3: the predicted KN detection rate climbs in each successive observing run while the KN detection efficiency drops. We can trace these trends back to the distributions of GW events in Figure 2. The increasing KN detection rates are a consequence of an increasing rate of well-localized events, which is a consequence of the improving sensitivities of the GW detector—and also a consequence of the addition of a fourth detector, KAGRA. The decreasing KN detection efficiencies are a result of the increasing average distances of GW detections: with ZTF's limiting magnitude of r = 22.4 mag, it can detect BNSs out to 417–479 Mpc. By O5, the median luminosity distance (see Table 2) is greater than that, so ZTF's sensitivity becomes the limiting factor in the KN detection efficiency. This highlights the importance with meter-class optical facilities like ZTF of being selective about which GW events to trigger on. It also draws attention to the importance of future facilities with larger collecting area like Rubin to probe more distant KNe and increase the KN sample size.
6. Conclusion
In this paper, we have presented simulations of the next two planned GW observing runs and their implications for EM counterpart searches. We used the public alerts from the third observing run to tune the simulations to be consistent with the observed sky maps, and carried forward the resulting detection thresholds for the next two observing runs. We have used the same source distribution and detector networks as LRR to make an apples-to-apples comparison with our simulations, quantifying the large impact that the S/N threshold assumption has on figures of merit that are important to observers such as detection rate, distance, and sky localization precision. We then performed extensive observational simulations with ZTF, to understand the potential multimessenger detection rates for both BNS and NSBH, with both conservative and optimistic quantities of mass ejecta assumed. Although the updated S/N thresholds result in a modest increase in the number of detections, the large distances and large sky areas explain a significant reduction in the fraction of GW events for which KNe are detectable. We demonstrate the need for optical facilities like ZTF to adopt selective TOO triggering criteria that increase the chances of success. We call attention to the need for deeper observations with upcoming facilities like Rubin in order to explore the bulk of the KN population, especially with the increasing sensitivity of the GW detector network through the middle of this decade.
Our work highlights the need for timely observing scenarios that not only accurately reflect current understanding of the source properties and the detector network configurations, but also the S/N thresholds applied to public alerts. We recommend that future revisions of LRR use data-driven studies of GW alerts from past observing runs to verify that assumptions about S/N thresholds lead to realistic results, and promptly incorporate updated thresholds and public alert selection criteria into the official observing scenarios. Because these estimates are relied upon by astronomers to plan observing programs on current facilities, and by observatories and space agencies to plan future instruments and missions for follow-up of GW events, it is essential that accurate expectations for detection rates, sky localizations, and distances are provided.
These scenarios also provide quantitative metrics to inform telescope triggering criteria. The rates and simulations encourage targeting smaller localizations from highly significant, nearby events for follow-up with deep observations. Focusing on objects with maximal science return, a fraction will also have GRBs detected in coincidence; limiting the sample to those with an inclination ≤10° to simulate on-axis events, ∼5% of BNS from this work can expect a GRB detection. Coincidental detection of a KN and GRB further constrains both the inclination angle and disk mass contribution to the transient, enabling strong NS equation of state and Hubble Constant constraints (e.g., Dietrich et al. 2020).
All of the simulated GW localizations and the scripts to reproduce them are publicly available on Zenodo (Singer 2021a, 2021b, 2021c, 2021d, 2021e).
Resources supporting this work were provided by the NASA High-End Computing (HEC) Program through the NASA Advanced Supercomputing (NAS) Division at Ames Research Center under the project "Dorado Concept Study Report Monte Carlo Simulations," by the Minnesota Supercomputing Institute (MSI) at University of Minnesota (UMN) under the project "Identification of Variable Objects in the Zwicky Transient Facility," and the Supercomputing Laboratory at King Abdullah University of Science & Technology (KAUST) in Thuwal, Saudi Arabia.
P.P. acknowledges support from the UMN Research Experiences for Undergraduates (REU) sponsored by REU grant No. NSF1757388. L.P.S. acknowledges support from the Multimessenger Astro Connection Science Task Group (STG) at NASA Goddard Space Flight Center. M.W.C. acknowledges support from the National Science Foundation with grant Nos. PHY-2010970 and OAC-2117997. S.A. acknowledges support from the National Science Foundation GROWTH PIRE grant No. 1545949. M.B. acknowledges support from the Swedish Research Council (Reg. no. 2020-03330).
This document is LIGO-P2100281-v5.
Facilities: LIGO - Laser Interferometer Gravitational-Wave Observatory, EGO:Virgo - , Kamioka:KAGRA - , PO:1.2m - .
Software: Astropy (Astropy Collaboration et al. 2013), gwemopt (Coughlin et al. 2018b, 2019c), HEALPix (Górski et al. 2005), ligo.skymap (Singer & Price 2016; Singer et al. 2016a, 2016b), POSSIS (Bulla 2019).
Footnotes
- 11
- 12
- 13
- 14
- 15
- 16
At the request of collaborators who are using our simulations as the basis for mission concept studies, we generated an "O6" configuration that is like O5 but includes LIGO-India as a fifth detector that is at the same sensitivity as the LIGO sites. The O6 simulations are available in Zenodo (Singer 2021e) but are not discussed in this paper.
- 17
For O3, we used the files aligo_O3actual_H1.txt, aligo_O3actual_L1.txt, avirgo_O3actual.txt; for O4, aligo_O4high.txt, avirgo_O4high_NEW.txt, kagra_80Mpc.txt; for O5, AplusDesign.txt, avirgo_O5high_NEW.txt, and kagra_128Mpc.txt.
- 18
- 19
We warn the reader that although the 90% credible co-moving volume and the sensitive volume have the same units, they are different cosmological volume measures. The 90% credible co-moving volume is defined as an integral over differential co-moving volume. The sensitive volume, on the other hand, has an additional weighting factor of 1/(1 + z) to account for time dilation due to the assumption of fixed merger rate density. However, we can compare the values of the 90% credible co-moving volume and the sensitive volume in Table 2 to get a rough sense that BNS events are typically localized to 20%–40% of the volume probed by the GW detector network.