
Parking and Ride Induction Methods for Drivers in Commuting Scenes


College of Transportation, Jilin University, Changchun 130022, China
*
Authors to whom correspondence should be addressed.
Symmetry 2021, 13(11), 2176; https://doi.org/10.3390/sym13112176
Submission received: 27 September 2021
/
Revised: 27 October 2021
/
Accepted: 7 November 2021
/
Published: 12 November 2021
(This article belongs to the Special Issue Advanced Transportation Technologies and Symmetries in Intelligent Transportation Systems)
Abstract
:Parking and ride is a very effective method to improve the traffic condition of commuter channels, and it is necessary to develop effective parking guidance strategies. In this study, considering the travel time, walking distance, parking cruise time, parking fee, and personal attributes of drivers, a probability model of parking and ride selection in commuter scenarios was proposed, and a dynamic price adjustment method based on the equilibrium of parking occupancy in the region was constructed. The parking price was adjusted by determining the target occupancy, thus affecting the parking choice behavior to guide the commuter to park. The example analysis showed that this method adjusted the selection probability of the parking lot by using the dynamic price adjustment method from the perspective of regional parking occupancy equilibrium, solved the model by symmetric duality algorithm and formulated a reasonable parking replacement induction scheme to achieve the goal of occupancy equilibrium. Compared with parking guidance under static pricing, it can avoid the crowding of commuter vehicles into the city center effectively to reduce the congestion of commuter channels.
1. Introduction
According to the 2018 annual report on the Gaode map, 74% of cities across China are experience congestion or slow transit during rush commuting periods, with the mean velocity of the Beijing road network being only 23.35 km per hour [1]. Parking and ride (P&R) [2] is an important means to alleviate the pressure on the city heartland. P&R behavior means that travelers stop at the parking lot near the transfer center, transfer to urban transit, enter the central urban areas, return to the parking lot near the transfer center by using urban transit, and then drive cars back to the point of origin. P&R can reduce the number of vehicles entering the urban center effectively and alleviate the contradiction between traffic supply and demand caused by the lack of parking space. By 2018, there were 27 officially operated transfer parking lots facilitating the public to connect with subway commuting in Beijing. However, some parking lots in Shanghai are oversaturated, and the utilization rate of some parking lots is even lesser than 10%. There is a serious phenomenon named uneven hot and cold parking in the existing transfer parking lots [3].
Thompson et al. [4] and Thompson and Richardson [5] studied the influence of parking guidance information on parking selection. Taking the shortest queue length of the parking lot and the least number of vehicle kilometers as objective functions, the parking lot allocation is realized by establishing the optimization display model of the parking guidance information board. Mei and Tian [6] established the goal function with the minimum total travel time and used the combination optimization method to display the variable message signs (VMS) information to play the role of parking selection induction. Molenda and Seig [7] modeled from the perspective of trade-offs between residents’ parking and economic viability to allocate roadside parking spaces to residents for parking. Ji et al. [8,9] constructed a stochastic user equilibrium allocation model of a multilayer road network under the influence of VMS, revealed the driver’s parking search behavior, analyzed the change of the driver’s path selection behavior under the parking guidance system, proposed a parking reservation real-time decision method based on fuzzy logic, solved the model to determine the fuzzy rule base, and used fuzzy logic to judge whether to accept the parking reservation application in real time to realize the parking allocation. Yang et al. [10] proposed a dual-object model with the shortest total driving time and the degree of air-filled parking lot to be close to the induction target and used the exhaustive method to overcome the non-uniqueness of the optimal solution of the existing double-objective model and achieve the optimal induction target. Zou et al. [11] aimed to maximize social welfare by parking induction, infrastructure, and vehicle communication to obtain a driver’s parking characteristics, thereby achieving public parking allocation. Duan et al. [12] designed a nested particle swarm optimization algorithm to solve the parking lot allocation model with the shortest total walking distance for drivers. Shao et al. [13] built a simple model of shared use of residential parking by residents and public parking personnel, used binary linear solution model, and gave the corresponding allocation scheme. He and Gao [14] established a bi-level programming model for parking facility selection and travel route selection and designed the related solving algorithm based on the idea of a nested Frank–Wolfe algorithm in the partial augmented multiplier method. Lu et al. [15] established a dynamic allocation and guidance model of regional parking space with the minimum virtual total cost of parking guidance system as the optimization objective, considering the psychological willingness of drivers. Zhang et al. [16] proposed a bi-objective model that takes the utilization rate of the parking lot and the walking distance into account. The driver was induced to the shared parking lot and the optimal allocation was realized by particle swarm optimization. Zhao et al. [17] established an integer linear programming model with the goal of maximizing the allocation of vehicles under the background of shared parking and, on this basis, extended an estimation model of quantitative emission reduction, with branch cutting method as the core algorithm for solving the model. Han et al. [18] based on the predictive guidance strategy, with queue length as constraint conditions, used the wavelet neural network to predict traffic congestion sections, so as to establish a wide-area guidance model. Huang et al. [19] established a shared parking allocation model under the overtime scenario of parking users to maximize the parking revenue of allocating shared parking spaces.
The above studies were mainly aimed at guiding the driver to the destination parking lot under the condition of car travel and lacked guidance under the condition of multimodal travel.
With the continuous increase of car ownership, the P&R travel mode has become an important traffic management measure to alleviate traffic congestion. The current research focused on the location, transfer demand, and distribution of P&R. Faghri and Lang [20] used the expert decision method combined with geographic information system technology to determine the weight of influencing factors and further improved the location model of P&R facilities. Wang et al. [21] considered the construction of urban rail transit P&R facilities from the dual aspects of location and scale. Using the user equilibrium distribution model and multimode distribution method, a location model of urban peripheral P&R facilities based on investment minimization was established. He et al. [22] introduced the planning and selection of P&R facilities in Beijing rail transit and used the analytic hierarchy process and expert scoring method to select the advantages and disadvantages of the alternative parking facilities. Hendricks and Outwater [23] studied the change of transfer demand with transfer station capacity, charging, and other factors. Farhan [24] summarized the method of determining the attracting range of P&R demand and used GIS technology to study the attracting range of P&R facilities, which was verified by examples. Wang et al. [25] studied the demand intensity of parking facilities in specific locations, established the function between the transfer demand intensity and the distance to P&R facilities, and analyzed the factors affecting the attraction intensity. There is little research on the induction method of parking change.
Based on the above situation, this paper determines the travel cost function by considering the time and cost of each part of the commuting chain and establishes the transfer selection model considering the maximum walking distance of the driver for a trip and the maximum parking cost that can be tolerated. The parking price is adjusted dynamically according to the equilibrium of the parking occupancy rate in the region. The paper constructs the relationship model between the occupancy rate and the parking price, and the ultimate goal is to achieve equilibrium of the utilization rates of the parking lots in the same region. At the same time, the proportion of P&R in multimode travel is increased to improve the traffic condition of the commuting channel. Finally, the effectiveness of the method is analyzed by numerical experiments on some subway networks in Shanghai and Shenzhen. The elastic coefficient of price on traffic demand is calculated by the existing elastic analysis method, and the exhaust emission is analyzed.
2. Park and Ride Induction Model
2.1. Basic Assumptions
This park and ride analysis modeling is mainly in the context of parking behavior norms and parking demand can be roughly met, so the experiment abides by the following hypothesizes:
- Assuming that the driver stops normally and there is no occupancy of two parking spaces by one vehicle, the number of remaining parking spaces in the parking lot are guaranteed to be accurate.
- There is no zombie vehicle that has a parking time of more than 24 h in each parking lot, which means the vehicles that remain in the parking space for a long time are not taken into account here to ensure the normal operation of the parking lot, and the nearby residents will not park the vehicle in the parking lot at night to avoid the shortage of spaces in the next morning peak.
- In the process of P&R induction, it is maintained that the route will not be altered after receiving induction, and there is no secondary induction.
- Supposing that the supply of parking spaces can satisfy the parking demand, a car is allocated at most one parking space.
- After the transfer of traffic facilities, supply is sufficient and meets the use requirements.
2.2. Parking Cruise Time
Parking cruise time is the time when the driver seeks the appropriate parking space after entering the off-street parking lot. It can be considered as a time search function . Parking cruise time is usually related to the vehicle occupancy in the carport, and the parking occupancy is the ratio of the total number of vehicles in the parking lot to the capacity of the parking lot.
represents the number of parking spaces in the parking lot ,
represents the arrival rate of vehicles in the parking lot at time ,
represents the departure rate of vehicles in the parking lot at time , and
represents the total number of vehicles in the parking lot at time , where is the reference point of vehicle storage at a given time in the parking lot, namely the initial time of parking guidance.
Usually, the cruise time of the vehicle is related to the current occupancy rate of the parking lot and the parking information obtained by the driver. In reality, the driver usually knows the number of free parking spaces in the parking lot, rather than the accurate information of free parking spaces, assuming that the cruise time of the vehicle in a parking lot depends only on the use of the parking lot and that the driver chooses the parking space randomly. The usual parking cruise time function is shown in Figure 1. When the parking occupancy is at a low level, the vehicle cruise time increases with the occupancy growth, but in general, the vehicle cruise time is relatively stable. When the parking occupancy exceeds a certain value, the vehicle cruise time increases rapidly. When the parking occupancy is close to 1, the vehicle cruise time gradually approaches infinity.
Axhausen et al. [26] proposed an average cruise time function.
represents the time required to search for a parking space in an empty parking lot, and
is an adjustment coefficient, where .
According to the cruise time function, the greater the parking occupancy, the longer the cruise time; the cruise time function is strictly monotonous relative to the parking occupancy.
2.3. Construction of the Cost Function for Park and Ride
P&R means that drivers shift from car travel to public transport—public transport travel includes rail transit, bicycle, and bus travel.
2.3.1. Car Trip without Park and Ride
The single-traffic travel mode under the P&R mainly means that the driver steers the car through the whole journey. The cost of car travel is divided into time cost and charge cost. Among them, the time cost mainly includes the driving time, the parking cruise time, and the walking time after getting off. The charge cost is mainly the parking fee, and the model is as follows:
represents the travel time of the driver from the origin to the parking lot ,
represents the parking cruise time of the parking lot at time ,
represents the walking time from the parking lot to the destination,
represents the parking fee for the parking lot at time , and
represents the value coefficient of the time cost, which can be determined by production method or income method.
2.3.2. Multimodal Travel under Park and Ride
Combined travel mode can comprise the following three travel modes:
- car to rail transit transfer,
- car to rail transit transfer and then transfer to bicycle, and
- car to bus transfer.
These combinations of the travel network are shown in Figure 2.
- Car to the rail transit transfer
The travel cost of the car to rail transit transfer is mainly divided into time cost and charge cost. The time cost includes the driving time of the driver to the transfer parking lot, the parking cruise time, the time of the driver walking to the subway station after getting out of the car, the time of the driver waiting for the subway, the travel time of the driver taking the subway, and the walking time of the driver from the subway station to the destination. The charge cost mainly includes the parking fare and the cost of subway. The model is set as follows:
represents the travel time of the driver from the origin to the parking lot ,
represents the parking cruise time of the parking lot at time ,
represents the walking time from the parking lot to the subway station,
represents the waiting time of a driver at the subway station,
represents the travel time of the driver on the subway,
represents the time when the driver walks out of the subway to the destination,
represents the parking cost for the parking lot at time , and
represents the charge for the driver to take the subway.
- 2.
- Car to rail transit transfer and then transfer to bicycle
Travel costs for this combination of trips is mainly divided into time cost and charge cost. The time cost includes the driving time of the driver to the transfer parking lot, the parking cruise time, the time for the driver to walk to the subway station after getting off, the time for the driver to wait for the subway, the travel time for the driver to take the subway, the walking time from the subway station to the shared bicycle station, the shared bicycle riding time, and the time to walk from the shared bicycle station to the destination. The charge cost mainly includes the fare of parking, subway, and sharing bicycles. The model is as follows:
represents the travel time of a driver riding a shared bike,
represents the time when the driver walks from the shared bicycle point to the destination, and
represents the charge of sharing bikes for drivers.
- 3.
- Car to bus transfer
Travel costs for this combination of trips is mainly divided into time cost and charge cost. The time cost includes the driving time of the driver to the transfer parking lot, the parking cruise time, the time for the driver to walk to the bus station after getting off, the time for the driver to wait for the bus, the travel time on the bus, and the walking time from the bus station to the destination. The charge cost mainly includes the fee of parking and the bus fare. The model is as follows:
represents the waiting time of the driver at the bus stop,
represents the travel time on a bus,
represents the time when the driver walks from the bus stop to the destination, and
represents the charge for the driver to take the bus.
The final expression of individual travel cost function is as follows:
2.4. Park and Ride Selection Model of Driver
In addition to the factors mentioned above, the factors affecting the probability of parking lots are also influenced by the maximum walking distance and the maximum parking fare that individuals can tolerate. Therefore, in order to consider the above constraints, the impedance functions of walking distance and parking fee must be defined, respectively.
The walking distance impedance function represents the ratio of the total walking distance of the driver in a travel to the maximum walking distance that the individual can tolerate. It can be expressed as follows:
represents the total walking distance of the driver from the parking lot to the destination, and
represents the maximum walking distance acceptable to a driver during a trip.
The parking fee impedance function represents the ratio of the parking fee for the parked lot to the maximum parking fee that the individual can tolerate. It can be expressed as follows:
represents the parking fees at the parking lot at time , and
represents the maximum parking fee acceptable to the driver in the parking lot .
For parking interchanges, the tolerance of the driver is different for various locations of the parking lot, and the maximum parking fare acceptable to the driver is different in the city center and in the periphery.
According to the above influencing factors, the parking utility function of individuals is defined as follows:
represents the parking utility of the driver at the moment in the scheme ;
represents the various attributes of the driver, such as gender and monthly income, in which represent the quantity of attributes;
represents the coefficients of driver attributes;
represents the coefficients of driver travel cost;
represents the coefficient of parking fare impedance function;
represents the coefficient of walking distance impedance function; and
represents the constant term of the utility function.
Using the non-aggregate model [27], it is concluded that the probability value of the choice of scheme m at any time is .
2.5. Objective Function
This paper aims not only to fulfill the needs of drivers but also to consider the demands of the parking system’s management; drivers usually choose the parking lot with the highest probability to travel. Since there is a serious uneven hot and cold phenomenon in existing transfer parking lots in China, rather than an insufficiency of the overall parking space, the main goal we considered was to construct a P&R induction model by balancing the utilization rate of regional parking lots.
The equilibrium of parking utilization can be expressed as the minimum variance of parking occupancy in the region at time .
The parking guidance control variable was defined. When the parking space in the parking lot is sufficient, any parking demand should be met in such a way that a single vacancy is allocated to only one driver.
It was stipulated that the parking occupancy rate of the parking lot shall not exceed 1, which means that the storage of vehicles in the parking lot shall not exceed the capacity of the parking lot.
2.6. Dynamic Price Adjustment Method
Since the objective function adopted in this paper was the equilibrium of the occupancy rate, in order to ensure that the driving path can be adjusted in real time, so that the occupancy rate in the region is balanced, the driver could spontaneously enter the expected parking lot, the parking fee was altered with the change of the parking occupancy rate [28,29,30], and the relationship model between the parking fare and the occupancy rate was established.
Driver departure time point were defined as . Driver travel time was designated , which indicates the interval between departure and the parking lot. The real-time price of the parking lot at time was defined as pj(t). It was assumed that there are two parking lots and available for drivers to choose in the travel area.
represents the period when the driver stops in the parking lot. Two parking lots within the same transfer station area that are close in down time can be regarded as . If the driver chooses the car travel, the driver travel costs can be regarded as for the same traveler. Under the same conditions of walking distance and other factors, the probability of the same driver choosing and is almost equal. However, the parking occupancy of different parking lots is different, which leads to the different cruise times for drivers in different parking lots, which can reflect the different parking costs of drivers in different parking lots.
, represents the time taken to arrive at the parking lot j1 and , respectively.
Polarization on both sides of can be obtained.
The purpose of this research was to study a change of parking price in a parking lot with its own parking factor. When studying parking lot , we assumed parking lot as a virtual parking lot and assumed that the parking fee was a constant value. This study postulated that parking fees are charged per unit time. The parking price formula was determined from the above assumptions and Formula (14) as follows:
represents the initial parking price.
According to Formula (15), it can be concluded that in the case of known arrival and departure rates, the parking price can change with the parking occupancy.
The specific iterative solution process is shown in Figure 3.
According to the arrival attributes of all induced vehicles, the travel costs of all drivers in different travel modes were calculated. Combined with the personal attributes of different drivers, the parking lot and vehicle arrival time selected by all drivers were preliminarily determined, and the parking occupancy of each parking lot at the future time point could be predicted. If the variance of parking occupancy in the region was less than a certain value, it would be published according to the guidance information in the current guidance system. If the variance of parking occupancy in the area was greater than the threshold, it iterated again until the variance was less than the threshold.
In this iterative cycle, this paper takes the heterogeneity of the driver into account. In the context of vehicle–road collaboration, it is easy for the parking guidance platform to obtain the parking characteristics of the driver through on-board devices and establish the corresponding feedback mechanism.
2.7. Impact of Parking Ride Induction on Carbon Emissions
The main purpose of parking is to alleviate traffic congestion in the city and reduce the travel time of high-emission travel modes such as cars. This paper discusses the sustainability of a parking guidance strategy based on the theoretical results of carbon emission calculation and measures the contribution of research results to the global carbon peak and carbon neutrality [31].
Among the four travel vehicles involved in this paper, bicycles, as green travel vehicles, have no exhaust emissions. Moreover, the main energy consumption mode of the subway is electricity, there are no exhaust emissions. Therefore, the exhaust emissions of traffic travel in this section mainly originated from the cars and buses.
Carbon monoxide, hydrocarbons, and carbon oxides in the tail gas generated by motor vehicles were the main emission pollutants.
Benedek and Rilett [32] used the TRANSYT-7F average speed function to describe the exhaust emissions in the road traffic network.
represents the emission rate of vehicles on road ;
represents the average speed of all vehicles on the road ; and
are constants.
represents the exhaust gas generation rate, and
represents the length of road segment .
Formula (17) indicates that emissions are related to average vehicle speed and segment length, and Formula (18) indicates that emissions are related to total travel time and road length.
3. Numerical Experiment
In order to verify the effectiveness and applicability of the proposed method, this paper selected some rail transit routes in Shanghai and Shenzhen and built the experimental network.
A questionnaire was designed to establish the parking choice behavior model of commuter drivers [34]. A total of 113 valid questionnaires were obtained through online and offline distribution. Through the processing of the survey data, the maximum travel distance that the driver could tolerate was found to be 728.84 m, and the maximum parking fee per unit time of the parking lot near the destination that the driver could accept was about 5.72 RMB per hour. At present, China encourages P&R by reducing parking fees. Usually, drivers who use the relevant certificates for P&R will be charged the parking fee per unit time for one day, and the maximum acceptable cost of a transfer parking lot is RMB 8 per day.
The statistical analysis software Stata was used to fit the experimental data by binomial logit. According to the experimental results, it was concluded that the actual driving years of the driver, the monthly income of the family, and the number of cars available in the family had a significant impact, and the three factors in the scheme attribute had an important impact on travel.
The fitted function was as follows:
represent the actual driving years of the driver’s, monthly household income, and the number of cars in family, respectively. Refer to Table 1 for details.
3.1. Road Network Based on Shanghai
3.1.1. Experimental Parameter Setting
The numerical experiment period was from 06:00 to 09:10, and the data statistical time interval was 10 min. Assuming that the drivers were commuting at work, there were no leaving vehicles in the parking lot in the experiment, only the phenomenon of vehicle arrival. This assumption is reasonable for morning peak commuting. In order to reflect the experimental road network more truly, it was necessary to assume the experimental conditions and determine the relevant parameters before building the road network.
- Determination of maximum walking distance. The total walking distance that the driver could tolerate was 728.84 m.
- Determination of the maximum parking cost. According to the survey, the maximum parking fee of the parking lot near the destination acceptable to the driver was about RMB 5.72 per hour, and the maximum acceptable parking fare for the transfer parking lot was RMB 8 per day.
- Determination of time value coefficient. Work travel time value of Chinese residents in 2019 α was RMB 54.66 per hour based on Production Methods.
- Subway line determination. When building the subway network, the subway departure time was set to six in the morning, the departure interval of each subway line was 5 min, and the travel time between the two subway stations was about 2 to 6 min.
- The definition of subway fare was based on the number of stations through, and the number of stations was defined as .
- Determination of transfer walking distance in the transfer subway stations. The transfer distance within the subway station was set to 198 m. According to the existing research, the pedestrian walking speed was set to 1.2 m per second [35].
- According to the experimental parameters, Formula (18) was selected to calculate the exhaust emission.
According to the road network situation, the parking lot near 3, 55 stations is selected as the P&R parking lot, and 24 stations are selected as the area near the destination, and two related destination parking lots are set.
3.1.2. Model Solving and Analysis
According to the experimental road network and basic assumptions, there were many constraints placed on the road network. Any linear programming problem has a corresponding dual linear programming problem. In order to reduce the constraints, the dual theory was used to solve the objective equation. In the dual theory, the original problem is symmetric with the dual problem, and the symmetric dual algorithm is used to solve it [36,37]. Combined with Formula (19) and Table 3, Table 4 and Table 5, the distribution of each parking lot was obtained as shown in the Table 6.
Figure 5 and Figure 6 show the arrival of the vehicle in the parking lot near the destination and the transfer parking lot separately, which indicates the time when the vehicle arrives at the parking lot and the corresponding parking occupancy rate and the parking price. After inducing all the vehicles, the change of the parking occupancy rate of each parking lot is shown in Table 7.
It can be seen from Table 7 that the price regulation gave the driver a parking with a low occupancy rate trend. After the application of the induction process, the parking lot with low occupancy rate had larger change rate because the capacity of the 24(b) parking lot was larger than that of the 24(a), so the change rate of the two parking occupancy rates was similar. For specific trends, refer to Figure 7 and Figure 8.
It can be seen from Table 8 that the parking guidance under dynamic price control reduced the number of vehicles entering the city center effectively compared with the parking guidance under static price control, so as to achieve the purpose of alleviating traffic congestion. Under the static price, the destination parking lot reached saturation. However, if there are sufficient parking spaces in the destination parking lot, some vehicles will continue to flow into the city center. Likewise, because P&R reduces the amount of time a car is used, and thus the total emissions of a vehicle, it can reduce carbon emissions by nearly 35% during a commute, making it an environmentally friendly way to travel.
In order to analyze the impact of parking price on the elastic demand of traffic flow, parking lot 3 and 24(b) were selected as the targets to analyze the change of traffic flow demand in the road network. When analyzing parking lot 3, the price of other parking lot was set to dynamic price, and the influence of price on traffic flow demand was analyzed with intervals of RMB 0.5. Specific analysis results are shown in Table 9 and Table 10.
The price fluctuation of parking lot 3 showed a negative elasticity to its own parking lot. The price of its own parking lot increased, and the number of vehicles decreased. It can be seen that the elasticity index was the highest between the RMB 7.8 and 8.8. which corresponded to the maximum price that the drivers could tolerate in the survey, i.e., RMB 8 per day. Other parking lots showed a positive elasticity with the price of parking lot 3. This was because vehicles that did not go to parking lot 3 and went to alternative parking lots according to the dynamic price adjustment. The elasticity index of price changes for these four parking lots was basically greater than 1, which indicated that price had a significant indigenous impact on traffic demand. Among them, parking lot 55 had the largest increase in traffic flow. This may be due to the fact that parking lot 3 and parking lot 55 were transfer parking lots, which could be replaced by each other.
The price fluctuation of the parking lot 24(b) showed a negative elasticity to its own parking lot. The price of its own parking lot increased, and the number of vehicles decreased. It can be seen that the elasticity index was the highest between the RMB 5.6 and 6.1. which corresponds to the maximum price that the driver can tolerate in the survey of RMB 5.72 per hour. Other parking lots showed a positive elasticity with the price of parking lot 24(b). The largest increase in traffic flow was in parking lot 24(a), which may be due to the fact that parking lots 24(a) and 24(b) were the parking lots around the destination, which could be replaced by each other. The impact on parking lot 3 was small, which may be due to the fact that parking lot 3 had reached an equilibrium state.
3.2. Road Network Based on Shenzhen
3.2.1. Experimental Parameter Setting
The experimental method was verified by selecting the Shenzhen rail transit network, which is similar to Shanghai’s rail transit network and has similar economic conditions. The following road network depicted in Figure 9 can be obtained by simplifying the Shenzhen rail transit network. The parameters of parking lot have been completed in Table 11. For the hypothetical road network experimental conditions, refer to Section 3.1.1.
After the parameter setting of the parking lot was completed, the relevant parameters of drivers in the road network were set as shown in Table 3, Table 4 and Table 5; due to the small scale of parking lot, the remaining parking space was limited and the first 50 drivers were selected for induction.
3.2.2. Model Solving and Analysis
Since the traffic conditions and economic development level of Shenzhen are similar to that of Shanghai, according to the Formula (19) and the dynamic price adjustment method, the arrival of vehicles in each parking lot was obtained as shown in Figure 10, which indicated the time when the vehicle reached, the parking lot occupancy rate, and parking lot price at the corresponding time. Finally, the change of parking occupancy in each parking lot and parking guidance at different prices are shown in Table 12 and Table 13 respectively.
It can be seen from Table 12 that the price regulation gave the driver a parking with a low parking occupancy trend. In the process of applying the guidance, the occupancy rate of the parking lot with the lower parking occupancy rate changed faster. As shown in the table, differences in parking occupancy at different price-induced gaps were small, this was because the parking capacity was small, but the static price of parking occupancy variance was about 10 times the dynamic price.
It can be seen from Table 13 that the parking transfer guidance under dynamic price regulation reduced the entry of vehicles into the city center compared with static price regulation and achieved the purpose of alleviating traffic congestion to a certain extent. Price regulation greatly alleviated the parking pressure in the parking lot in the city. Under the static price, the destination parking lot reached saturation. Likewise, as park and ride reduces the use time of the car, thereby reducing the exhaust emissions, which can be reduced by nearly 20% during the commute, it is an environmentally friendly way to travel.
In order to analyze the impact of parking lot price on the elastic demand of traffic flow, the parking lot 68 was selected as the target to analyze the change of traffic flow demand. The price of the remaining parking lot was set as the dynamic price, and the influence of the parking price on the traffic flow demand was analyzed at an interval of RMB 0.5. Specific analysis results are shown in Table 14.
The price fluctuation of parking lot 68 showed a negative elastic state for its own parking lot. The price of its own parking lot increased, and the number of vehicles decreased. It can be seen that the elastic index was the highest between RMB 5.5 and 6.0, which corresponds to the maximum price that the driver can tolerate in the survey, i.e., RMB 5.72 per hour. Other parking lots showed a positive elastic state with the price of parking lot 68. Among them, parking lot 86 changed in the early stage of traffic flow, and the transfer parking lots changed together in the later stage.
4. Conclusions
This paper proposes a probability model of P&R selection for commuter traffic, taking the travel time cost, walking distance, parking cruise time, and personal attributes of drivers into account. With the equilibrium of regional parking occupancy as the optimization objective, this paper studies the parking price adjustment method, and realizes vehicle guidance through price orientation, so as to realize the balanced driving of vehicles into each parking lot. The experimental results show that the dynamic price adjustment promotes the balanced distribution of drivers to each parking lot. The elasticity analysis of different parking lot price fluctuations on traffic demand shows that price adjustment has a great influence on changing traffic flow demand. It can effectively reduce the influx of vehicles into the city center, in order to ensure punctuality to work, to encourage drivers to choose the way of car to rail transit transfer, and to reduce the occurrence of traffic congestion during commuting time, while also decreasing the car travel time, reducing vehicle carbon emissions, and being an environmentally friendly way to travel.
The research results can be used for urban intelligent parking management platforms, all kinds of travel guidance system, etc. Under the background of cooperative vehicle infrastructure, the guidance system can push relevant information to the driver according to their preference, such as parking fees, parking occupancy, travel time, and other information, to achieve the goal of balanced occupancy.
In this study, the influence of the driving behavior of non-induced vehicles and vehicles not controlled by the guidance system on the parking occupancy rate and parking price was not considered, as well as the influence of the adjustment frequency, change frequency, and change range of parking price on the psychology of the driver during the driving process.
Future research can consider refining the calculation methods of vehicle emissions and vehicle fuel consumption and incorporate them into the estimated travel costs. Large sample data can be used to fit the P&R selection model for people in different cities. It is also a need for a qualitative study on the range value of the parking price on the elasticity coefficient of traffic demand, which is conducive to building a smart parking platform and improving the parking guidance system.
Author Contributions
Conceptualization and funding acquisition, L.Z.; data curation and methodology, Z.X.; resources and writing—original draft, T.D.; writing—review and editing, J.X.; software and investigation, F.M. All authors have read and agreed to the published version of the manuscript.
Funding
This research is the Jilin Province Science and Technology Development Plan Project-Young and Middle-aged Science and Technology Innovation Leading Talents and Team Project, Jilin Province Intelligent Transportation Innovation Team (20190101023JH) funded by the Jilin Province Science and Technology Department.
Institutional Review Board Statement
Not applicable.
Informed Consent Statement
Not applicable.
Data Availability Statement
The data presented in this study are available on request from the corresponding author. The data are not publicly available due to [privacy issues].
Acknowledgments
The authors would like to thank the editors for their help and the professors for their guidance so that the paper can be completed.
Conflicts of Interest
All authors disclosed no relevant relationship.
References
- 2018 Traffic Analysis Report of Major Cities in China. Available online: https://report.amap.com/diagnosis/index.do (accessed on 26 September 2021).
- Ando, R.; Yamazaki, M.; Hara, M.; Izuhara, K. An Analysis on Feasibility of Park & Cycle System in a Japanese Local City. Soc. Behav. Sci. 2012, 54, 37–46. [Google Scholar]
- Sina. Available online: http://sh.sina.com.cn/news/b/2016-03-11/detail-ifxqhmvc2305298-p4.shtml (accessed on 26 September 2021).
- Thompson, R.G.; Takada, K.; Kobayakawa, S. Optimization of parking guidance and information systems display configurations. Transp. Res. Part C Emerg. Technol. 2001, 9, 69–85. [Google Scholar] [CrossRef]
- Thompson, R.G.; Richardson, A.J. A parking search model. Transp. Res. Part A Policy Pract. 1998, 32, 159–170. [Google Scholar] [CrossRef]
- Mei, Z.Y.; Tian, Y. Optimized combination model and algorithm of parking guidance information configuration. EURASIP J. Wirel. Commun. Netw. 2011, 2011, 1. [Google Scholar] [CrossRef] [Green Version]
- Molenda, I.; Sieg, G. Residential parking in vibrant city districts. Econ. Transp. 2013, 2, 131–139. [Google Scholar] [CrossRef] [Green Version]
- Ji, Y.J.; Jiang, M.; Wang, W.; Chen, X.S. Multi-layer-based stochastic user equilibrium assignment model under influence of parking guidance variable message sign. J. Southeast Univ. (Nat. Sci. Ed.) 2014, 44, 677–681. [Google Scholar]
- Ji, Y.J.; Wang, W.; Deng, W. Real-Time Decision-Making Method Based on Fuzzy Logic for Parking Reservation. J. South China Univ. Technol. (Nat. Sci. Ed.) 2010, 38, 100–104. [Google Scholar]
- Yang, X.; Fu, Q.; Niu, Z. Bi-level objective model of optimal parking lot recommendation based on parking guidance signs. Appl. Res. Comput. 2014, 31, 3017–3019. [Google Scholar]
- Zou, B.; Kafle, N.; Wolfson, O.; Lin, J. A mechanism design based approach to solving parking slot assignment in the information era. Transp. Res. Part B Methodol. 2015, 81, 631–653. [Google Scholar] [CrossRef] [Green Version]
- Duan, M.Z.; Cao, H.Y.; Dong, B.; Li, S.S. Parking Lots Distribution Model for the Individual Demand. J. Transp. Syst. Eng. Inf. Technol. 2016, 16, 153–159. [Google Scholar]
- Shao, C.; Yang, H.; Zhang, Y.; Ke, J. A simple reservation and allocation model of shared parking lots. Transp. Res. Part C Emerg. Technol. 2016, 71, 303–312. [Google Scholar] [CrossRef]
- He, S.X.; Gao, L. Bi-level Programming Model and Algorithm of Parking Demand Distribution. J. Transp. Syst. Eng. Inf. Technol. 2018, 19, 83–88. [Google Scholar]
- Lu, K.; Lin, M.W.; Deng, X.D.; Xu, G.H.; Xu, J.M. A Dynamic Allocation and Guidance Model for Parking Spaces with Minimum Total Parking Costs. J. South China Univ. Technol. (Nat. Sci. Ed.) 2018, 46, 82–91. [Google Scholar]
- Zhang, W.; Gao, F.; Sun, S.; Yu, Q.; Tang, J.; Liu, B. A Distribution Model for Shared Parking in Residential Zones that Considers the Utilization Rate and the Walking Distance. J. Adv. Transp. 2020, 2020, 6147974. [Google Scholar] [CrossRef]
- Zhao, P.; Guan, H.; Wang, P.; Yan, H. Evaluation of Environmental Benefits Caused by Reservation-Based Shared Parking: A Case Study of Beijing, China. IEEE Access 2020, 9, 3744–3751. [Google Scholar] [CrossRef]
- Han, Z.; Xu, C.C.; Han, S.Q. Wide-area Dynamic Traffic Route Guidance Method Based on Short-term Traffic Flow Prediction. J. Transp. Syst. Eng. Inf. Technol. 2020, 20, 117–123. [Google Scholar]
- Huang, X.; Long, X.Q.; Wang, J.J.; He, L. Research on parking sharing strategies considering user overtime parking. PLoS ONE 2020, 15, 1932–6203. [Google Scholar] [CrossRef] [PubMed]
- Faghri, A.; Lang, A.; Hamad, K.; Henck, H. Integrated Knowledge-Based Geographic Information System for Determining Optimal Location of Park-and-Ride Facilities. J. Urban Plan. Dev. 2002, 128, 18–41. [Google Scholar] [CrossRef]
- Wang, X.G.; Ren, W.; Liu, Z.G. Study on Location Selection of Parking and Ride Facilities in Urban Rail Transit. Modern Urban Rail Transit. 2013, 4, 72–73. [Google Scholar]
- He, Y.J.; Yang, X.K. Planning and site selection of parking facilities in Beijing. Traffic Technol. 2014, 2, 142–144. [Google Scholar]
- Hendricks, S.; Outwater, M. Demand forecasting model park and ride lots in King county, Washington. Transp. Res. Rec. J. Transp. Board 1998, 1, 80–87. [Google Scholar] [CrossRef]
- Bilal Farhan, M.S. Evaluation, Modeling and Policy Assessment for Park and Ride Services as a Component of Public Transportation. Doctor Thesis, Ohio State University, Columbus, OH, USA, 2003. [Google Scholar]
- Wang, X.; Guan, H.Z.; Wang, X. Study on attraction strength of parking facilities. Road Traffic Saf. 2007, 7, 24–26. [Google Scholar]
- Axhausen, K.; Polak, J.; Boltze, M.; Puzicha, J. Effectiveness of the Parking Guidance Information System in Frankfurt/Main. Traffic Eng. Control 1994, 35, 304–309. [Google Scholar]
- Stern, S. A disaggregate discrete choice model of transportation demand by elderly and disabled people in rural Virginia. Transp. Res. Part A Policy Pract. 1993, 27, 315–327. [Google Scholar] [CrossRef]
- Tsamboulas, D.A. Parking fare thresholds: A policy tool. Transp. Policy 2001, 9, 115–124. [Google Scholar] [CrossRef]
- Kelly, J.A.; Clinch, J.P. Influence of varied parking tariffs on parking occupancy levels by trip purpose. Transp. Policy 2006, 13, 487–495. [Google Scholar] [CrossRef]
- Jorge, D.; Molnar, G.; de Almeida Correia, G.H. Trip pricing of one-way station-based cars sharing networks with zone and time of day price variations. Transp. Res. Part B Methodol. 2015, 81, 461–482. [Google Scholar] [CrossRef]
- Zhao, X.; Ma, X.; Chen, B.; Shang, Y.; Song, M. Challenges toward carbon neutrality in China: Strategies and countermeasures. Resour. Conserv. Recycl. 2021, 176, 105959. [Google Scholar] [CrossRef]
- Benedek, C.M.; Rilett, L.R. Equitable traffic assignment with environmental cost functions. J. Transp. Eng. 1998, 124, 16–22. [Google Scholar] [CrossRef]
- Yin, Y. Multi objective bi-level optimization for transportation planning and management problems. J. Adv. Transp. 2000, 36, 93–105. [Google Scholar] [CrossRef]
- Macioszek, E.; Kurek, A. The Analysis of the Factors Determining the Choice of Park and Ride Facility Using a Multinomial Logit Model. Energies 2021, 14, 203. [Google Scholar] [CrossRef]
- Gabe, T. Measurement and analysis of neighborhood congestion: Evidence from sidewalk pedestrian traffic and walking speeds. Growth Chang. 2021, 52, 1633–1651. [Google Scholar] [CrossRef]
- Yang, Q.P.; Zhu, W.Y. Symmetric-Dual Theory and Its Algorithm for D-Optimal Design. J. Northeast. Univ. Technol. 1991, 5, 534–540. [Google Scholar]
- Sun, S.; Zhu, L. Wideband Microstrip Ring Resonator Bandpass Filters Under Multiple Resonances. IEEE Trans. Microw. Theory Tech. 2007, 55, 2176–2182. [Google Scholar]
Figure 1.
Parking search time function based on parking occupancy rate.

Figure 2.
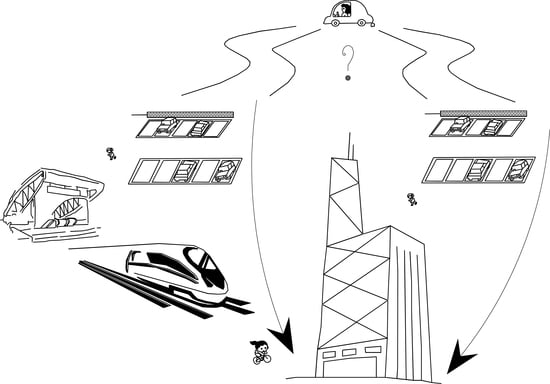
Park and ride network. O represents the origin of travel, P represents the parking lot, and D represents the destination of travel.
Figure 2.
Park and ride network. O represents the origin of travel, P represents the parking lot, and D represents the destination of travel.

Figure 3.
Solution flow chart.

Figure 4.
Numerical experimental rail transit route based on Shanghai.

Figure 5.
The arrival situation of the transfer parking lot.

Figure 6.
The arrival situation of the destination parking lot.

Figure 7.
The trend of the occupancy rate of transfer parking lot.

Figure 8.
The trend of the occupancy rate of the destination parking lot.

Figure 9.
Numerical experimental rail transit route based on Shenzhen.

Figure 10.
The arrival situation of the parking lot.


Table 1.
Symbol of driver’s personal attributes.
| Symbol | Variable | Attributes | Symbolic Value |
|---|---|---|---|
| Actual driving years | Less than one year | 0 | |
| 2–3 years | 1 | ||
| 4–5 years | 2 | ||
| 6–10 years | 3 | ||
| More than 10 years | 4 | ||
| Monthly household income | Less than RMB 5000 | 0 | |
| RMB 5000–10,000 | 1 | ||
| RMB 10,000–15,000 | 2 | ||
| RMB 15,000–20,000 | 3 | ||
| More than RMB 20,000 | 4 | ||
| Number of cars in the family | 1 car | 0 | |
| 2 cars | 1 | ||
| 3 cars | 2 | ||
| More than 4 cars | 3 |
Table 2.
Parameter settings of parking lot.
| 3 (P&R) | 55 (P&R) | 24(a) | 24(b) | |
|---|---|---|---|---|
| Parking lot capacity | 169/260 | 116/200 | 54/120 | 78/150 |
| Initial parking fee (RMB) | 6.3/day | 5.2/day | 3.9/h | 4.1/h |
| Initial parking occupancy rate | 0.65 | 0.58 | 0.45 | 0.52 |
| Distance from parking lot to subway station (m) | 175 | 180 | 120 | 63 |
| 55 | 50 | 42 | 45 | |
| 0.82 | 0.87 | 0.82 | 0.81 |
Table 3.
Driver’s personal attributes.
| No. | Actual Driving Years | Monthly Household Income | Number of Cars in the Family |
|---|---|---|---|
| 1 | 4 | 4 | 3 |
| 2 | 1 | 0 | 0 |
| 3 | 0 | 1 | 0 |
| 4 | 1 | 1 | 0 |
| … | … | … | … |
| 200 | 0 | 2 | 0 |
Table 4.
Driver’s travel attributes.
| No. | Departure Time | Travel Distance from Departure to Parking Lot (km) | Travel Time from Departure to Parking Lot (min) | ||||||
|---|---|---|---|---|---|---|---|---|---|
| 3 | 55 | 24(a) | 24(b) | 3 | 55 | 24(a) | 24(b) | ||
| 1 | 7:25 | 7.59 | 4.26 | 39.23 | 39.44 | 24 | 13 | 92 | 95 |
| 2 | 7:40 | 2.98 | 1.79 | 30.21 | 29.78 | 7 | 5 | 72 | 70 |
| 3 | 7:10 | 7.12 | 3.99 | 45.32 | 44.21 | 22 | 12 | 103 | 99 |
| 4 | 7:35 | 6.58 | 3.02 | 35.67 | 33.71 | 20 | 9 | 85 | 80 |
| … | … | … | … | … | … | … | … | … | … |
| 200 | 7:35 | 7.05 | 6.76 | 62.12 | 62.23 | 22 | 21 | 118 | 118 |
Table 5.
Driver’s travel distances.
| No. | Walking Distance from Subway Station to Destination (m) | Walking Distance from Parking Lot 24(a) to Destination (m) | Walking Distance from Parking Lot 24(b) to Destination (m) |
|---|---|---|---|
| 1 | 142 | 46 | 69 |
| 2 | 68 | 91 | 150 |
| 3 | 84 | 160 | 120 |
| 4 | 55 | 55 | 89 |
| … | … | … | … |
| 200 | 212 | 137 | 96 |
Table 6.
The arrival rate of each parking lot.
| Timetable | 07:00 | 07:10 | 07:20 | 07:30 | 07:40 | 07:50 | 08:00 | 08:10 | 08:20 | 08:30 | 08:40 | 08:50 | 09:00 |
|---|---|---|---|---|---|---|---|---|---|---|---|---|---|
| 3 | 1 | 4 | 9 | 8 | 13 | 11 | 7 | 4 | 0 | 0 | 0 | 0 | 0 |
| 55 | 3 | 9 | 6 | 11 | 17 | 7 | 8 | 2 | 0 | 0 | 0 | 0 | 0 |
| 24(a) | 0 | 0 | 0 | 0 | 0 | 0 | 0 | 0 | 2 | 7 | 8 | 10 | 7 |
| 24(b) | 0 | 0 | 0 | 0 | 0 | 0 | 0 | 0 | 6 | 7 | 9 | 11 | 13 |
Table 7.
Changes of parking occupancy rate.
| Parking Lot ID | 3 | 55 | 24(a) | 24(b) |
|---|---|---|---|---|
| Parking occupancy rate before induction | 65% | 58% | 45% | 52% |
| Parking occupancy rate after dynamic price induction | 86.92% | 89.50% | 73.33% | 82.67% |
| Rate of change | 25.97% | 54.31% | 62.96% | 58.98% |
| Parking occupancy rate after static price induction | 78.85% | 71.00% | 100% | 100% |
| Rate of change | 14.28% | 22.41% | 122.22% | 92.31% |
Table 8.
Comparison of P&R guidance under different price adjustments.
| Dynamic-Price P&R Guidance | Static-Price P&R Guidance | Optimization Rate | |
|---|---|---|---|
| Average cruise time of destination parking lot (min) | 3.49 | ∞ | - |
| Number of vehicles flooding into the city center | 80 | 138 | 43.01% |
| Average vehicle exhaust emission (kg) | 3.86 | 5.83 | 33.79% |
Table 9.
Price elasticity analysis of parking lot 3.
| Parking Price of Parking Lot 3 (RMB) | Parking Demand Elasticity | |||
|---|---|---|---|---|
| 3 | 55 | 24(a) | 24(b) | |
| 6.3 | - | - | - | - |
| 6.8 | 10.14 | 3.39 | 3.30 | |
| 7.3 | −1.11 | 4.55 | 3.41 | 3.24 |
| 7.8 | −4.59 | 13.70 | 10.86 | 4.93 |
| 8.3 | −9.05 | 7.04 | 14.63 | 9.65 |
| 8.8 | −3.91 | 0.71 | 7.07 | 4.78 |
Table 10.
Price elasticity analysis of parking lot 24(b).
| Parking Price of Parking Lot 24(b) (RMB) | Parking Demand Elasticity | |||
|---|---|---|---|---|
| 3 | 55 | 24(a) | 24(b) | |
| 4.1 | - | - | - | - |
| 4.6 | 0.35 | 2.21 | 10.38 | −8.35 |
| 5.1 | 0.88 | 2.37 | 5.03 | −11.56 |
| 5.6 | 0.89 | 9.51 | 5.17 | −20.98 |
| 6.1 | 0.73 | 13.63 | 17.21 | −62.77 |
| 6.6 | 0.00 | 4.39 | 2.49 | −12.78 |
| 7.1 | 0.21 | 2.19 | 2.48 | −15.00 |
Table 11.
Parameter settings of parking lot.
| 65 (P&R) | 86 (P&R) | 68 | |
|---|---|---|---|
| Parking lot capacity | 33/60 | 26/50 | 12/30 |
| Initial parking fee (RMB) | 5.0/day | 4.5/day | 3.0/h |
| Initial parking occupancy rate | 0.55 | 0.52 | 0.40 |
| Distance from parking lot to subway station(m) | 78 | 92 | 40 |
| 50 | 52 | 46 | |
| 0.85 | 0.90 | 0.82 |
Table 12.
Changes of parking occupancy rate.
| Parking Lot ID | 65 (P&R) | 86 (P&R) | 68 |
|---|---|---|---|
| Parking occupancy rate before induction | 55% | 52% | 40% |
| Parking occupancy rate after dynamic price induction | 85.00% | 90.00% | 83.33% |
| Rate of change | 54.55% | 73.01% | 108.33% |
| Parking occupancy rate after static price induction | 83.33% | 80.00% | 100% |
| Rate of change | 51.51% | 53.85% | 150.0% |
Table 13.
Comparison of P&R guidance under different price adjustments.
| Dynamic-Price P&R Guidance | Static-Price P&R Guidance | Optimization Rate | |
|---|---|---|---|
| Average cruise time of destination parking lot (min) | 3.77 | ∞ | - |
| Number of vehicles flooding into the city center | 13 | 18 | 27.78% |
| Average vehicle exhaust emission (kg) | 2.82 | 3.52 | 19.89% |
Table 14.
Price elasticity analysis of parking lot 68.
| Parking Price of Parking Lot 68 (RMB) | Parking Demand Elasticity | ||
|---|---|---|---|
| 65 | 86 | 68 | |
| 3.0 | - | - | - |
| 3.5 | 0.00 | 0.44 | −0.41 |
| 4.0 | 1.07 | 0.24 | −1.07 |
| 4.5 | 0.00 | 0.50 | −0.64 |
| 5.0 | 1.43 | 0.53 | −4.00 |
| 5.5 | 1.38 | 0.00 | −4.71 |
| 6.0 | 0.92 | 1.14 | −16.00 |
Publisher’s Note: MDPI stays neutral with regard to jurisdictional claims in published maps and institutional affiliations. |
© 2021 by the authors. Licensee MDPI, Basel, Switzerland. This article is an open access article distributed under the terms and conditions of the Creative Commons Attribution (CC BY) license (https://creativecommons.org/licenses/by/4.0/).
Share and Cite
MDPI and ACS Style
Zheng, L.; Xie, Z.; Ding, T.; Xi, J.; Meng, F. Parking and Ride Induction Methods for Drivers in Commuting Scenes. Symmetry 2021, 13, 2176. https://doi.org/10.3390/sym13112176
AMA Style
Zheng L, Xie Z, Ding T, Xi J, Meng F. Parking and Ride Induction Methods for Drivers in Commuting Scenes. Symmetry. 2021; 13(11):2176. https://doi.org/10.3390/sym13112176
Chicago/Turabian StyleZheng, Lili, Zifang Xie, Tongqiang Ding, Jianfeng Xi, and Fanyun Meng. 2021. "Parking and Ride Induction Methods for Drivers in Commuting Scenes" Symmetry 13, no. 11: 2176. https://doi.org/10.3390/sym13112176
Note that from the first issue of 2016, this journal uses article numbers instead of page numbers. See further details here.