1. Introduction
Environmental sustainability encompasses actions to ensure the health and continuation of ecological systems so that people can meet their current needs without compromising the resources available for future generations to meet their needs [
1]. Growing public concern about the environment, increasing emphasis on corporate social responsibility, and introduction of an array of government policies and regulations on sustainability issues have made environmental sustainability one major concern for individuals, corporations, societies, and governments around the world [
2,
3,
4]. For businesses, environmental sustainability reflects on the concept of triple bottom line—organizational performance should comprise economic, environmental, and social dimensions [
5,
6].
Generally, to maintain environmental sustainability, people can increase use of renewable resources, control use of nonrenewable resources, and reduce pollution (e.g., carbon emissions). In fact, the European Union targets 20 percent renewable energy use by 2020 [
7]. One of the most promising practices in this aspect is pursuing reliable wind energy. In addition, the American Recovery and Reinvestment Act of 2009 amended the U.S. Energy Policy Act of 2005 authorizing loan guarantees for innovative green technologies.
Information systems (IS) can and should play an important role with respect to environmental sustainability (e.g., increasing the supply and use of renewable energy). In the context of environmental sustainability, this study refers to the IS success model [
8,
9] to investigate whether quality aspects of a green IS lead to their stakeholders’ use and satisfaction, which eventually lead to outcomes (or net benefits) such as pollution reduction, better resource utilization, and effective government policies. With this theoretic support, we empirically validated the concept that the use of IS induced by good quality aspects can provide perceived benefits for sustainability issues. Our findings have important implications on how to enhance IS and to induce better use and satisfaction. These findings lead to a better understanding of the benefits of using IS and can provide energy policymakers, regulatory bodies, and decision makers a framework for educating the public in taking actions to contribute to environmental sustainability. Along this direction, we further present research propositions (see
Appendix A) to direct future research towards understanding how benefits from a green IS can be utilized to advance environmental sustainability.
The remainder of the paper is organized as follows. We first discuss the background of IS within a green context and then present a theoretical framework for our research based on the IS success model. Next, we outline our case study methodology, where we examine the IS success model of regional mesonet (for blind review purposes only) users to examine how benefits are realized in the context of environment sustainability. We conclude with discussion of the results, their implications, and limitations and directions for future research.
2. IS/Sustainability and Theoretical Background
While there has been extensive coverage of environmental sustainability issues across multiple business disciplines [
10,
11], the information systems (IS) field and IS community have also dedicated efforts for research on IS and environmental sustainability. Watson et al. [
2] advocate a research agenda to establish a new subfield of energy informatics. Likewise, Melville [
10] suggests that “information systems research can make an important contribution to knowledge at the nexus of information, organizations, and the natural environment; to the development of innovative environmental strategies; to the creation and evaluation of systems that break new ground in environmental responsibility; and, ultimately, to the improvement of the natural environment” (Page 1). At the same time, Watson et al. [
2] also states that “It is our responsibility, as IS scholars, to dedicate some of our research efforts to better understand (in terms of description, explanation, and prediction) the role of IS in tackling environmental sustainability” (Page 24).
One noteworthy professional society, environmental Informatics, has incorporated two world-changing developments—environmental science and information and communication technology (ICT)—with conferences, numerous tools, studies, publications, and resources of research. The seminal International Conference on Environmental Informatics (EnviroInfo) has been held since 2001 (with its predecessor conference in German was launched in 1987) supporting this important scientific community and producing meaning research outputs in conference proceedings, edited books and journal papers (e.g., [
12,
13,
14,
15]). The introduction of the most recent and upcoming EnciroInfo 2021 truly states well: “The EnviroInfo 2021 is the 35th edition of the long standing and established international and interdisciplinary conference series on leading environmental information and communication technologies. The conference is open for contributions covering innovative topics at the interface between informatics and environmental research” [
16].
Research on IS and environmental sustainability surely can jointly offer a rich and interesting domain application of growing social and economic significance, and represents an emerging need, as well as an opportunity to participate in advancing environmental sustainability [
17]. The importance of this direction and continuous endeavor is evidenced by publications of special issues of major IS journals, such as MIS Quarterly
Information Systems and Environmental Sustainability (Volume 37, 4 Number 2013),
Journal of the Association for Information Systems (JAIS), Information Systems Solutions for Environmental Sustainability (Volume 17, Issue 8, 2016),
Information Systems Journal “Green IS” (Volume 27, Issue 4, 2017), and
Journal of Systems and Information Technology “Sustainability and Information Systems” (Volume 10, Number 3, 2008). In addition, the journal
Sustainability has devoted numerous past and upcoming special issues for studies essential to IS, ICT, and sustainability. In addition, many important past and current publications demonstrate that IS can and should play an important role with respect to environmental sustainability [
18,
19,
20,
21,
22,
23,
24,
25,
26,
27,
28,
29].
Chen et al. [
18] encourage IS scholars to explore how information systems can help organizations develop ecological sustainability. Elliot and Webster [
21] promote research which aims to demonstrate how IS can be a source of empirical solution to a range of environmental challenges including a diversity of environmentally sustainable practices. Specifically, Seidel et al. [
22] point out that further research should be pursued toward “how IT impacts—and is impacted by—the context in which it is used”, and therefore “one must consider the impact of information systems on environmental sustainability alongside traditional measures of IS outcomes such as net benefits [
9], p. 43”. To our knowledge, our study is the first one to answer their call to apply IS Success Model in the context of environmental sustainability. We describe our theoretical framework in the context of the IS success model.
IS Success Model
DeLone and McLean [
8] originally introduce the IS success model that provides a comprehensive taxonomy of the dimensions of IS success. Subsequently, they offer a minor re-specification of the IS success model with an addition of the dimension of service quality and an introduction of the construct, net benefit, which replaces individual and organizational impacts [
9]. With the use of net benefits construct, the updated model can capture IS impacts (which can be both positive and negative) at multiple levels from individuals, groups, organizations and even society [
9]. Since the introduction of the original and updated IS success models, numerous conceptual and empirical studies have been conducted using these models to advance the understanding of IS success and the utilitarian aspect of IS. Later, Petter et al. [
30] conduct a comprehensive literature review that summarizes measures applied to the evaluation of IS success and examines relationships among constructs in the IS success models.
While green IS and green information technology (IT) are sometimes used interchangeably (e.g., [
31]), we define a green IS as a combination of hardware, software, communication devices, network, data resources, people, and agencies that processes (e.g., retrieve, store, transform, disseminate) data and information to facilitate planning, control, coordination, and decision making concerning sustainability issues (i.e., environmental, economic, and societal issues). Likewise, Boudreau et al. [
32] refer to green IS as the design and implementation of information systems that contribute to sustainable business processes. In practice, many firms have implemented environmental management systems (EMS) to monitor, evaluate, improve, and communicate environmental performance—including information baselines on inputs (energy, water, materials, etc.) and output (waste, emissions, etc.) [
33]. For example, Wybrands et al. [
15] investigated an information system for water management in the context of sustainability. In our study, a complicated EMS, regional mesonet (RM) which collects and disseminates meteorological and agricultural-related data for multiple stakeholders, is investigated for its impact on various usages related to environmental sustainability. Data collected and then analyzed by such EMS can be used for environmental decision-making and improvement practices.
While early adopters and users of green IS claim anecdotally that they have enjoyed the benefits, there is a need to scientifically measure the success of green IS with empirical data. At the same time, understanding the potential (or anticipated) impacts of green IS and providing a framework for building green IS are important steps toward advancing IS as a solution for environmental sustainability. In fact, Gable et al. [
34] describe the impact of IS as the stream of net benefits to date as well as perceived benefits. Therefore, as a first step, we adopt the IS success model for evaluating critical dimensions of utilitarian aspect of green IS success. Second, for the net benefit construct, we ensure that the model for identifying and measuring value of green IS takes into account the full range of impacts from the direct financial impacts to the broader societal level benefits as suggested by Schoormann and Kutzner [
25].
In the context of green IS, strengthened and positive beliefs towards the use and benefits of green IS may induce favorable intention and behavior from more stakeholders of environmental sustainability. Therefore, we conjecture that demonstrated benefits from the use of green IS can serve as an enabler for forming positive beliefs and attitudes. From this perspective, green IS can help pursue environmental sustainability by informing stakeholders and then changing their attitude/belief, providing guidelines and information to induce and motivate positive actions at different levels (e.g., individuals, organizations, societies), and deriving net benefits and positive outcomes for achieving sustainability with enabled practices and processes.
3. Research Hypotheses
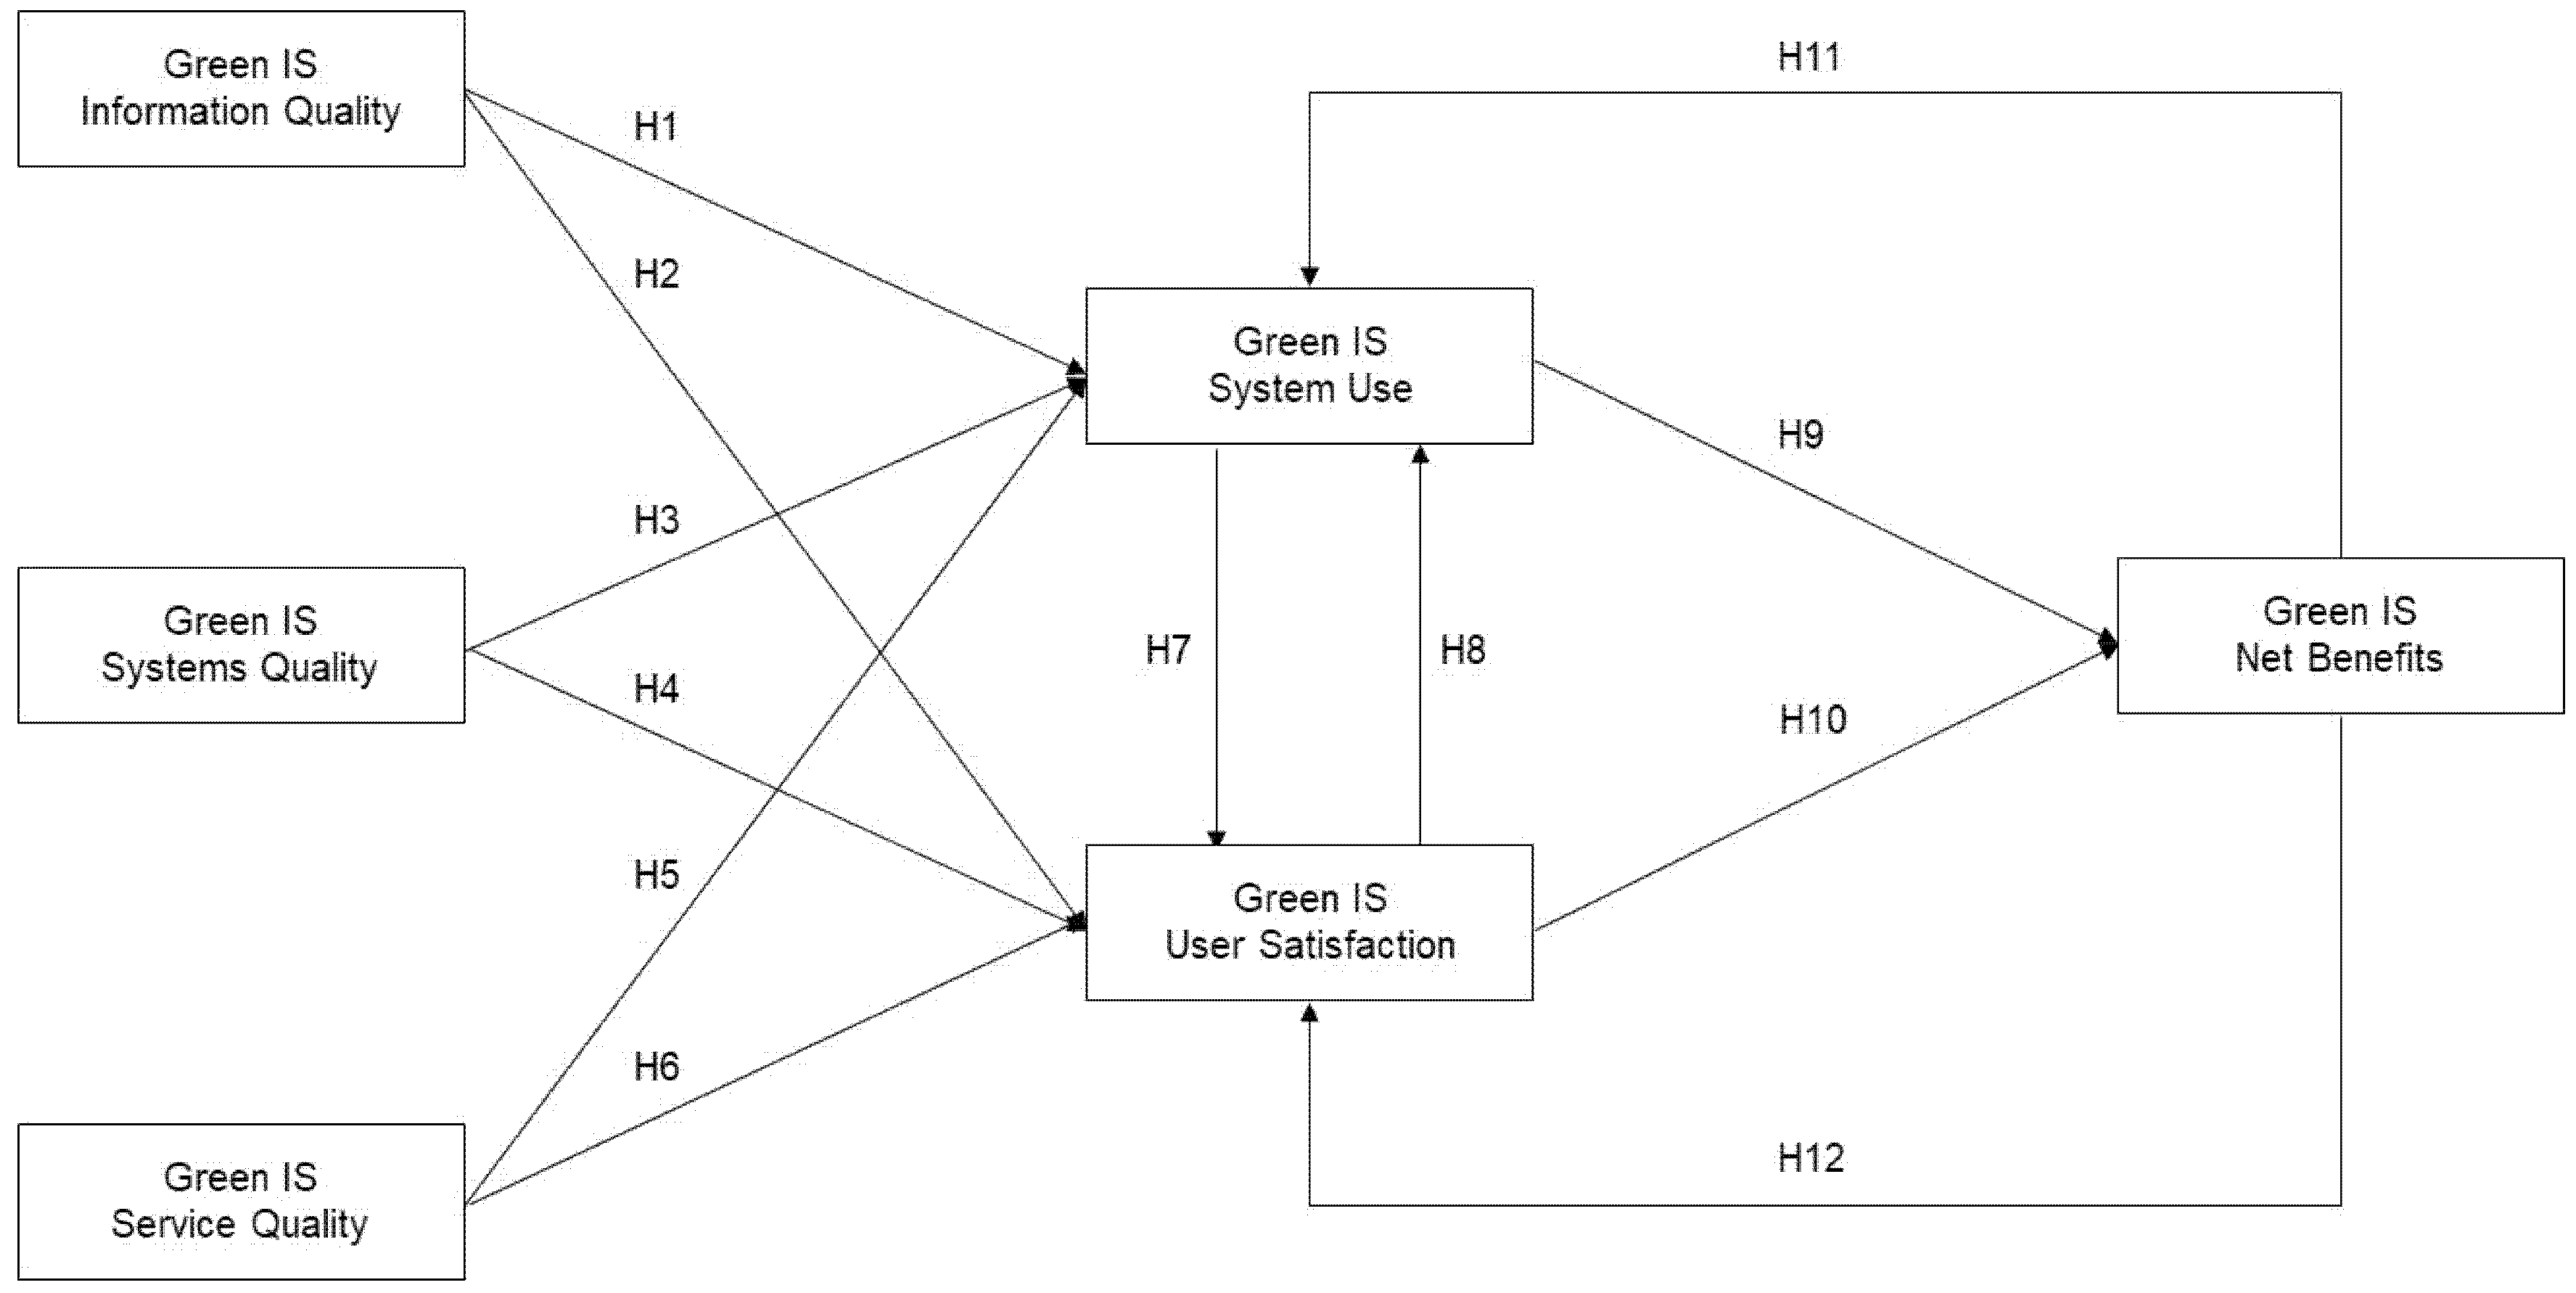
In the context of green IS, we examine the IS success model (see
Figure 1 with notations of our hypotheses) and its contribution to environmental sustainability. First, green IS needs to be of high quality with its functionalities, service, and information and these systems need to provide actual benefits for stakeholders. Second, there is a need to have a mechanism to distribute relevant knowledge (e.g., successful cases and proven benefits of green IS) to further inform the public and governments. This, in turn, will serve as a catalyst to change or form beliefs of stakeholders and society in general concerning environmental sustainability. Third, these behavior and normative beliefs which develop an environmentally literate public should be converted to actions of having more green IS in place to facilitate achievements of environmental sustainability goals. Past studies on sustainability mainly emphasized the importance of environmental sustainability and proposed different approaches to address issues with sustainability only (e.g., [
17,
35]). We can extend this research area conceptually and further empirically investigate the net benefits of the use of green IS and potential impact of further actions induced by these benefits.
For the green IS success model (
Figure 1), we follow definitions from Petter et al. [
30] to provide descriptions of the constructs. At the same time, characteristics that are specific to environmental sustainability and regional mesonet are also specified and developed into hypotheses.
Information quality represents the desirable characteristics of the green IS output. We presented two dimensions in the paper: availability and usability that are consistent with factors validated and used by Ifinedo [
36] and Sedera et al. [
37]. For studies of IS success model, relationships between information quality and both use, and user satisfaction, are always examined. At the organizational level (such as the RM context), the quality of information of an IS provided to internal and external users is an important factor to induce their use and satisfaction. Fitzgerald and Russo [
38] find a positive relationship between information quality and system use of “supporters (stakeholders)”. Scheepers et al. [
39] conduct a case study and find an association between information quality and user satisfaction. In the context of green IS, Smart et al. [
40] show that information quality as well as ease of use and system quality affects satisfaction with carbon management system (CMS). Based on past IS studies, we developed the following hypotheses of the green IS success model:
Hypothesis 1. Information quality relates positively to system use.
Hypothesis 2. Information quality relates positively to user satisfaction.
System quality corresponds to the desirable characteristics of the actual system (i.e., green IS). IS researchers have long been interested in what constitute desirable characteristics of an information systems and what impacts will be derived from these characteristics. Different factors and measures of system quality have been proposed and studied (e.g., [
41,
42]). For the impacts of system characteristics, Fitzgerald and Russo [
38] find that improved system quality is positively related to subsequent system use. Benard and Satir [
43] find that functionality of an executive IS is significantly related to user satisfaction. As such, we developed the following hypotheses of the green IS success model:
Hypothesis 3. System quality relates positively to system use.
Hypothesis 4. System quality relates positively to user satisfaction.
Service quality signifies the quality of the support that green IS users receive. Since the incorporation of the service quality construct in the updated DeLone-McLean IS success model, few studies examine the relationships between service quality and use and satisfaction. For example, measured by the effective role of technical staffs, service quality is positively related to system use [
38]. Thong et al. [
44] find that higher levels of consultant effectiveness and vendor support are related to higher levels of user satisfaction. Smart et al. [
40] show that ease of use (service quality), system quality, and information quality affect satisfaction with carbon management system (CMS). As such, users (stakeholders) of a green IS are not only the primary consumers but also the drivers of demand for access to environmental and sustainability-related information. Based on the literature, we developed the following hypotheses of the green IS success model:
Hypothesis 5. Service quality relates positively to system use.
Hypothesis 6. Service quality relates positively to user satisfaction.
Users (stakeholders) of a green IS are not only the primary consumers but also the drivers of demand for access to and use of environmental and sustainability-related information. Bokhari [
45] in a meta-analysis find that there exists a significant positive relationship between system usage and user satisfaction. Other studies show the correlation between user satisfaction and use but are not clear on directions (e.g., [
30]). We suggest the following hypotheses of the green IS success model:
Hypothesis 7. System use relates positively to user satisfaction.
Hypothesis 8. User satisfaction relates positively to system use.
Finally, net benefits correspond to the extent to which green IS are contributing to the success of users’ organizations and potentially broader contexts. Petter et al. [
30] call for researchers to consider studying the concept of net benefits beyond the individual level. Therefore, in the context of green IS, we propose to measure the net benefits of organizations that utilize outputs of green IS as well as the net benefits of society and the environment that gains from the use of outputs of green IS. We intend to shed light on green IS post-implementation challenges, critical success factors, and impacts.
Net benefits of green IS cannot be captured by traditional individual or organizational impacts only and need to be elevated to societal and ecological levels. In order to gain a rich understanding of the benefits of IT investments, balanced perspectives incorporating multiple levels of both hard and soft measures are needed [
46]. These benefits may exist at multiple levels, including the company, community and global natural environment, but failure to take them into account may cause organizations to miss out on promising opportunities [
47].
Past IS studies generally showed moderate support for the relationship between system use and organizational benefits as well as strong support for the relationship between user satisfaction and system benefits [
30]. We are interested in testing the following hypotheses of the green IS success model:
Hypothesis 9. System use relates positively to net benefits.
Hypothesis 10. User satisfaction relates positively to net benefits.
IT in and of itself is not inherently good or bad for the environment; rather, it is how individuals, organizations and society make use of information technology and systems that determines its impacts [
35]. Studying an executive information system, Belcher and Watson [
48] find that benefits of such a system encouraged continued use of the system. Net benefits (measured by perceived benefits in Jones and Beatty [
49] and organizational impact in Teo and Wong [
50]) were also found to be significantly related to user satisfaction with the system. This suggested the following hypotheses of the green IS success model:
Hypothesis 11: Net benefits relate positively to system use.
Hypothesis 12: Net benefits relate positively to user satisfaction.
IS success literature leads to the development of several (testable) hypotheses. However, public perceptions and beliefs can play an important role in making the types of investment needed to sustain such systems and to demonstrate their role on environmental sustainability. This is especially important considering recent findings that renewable energy use significantly impacts the performance of an economy [
51]. Therefore, we further present two propositions (see
Appendix A) to direct future research in this aspect.
4. Research Design
Following Kern’s [
13] study which has a focus on software users of students, practitioners, and IT managers, we first conducted an exploratory test using survey data of students (non-users or future users) with the proposed green IS success model and confirmed that the relationships among constructs as well as the nomological networks still hold when a green IS is used for the focus of environmental sustainability (see
Appendix B for the survey instruments and
Appendix C for description of results). As such, we further employed case studies of expert users (practitioners and IT managers) to examine the IS success model on the benefits within a green context (i.e., environmental sustainability). This approach provided us with a separate but richer dataset to evaluate the green IS success model and the role that benefits may play on future use. This design employs qualitative methods by providing supporting evidence of the green IS success model, but also providing a better understanding of (1) the actual benefits of the regional mesonet and how such benefits are realized and (2) whether benefits of green IS may induce and advance the use of green IS.
Along with suppliers and the government, consumers are the important stakeholders in a typical energy system because they bear the ultimate cost of all energy consumption [
2]. As well as being concerned about energy costs, some consumers, have become activists for sustainability and have pressured suppliers and governments to reduce energy usage and the byproducts of such usage as carbon emissions. Interestingly, this highlights a major shortcoming in the current green IS literature—the role of perceptions of citizens and their perspectives on green IS or green IT. For example, what are the perceived benefits of green IS from all stakeholders? The answer to this question would impact future investments, infrastructure, and policy developments related to such systems.
4.1. Description of the Regional Mesonet
In this study, we investigated a particular IS (equipped with information- and communication-based technologies and a comprehensive information system) known as the regional mesonet. The regional mesonet (RM) is a system of 60 surface meteorological stations operated and maintained by a team of atmospheric scientists and wind engineers at a local university. The RM has been operational since 2000 for collecting and disseminating meteorological and agricultural-related data. The type of data collected has practical applications for a variety of users in the agricultural, water conservation, severe weather (National Weather Service), and wind energy sectors, to name a few [
52]. For example, major wind energy companies are interested in understanding wind characteristics for building major wind farms, constructing better facility layouts, enhancing turbine design, and improving overall operations. Along with these major energy companies, there are local land owners, farmers, and ranchers that use the RM to determine such things as optimal times for fertilizing, planting, and watering crops. Moreover, various state and local government agencies employ the data generated by the RM for severe weather, grass fire warnings, water conservation, and to create better policies for resource usage. However, the capabilities of green IS, which develop and disseminate environmental sustainability related information to potential stakeholders are not widely recognized or well understood.
While general environment management information systems (EMIS) are developed mainly to collect data for internal users to support mandated reporting requirements and aid in the enforcement of compliance with standards [
17], the RM is designed for a variety of external users. In fact, the RM is one of a few green IS that encompasses all three dimensions of “greenness” as described by Ijab et al. [
53]: the “spirit” is inscribed during the design and development process, it gets appropriated faithfully by the users in “practice”, and generates measurable eco-sustainability benefits (“impacts”). The RM falls into the category of a high-performance information system in a technical context defined by the over-abundance of geographic sources of information, the development of environmental diagnostic tools, and the management of spatialized information that adequately facilitates decision makers’ sharing of, and access to, useful information [
54].
The RM is an integrated system [
2], which has several important functions such as collecting data from individual stations (i.e., sensor network), transmitting data, supplying information to users and consumers about the consumption of resources within their control, managing supply and demand to minimize usage, and supplying comparative information (neighboring stations) to users and consumers so they can benchmark their efforts. For this study, we test the validity of the IS success model in the context of RM, a green IS.
4.2. Case Study and Data Collection
We conducted case studies to gain an in-depth understanding of expert RM users’ views on how benefits can be realized from the use of green IS (e.g., RM). In the process, we used designed questions with the IS success model in mind to understand the link between its constructs and the benefits of IS in a green context.
First, we talked with the operations manager of the RM, who provided us with a list of RM expert users to contact. We conducted seven interviews with eight informants from six different organizations including a utility company, city government, fire department, National Weather Service, university, and RM; one interview included two informants. Each interview period was about 40 min long and recorded based on informant’s consensus. We asked informants about their use of the RM and their actual or perceived benefits from societal, environmental, and organizational perspectives.
Appendix D presents the interview protocol.
4.3. Data Analysis
The process of data analysis involves three iterative coding schemes (i.e., selective, open-ended coding, and axial coding) [
55,
56]. First, open-ended coding was used to identify new codes as they emerged from interview transcripts. Second, axial coding is the process of “relating categories to their subcategories and link categories at the level of properties and dimensions” [
55], p. 123. Third and finally, selective coding is the process through which the researchers identify the key category and integrate the categories around the key categories to form a storyline. Because the linkages among categories can be very subtle and implicit, a coding paradigm involving conditions, context, action/interactions and consequences can help to organize the connections among the categories [
55].
Face-to-face interviews were conducted by the researchers in this study. Structured and semi-structured questions were asked during the interviews. Interview questions include general questions asking environmental sustainability issues, ways to achieve environmental sustainability and more specific questions looking for their perceptions on various quality issues of green IS (RM), their use and satisfaction of the RM, and net benefits of using the RM. The interviews were audio-recorded and notes were taken by the researchers during each interview. The interviews were transcribed and analyzed following the three iterative coding process (e.g., selective coding, open-ended coding, and axial coding).
In this initial stage of data analysis (selective coding), the researcher reviewed the interview transcripts and looked for “discrete incidents, ideas, events, and acts” and then gave names (called “conceptual labels”) for those concepts [
55], p. 105. Throughout the data analysis, the researcher performed constant “comparative analysis”. That is, when the objects, events, acts, or happenings shared some common characteristics, they were grouped together to form a category that captures their shared characteristics. Next, these coded segments were subsequently regrouped and assigned new codes that categorized users’ perceptions on RM in the open-end coding process. Finally, axial coding is the process of “relating categories to subcategories along the lines of their properties and dimensions” [
55], p. 124. By relating categories with each other, one can answer questions about the phenomenon such as when, where, why, who, how, and with what consequences, thus giving the concept greater “explanatory power” [
55], p. 125. We discuss the results derived from axial coding in the next section.
5. Case Study Findings
Following the principles of open coding [
55], two researchers went through all the interview transcripts and notes taken by the researchers during the interviews, and identified a list of concepts from the raw data. The researchers compared the concepts that emerged across different participants and multiple data resources for validation. For example, concepts that emerged from the interview transcript of Participant A were corroborated with the interview transcript of Participant B. Triangulation across researchers helps to strengthen the emerging concepts. Prior literature was used for “supplemental validation” [
57], p. 209. That is, references from prior literature gave validation for the accuracy of the findings and helped in naming the concepts. Through discussions, the two researchers reached a consensus on the concepts identified from the data, as well as the naming and phrasing of the concepts. The two researchers then reviewed all concepts and categorized the concepts into categories based on similar characteristics shared among the concepts. The results of the open coding were organized into the following categories: environmental sustainability, information quality, system quality, service quality, system use, user satisfaction, and net benefits.
5.1. Users’ Perception of Information Quality of the RM
Information quality represents the desirable characteristics of the green IS output. Through the interviews, six dimensions of information quality were suggested by informants: accessibility, real-time data, availability, accuracy, usability, and relevance. These dimensions are consistent with factors validated and used by Ifinedo [
36] and Sedera et al. [
37]. We presented two dimensions in the paper: availability and usability.
Informants consistently mentioned that availability and ease of use were two key criteria of information quality of RM. According to various informants, while the availability of the data was substantial, informants across organizations also indicated that they wanted RM to expand geographically:
RM data are available online 24/7. I would like to see the entire state of Texas covered with the mesonet. The denser the network, the more, the better. Our experience is that the RM system is fairly robust. And we have talked about having (RM towers) in Vega, Sims, out west, but money is limited. Oh, if it expanded across the state, I can see it being beneficial to other offices.
As for the usability dimension of the RM, informants indicated that the system was easy to use even though there may be a need for some customization:
The data is absolutely easy to use. But it is probably self serving. We have written a lot of code to bring it in a useable format. We have the data coming directly in (raw) and then we customize for our use. We put them in our computer system directly. I have software that runs on his site to make it available on the web (products).
Informants also consistently conveyed to us of their satisfaction of the information quality aspect of the RM.
It (RM data) is very good, very timely! The data is so reliable, top notch.
The availability of the data, the accuracy of the data, and the integrity of the data is incredible. The (RM) data is very relevant, up-to-date, and easy to use.
For studies of IS success model, relationships between information quality and both use and user satisfaction are always examined. At the organizational level (such as the RM context), the quality of information of an IS provided to internal and external users is an important factor to induce their use and satisfaction. Based on our findings of information quality of the RM, we find support of H1 and H2.
5.2. Users’ Perception of System Quality from the RM
System quality corresponds to the desirable characteristics of the actual system (i.e., green IS). Informants consistently regarded system quality as one of the major success factors for the RM. In fact, they indicated the following dimensions of system quality: reliability, ease of use, easy to learn, accurate data, flexibility, features, data integrity, and customization during the interviews:
Overall the internet network is more reliable than the stations that are on the radio network. The RM is so reliable, top notch now.
On the dimension of data accuracy, several informants across different organizations agreed that the data provided by RM was accurate:
The accuracy of the data (from RM) is incredible. It (RM) is in a good location. There is nothing blocking it. RM provides very accurate data. All the other instruments (for data gathering) are rugged and able to withstand the elements well.
We also found that informants unanimously expressed that they were satisfied with the high system quality of RM and would keep using it frequently. One informant explained that high system quality of the RM attracted a lot of users from various kinds of organizations:
The governmental aspect such as the National Weather Service use real-time data for warnings or to issue warnings. For the universities, they use it for research! For the private side, it is mainly used for agriculture, namely farmers. Cotton and peanut farmers use the mesonet; they use it especially now and then when it rains. Most of the wind power use of the mesonet is for historical purposes used by local utility companies.
In the interviews, informants also mentioned system quality and their satisfaction of RM:
I have been happy with it (RM). Once you train someone to go get it (RM), it’s easy. It (RM) helps with verification. It (RM) is available online 24/7. I don’t see any problems (with RM).
IS researchers have long been interested in what constitute desirable characteristics of an information systems and what impacts will be derived from these characteristics. As such, we find evidence that supports H3 and H4.
5.3. Users’ Perception of Service Quality from the RM
Service quality signifies the quality of the support that green IS users receive. Informants identified seven dimensions of service quality of the RM including adequate technical support, credibility and trustworthiness, reliability, responsiveness, dependability, personal attention, and quality services. We provided excerpts for responsiveness and personal attention from different informants in the interviews we conducted:
We just work together. There are so many stations and so much data and the operations manager will detect something is wrong before we (NWS) do. I don’t know how he does it.
The RM operations manager is always on top of the situation. He will know or have left a message asking if we want a (weather) balloon when we get back from our meeting discussing whether we want to launch a balloon or not. Any time the system is down, he usually knows before we do. More quickly than I think they could.
Informants consistently stated that the service quality of RM had them hooked using the RM and were very satisfied with it:
As for as I know, the (RM) staff is excellent. RM is high quality, reliable data. It is timely and for what is collected, it is highly reliable. The network (RM) over our area is considered (to be) very good. We just work together. Almost like we are a team. I will end with this. I think the mesonet shows incredible forethought to make such an investment. Great demonstration or pilot program. Having the vision is something to be proud of.
Based on our evidence, we find evidence that supports H5 and H6.
From our exploratory interviews, informants stated that their use of the RM resulted in their satisfaction and their satisfaction of RM increased their level of using the RM, suggesting support of H7 and H8.
5.4. Users’ Perception of Net Benefits of Using the RM
Net benefits correspond to the extent to which the green IS are contributing to the success of users’ organizations and beyond (government, society, and environment). Five dimensions of net benefits were harvested from informants and they were positive organizational impact, green energy use, progressive public policy, positive societal impact, and positive sustainability impact.
In terms of positive organizational impact, several informants that used the RM in different ways describe the net benefit:
It (the lack of RM data) could put people in danger. It could put firefighters in danger. We could have wind shifts and not know. It can really cause problems and people can get hurt.
From an agricultural standpoint, you look at soil temperatures to when you plant the crop, rainfall rates, soil moisture content, and evaporation rates. This (RM) data help…from groundwater conservation, it is important.
Several informants discussed the net benefits of the RM in terms of alternative energy use including reallocating resources to more efficient uses:
Another place is the electrical utility company/people, if you can find how they use it (RM). I am familiar with that they use it but not exactly how much. To reallocate power (during severe weather). Less use of electrical.
We (a utility firm) use it (RM) for finding and investing in alternative energy sources (e.g., wind power).
Effective public policy continues to discuss the importance of our natural resources and their uses. One of the net benefits from the RM is providing historical and real-time data for decision makers to make better decision and policymakers to make more effect policies for resource allocation:
From a groundwater district, it helps us calibrate the models and calculate our recharge; gives us a clue from a sustainability perspective. There is a move in the legislature…the only entity that can limit how much is pumped is the groundwater district. It is useful to the state from a water perspective, federal from FSA (forest service), local for farmers, wells, and planning.
Interestingly, the real-time data from each station and the network of stations provided a net societal benefit in the form of weather warnings. Such warnings were put out by the National Weather Service and provided valuable information to citizens, farmers, organizations, municipalities, to name a few:
It improves our ability to detect and issue warnings. That is what we are about. Flood or severe thunderstorm warnings. It improves beyond measure.
Without RM, it could put people in danger. It could put firefighters in danger. We could have wind shifts and not know. It can really cause problems and people can get hurt.
Another one of the major net benefits of the RM for this region was water sustainability and conservation. The RM data provided farmers, firefighters (wildfires), and the National Weather Service with real-time data to make more efficient decisions. These decisions had a direct impact on water conservation. In addition, the RM provided accurate historical data for model development and forecasting, which was vital for long-term sustainability:
From a groundwater district look, it helps us calibrate the models and calculate our recharge, gives us a clue from a sustainability perspective.
Informants across organizations consistently claimed that both the use of the RM and their satisfaction from using the RM resulted in net benefits for their organizations as well as for society (and its citizens) providing support for H9 and H10.
It was further highlighted by several informants that discussed how the net benefits of the RM information system led to greater system use including more locations, more users, and more information:
For weather, we need to move more to the north in the panhandle. That is where the most weather is and where the most wind is. Ideally, that is where we need to go to satisfy wind power.
We use it all the time for matters like that. From serious matters to kids’ science projects. We will either help them directly or point them to the webpage. Gosh, you want data, here you go. Schools used to call us with the wind chills because kids cannot play outside if it is below this, well, now they pull up the webpage and can see for themselves.
I would like to have a visibility sensor. This would help a lot of the regional airport (or aviation). That would help the pilots. Adding one or two sensors to a station is not a big deal; to all is major, expensive, and is more than what I can do. It would be nice, but one visibility sensor would cost more than all the other equipment on the tower and is very sensitive to the elements.
Additionally, as users of the RM observed or experienced the net benefits of the system, they described ways the system can improve for greater satisfaction:
There are stations that are on internet, cell phones, and radios. The ones on radios sometimes when the air is very dry (and when we have a wind event), we won’t get that data. And that is when you want it (to keep an eye on it). But it is better than what used to have.
For example, we save firefighters, how do you put a price on that? Oh, I would like to see a continued investment. More locations around the city. A micro-network. That would really give us a great picture, especially of the more densely populated area.
At the same time, informants continued to describe the net benefits to their organization or society from using the RM and how such benefits impacted system use and user satisfaction. Hence, this suggested support for H11 and H12.
The interviews identified several important constructs that were also supported by the IS success literature that we had developed into (testable) hypotheses. However, public perceptions played an important role in making the types of investment needed to sustain such systems and to demonstrate their role on environmental sustainability. This is especially important considering recent findings that renewable energy use significantly impacts the performance of an economy [
51]. Therefore, we were interested in quantitatively testing our hypotheses from the green IS success model as it related to perceptual benefits of individuals.
6. Discussion and Implications
To gain an understanding of how benefits may be realized from using IS in a green context, we interviewed expert users on the impacts of a green IS at various levels. This is echoing the concept of adaptive structuration theory [
58]. Individuals, organizations, and government agencies that were aware of RM and used the RM for achieving their goals dynamically created perceptions about the role and utility of the RM, and how it could be applied to their activities. These perceptions in turn influence the way RM could and should be used and hence mediated its impact on (anticipated) outcomes.
While the IS community is already a player in the global response to environmental sustainability challenges by raising awareness and influencing business and government actions [
26], we employ the IS success model within the context of environmental sustainability but that it could further promote IS as a source of solutions to various environmental challenges. Empirical research was necessary to advance our understanding and practices of green IS and environment sustainability. Due to the inherent uncertainty of the outcomes of green practices, making benefits known to potential stakeholders will motivate their mind-set shift and provide effective guidance in their decision making. We conjectured that the realization of environmental sustainability benefits emerged only when evaluation and assessment were carried out. We found that the RM generated environmental sustainability benefits so that it achieved considerable impacts.
Our study contributed to the field of green IS theory by examining the IS success model within a new context (i.e., green IS) and expanding the scope of net benefits to include environmental sustainability. We used a case study approach (of expert users) to examine the IS success model to gain a better understanding of how benefits are realized. This approach provided a richer contextual description of green IS by showing actual net benefits. Employing this approach, we extended the current literature by examining the net benefits to individuals, businesses, government, and society as a whole, which is important given that these entities must decide how best to deploy scarce resources. Therefore, it is critical to understand the costs and benefits of such resource allocations and, from a public or societal viewpoint, their impacts. As such, understanding the benefits of green IS may better facilitate long-term investments that could enhance economic growth and environmental sustainability. These findings may also assist policymakers with optimal, long term growth policies. One such policy example may be green investment tax credits that incentivize the further development of green IS compared to policies directly aimed at reducing carbon emissions.
Our findings in the cases provided demonstrable, sharable, and mimetic methods and practices for stakeholders wishing to explore sustainability options through the use of green IS such as the RM. Furthermore, our findings showcased net benefits toward environmental sustainability at different levels derived from a successful green IS (e.g., organizational impact, progressive public policy, positive societal impact, and positive sustainability impact). This information in turn could and should be broadcasted and used to influence attitudes and beliefs of the public, businesses, and governments. RM and other green IS alike should set up information and e-learning portals for easy access in order to improve environmental sustainability awareness as well as provide information for potential stakeholders to justify further investments of green IS. Governments could also play a key role in establishing standards, providing economic incentives, and influencing social norms to change citizens’ behaviors in an environmentally desirable direction [
2].
It is important, however, to note that our findings are derived from one specific case study and one specific information systems (i.e., regional mesonet). Readers should be cautious to interpret our findings to all green information systems on all aspects of environmental sustainability in general. One avenue of future research would be to collect data from different subject groups and potentially from different green information systems; for example, surveys of a wide array of potential adopters and stakeholders (individuals, organizations, community groups, government bodies, and policy makers) of multiple green IS should be conducted. Analyses can shed lights on whether and how existing green IS benefits can influence future and broader use of green IS. Therefore, it is important for IS researchers to study not only how to design desirable green IS to directly contribute to environmental sustainability but also how to use green IS success as a catalyst to broaden the contribution of green IS.
7. Conclusions
Green IS should be a new and promising research area for IS researchers to explore the use of IS as a solution for environment sustainability. Breadth and depth of IS research definitely has the potential to provide environment sustainability solutions. Stakeholders (individuals, organizations, governments, and countries) sometimes face the dilemma that they do not have appropriate information and knowledge to take actions to advance environmental sustainability. We took on the challenge and answered calls from IS community to extend IS research on environmental sustainability by providing empirical evidence of benefits and impacts derived from green IS. Our study is one of the first to investigate IS use, success, and impact in the green (environmental sustainability) context. This is one of the first studies provides empirical evidence where using IS can contribute to different goals at different levels of environmental sustainability. In addition, our findings provide suggestions on how the successful green IS might be used to further induce actions and advance goals of environmental sustainability. That is, findings from our study could be used for guiding necessary actions, justifying further investments, and assisting policy-making and decision-making on matters related to green IS and environmental sustainability.
While we focused on the IS success model, future work could apply other theories such as social exchange theory or social capital theory to study this domain. In addition, other quantitative metrics could be designed and measured for constructs (especially the net benefits) of the green IS model. Finally, our study could be enhanced by following up our study to examine the net benefits over time (longitudinal study). This would allow us to gain better estimates of the (long-term) benefits of using IS for environmental sustainability, which could also be utilized in a cost-benefit analysis or business performance measures.


