
The Anti-Obesity Effects of Lemon Fermented Products in 3T3-L1 Preadipocytes and in a Rat Model with High-Calorie Diet-Induced Obesity

 , ,
, , 
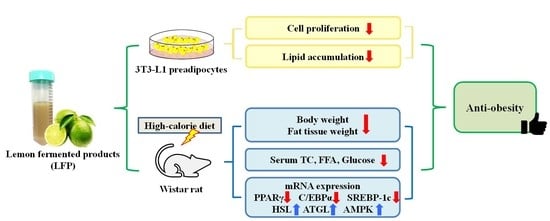
Abstract
:
1. Introduction
2. Materials and Methods
2.1. Chemicals and Reagents
2.2. Preparation of Lemon Fermented Products
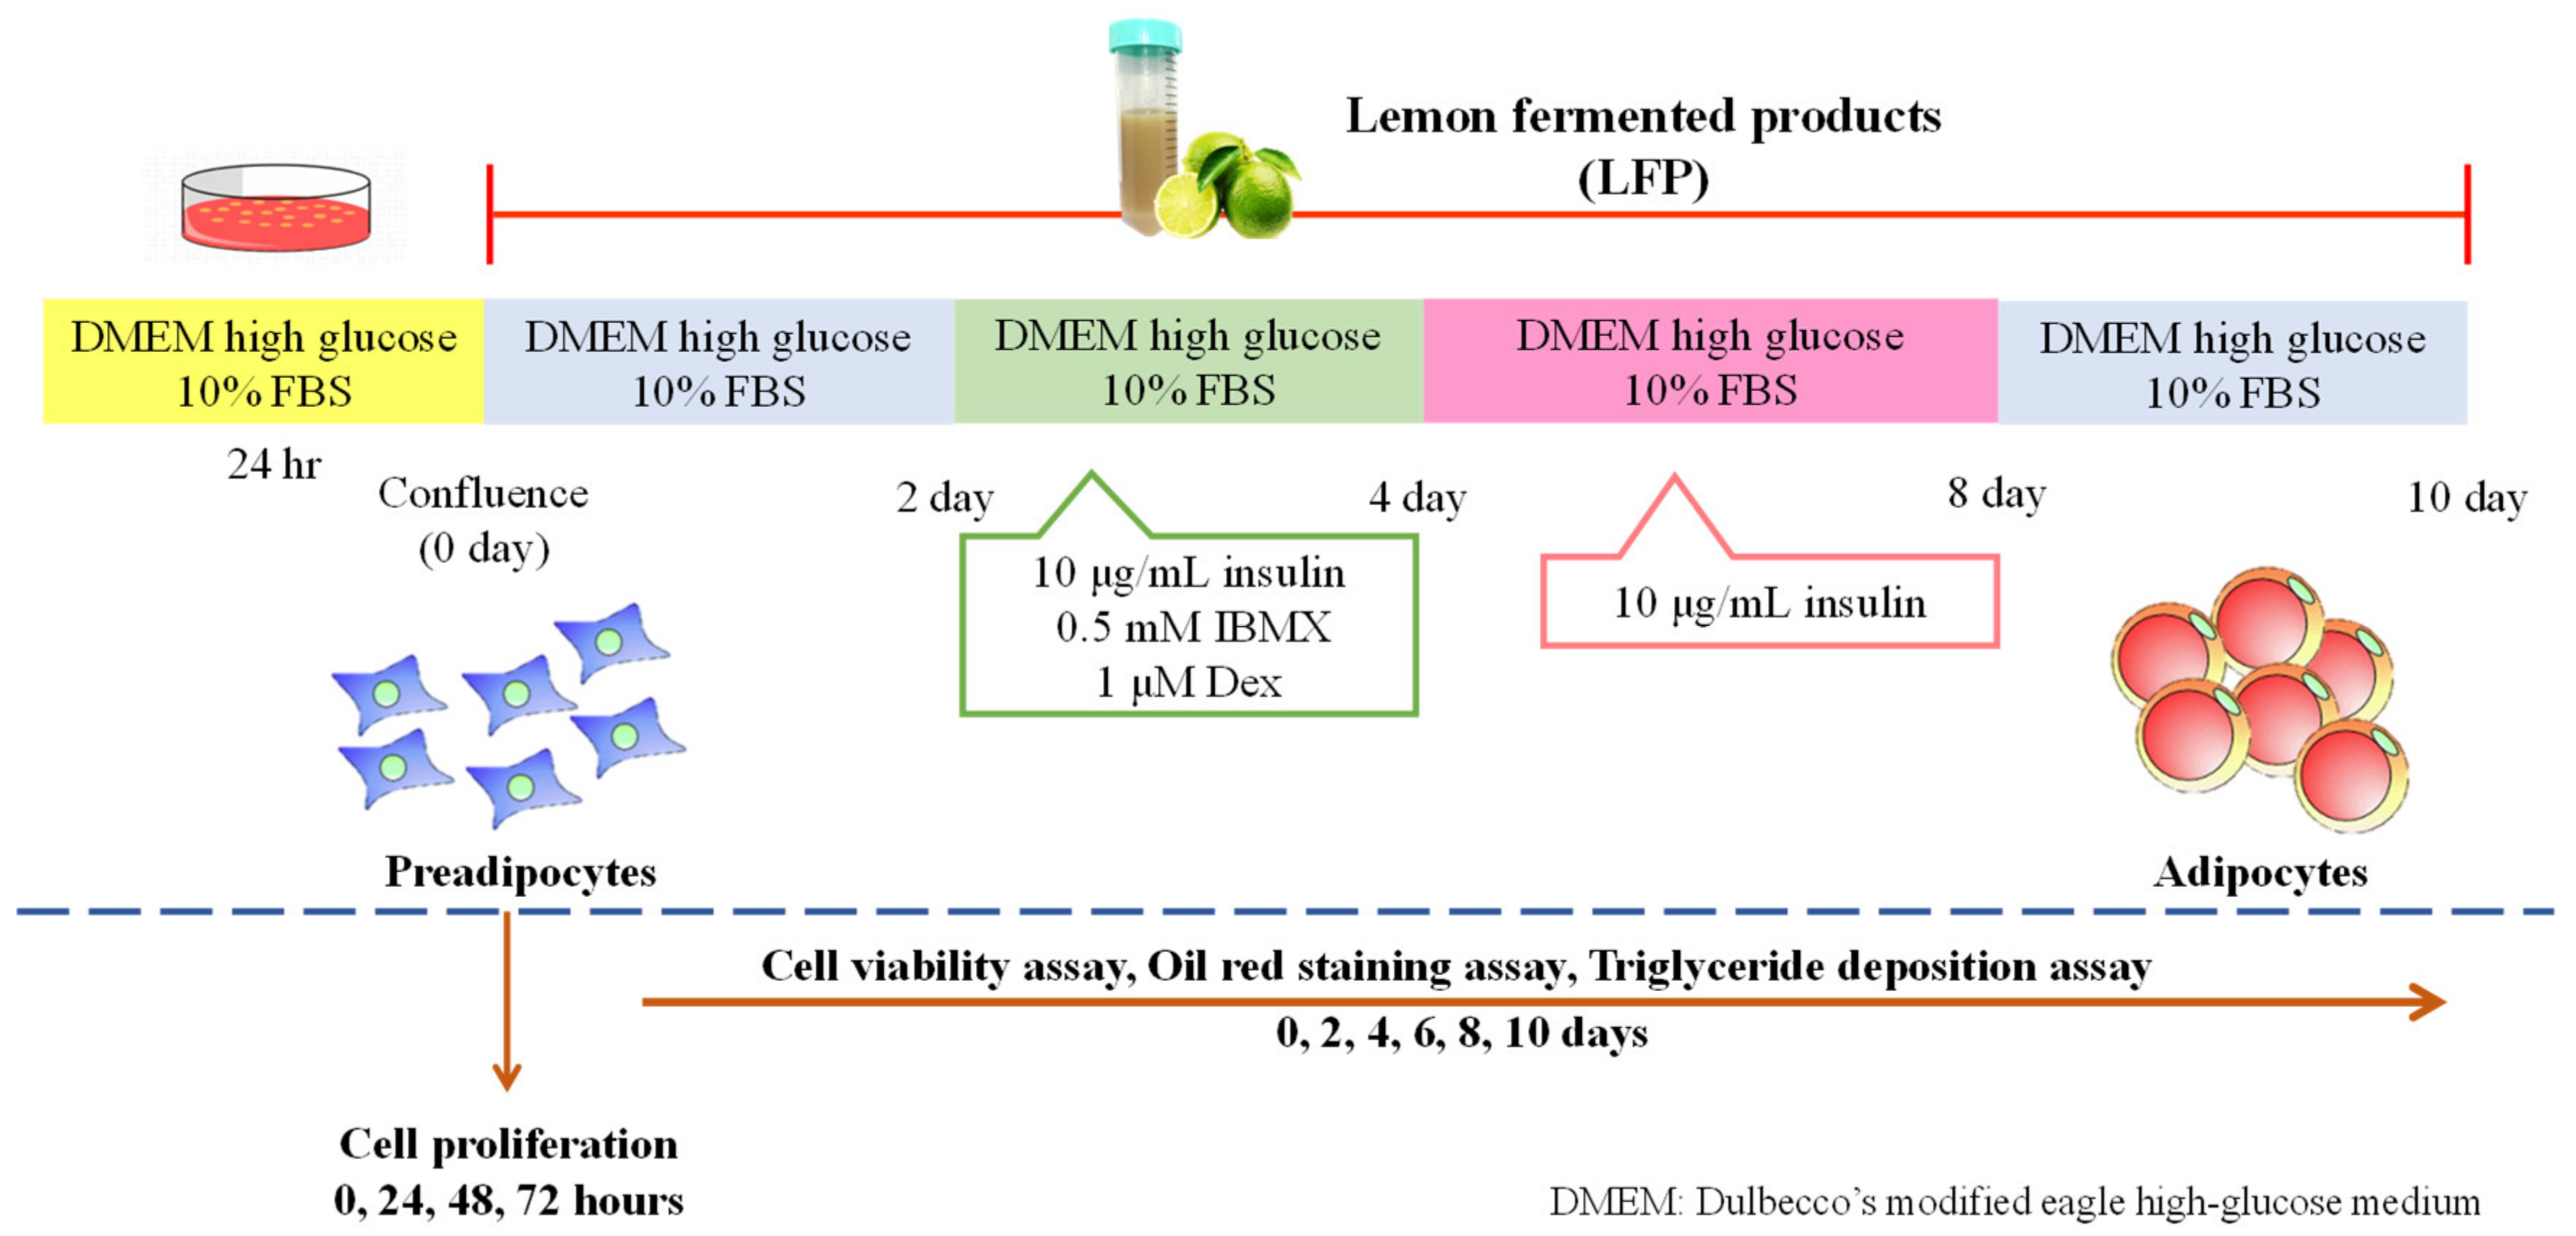
2.3. Cell Culture and Adipocyte Differentiation
2.4. Cell Proliferation Assay
2.5. Cell Viability Assay
2.6. Lipid Accumulation Assay
2.6.1. Oil Red O Staining Assay
2.6.2. Triglyceride Deposition Assay
2.7. Animals and Treatments
2.8. Serum Biochemical Parameters Determination Assays
2.9. Histological Analysis
2.10. Real-Time PCR
2.11. Statistical Analysis
3. Results
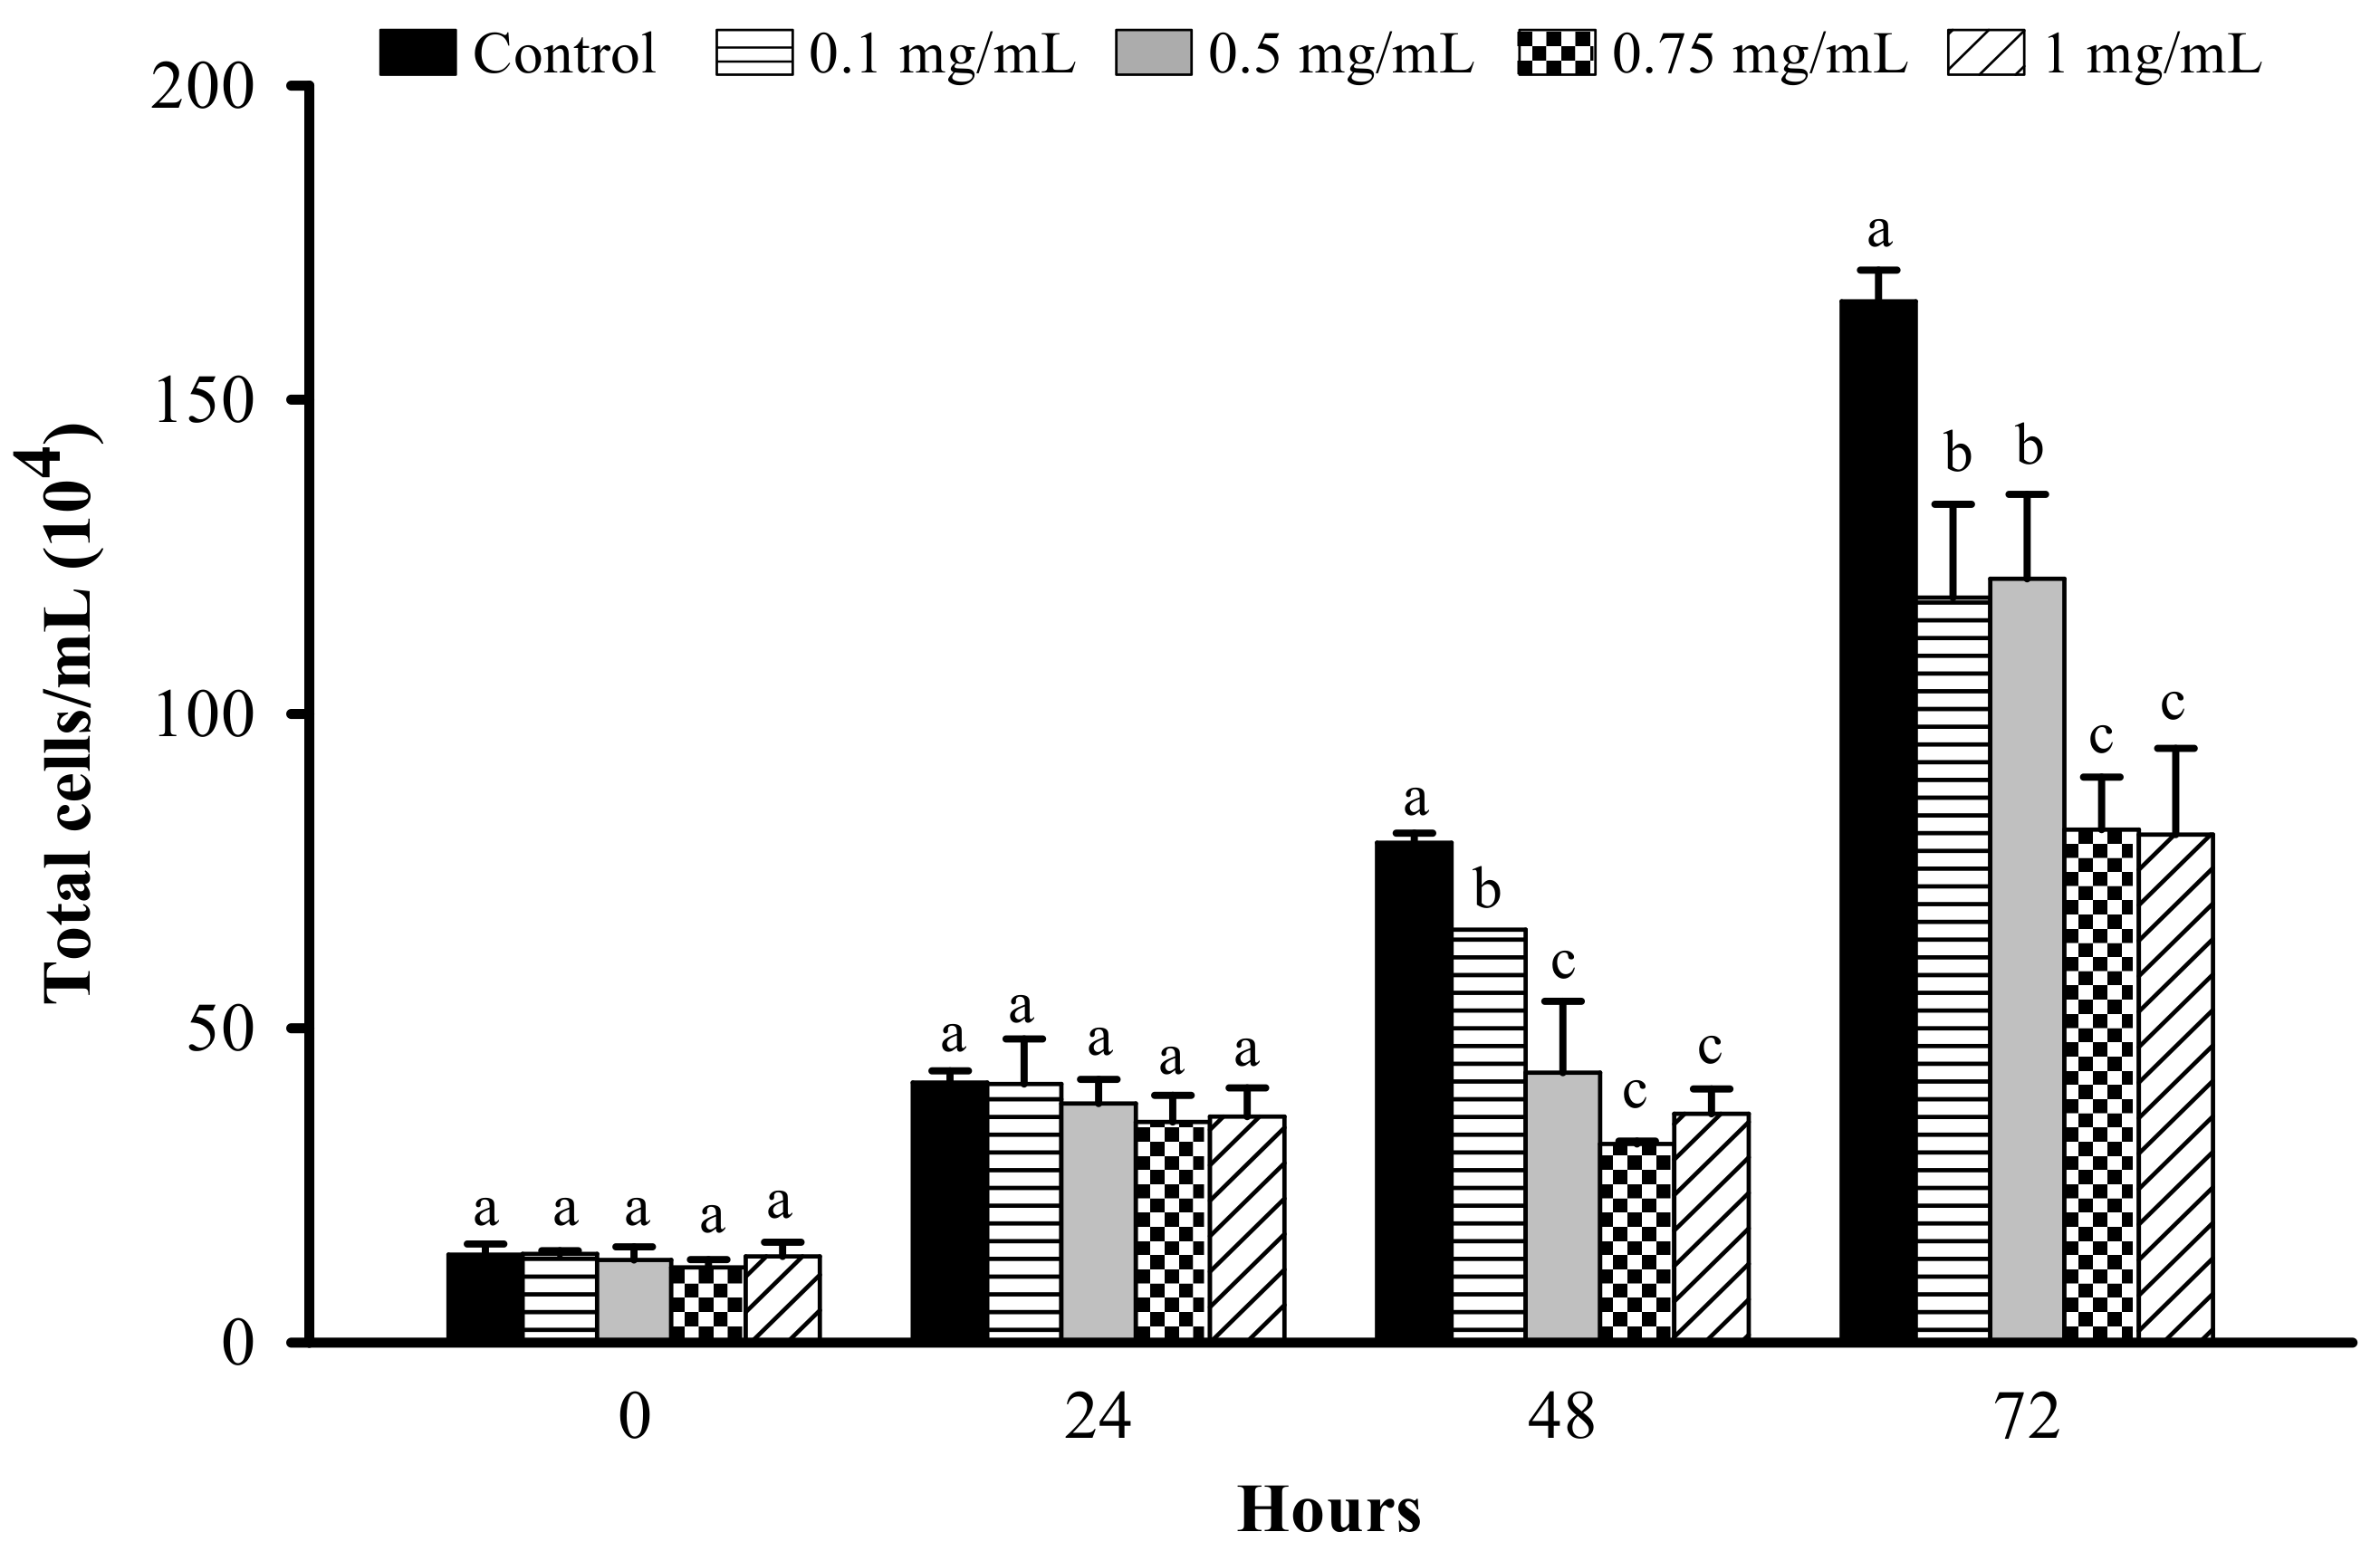
3.1. Effect of LFP on Cell Proliferation in 3T3-L1 Preadipocytes
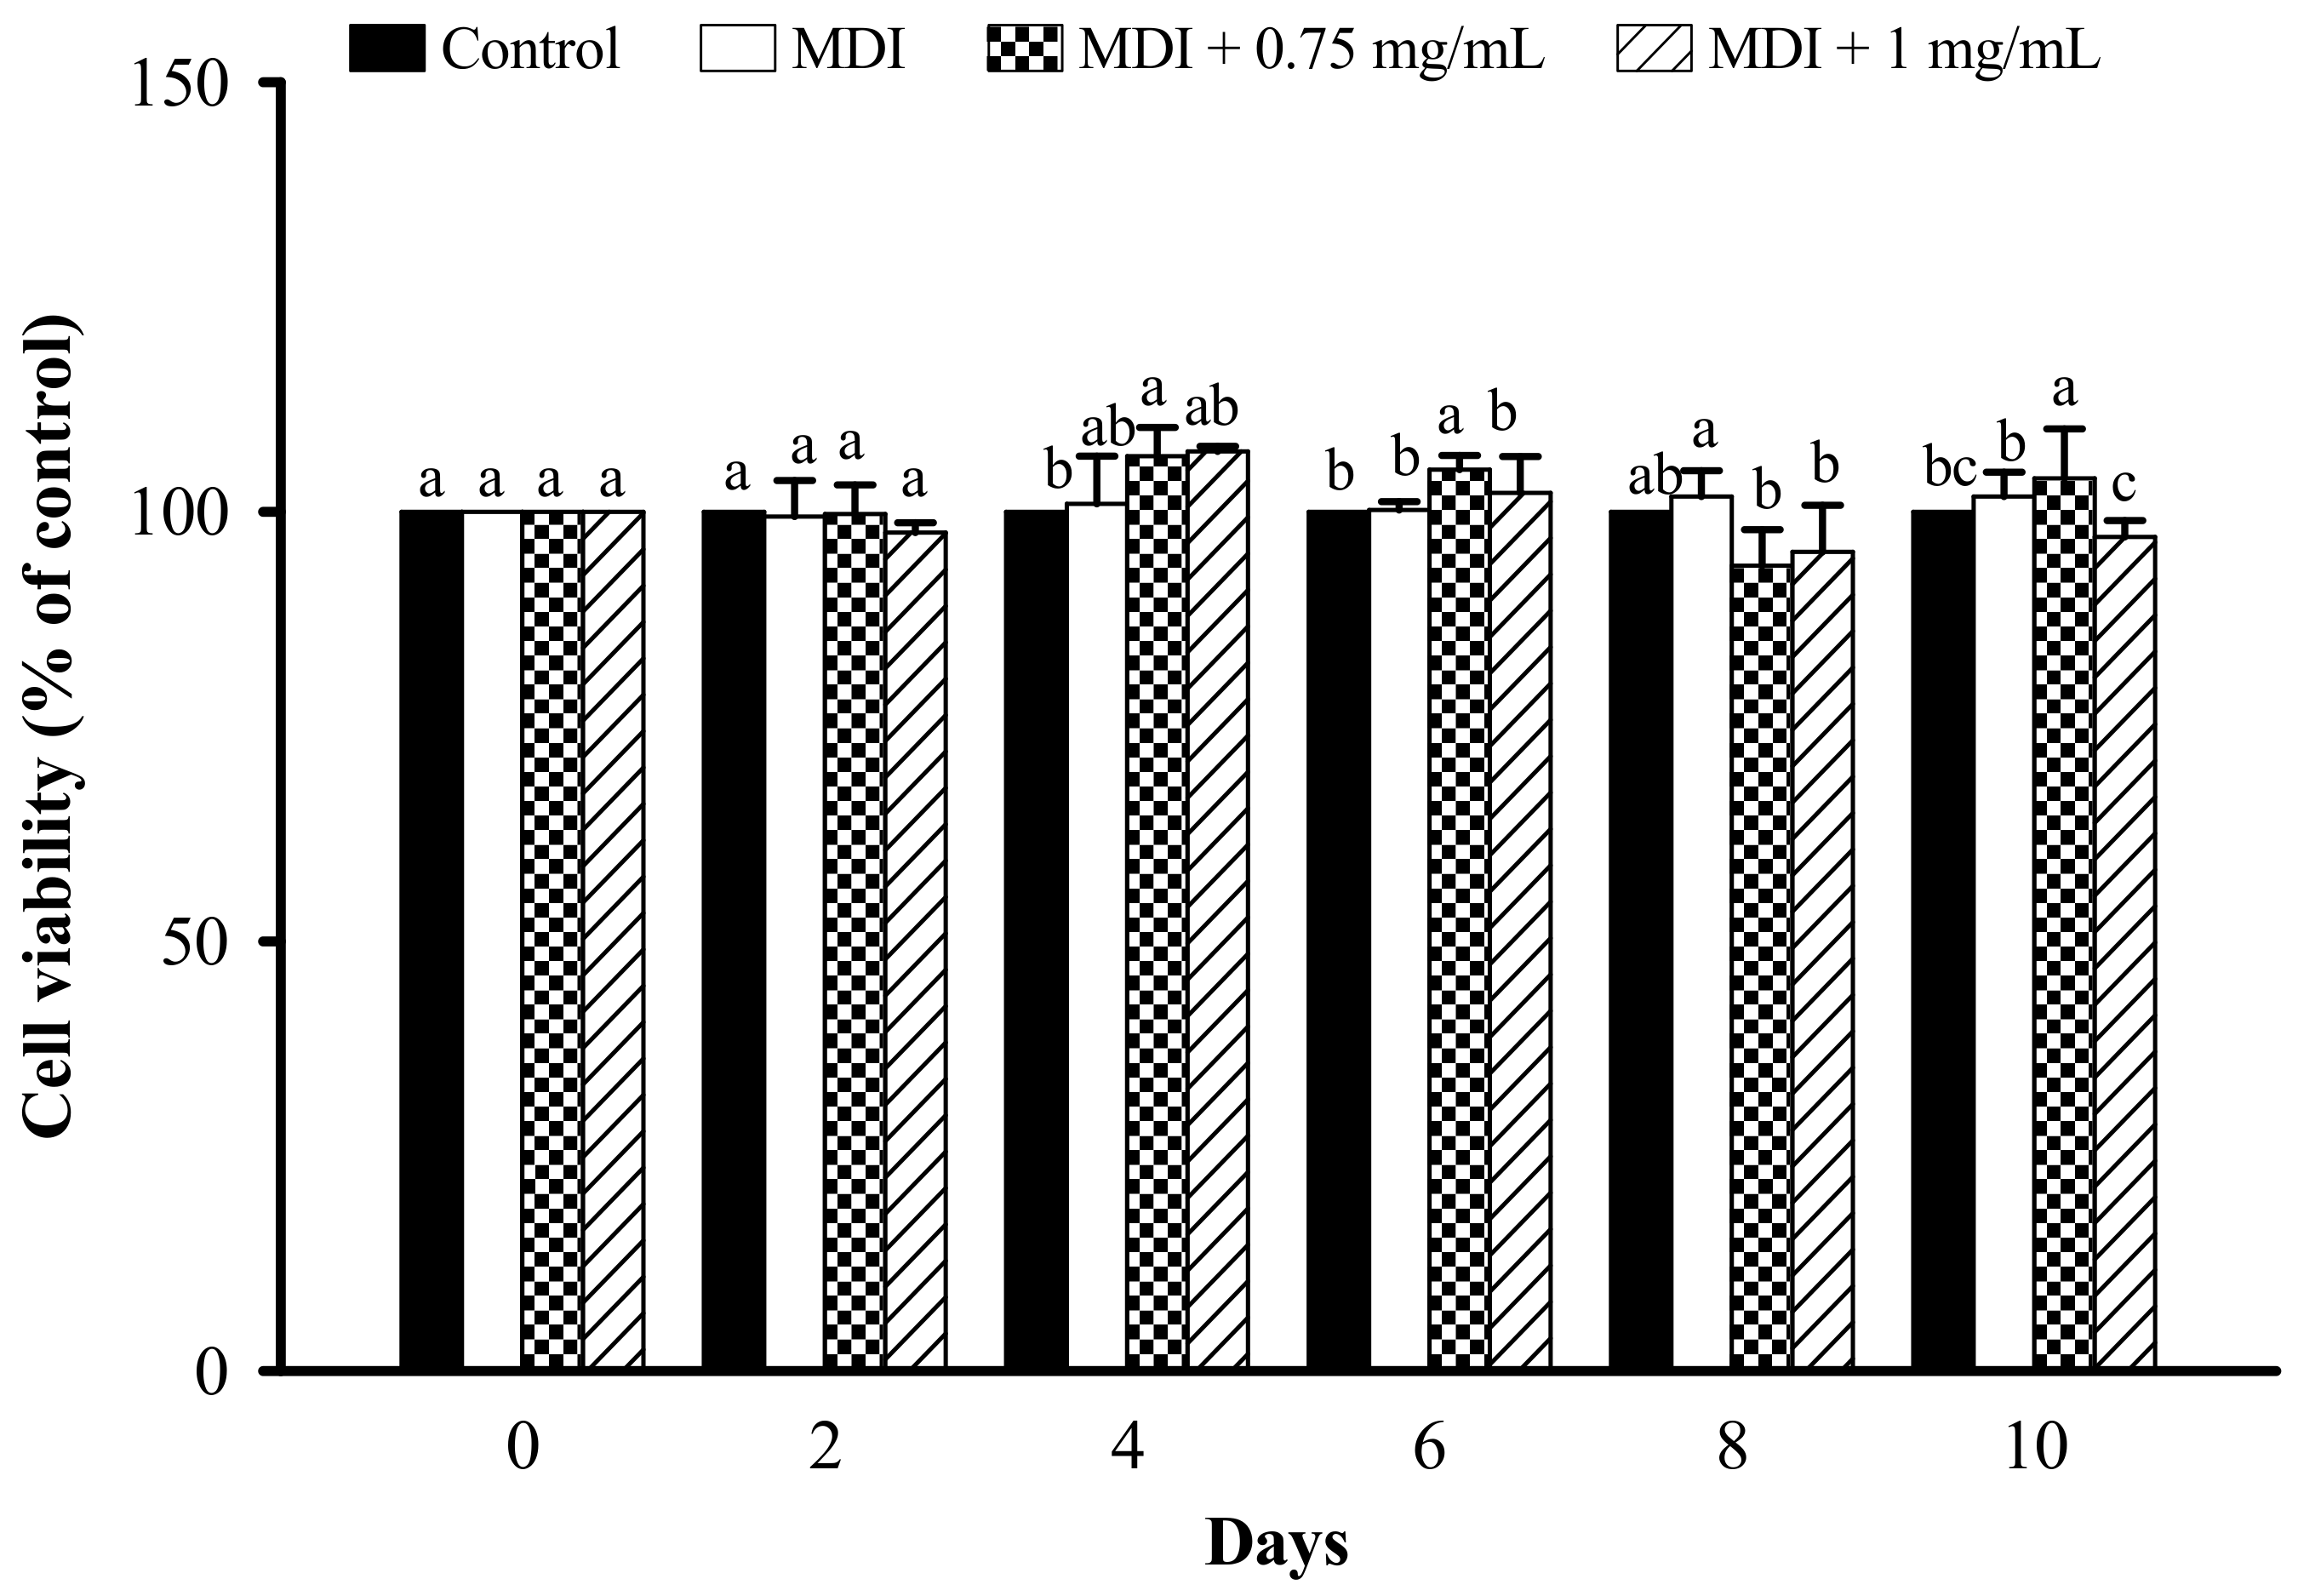
3.2. Effect of LFP on Cell Viability in 3T3-L1 Adipocytes
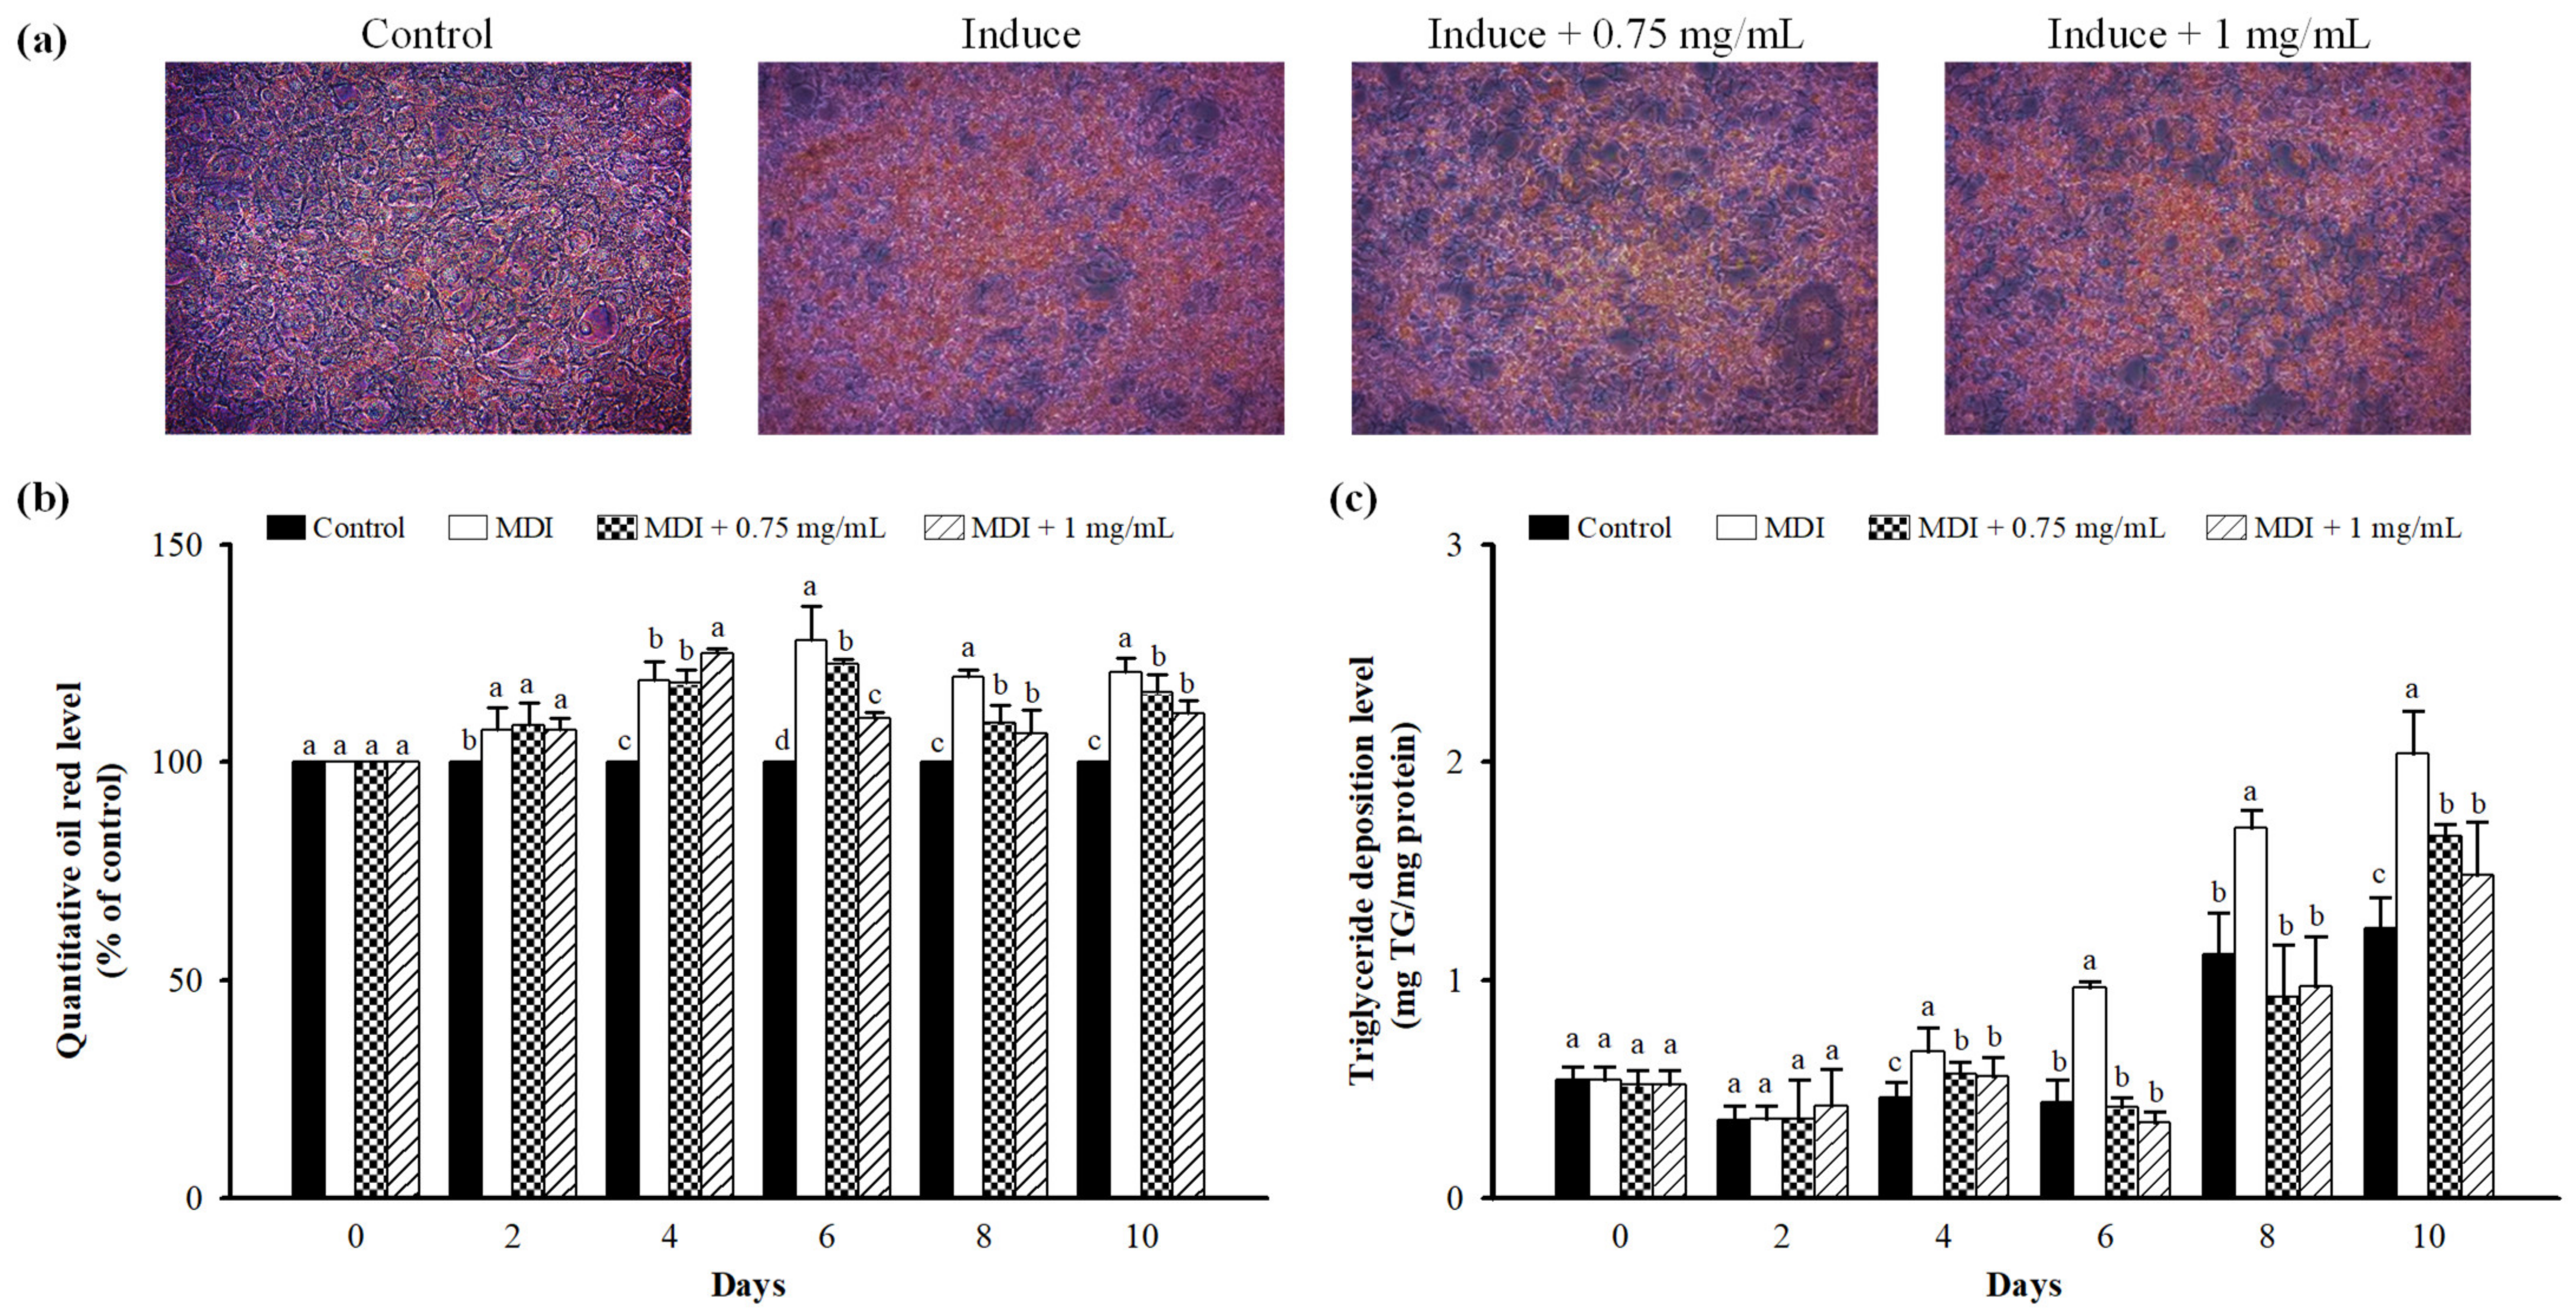
3.3. Effect of LFP on Lipid Accumulation in 3T3-L1 Adipocytes
3.4. Effect of LFP on Animal Characteristics in Rats Fed a High-Calorie Diet
3.5. Effect of LFP on Serum Biochemical Parameters in Rats Fed a High-Calorie Diet
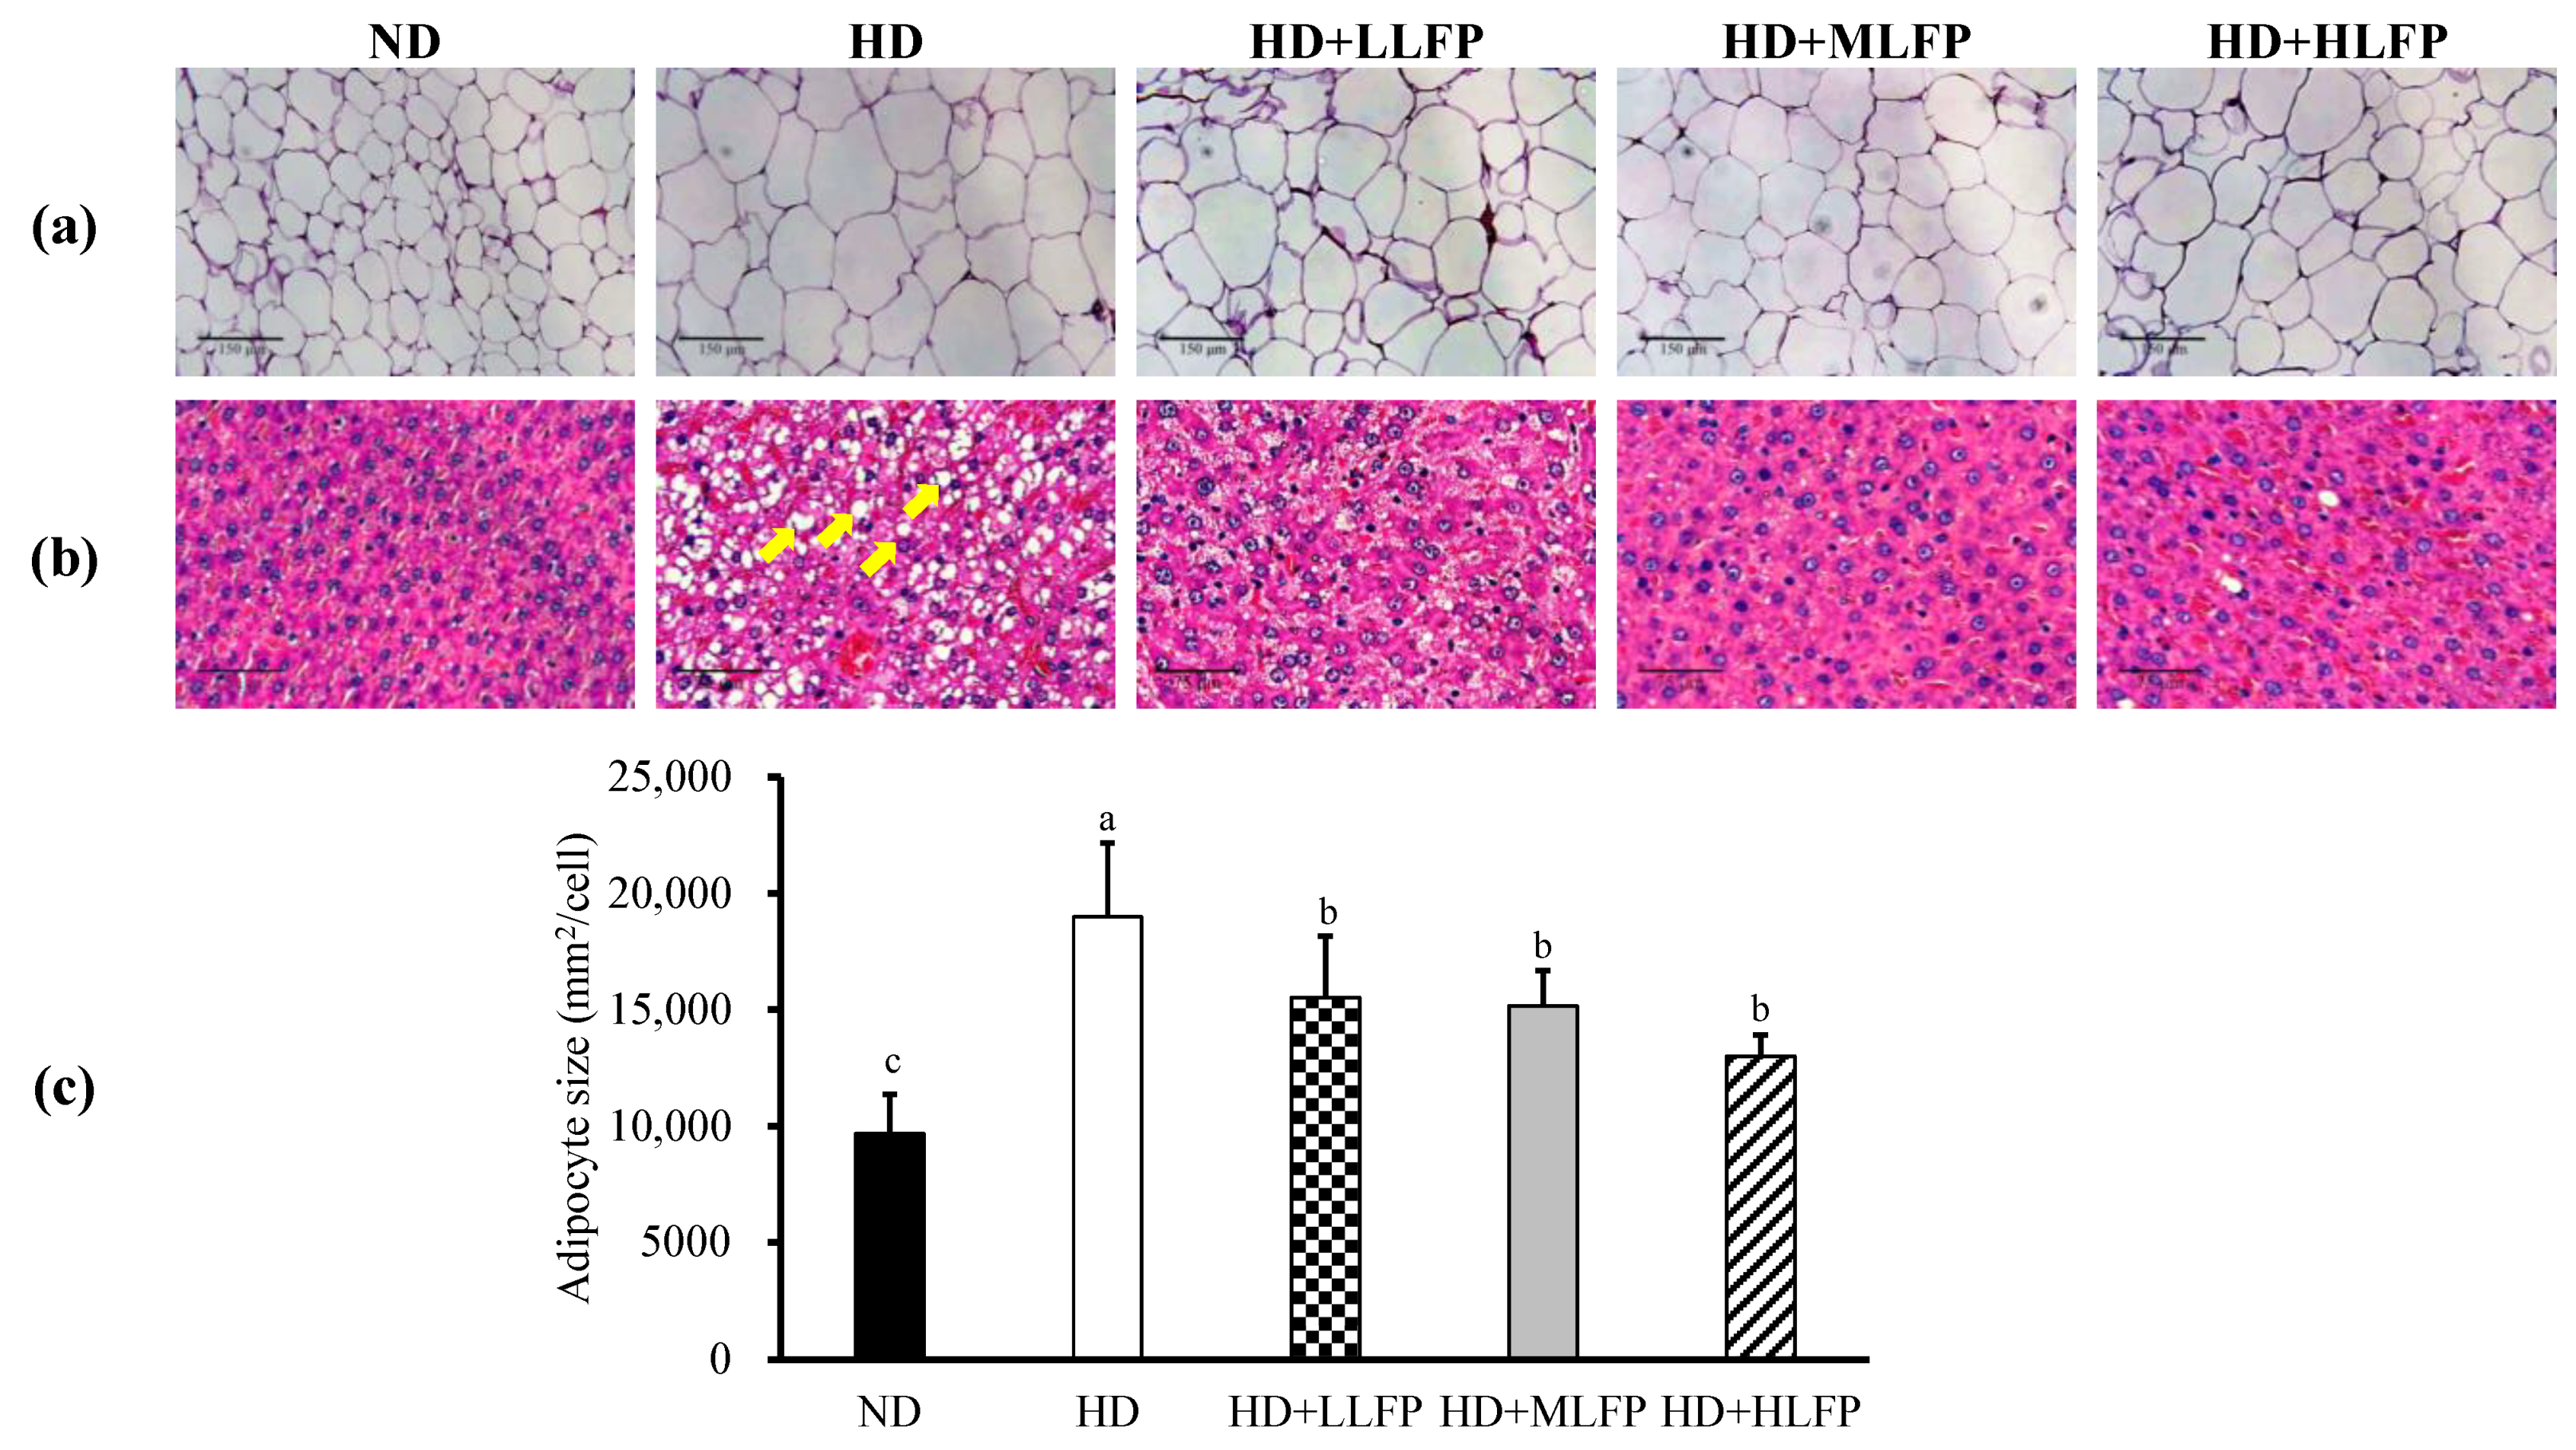
3.6. Effects of LFP on Histological in Epididymal Adipose Tissue and Liver of Rats Fed a High-Calorie Diet
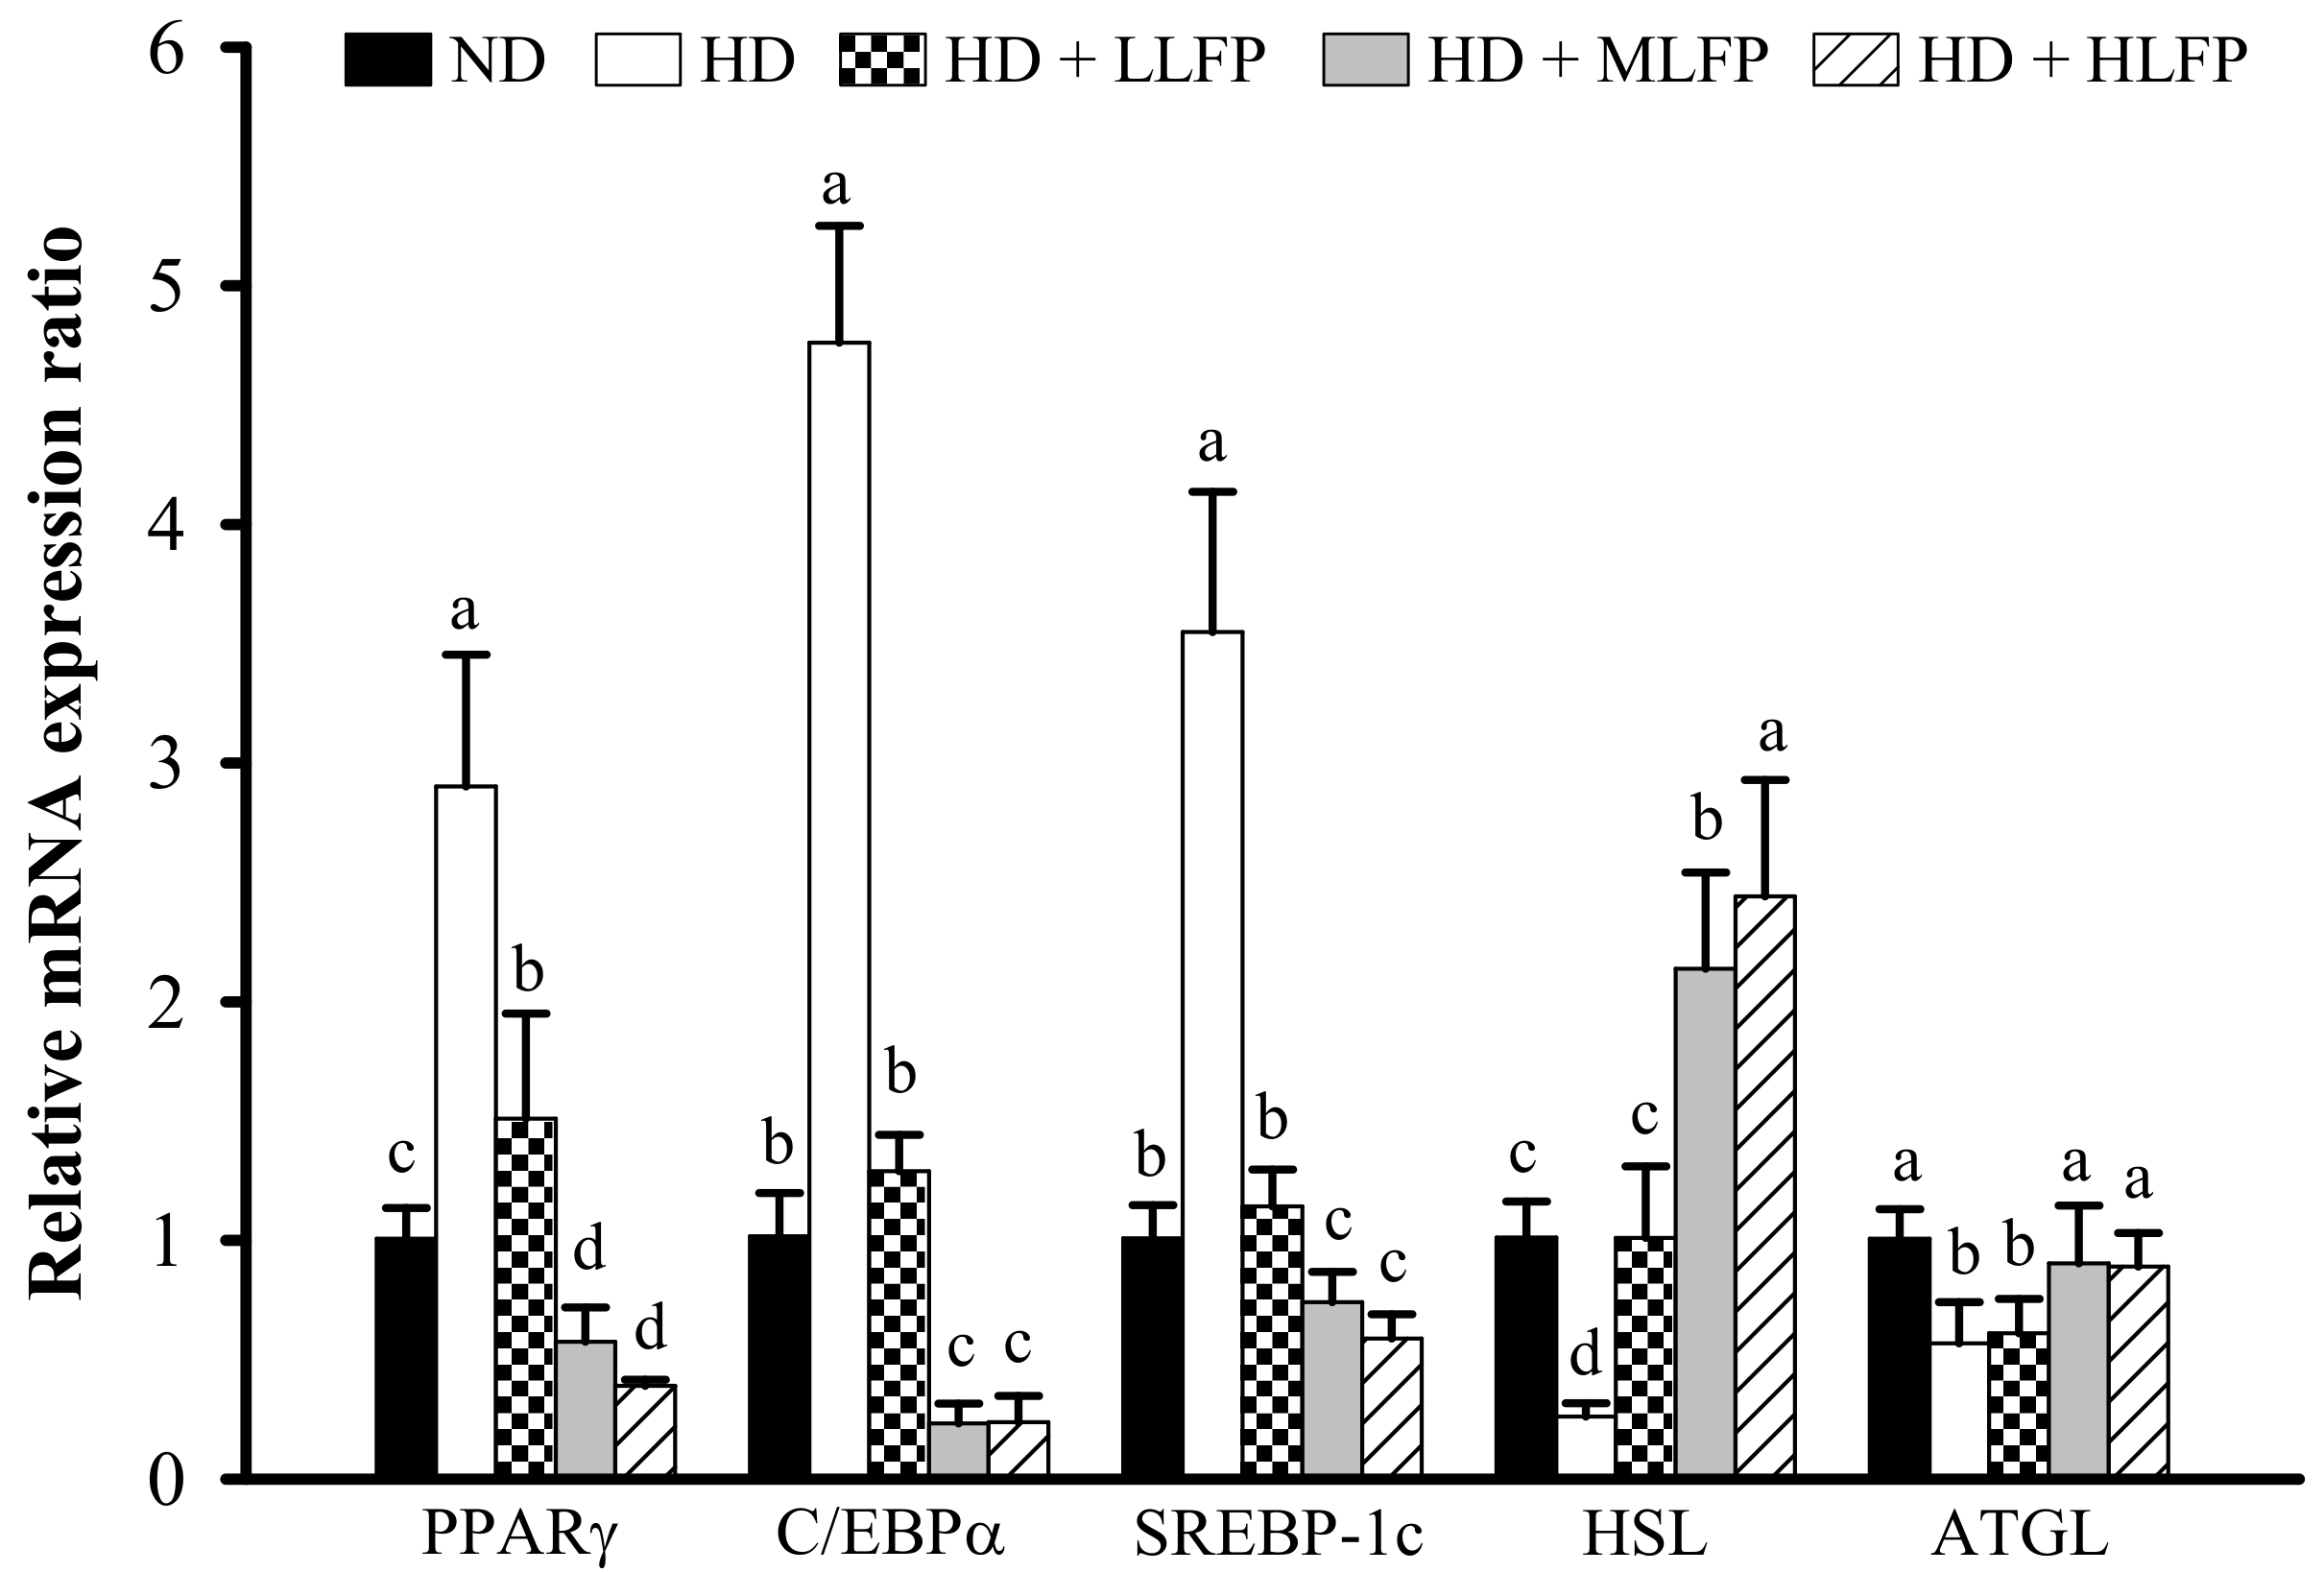
3.7. Effect of LFP on mRNA Expression of Genes Related to Lipid Metabolism in Epididymal Adipose Tissue of Rats a Fed High-Calorie Diet
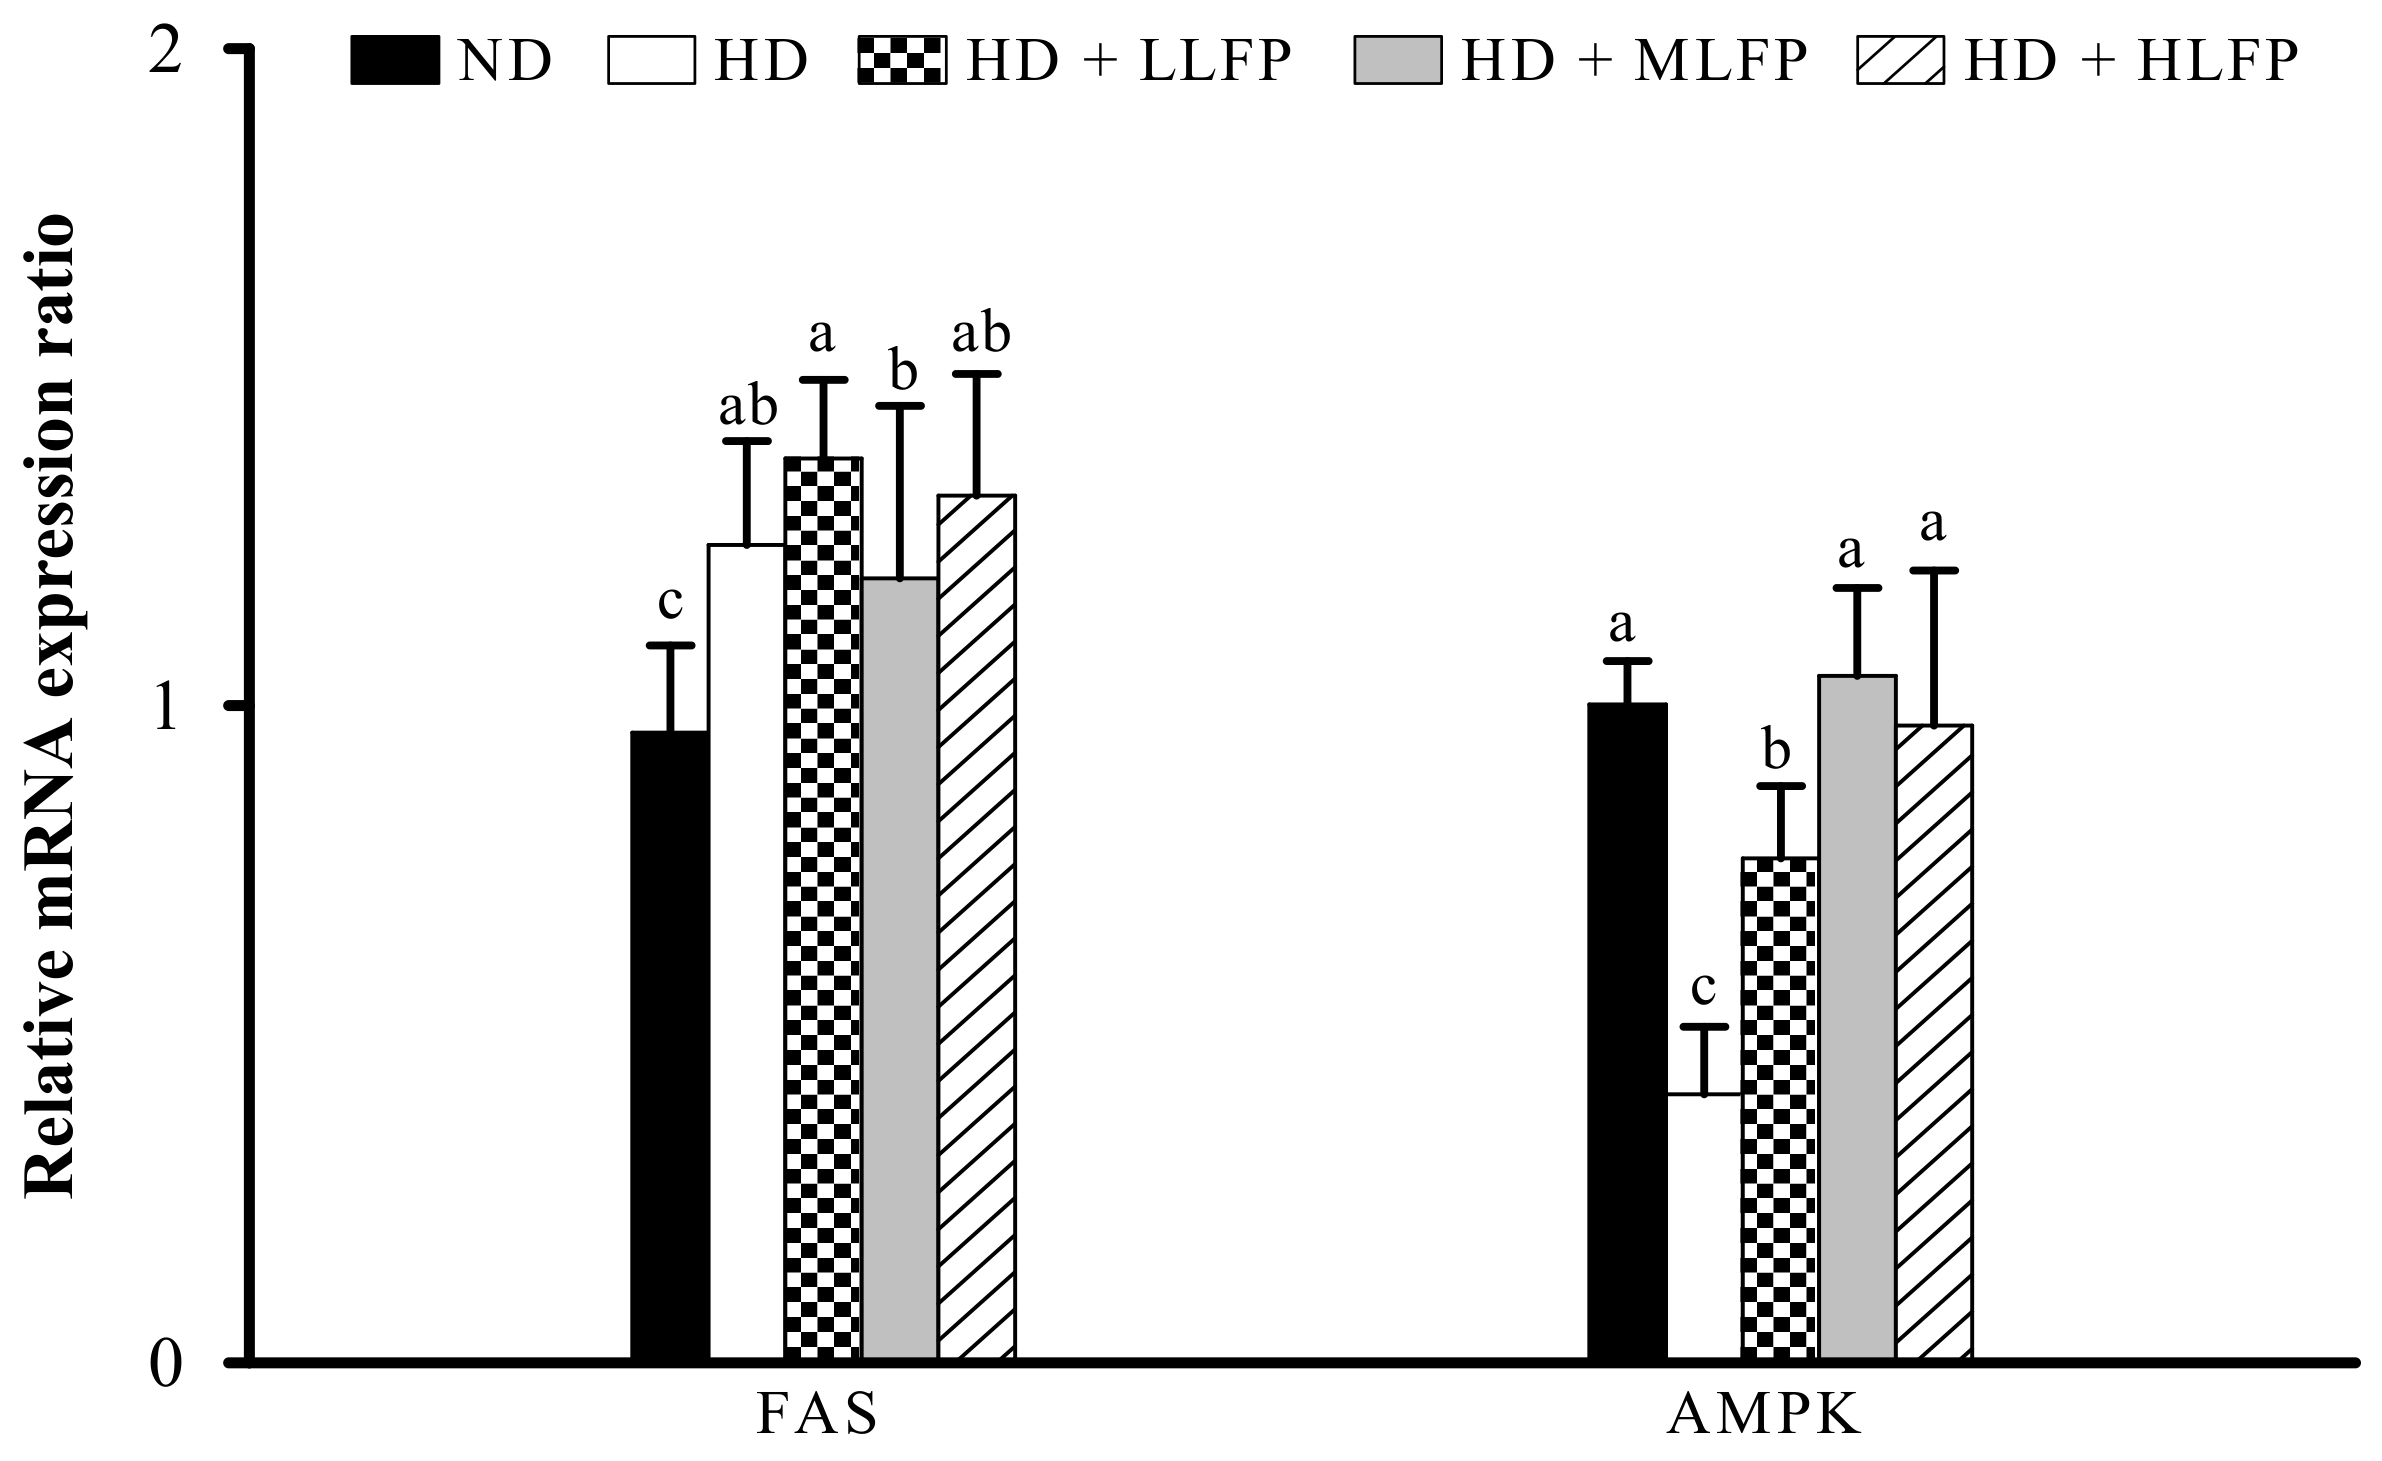
3.8. Effect of LFP on mRNA Expression of Genes Related to Lipid Metabolism in Liver of Rats Fed a High-Calorie Diet
4. Discussion
5. Conclusions
Supplementary Materials
Author Contributions
Funding
Institutional Review Board Statement
Informed Consent Statement
Data Availability Statement
Acknowledgments
Conflicts of Interest
References
- Snijder, M.B.; Zimmet, P.Z.; Visser, M.; Dekker, J.M.; Seidell, J.C.; Shaw, J.E. Independent and opposite associations of waist and hip circumferences with diabetes, hypertension and dyslipidemia: The AusDiab Study. Int. J. Obes. 2004, 28, 402–409. [Google Scholar] [CrossRef] [Green Version]
- Venkatakrishnan, K.; Chiu, H.F.; Wang, C.K. Extensive review of popular functional foods and nutraceuticals against obesity and its related complications with a special focus on randomized clinical trials. Food Funct. 2019, 10, 2313–2329. [Google Scholar] [CrossRef]
- Tang, Q.Q.; Otto, T.C.; Lane, M.D. Mitotic clonal expansion: A synchronous process required for adipogenesis. Proc. Natl. Acad. Sci. USA 2003, 100, 44–49. [Google Scholar] [CrossRef] [Green Version]
- Ockner, R.K.; Manning, J.A.; Poppenhausen, R.B.; Ho, W.K.L. A binding protein for fatty acids in cytosol of intestinal mucosa, liver, myocardium and other tissues. Science 1972, 177, 56–58. [Google Scholar] [CrossRef]
- Kim, J.; Yang, G.; Kim, Y.; Kim, J.; Ha, J. AMPK activators: Mechanisms of action and physiological activities. Exp. Mol. Med. 2016, 48, e224. [Google Scholar] [CrossRef] [PubMed] [Green Version]
- Kersten, S. Mechanisms of nutritional and hormonal regulation of lipogenesis. EMBO Rep. 2001, 2, 282–286. [Google Scholar] [CrossRef] [PubMed] [Green Version]
- Food and Agriculture Organization of United Nation Cropping Database. Available online: http://www.fao.org/faostat/en/#data/QC (accessed on 18 March 2021).
- Makni, M.; Jemai, R.; Kriaa, W.; Chtourou, Y.; Fetoui, H. Citrus limon from Tunisia: Phytochemical and physicochemical properties and biological activities. BioMed Res. Int. 2018, 10, 546–555. [Google Scholar] [CrossRef] [PubMed] [Green Version]
- Kawthar, D. In Vitro studies on phytochemical content, antioxidant, anticancer, immunomodulatory and antigenotoxic activities of lemon, grapefruit and mandarin citrus peels. Asian Pac. J. Cancer Prev. 2016, 17, 3559–3567. [Google Scholar]
- Oboh, G.; Olasehinde, A.T.; Ademosun, O.A. Essential oil from lemon peels inhibit key enzymes linked to neurodegenerative conditions and pro-oxidant induced lipid peroxidation. J. Oleo Sci. 2014, 63, 373–381. [Google Scholar] [CrossRef] [PubMed] [Green Version]
- Ahmad, M.; Ansari, M.N.; Alam, A.; Khan, T.H. Oral dose of citrus peel extracts promotes wound repair in diabetic rats. Pak. J. Biol. Sci. 2013, 16, 1086–1094. [Google Scholar] [CrossRef] [Green Version]
- Trovato, A.; Monforte, M.T.; Barbera, R.; Rossitto, A.; Galati, E.M.; Forestieri, A.M. Effects of fruit juices of Citrus sinensis L. and Citrus limon L. on experimental hypercholesterolemia in the rat. Phytomedicine 1996, 2, 221–227. [Google Scholar] [CrossRef]
- Oboh, G.; Bello, F.O.; Ademosun, A.O.; Akinyemi, A.J.; Adewuni, T.M. Antioxidant, hypolipidemic, and anti-angiotensin-1-converting enzyme properties of lemon (Citrus limon) and lime (Citrus aurantifolia) juices. J. Comp. Pathol. 2015, 24, 1395–1406. [Google Scholar] [CrossRef]
- Lee, Y.K.; Salminen, S. The coming of age of probiotics. Trends Food Sci. Technol. 1995, 6, 241–245. [Google Scholar] [CrossRef]
- Kim, S.S.; Park, K.J.; An, H.J.; Choi, Y.H. Phytochemical, antioxidant, and antibacterial activities of fermented Citrus unshiu byproduct. Food Sci. Biotechnol. 2017, 26, 461–466. [Google Scholar] [CrossRef] [PubMed]
- Xie, C.; Hwang, C.E.; Oh, C.K.; Yoon, N.A.; Ryu, J.H.; Jeong, J.Y.; Roh, G.S.; Kim, H.J.; Cho, G.J.; Choi, W.S.; et al. Fermented soy-powder milk with Lactobacillus plantarum P1201 protects against high-fat diet-induced obesity. Int. J. Food Sci. Technol. 2017, 52, 1614–1622. [Google Scholar] [CrossRef]
- Ryu, J.Y.; Kang, H.R.; Cho, S.K. Changes over the fermentation period in phenolic compounds and antioxidant and anticancer activities of blueberries fermented by Lactobacillus plantarum. J. Food Sci. 2019, 84, 2347–2356. [Google Scholar] [CrossRef] [PubMed]
- Shikano, A.; Kuda, T.; Shibayama, J.; Toyama, A.; Ishida, Y.; Takahashi, H.; Kimura, B. Effects of Lactobacillus plantarum Uruma-SU4 fermented green loofah on plasma lipid levels and gut microbiome of high-fat diet fed mice. Food Res. Int. 2019, 121, 817–824. [Google Scholar] [CrossRef]
- Hashemi, S.M.B.; Khaneghah, A.M.; Barba, F.J.; Nemati, Z.; Shokofti, S.S.; Alizadeh, F. Fermented sweet lemon juice (Citrus limetta) using Lactobacillus plantarum LS5: Chemical composition, anti-oxidant and antibacterial activities. J. Funct. Foods 2017, 38, 409–414. [Google Scholar] [CrossRef]
- Chen, Y.J.L.; Chou, P.C.; Hsu, C.L.; Hung, J.F.; Wu, Y.C.; Lin, J.G. Fermented Citrus lemon reduces liver injury induced by carbon tetrachloride in rats. Evid. Based Complementary Altern. Med. 2018, 2018, 6546808. [Google Scholar] [CrossRef] [Green Version]
- Hsieh, C.Y.; Hsieh, S.L.; Ciou, J.Y.; Huang, Y.W.; Leang, J.Y.; Chen, M.H.; Hou, C.Y. Lemon juice bioactivity in vitro increased with lactic acid fermentation. Int. J. Food Prop. 2020, 24, 28–40. [Google Scholar] [CrossRef]
- Hsieh, C.Y.; Ciou, J.Y.; Shih, M.K.; Hsieh, S.L.; Huang, Y.W.; Chen, M.H.; Hou, C.Y. Effect of lemon water vapor extract (LWAE) from lemon byproducts on the physiological activity and quality of lemon fermented products. Int. J. Food Prop. 2021, 24, 264–276. [Google Scholar] [CrossRef]
- Jing, L.; Zhang, Y.; Fan, S.; Gu, M.; Guan, Y.; Lu, X.; Huang, C.; Zhou, Z. Preventive and ameliorating effects of citrus d-limonene on dyslipidemia and hyperglycemia in mice with high-fat diet-induced obesity. Eur. J. Pharmacol. 2013, 715, 46–55. [Google Scholar] [CrossRef]
- Yun, J.W. Possible anti-obesity therapeutics from nature—A review. Phytochemistry 2010, 71, 1625–1641. [Google Scholar] [CrossRef] [PubMed]
- Denizot, F.; Lang, R. Rapid colorimetric assay for cell growth and survival. Modifications to the tetrazolium dye procedure giving improved sensitivity and reliability. J. Immunol. Methods 1986, 89, 271–277. [Google Scholar] [CrossRef]
- Lowry, O.H.; Rosebrough, N.J.; Farr, A.L.; Randall, R.J. Protein measurement with the folin phenol reagent. J. Biol. Chem. 1951, 193, 265–275. [Google Scholar] [CrossRef]
- Titford, M. The long history of hematoxylin. Biotech. Histochem. 2005, 80, 73–78. [Google Scholar] [CrossRef] [PubMed]
- Fève, B. Adipogenesis: Cellular and molecular aspects. Best Pract. Res. Clin. Endocrinol. Metab. 2005, 19, 483–499. [Google Scholar] [CrossRef]
- Simu, S.Y.; Castro-Aceituno, V.; Lee, S.; Ahn, S.; Lee, H.K.; Hoang, V.A.; Yang, D.C. Fermentation of soybean hull by Monascus pilosus and elucidation of its related molecular mechanism involved in the inhibition of lipid accumulation. An in sílico and in vitro approach. J. Food Biochem. 2017, 42, 12442–12451. [Google Scholar] [CrossRef]
- Lee, Y.S.; Choi, B.K.; Lee, H.J.; Lee, D.R.; Cheng, J.; Lee, W.K.; Yang, S.H.; Suh, J.W. Monascus pilosus-fermented black soybean inhibits lipid accumulation in adipocytes and in high-fat diet-induced obese mice. Asian Pac. J. Trop. Biomed. 2015, 8, 276–282. [Google Scholar] [CrossRef] [Green Version]
- Wang, L.C.; Pan, T.M.; Tsai, T.Y. Lactic acid bacteria-fermented product of green tea and Houttuynia cordata leaves exerts anti-adipogenic and anti-obesity effects. J. Food Drug Anal. 2018, 26, 973–984. [Google Scholar] [CrossRef]
- Alberti, K.G.; Eckel, R.H.; Grundy, S.M.; Zimmet, P.Z.; Cleeman, J.I.; Donato, K.A.; Fruchart, J.C.; James, W.P.; Loria, C.M.; Smith, S.C. Harmonizing the metabolic syndrome: A joint interim statement of the international diabetes federation task force on epidemiology and prevention; national heart, lung, and blood institute; American heart association; world heart federation; international atherosclerosis society; and international association for the study of obesity. Circulation 2009, 120, 1640–1645. [Google Scholar]
- Jeon, Y.B.; Lee, J.J.; Chang, H.C. Characterization of juice fermented with Lactobacillus plantarum EM and its cholesterol-lowering effects on rats fed a high-fat and high-cholesterol diet. Food Sci. Nutr. 2019, 7, 3622–3634. [Google Scholar] [CrossRef] [PubMed] [Green Version]
- Kim, S.K.; Kong, C.S. Anti-adipogenic effect of dioxinodehydroeckol via AMPK activation in 3T3-L1 adipocyte. Chem. Biol. Interact. 2010, 186, 24–29. [Google Scholar] [CrossRef]
- Ko, J.H.; Kwon, H.S.; Yoon, J.M.; Yoo, J.S.; Jang, H.S.; Kim, J.Y.; Yeon, S.W.; Kang, J.H. Effects of Polygonatum sibiricum rhizome ethanol extract in high-fat diet-fed mice. Pharm. Biol. 2015, 53, 563–570. [Google Scholar] [CrossRef] [PubMed] [Green Version]
- Nerurkar, P.V.; Lee, Y.K.; Nerurkar, V.R. Momordica charantia (bitter melon) inhibits primary human adipocyte differentiation by modulating adipogenic genes. BMC Complement. Altern. Med. 2010, 10, 34. [Google Scholar] [CrossRef] [PubMed] [Green Version]
- Guo, L.; Li, K.; Kang, J.S.; Kang, N.J.; Son, B.G.; Choi, Y.W. Strawberry fermentation with Cordyceps militaris has anti-adipogenesis activity. Food Biosci. 2020, 35, 100576–100584. [Google Scholar] [CrossRef]
- Park, S.; Son, H.K.; Chang, H.C.; Lee, J.J. Effects of cabbage-apple juice fermented by Lactobacillus plantarum EM on lipid profile improvement and obesity amelioration in rats. Nutrients 2020, 12, 1135. [Google Scholar] [CrossRef] [Green Version]
- Lee, H.S.; Lee, S.J.; Ho, J.N.; Cho, H.Y. Preventive effect of fermented chestnut inner shell extract on obesity-induced hepatic steatosis. Prev. Nutr. Food Sci. 2020, 25, 32–40. [Google Scholar] [CrossRef]
- Liu, L.; Ding, C.; Tian, M.; Yi, D.; Wang, J.; Zhao, J.; Hu, Y.; Wang, C. Fermentation improves the potentiality of capsicum in decreasing high-fat diet-induced obesity in C57BL/6 mice by modulating lipid metabolism and hormone response. Food Res. Int. 2019, 124, 49–60. [Google Scholar] [CrossRef]
- Kim, J.H.; Kim, O.K.; Yoon, H.G.; Park, J.; You, Y.; Kim, K.; Lee, Y.H.; Choi, K.C.; Lee, J.; Jun, W. Anti-obesity effect of extract from fermented Curcuma longa L. through regulation of adipogenesis and lipolysis pathway in high-fat diet-induced obese rats. Food Sci. Nutr. 2016, 60, 30482–30490. [Google Scholar]
- Marco, M.L.; Heeney, D.; Binda, S.; Cifelli, C.J.; Cotter, P.D.; Foligné, B.; Gänzle, M.; Kort, R.; Pasin, G.; Pihlanto, A.; et al. Health benefits of fermented foods: Microbiota and beyond. Curr. Opin. Biotechnol. 2017, 44, 94–102. [Google Scholar] [CrossRef] [PubMed]
- Kuo, L.C.; Cheng, W.Y.; Wu, R.Y.; Huang, C.J.; Lee, K.T. Hydrolysis of black soybean isoflavone glycosides by Bacillus subtilis natto. Appl. Microbiol. Biotechnol. 2006, 73, 314–320. [Google Scholar] [CrossRef] [PubMed]
- Nakajima, V.M.; Madeira, J.V.; Macedo, G.A.; Macedo, J.A. Biotransformation effects on anti-lipogenic activity of citrus extracts. Food Chem. 2016, 197, 1046–1053. [Google Scholar] [CrossRef]
- Pourbafrani, M.; Forgács, G.; Horváth, I.S.; Niklasson, C.; Taherzadeh, M.J. Production of biofuels, limonene and pectin from citrus wastes. Bioresour. Technol. 2010, 101, 4246–4250. [Google Scholar] [CrossRef] [PubMed]
- Lone, J.; Yun, J.W. Monoterpene limonene induces brown fat-like phenotype in 3T3-L1 white adipocytes. Life Sci. 2016, 153, 198–206. [Google Scholar] [CrossRef] [PubMed]
- Santiago, J.V.A.; Jayachitra, J.; Shenbagam, M.; Nalini, N. D-limonene attenuates blood pressure and improves the lipid and antioxidant status in high fat diet and L-NAME treated rats. J. Pharm. Sci. Res. 2010, 11, 752–758. [Google Scholar]


| Characteristics | ND | HD | HD+LLFP | HD+MLFP | HD+HLFP |
|---|---|---|---|---|---|
| Body weight (g) | 485.10 ± 7.72 b | 514.55 ± 15.10 a | 462.93 ± 13.13 b | 481.20 ± 13.74 b | 464.88 ± 14.53 b |
| Weight gain (%) | 113.76 ± 0.63 b | 134.63 ± 10.90 a | 109.95 ± 7.35 bc | 113.63 ± 4.79 b | 101.38 ± 5.56 c |
| Food intake (g) | 25.32 ± 0.87 a | 21.54 ± 0.32 a | 21.72 ± 0.71 a | 20.64 ± 0.84 a | 21.09 ± 1.30 a |
| FCR (%) | 5.63 ± 0.67 a | 6.81 ± 0.43 a | 6.27 ± 0.96 a | 6.48 ± 0.42 a | 7.11 ± 1.66 a |
| Fat tissue (g) | 1.46 ± 0.29 c | 2.80 ± 0.59 a | 2.14 ± 0.50 b | 2.29 ± 0.39 b | 2.08 ± 0.51 b |
| Parameters | ND | HD | HD+LLFP | HD+MLFP | HD+HLFP |
|---|---|---|---|---|---|
| TG (mg/dL) | 59.78 ± 7.72 c | 90.56 ± 13.88 a | 66.64 ± 8.72 bc | 68.14 ± 15.84 bc | 75.20 ± 9.01 b |
| TC (mg/dL) | 69.22 ± 0.63 a | 64.40 ± 7.20 a | 68.33 ± 6.75 a | 64.73 ± 8.64 a | 61.86 ± 9.23 a |
| LDL-C (mg/dL) | 6.44 ± 0.87 a | 7.88 ± 1.89 a | 7.11 ± 1.57 a | 7.88 ± 0.99 a | 7.43 ± 0.98 a |
| HDL-C (mg/dL) | 46.63 ± 0.67 a | 31.91 ± 4.78 c | 32.50 ± 4.44 c | 35.50 ± 3.60 b | 38.71 ± 5.85 b |
| FFA (mmol/L) | 1.11 ± 0.29 b | 1.45 ± 0.16 a | 1.33 ± 0.16 a | 1.18 ± 0.10 b | 1.19 ± 0.07 b |
| Glucose (mg/dL) | 52.00 ± 4.24 b | 78.57 ± 11.73 a | 56.63 ± 9.27 b | 58.50 ± 8.78 b | 55.57 ± 11.79 b |
| Lipase (mmol/L) | 144.78 ± 15.84 a | 116.64 ± 19.39 c | 122.06 ± 12.07 bc | 135.63 ± 11.40 ab | 141.89 ± 16.93 b |
| Ketone body (mmol/L) | 1.07 ± 0.03 c | 1.32 ± 0.09 a | 1.30 ± 0.08 ab | 1.24 ± 0.08 b | 1.23 ± 0.09 b |
| AST (U/L) | 167.30 ± 20.29 a | 163.25 ± 13.86 a | 164.50 ± 12.08 a | 164.67 ± 20.70 a | 166.57 ± 23.79 a |
| ALT (U/L) | 44.71 ± 5.71 a | 42.00 ± 5.59 a | 44.67 ± 5.28 a | 46.13 ± 7.02 a | 45.83 ± 8.70 a |
| Creatinine (mg/dL) | 0.63 ± 0.02 a | 0.64 ± 0.04 a | 0.63 ± 0.05 a | 0.61 ± 0.04 a | 0.59 ± 0.09 a |
| BUN (mg/dL) | 2.23 ± 0.63 a | 2.20 ± 0.68 a | 2.18 ± 0.59 a | 2.22 ± 0.41 a | 2.16 ± 0.73 a |
| Na (mmol/L) | 153.84 ± 1.44 a | 153.25 ± 1.14 a | 153.89 ± 0.95 a | 153.14 ± 1.60 a | 153.58 ± 1.08 a |
| K (mmol/L) | 7.34 ± 0.68 a | 7.11 ± 0.39 a | 6.75 ± 0.49 a | 6.50 ± 0.60 a | 6.26 ± 0.42 a |
Publisher’s Note: MDPI stays neutral with regard to jurisdictional claims in published maps and institutional affiliations. |
© 2021 by the authors. Licensee MDPI, Basel, Switzerland. This article is an open access article distributed under the terms and conditions of the Creative Commons Attribution (CC BY) license (https://creativecommons.org/licenses/by/4.0/).
Share and Cite
Wu, C.-C.; Huang, Y.-W.; Hou, C.-Y.; Chen, Y.-T.; Dong, C.-D.; Chen, C.-W.; Singhania, R.-R.; Leang, J.-Y.; Hsieh, S.-L. The Anti-Obesity Effects of Lemon Fermented Products in 3T3-L1 Preadipocytes and in a Rat Model with High-Calorie Diet-Induced Obesity. Nutrients 2021, 13, 2809. https://doi.org/10.3390/nu13082809
Wu C-C, Huang Y-W, Hou C-Y, Chen Y-T, Dong C-D, Chen C-W, Singhania R-R, Leang J-Y, Hsieh S-L. The Anti-Obesity Effects of Lemon Fermented Products in 3T3-L1 Preadipocytes and in a Rat Model with High-Calorie Diet-Induced Obesity. Nutrients. 2021; 13(8):2809. https://doi.org/10.3390/nu13082809
Chicago/Turabian StyleWu, Chih-Chung, Yu-Wen Huang, Chih-Yao Hou, Ya-Ting Chen, Cheng-Di Dong, Chiu-Wen Chen, Reeta-Rani Singhania, Jie-Yin Leang, and Shu-Ling Hsieh. 2021. "The Anti-Obesity Effects of Lemon Fermented Products in 3T3-L1 Preadipocytes and in a Rat Model with High-Calorie Diet-Induced Obesity" Nutrients 13, no. 8: 2809. https://doi.org/10.3390/nu13082809