Clinical Characteristics and Disability Progression of Early- and Late-Onset Multiple Sclerosis Compared to Adult-Onset Multiple Sclerosis


 ,
, 
Abstract
:1. Introduction
2. Methods
2.1. Study Design and Data Source
2.2. Sample
2.3. Demographic and Clinical Features
- Time of MS onset: time of first manifestations and symptoms of MS.
- Initial symptoms were categorized into six types: motor dysfunction; sensory disturbances; visual impairments (optic neuropathy); brain stem dysfunction; cerebellar dysfunction; others.
- Delay in diagnosis: Elapsed time (days) between the first symptoms and the diagnosis of MS.
- An expert, trained and certified neurologist assessed individuals’ symptom severity using the Expanded Disability Status Scale (EDSS) [20].
- Following Lublin et al. [21], the course of disease was defined as relapsing-remitting (RRMS), primary progressive (PPMS) or secondary progressive (SPMS).
- Relatedly, we also calculated the length of the interval between first and second attack (termed first inter-attack interval).
- Disease-modifying therapies (DMTs) at follow-up were divided into first-line therapies (interferon beta, glatiramer acetate, dimethyl fumarate, teriflunomide), second- and third-line therapies (fingolimod, natalizumab, rituximab and mitoxantrone).
- The frequency of autoimmune comorbidity in each patient was evaluated.
- The history of comorbidity was evaluated at first visit via interview and was further assessed at each subsequent visit.
- We also obtained the history of MS in first and second-degree relatives of MS patients.
- The history of other autoimmune disorders in the first-degree relatives was calculated.
2.4. Magnetic Resonance Imaging (MRI)
2.5. Statistical Analysis
3. Results
3.1. Sample
3.2. Early Onset MS
3.3. Adult Onset MS
3.4. Late Onset MS
3.5. Comparisons of Sociodemographic and Illness-Related Features between Participants with Early Onset of MS (EOMS), Adult Onset of MS (AOMS) and Late Onset of MS (LOMS)
3.6. Clinical Characteristics between Participants with Early Onset of MS (EOMS), Adult Onset of MS (AOMS) and Late Onset of MS (LOMS)
3.7. Results from the MRI; Location of Brain Lesions, Gadolinium-Enhancing Brain Lesions, Spinal Lesions and Gadolinium-Enhancing Spinal Lesions, Separately for Participants with Early Onset of MS (EOMS), Adult Onset of MS (AOMS) and Late Onset of MS (LOMS)
3.8. Disability and Prognostic Variables between Participants with Early Onset of MS (EOMS), Adult Onset of MS (AOMS) and Late Onset of MS (LOMS)
4. Discussion
5. Conclusions
Author Contributions
Acknowledgments
Conflicts of Interest
References
- Reich, D.S.; Lucchinetti, C.F.; Calabresi, P.A. Multiple Sclerosis. N. Engl. J. Med. 2018, 378, 169–180. [Google Scholar] [CrossRef] [PubMed]
- Thompson, A.J.; Baranzini, S.E.; Geurts, J.; Hemmer, B.; Ciccarelli, O. Multiple sclerosis. Lancet (Lond. Engl.) 2018, 391, 1622–1636. [Google Scholar] [CrossRef]
- McDonald, W.I.; Compston, A.; Edan, G.; Goodkin, D.; Hartung, H.P.; Lublin, F.D.; McFarland, H.F.; Paty, D.W.; Polman, C.H.; Reingold, S.C. Recommended diagnostic criteria for multiple sclerosis: Guidelines from the International Panel on the diagnosis of multiple sclerosis. Ann. Neurol. Off. J. Am. Neurol. Assoc. Child. Neurol. Soc. 2001, 50, 121–127. [Google Scholar] [CrossRef] [PubMed]
- Polman, C.H.; Reingold, S.C.; Edan, G.; Filippi, M.; Hartung, H.P.; Kappos, L.; Lublin, F.D.; Metz, L.M.; McFarland, H.F.; O’Connor, P.W. Diagnostic criteria for multiple sclerosis: 2005 revisions to the “McDonald Criteria”. Ann. Neurol. Off. J. Am. Neurol. Assoc. Child. Neurol. Soc. 2005, 58, 840–846. [Google Scholar] [CrossRef] [PubMed] [Green Version]
- Polman, C.H.; Reingold, S.C.; Banwell, B.; Clanet, M.; Cohen, J.A.; Filippi, M.; Fujihara, K.; Havrdova, E.; Hutchinson, M.; Kappos, L. Diagnostic criteria for multiple sclerosis: 2010 revisions to the McDonald criteria. Ann. Neurol. 2011, 69, 292–302. [Google Scholar] [CrossRef] [PubMed] [Green Version]
- Thompson, A.J.; Banwell, B.L.; Barkhof, F.; Carroll, W.M.; Coetzee, T.; Comi, G.; Correale, J.; Fazekas, F.; Filippi, M.; Freedman, M.S. Diagnosis of multiple sclerosis: 2017 revisions of the McDonald criteria. Lancet Neurol. 2018, 17, 162–173. [Google Scholar] [CrossRef]
- Alroughani, R.; Boyko, A. Pediatric multiple sclerosis: A review. BMC Neurol. 2018, 18, 27. [Google Scholar] [CrossRef]
- Renoux, C.; Vukusic, S.; Mikaeloff, Y.; Edan, G.; Clanet, M.; Dubois, B.; Debouverie, M.; Brochet, B.; Lebrun-Frenay, C.; Pelletier, J. Natural history of multiple sclerosis with childhood onset. N. Engl. J. Med. 2007, 356, 2603–2613. [Google Scholar] [CrossRef]
- Yeh, E.A.; Chitnis, T.; Krupp, L.; Ness, J.; Chabas, D.; Kuntz, N.; Waubant, E.; US Network of Pediatric Multiple Sclerosis Centers of Excellence. Pediatric multiple sclerosis. Nat. Rev. Neurol. 2009, 5, 621–631. [Google Scholar] [CrossRef]
- Banwell, B.; Ghezzi, A.; Bar-Or, A.; Mikaeloff, Y.; Tardieu, M. Multiple sclerosis in children: Clinical diagnosis, therapeutic strategies, and future directions. Lancet Neurol. 2007, 6, 887–902. [Google Scholar] [CrossRef]
- Waldman, A.; Ghezzi, A.; Bar-Or, A.; Mikaeloff, Y.; Tardieu, M.; Banwell, B. Multiple sclerosis in children: An update on clinical diagnosis, therapeutic strategies, and research. Lancet Neurol. 2014, 13, 936–948. [Google Scholar] [CrossRef] [Green Version]
- Ruet, A. Update on pediatric-onset multiple sclerosis. Rev. Neurol. 2018, 174, 398–407. [Google Scholar] [CrossRef] [PubMed]
- Louapre, C.; Papeix, C.; Lubetzki, C.; Maillart, E. Multiple sclerosis and aging. Geriatr. Psychol. Neuropsychiatr. Vieil. 2017, 15, 402–408. [Google Scholar] [CrossRef] [PubMed]
- Roohani, P.; Emiru, T.; Carpenter, A.; Luzzio, C.; Freeman, J.; Scarberry, S.; Beaver, G.; Davidson, L.; Parry, G. Late onset multiple sclerosis: Is it really late onset? Mult. Scler. Relat. Disord. 2014, 3, 444–449. [Google Scholar] [CrossRef]
- Polliack, M.L.; Barak, Y.; Achiron, A. Late-onset multiple sclerosis. J. Am. Geriatr. Soc. 2001, 49, 168–171. [Google Scholar] [CrossRef]
- Vaughn, C.B.; Jakimovski, D.; Kavak, K.S.; Ramanathan, M.; Benedict, R.H.B.; Zivadinov, R.; Weinstock-Guttman, B. Epidemiology and treatment of multiple sclerosis in elderly populations. Nat. Rev. Neurol. 2019, 15, 329–342. [Google Scholar] [CrossRef]
- Azami, M.; YektaKooshali, M.H.; Shohani, M.; Khorshidi, A.; Mahmudi, L. Epidemiology of multiple sclerosis in Iran: A systematic review and meta-analysis. PLoS ONE 2019, 14, e0214738. [Google Scholar]
- Krupp, L.B.; Banwell, B.; Tenembaum, S. Consensus definitions proposed for pediatric multiple sclerosis and related disorders. Neurology 2007, 68, S7–S12. [Google Scholar] [CrossRef]
- Lotti, C.B.C.; Oliveira, A.S.B.; Bichuetti, D.B.; Castro, I.; Oliveira, E.M.L. Late onset multiple sclerosis: Concerns in aging patients. Arq. Neuropsiquiatr. 2017, 75, 451–456. [Google Scholar] [CrossRef] [Green Version]
- Kurtzke, J.F. Rating neurologic impairment in multiple sclerosis: An expanded disability status scale (EDSS). Neurology 1983, 33, 1444. [Google Scholar] [CrossRef] [Green Version]
- Lublin, F.D.; Reingold, S.C.; Cohen, J.A.; Cutter, G.R.; Sørensen, P.S.; Thompson, A.J.; Wolinsky, J.S.; Balcer, L.J.; Banwell, B.; Barkhof, F. Defining the clinical course of multiple sclerosis: The 2013 revisions. Neurology 2014, 83, 278–286. [Google Scholar] [CrossRef] [PubMed] [Green Version]
- Lublin, F.D.; Baier, M.; Cutter, G. Effect of relapses on development of residual deficit in multiple sclerosis. Neurology 2003, 61, 1528–1532. [Google Scholar] [CrossRef] [PubMed]
- Leray, E.; Yaouanq, J.; Le Page, E.; Coustans, M.; Laplaud, D.; Oger, J.; Edan, G. Evidence for a two-stage disability progression in multiple sclerosis. Brain 2010, 133, 1900–1913. [Google Scholar] [CrossRef] [PubMed] [Green Version]
- Scalfari, A.; Neuhaus, A.; Degenhardt, A.; Rice, G.P.; Muraro, P.A.; Daumer, M.; Ebers, G.C. The natural history of multiple sclerosis, a geographically based study 10: Relapses and long-term disability. Brain 2010, 133, 1914–1929. [Google Scholar] [CrossRef]
- Filippi, M.; Rocca, M.A.; Ciccarelli, O.; De Stefano, N.; Evangelou, N.; Kappos, L.; Rovira, A.; Sastre-Garriga, J.; Tintorè, M.; Frederiksen, J.L.; et al. MRI criteria for the diagnosis of multiple sclerosis: MAGNIMS consensus guidelines. Lancet. Neurol. 2016, 15, 292–303. [Google Scholar] [CrossRef] [Green Version]
- Boiko, A.; Vorobeychik, G.; Paty, D.; Devonshire, V.; Sadovnick, D. Early onset multiple sclerosis: A longitudinal study. Neurology 2002, 59, 1006–1010. [Google Scholar] [CrossRef]
- Harding, K.E.; Liang, K.; Cossburn, M.D.; Ingram, G.; Hirst, C.L.; Pickersgill, T.P.; Naude, J.T.W.; Wardle, M.; Ben-Shlomo, Y.; Robertson, N.P. Long-term outcome of paediatric-onset multiple sclerosis: A population-based study. J. Neurol. Neurosurg. Psychiatry 2013, 84, 141–147. [Google Scholar] [CrossRef]
- University of California, San Francisco MS-EPIC Team; Cree, B.A.; Gourraud, P.A.; Oksenberg, J.R.; Bevan, C.; Crabtree-Hartman, E.; Gelfand, J.M.; Goodin, D.S.; Graves, J.; Green, A.J. Long-term evolution of multiple sclerosis disability in the treatment era. Ann. Neurol. 2016, 80, 499–510. [Google Scholar] [CrossRef]
- Tremlett, H.; Zhao, Y.; Devonshire, V. Natural history of secondary-progressive multiple sclerosis. Mult. Scler. J. 2008, 14, 314–324. [Google Scholar] [CrossRef]
- Simone, I.; Carrara, D.; Tortorella, C.; Liguori, M.; Lepore, V.; Pellegrini, F.; Bellacosa, A.; Ceccarelli, A.; Pavone, I.; Livrea, P. Course and prognosis in early-onset MS: Comparison with adult-onset forms. Neurology 2002, 59, 1922–1928. [Google Scholar] [CrossRef]
- McKay, K.A.; Hillert, J.; Manouchehrinia, A. Long-term disability progression of pediatric-onset multiple sclerosis. Neurology 2019, 92, e2764–e2773. [Google Scholar] [CrossRef] [PubMed] [Green Version]
- Miller, D.H.; Leary, S.M. Primary-progressive multiple sclerosis. Lancet Neurol 2007, 6, 903–912. [Google Scholar] [CrossRef]
- Frischer, J.M.; Bramow, S.; Dal-Bianco, A.; Lucchinetti, C.F.; Rauschka, H.; Schmidbauer, M.; Laursen, H.; Sorensen, P.S.; Lassmann, H. The relation between inflammation and neurodegeneration in multiple sclerosis brains. Brain 2009, 132, 1175–1189. [Google Scholar] [CrossRef] [PubMed] [Green Version]
- Bramow, S.; Frischer, J.M.; Lassmann, H.; Koch-Henriksen, N.; Lucchinetti, C.F.; Sørensen, P.S.; Laursen, H. Demyelination versus remyelination in progressive multiple sclerosis. Brain 2010, 133, 2983–2998. [Google Scholar] [CrossRef] [PubMed] [Green Version]
- Sim, F.J.; Zhao, C.; Penderis, J.; Franklin, R.J. The age-related decrease in CNS remyelination efficiency is attributable to an impairment of both oligodendrocyte progenitor recruitment and differentiation. J. Neurosci. 2002, 22, 2451–2459. [Google Scholar] [CrossRef]
- Lu, T.; Pan, Y.; Kao, S.-Y.; Li, C.; Kohane, I.; Chan, J.; Yankner, B.A. Gene regulation and DNA damage in the ageing human brain. Nature 2004, 429, 883. [Google Scholar] [CrossRef] [PubMed]
- Sanai, S.A.; Saini, V.; Benedict, R.H.; Zivadinov, R.; Teter, B.E.; Ramanathan, M.; Weinstock-Guttman, B. Aging and multiple sclerosis. Mult. Scler. 2016, 22, 717–725. [Google Scholar] [CrossRef] [Green Version]
- Kis, B.; Rumberg, B.; Berlit, P. Clinical characteristics of patients with late-onset multiple sclerosis. J. Neurol. 2008, 255, 697–702. [Google Scholar] [CrossRef]
- Tremlett, H.; Devonshire, V. Is late-onset multiple sclerosis associated with a worse outcome? Neurology 2006, 67, 954–959. [Google Scholar] [CrossRef]
- Kappos, L.; Kuhle, J.; Multanen, J.; Kremenchutzky, M.; di Cantogno, E.V.; Cornelisse, P.; Lehr, L.; Casset-Semanaz, F.; Issard, D.; Uitdehaag, B.M. Factors influencing long-term outcomes in relapsing–remitting multiple sclerosis: PRISMS-15. J. Neurol. Neurosurg. Psychiatry 2015, 86, 1202–1207. [Google Scholar] [CrossRef] [Green Version]
- Fambiatos, A.; Jokubaitis, V.; Spelman, T.; Horakova, D.; Havrdova, E.; Trojano, M.; Prat, A.; Girard, M.; Duquette, P.; Lugaresi, A. Risk of secondary progressive multiple sclerosis: A longitudinal study. Mult. Scler. J. 2017, 23, 109–112. [Google Scholar] [CrossRef] [PubMed]
- Gorman, M.P.; Healy, B.C.; Polgar-Turcsanyi, M.; Chitnis, T. Increased relapse rate in pediatric-onset compared with adult-onset multiple sclerosis. Arch. Neurol. 2009, 66, 54–59. [Google Scholar] [CrossRef] [PubMed] [Green Version]
- Song, J.; Westerlind, H.; McKay, K.A.; Almqvist, C.; Stridh, P.; Kockum, I.; Hillert, J.; Manouchehrinia, A. Familial risk of early-and late-onset multiple sclerosis: A Swedish nationwide study. J. Neurol. 2019, 266, 481–486. [Google Scholar] [CrossRef] [PubMed] [Green Version]
- Sadovnick, A.D.; Yee, I.M.; Ebers, G.C.; Risch, N.J. Effect of age at onset and parental disease status on sibling risks for MS. Neurology 1998, 50, 719–723. [Google Scholar] [CrossRef] [PubMed]
- Montomoli, C.; Prokopenko, I.; Caria, A.; Ferrai, R.; Mander, A.; Seaman, S.; Musu, L.; Piras, M.L.; Ticca, A.F.; Murgia, S.B. Multiple sclerosis recurrence risk for siblings in an isolated population of Central Sardinia, Italy. Genet. Epidemiol. Off. Publ. Int. Genet. Epidemiol. Soc. 2002, 22, 265–271. [Google Scholar] [CrossRef]
- Banwell, B.; Shroff, M.; Ness, J.M.; Jeffery, D.; Schwid, S.; Weinstock-Guttman, B. MRI features of pediatric multiple sclerosis. Neurology 2007, 68, S46–S53. [Google Scholar] [CrossRef]
- Filippi, M.; Wolinsky, J.; Comi, G. Enhancement frequency decreases with increasing age in relapsing-remitting multiple sclerosis. Neurology 2001, 56, 422–423. [Google Scholar] [CrossRef]
- Verhey, L.H.; Branson, H.M.; Makhija, M.; Shroff, M.; Banwell, B. Magnetic resonance imaging features of the spinal cord in pediatric multiple sclerosis: A preliminary study. Neuroradiology 2010, 52, 1153–1162. [Google Scholar] [CrossRef]
- De Seze, J.; Delalande, S.; Michelin, E.; Gauvrit, J.; Mackowiak, M.; Ferriby, D.; Stojkovic, T.; Defebvre, L.; Pruvo, J.; Vermersch, P. Brain MRI in late-onset multiple sclerosis. Eur. J. Neurol. 2005, 12, 241–244. [Google Scholar] [CrossRef]
- Sadeghi Bahmani, D.; Esmaeili, L.; Shaygannejad, V.; Gerber, M.; Kesselring, J.; Lang, U.E.; Holsboer-Trachsler, E.; Brand, S. Stability of Mental Toughness, Sleep Disturbances, and Physical Activity in Patients With Multiple Sclerosis (MS)-A Longitudinal and Pilot Study. Front. Psychiatry 2018, 9, 182. [Google Scholar] [CrossRef] [Green Version]
- Sadeghi Bahmani, D.; Gerber, M.; Kalak, N.; Lemola, S.; Clough, P.J.; Calabrese, P.; Shaygannejad, V.; Puhse, U.; Holsboer-Trachsler, E.; Brand, S. Mental toughness, sleep disturbances, and physical activity in patients with multiple sclerosis compared to healthy adolescents and young adults. Neuropsychiatr. Dis. Treat. 2016, 12, 1571–1579. [Google Scholar] [CrossRef] [PubMed]
- Sadeghi Bahmani, D.; Razazian, N.; Farnia, V.; Alikhani, M.; Tatari, F.; Brand, S. Compared to an active control condition, in persons with multiple sclerosis two different types of exercise training improved sleep and depression, but not fatigue, paresthesia, and intolerance of uncertainty. Mult. Scler. Relat. Disord. 2019, 36, 101356. [Google Scholar] [CrossRef] [PubMed]
- Sadeghi Bahmani, D.; Razazian, N.; Motl, R.W.; Farnia, V.; Alikhani, M.; Pühse, U.; Gerber, M.; Brand, S. Physical activity interventions can improve emotion regulation and dimensions of empathy in persons with multiple sclerosis: An exploratory study. Mult. Scler. Relat. Disord. 2020, 37, 101380. [Google Scholar] [CrossRef] [PubMed]
- Caminero, A.; Bartolome, M. Sleep disturbances in multiple sclerosis. J. Neurol. Sci. 2011, 309, 86–91. [Google Scholar] [CrossRef] [PubMed]
- Sadeghi Bahmani, D.; Kesselring, J.; Papadimitriou, M.; Bansi, J.; Puhse, U.; Gerber, M.; Shaygannejad, V.; Holsboer-Trachsler, E.; Brand, S. In Patients With Multiple Sclerosis, Both Objective and Subjective Sleep, Depression, Fatigue, and Paresthesia Improved After 3 Weeks of Regular Exercise. Front. Psychiatry 2019, 10, 265. [Google Scholar] [CrossRef] [PubMed] [Green Version]
- Coote, S.; Uszynski, M.; Herring, M.P.; Hayes, S.; Scarrott, C.; Newell, J.; Gallagher, S.; Larkin, A.; Motl, R.W. Effect of exercising at minimum recommendations of the multiple sclerosis exercise guideline combined with structured education or attention control education—Secondary results of the step it up randomised controlled trial. BMC Neurol. 2017, 17, 119. [Google Scholar] [CrossRef] [PubMed]
- Motl, R.W.; Sandroff, B.M.; Kwakkel, G.; Dalgas, U.; Feinstein, A.; Heesen, C.; Feys, P.; Thompson, A.J. Exercise in patients with multiple sclerosis. Lancet Neurol. 2017, 16, 848–856. [Google Scholar] [CrossRef]
- Baird, J.F.; Cederberg, K.L.J.; Sikes, E.M.; Jeng, B.; Sasaki, J.E.; Sandroff, B.M.; Motl, R.W. Changes in Cognitive Performance With Age in Adults With Multiple Sclerosis. Cogn. Behav. Neurol. Off. J. Soc. Behav. Cogn. Neurol. 2019, 32, 201–207. [Google Scholar] [CrossRef]
- Confavreux, C.; Vukusic, S. The clinical course of multiple sclerosis. Handb. Clin. Neurol. 2014, 122, 343–369. [Google Scholar] [CrossRef]
- McKay, K.A.; Tremlett, H.; Zhu, F.; Kastrukoff, L.; Marrie, R.A.; Kingwell, E. A population-based study comparing multiple sclerosis clinic users and non-users in British Columbia, Canada. Eur. J. Neurol. 2016, 23, 1093–1100. [Google Scholar] [CrossRef] [Green Version]


| Samples | Statistics (between Groups) | |||||
|---|---|---|---|---|---|---|
| Whole sample | Early onset of MS (EOMS) | Adult onset of MS (AOMS) | Late onset of MS (LOMS) | Post-hoc analysis | ||
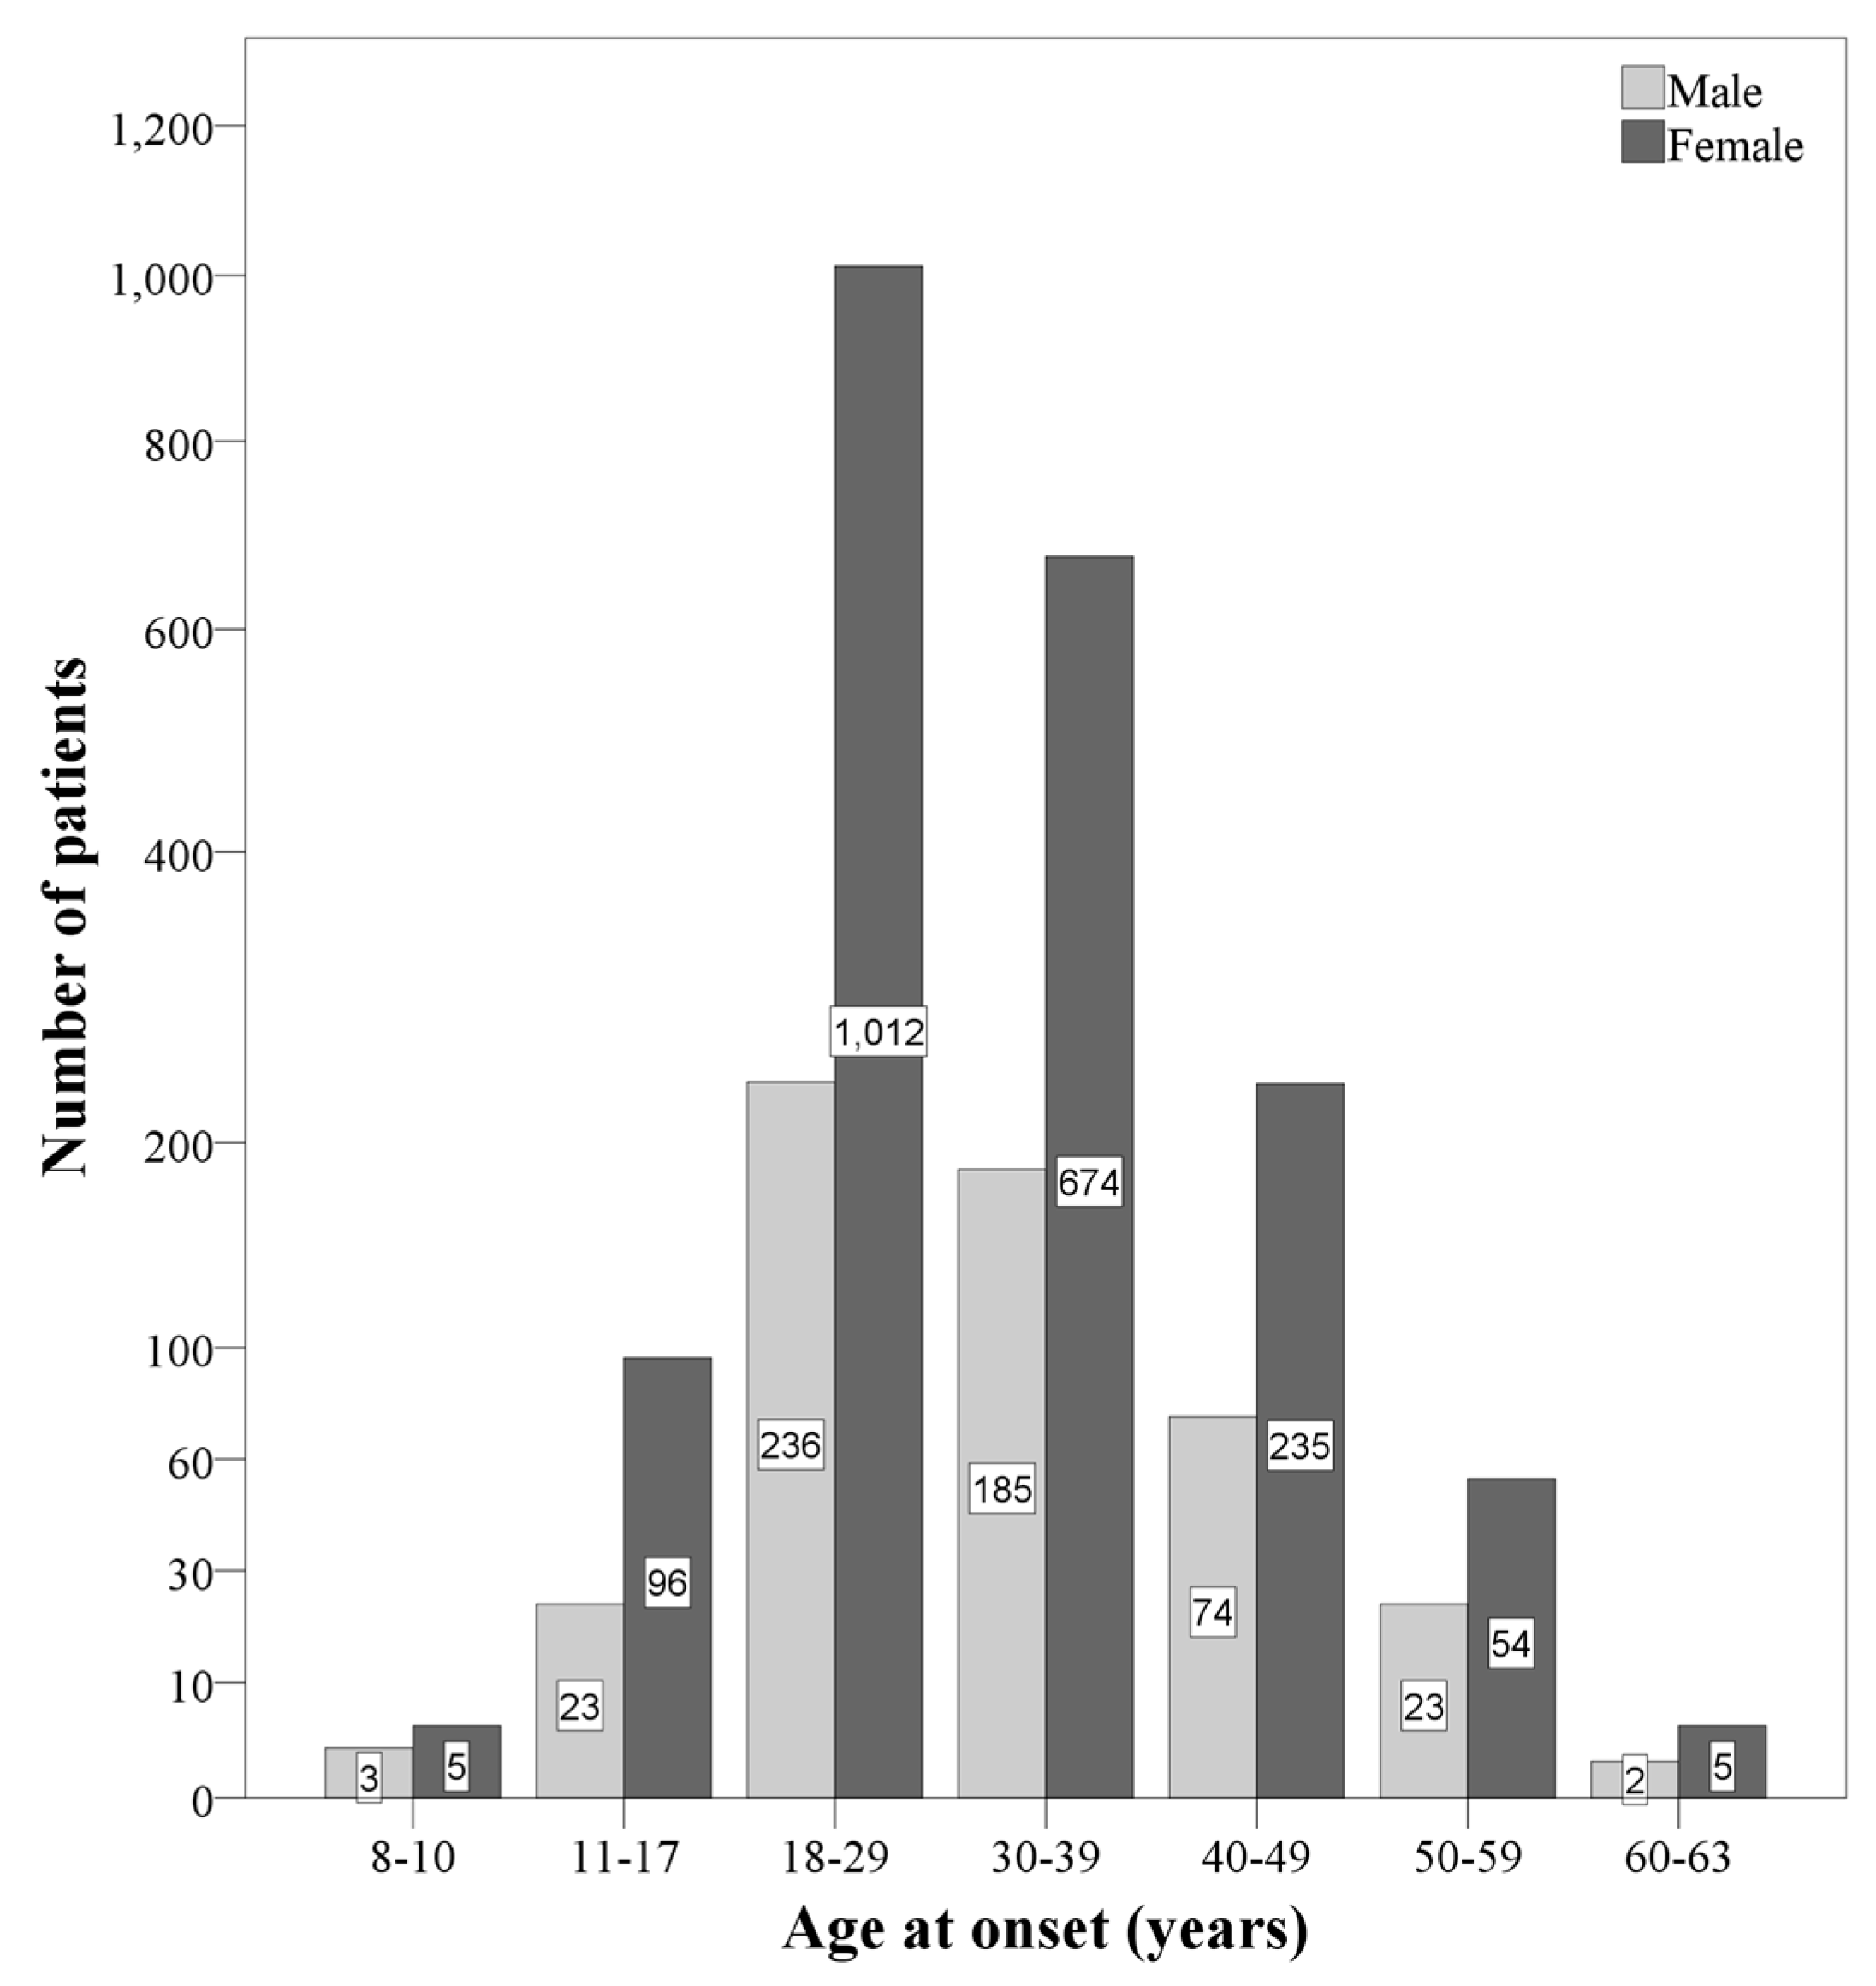
| N | 2627 | 127 | 2416 | 84 | ||
| n (%) | n (%) | n (%) | n (%) | |||
| Sex (females) | 2081 (79.2%) | 101 (79.5%) | 1921 (79.5%) | 59 (70.2%) | X2(N = 2627, df = 2) = 4.25 | - |
| M (SD) | M (SD) | M (SD) | M (SD) | |||
| Current age (years) | 37.6 (9.87) | 25.20 (7.15) | 37.42 (8.85) | 58.79 (5.47) | F(2, 2624) = 378.85 *** p2 = 0.224 (L) | EOMS < AOMS EOMS < LOMS AOMS < LOMS |
| Age at onset (years) | 30.21 (9.04) | 14.8 (2.29) | 30.00 (7.50) | 53.97 (3.35) | F(2, 2624) = 336.47 *** p2 = 0.360 (L) | EOMS < AOMS EOMS < LOMS AOMS < LOMS |
| Time lapse from diagnosis to follow-up | 8.64 (6.06) | 11.47 (7.34) | 8.59 (5.99) | 5.93 (4.57) | F(2, 2624) = 22.66 *** p2 = 0.017 (T) | EOMS > AOMS EOMS > LOMS AOMS > LOMS |
| Samples | Statistics (between Groups) | ||||||
|---|---|---|---|---|---|---|---|
| Whole sample | Early onset of MS (EOMS) | Adult onset of MS (AOMS) | Late onset of MS (LOMS) | Post-hoc tests | |||
| N | 2627 | 127 | 2416 | 84 | |||
| n (%) | n (%) | n (%) | n (%) | ||||
| Autoimmune comorbidity (yes vs. no) | 440 (16.7%) | 31 (24.4%) | 402 (16.6%) | 7 (8.3%) | X2(N = 440, df = 2) = 3.42 | ||
| MS familial history | First degree (yes vs. no) | 250 (9.5%) | 15 (11.8%) | 227 (9.4%) | 8 (9.5%) | X2(N = 632, df = 3) = 2.45 | |
| Second degree (yes vs. no) | 382 (14.5%) | 14 (11.0%) | 362 (15.0%) | 6 (7.1%) | |||
| Family history of other autoimmune disorder (first degree) (yes vs. no) | 125 (4.8%) | 4 (3.1%) | 115 (4.8%) | 6 (7.1%) | X2(N = 125, df = 1) = 1.95 | ||
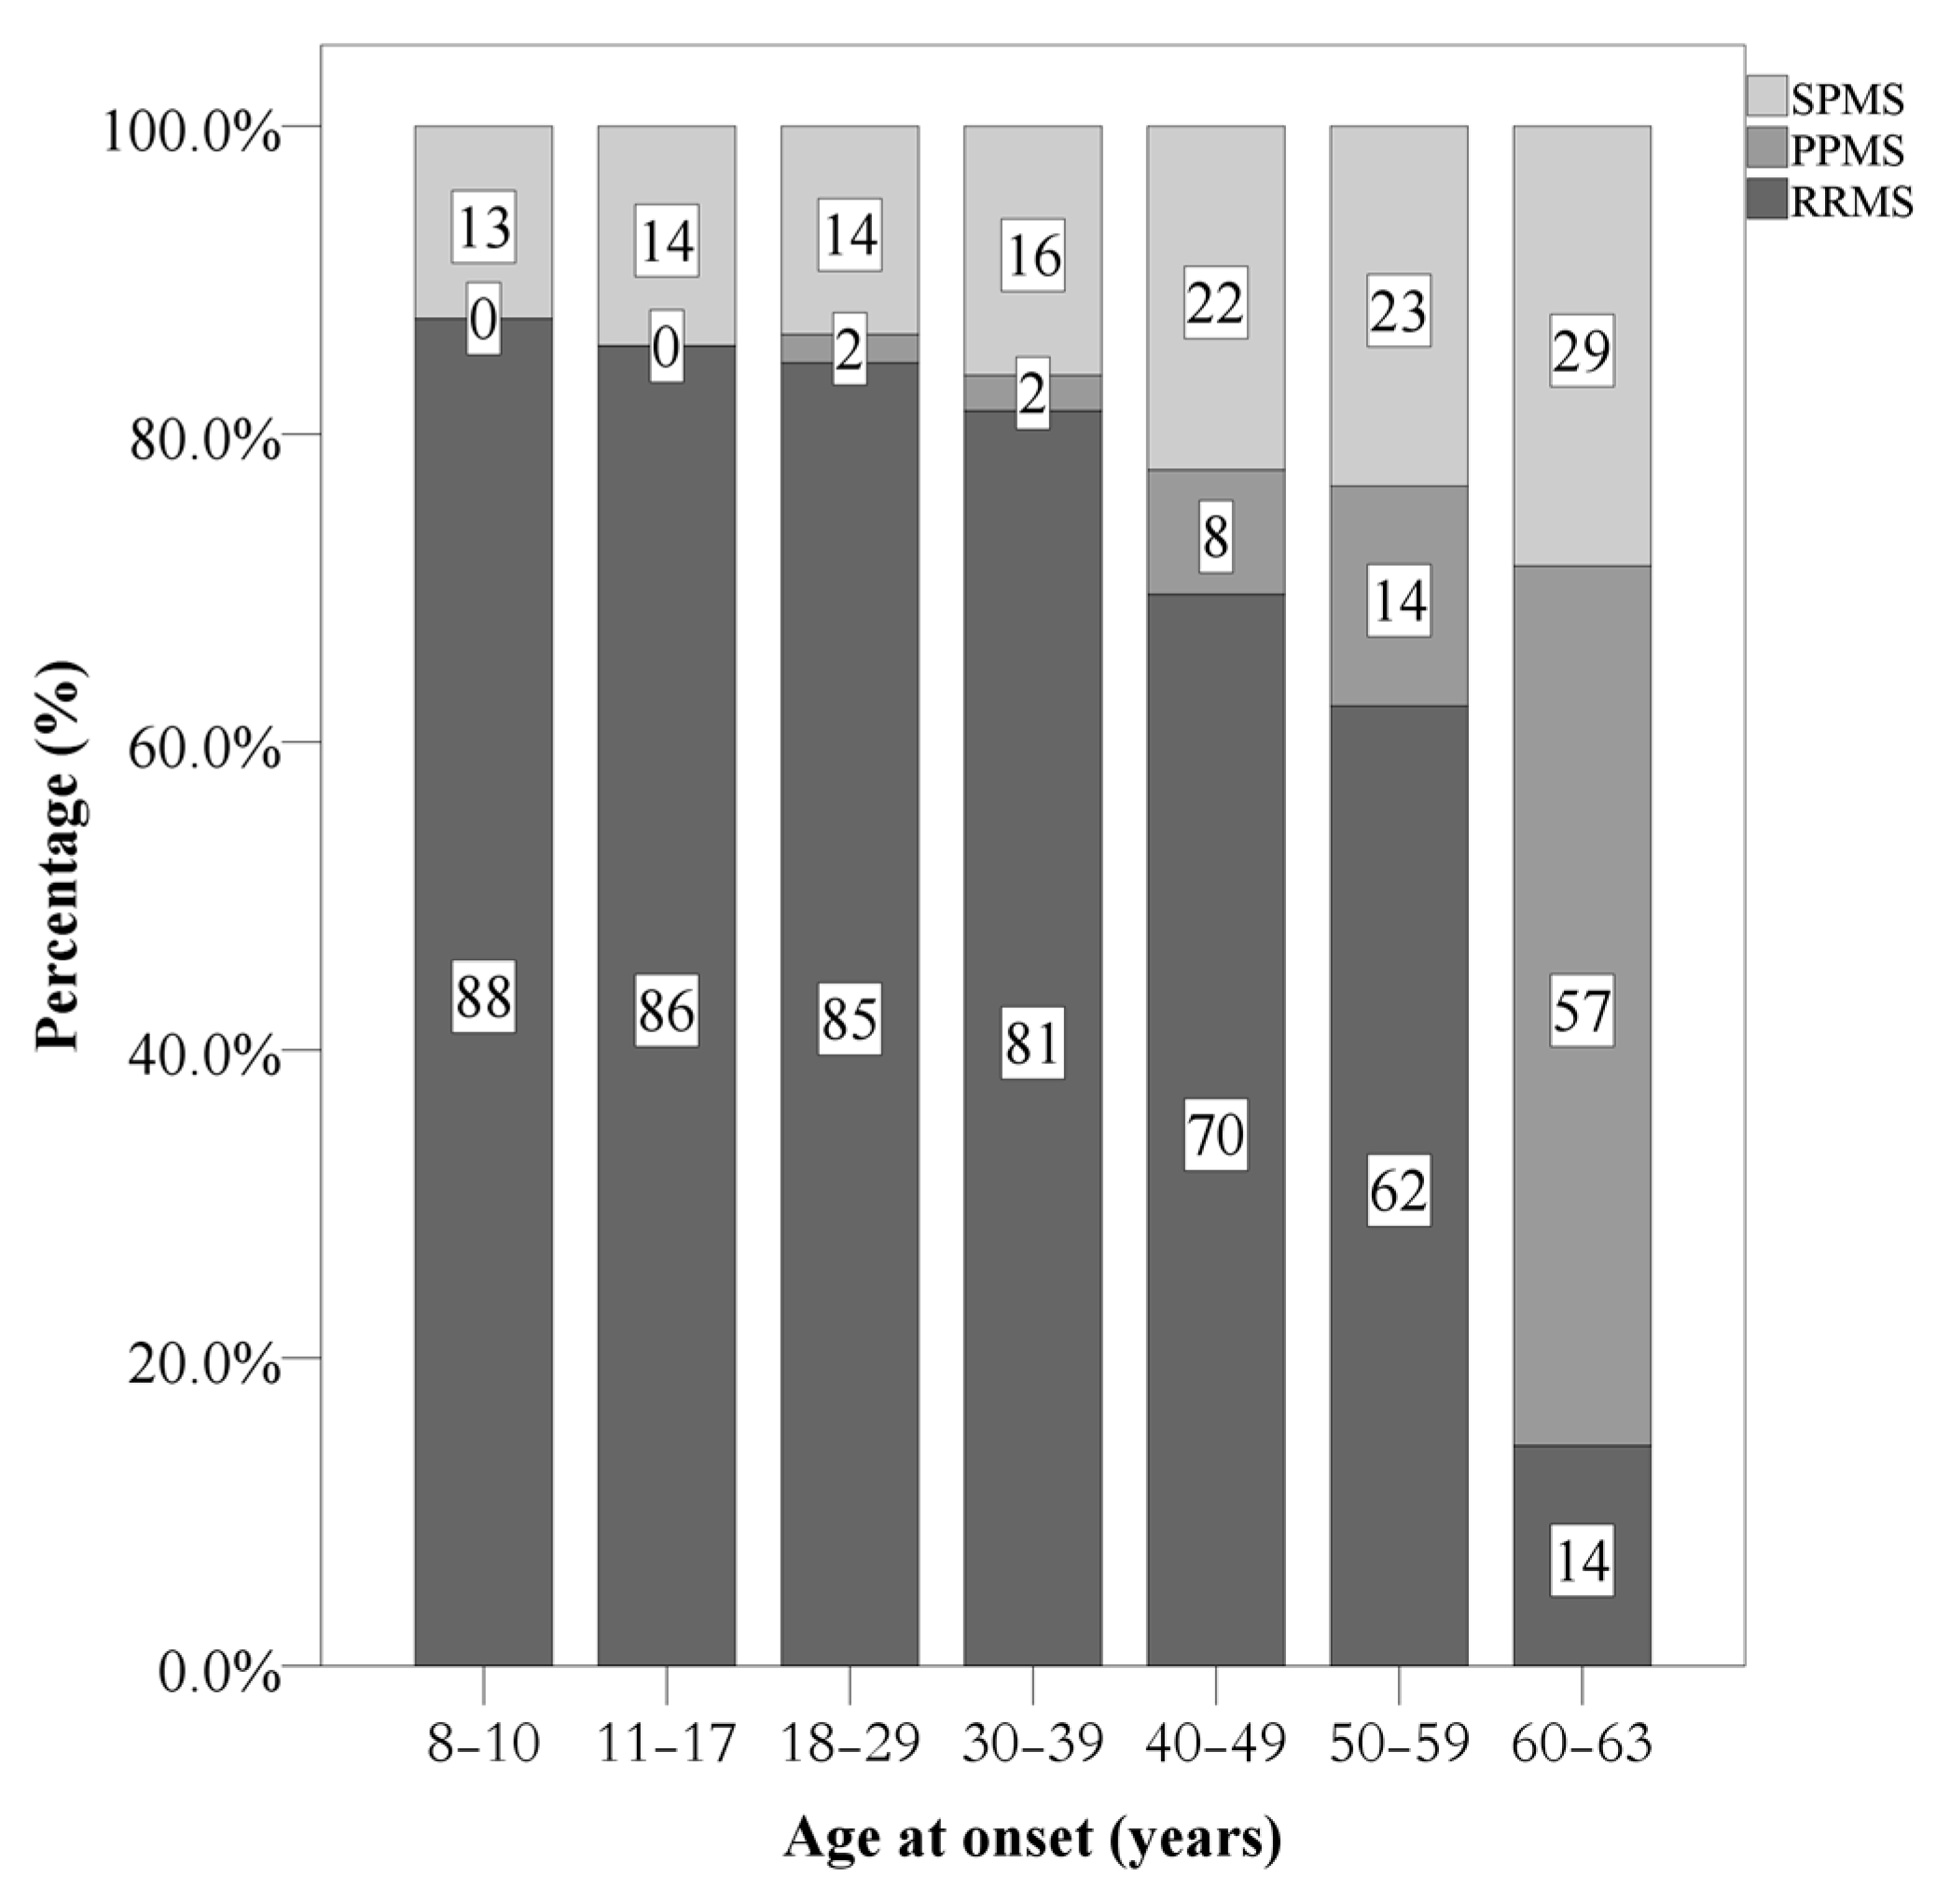
| Current disease course | Relapsing remitting MS | 2129 (81.0%) | 109 (85.8%) | 1971 (81.6%) | 49 (58.3%) | X2(N = 2627, df = 4) = 71.83 *** | |
| Secondary progressive MS | 415 (15.8%) | 18 (14.2%) | 377 (15.6) | 20 (23.8%) | POMS: more RRMS, less SPMS, low PPMS AOMS: more LOMS: more sPMS and PPMS | ||
| Primary progressive MS | 83 (3.2%) | - | 68 (2.8%) | 15 (17.9%) | |||
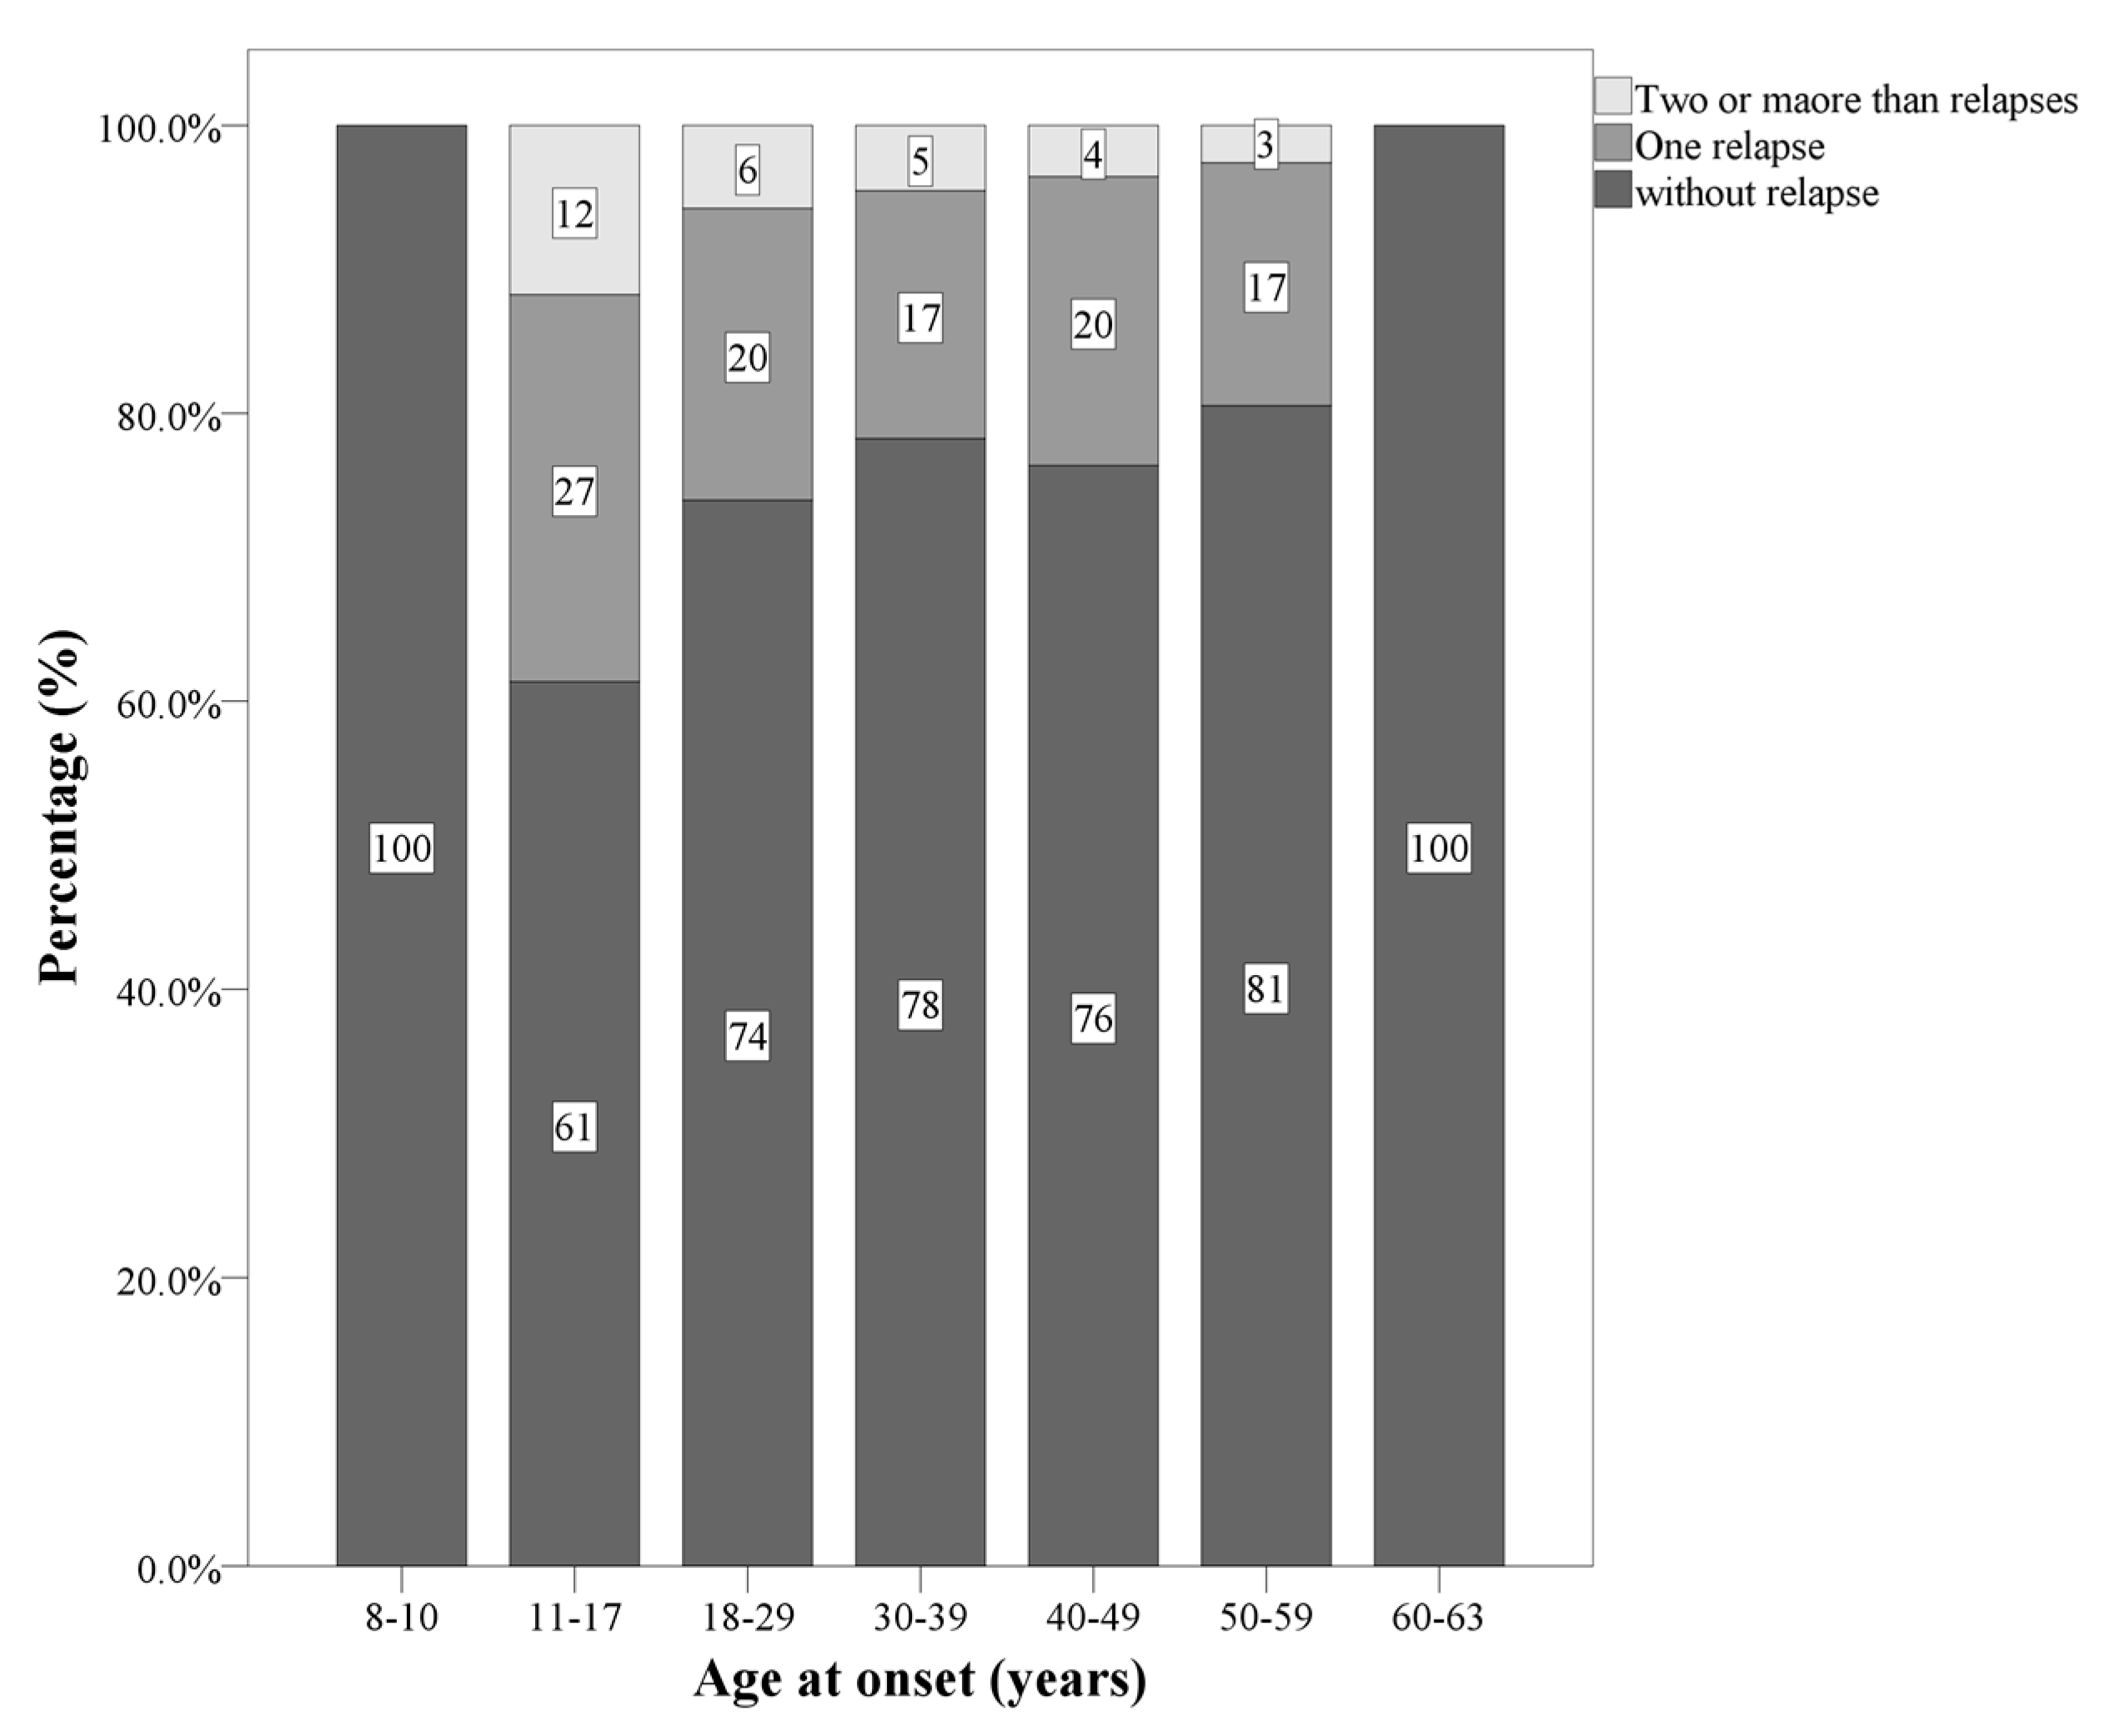
| Number of patients with relapse in the first two years | 0/1/2/3 | 1981/508/122/16 | 81/32/14/0 | 1831/463/106/16 | 69/13/2/0 | X2(N = 2627, df = 6) = 19.57 *** | POMS: 1 and 2 relapses AOMS: zero and 3 relapsaes LOMS: 0 relapses |
| Median (range) | Median (range) | Median (range) | Median (range) | ||||
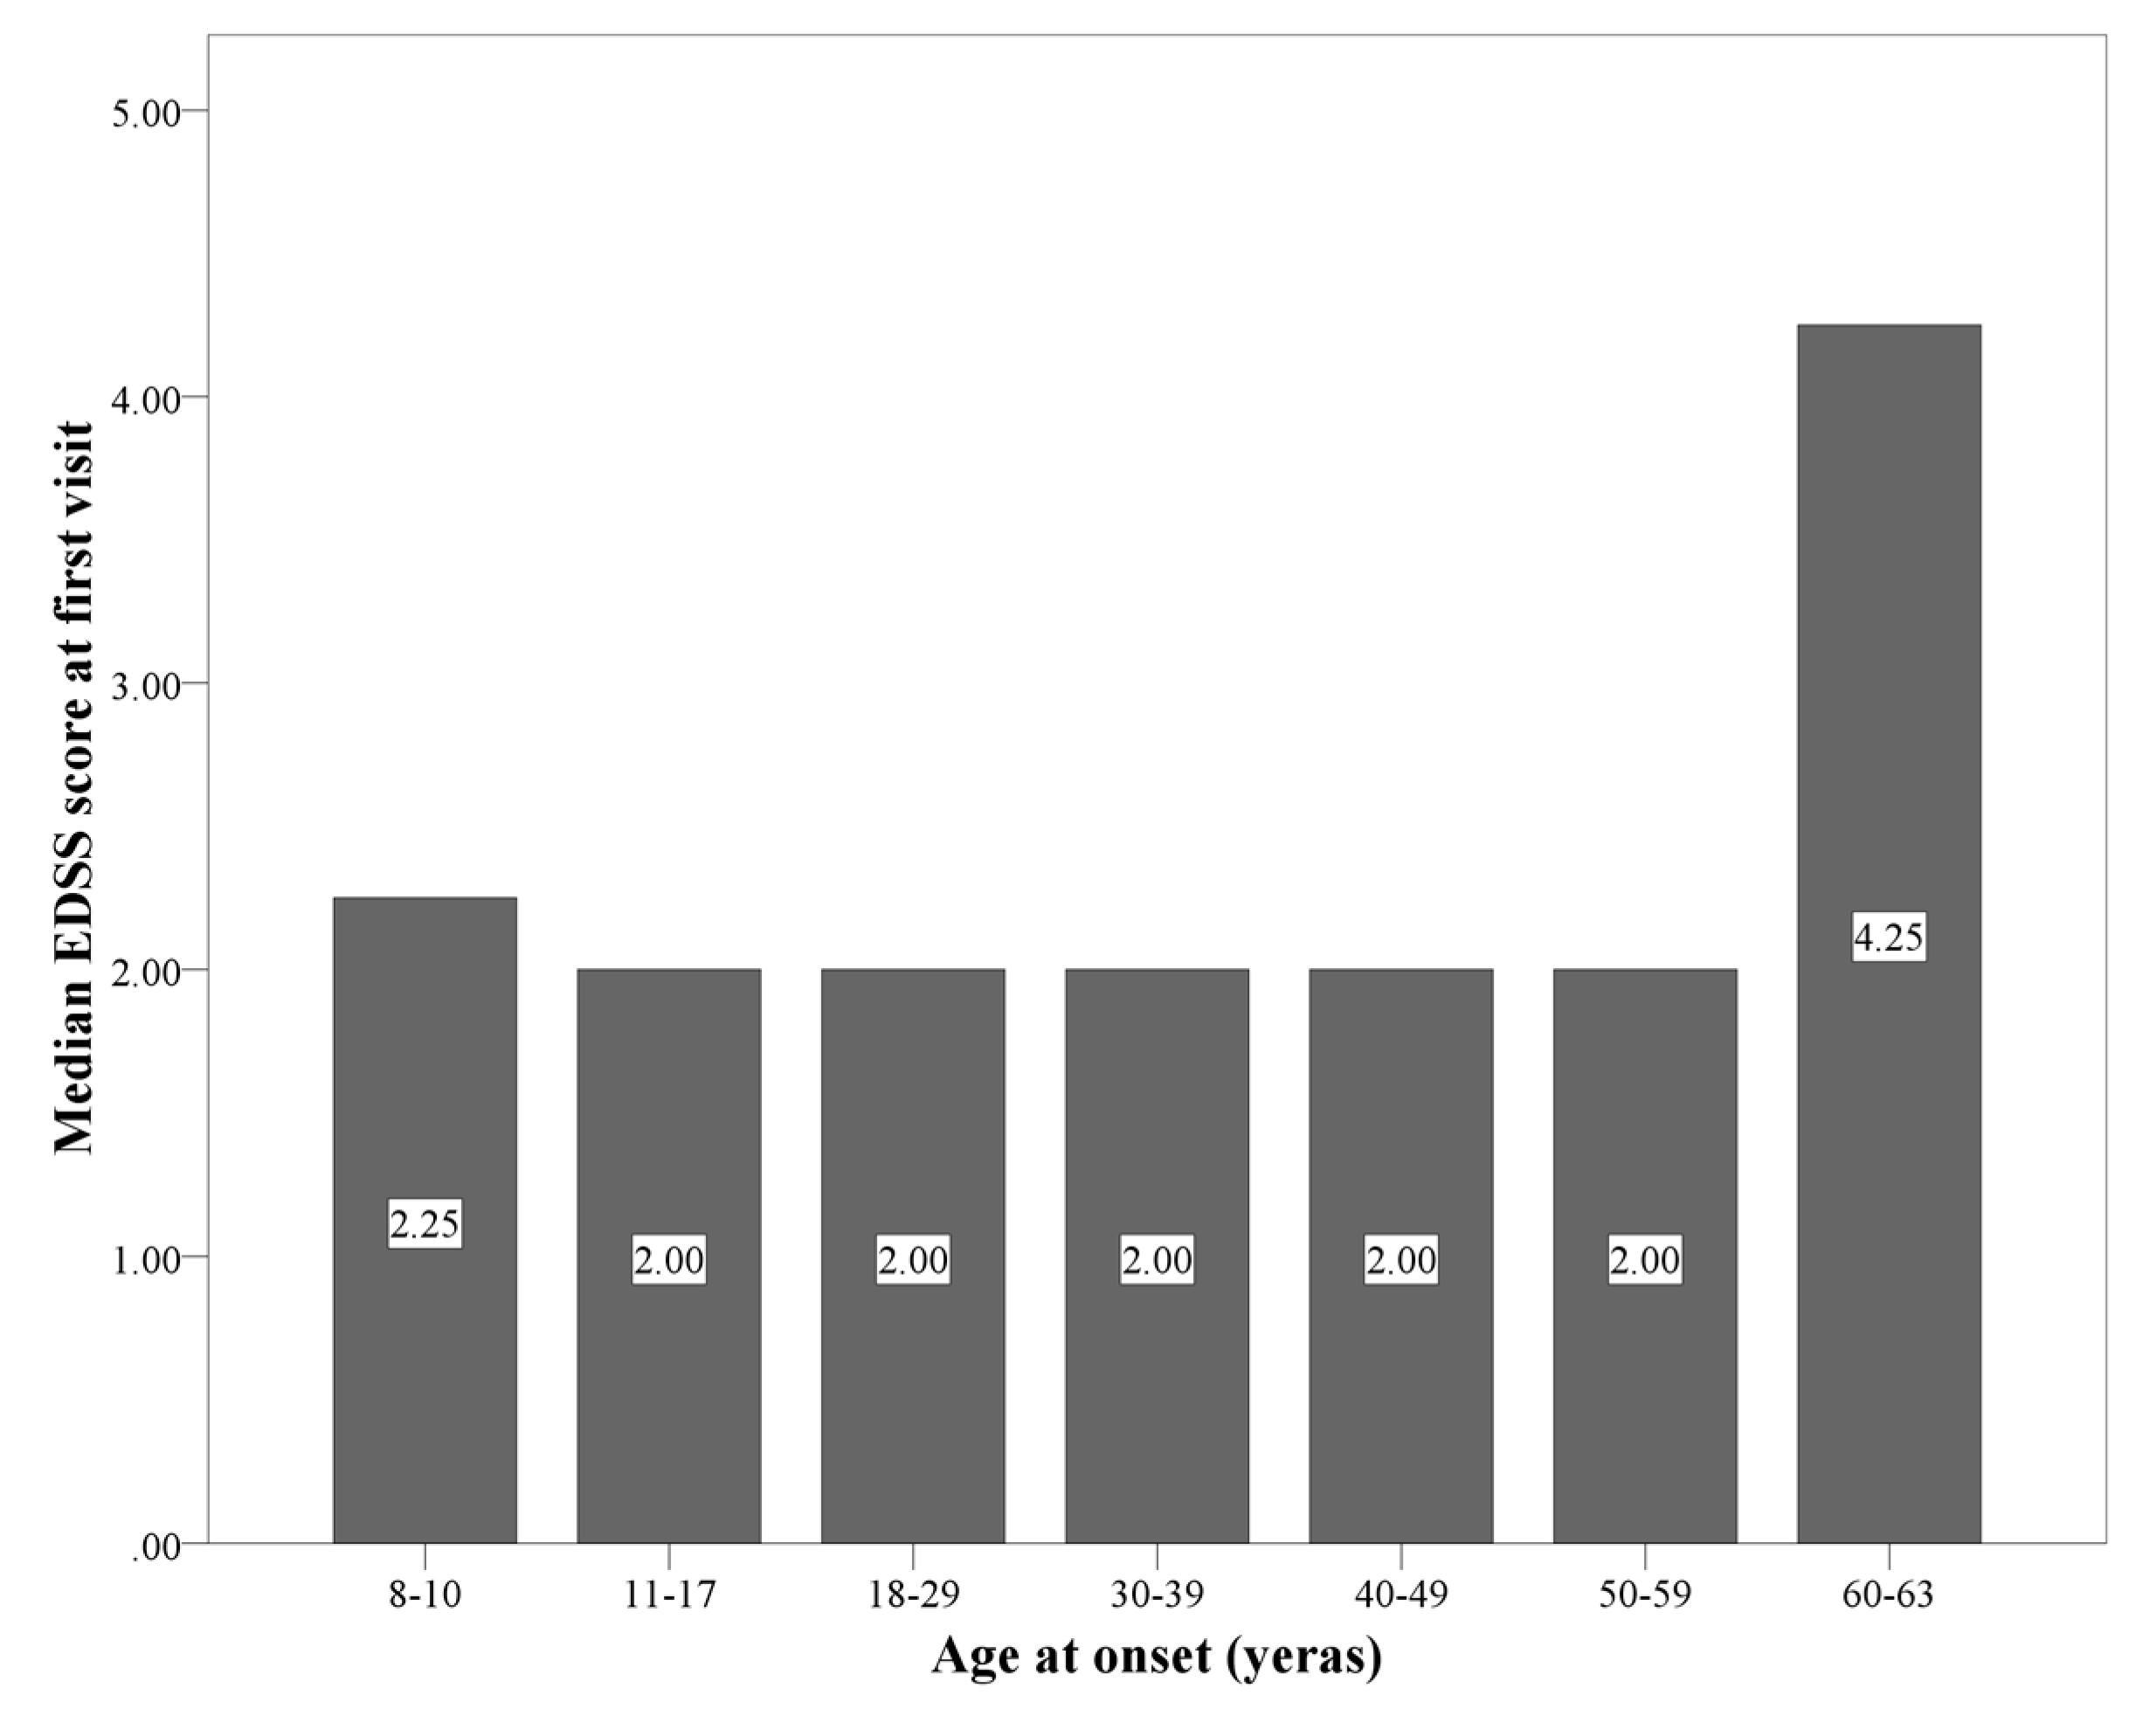
| EDSS at first visit | 2.0 (1.0–2.5) | 2.0 (0.0–2.0) | 2.0 (1.0–2.5) | 2.25 (2.0–3.0) | H(N = 2608, df = 2) = 31.38 *** | LOMS > POMS; AOMS | |
| EDSS at last follow-up | 1.0 (0.0–2.5) | 0.0 (0.0–2.0) | 1.0 (0.0–2.5) | 2.25 (0.75–5.0) | H(N = 2608, df = 2) = 27.69 *** | LOMS > POMS; AOMS | |
| First inter-attack interval (years) | 3.0 (1.0–5.0) | 2.0 (1.0–4.0) | 3.0 (1.0–5.0) | 2.0 (1.0–5.0) | H(N = 2608, df = 2) = 4.54 | ||
| n (%) | n (%) | n (%) | n (%) | ||||
| Prevalent symptoms at onset | Sensory | 786 (29.9%) | 19 (15.0%) | 741 (30.7%) | 26 (31.0%) | X2(N = 2627, df = 10) = 70.75 *** | |
| Visual | 688 (26.2%) | 45 (35.4%) | 632 (26.2%) | 11 (13.1%) | |||
| Motor | 417 (15.9%) | 19 (15.0%) | 366 (15.1%) | 32 (38.1%) | POMS: visual ; brain stem ; other | ||
| Brainstem | 299 (11.4%) | 21 (16.5%) | 277 (11.5%) | 1 (1.2%) | AOM: sensory LOMS: motor celebellar ; visual | ||
| Cerebellar | 161 (6.1%) | 3 (2.4%) | 148 (6.1%) | 10 (11.9%) | |||
| Others | 97 (3.7%) | 6 (4.7%) | 90 (3.7%) | 1 (1.2%) | |||
| Disease modifying treatments at the last visit | First line | 1709 (65.1%) | 63 (49.6%) | 1585 (65.6%) | 61 (72.6%) | X2(N = 2627, df = 4) = 28.14 *** | POMS: first ; second ; switch |
| Second/third line | 918 (34.9%) | 64 (50.4%) | 831 (34.4%) | 23 (27.4%) | AOMS: first | ||
| switch | LOMS first ; second | ||||||
| Samples | Statistics (between Groups) | |||||
|---|---|---|---|---|---|---|
| All patients N = 2627 | EOMS N = 127 | AOMS N = 2416 | LOMS N = 84 | |||
| n (%) | n (%) | n (%) | n (%) | |||
| Location of brain lesion | Supratentorial | 725 (27.6%) | 24 (18.9%) | 674 (27.9%) | 21 (25.0%) | X2 < 1.5, p = 0.115 |
| Infratentorial | 9 (0.4%) | - | 10 (0.4%) | 1 (1.2%) | ||
| Whole brain | 1891 (72.0%) | 103 (78.7%) | 1732 (71.7%) | 62 (73.8%) | ||
| Gadolinium -enhancing brain lesion ≥ 1 | 333 (12.6%) | 22 (17.3%) | 306 (12.7%) | 5 (6.0%) | X2(N = 333, df = 2) = 5.43 * | |
| Spinal lesion ≥ 1 | Cervical | 1557 (59.3%) | 69 (54.3%) | 1441 (59.6%) | 47 (56.0%) | X2 < 1.5, p = 0.405 |
| Thoracic | 87 (3.3%) | 4 (3.1%) | 80 (3.3%) | 3 (3.6%) | X2 < 1.0, p = 0.986 | |
| Total | 1582 (60.2%) | 69 (54.3%) | 1465 (60.6%) | 48 (57.1%) | X2 < 1.5, p = 0.309 | |
| Gadolinium -enhancing spinal lesion ≥ 1 | 94 (3.6%) | 8 (6.3%) | 119 (5.0%) | 2 (2.4%) | X2 < 1.5, p = 0.432 | |
| Variable | Early Onset MS | Adult Onset MS | Late Onset MS | ||||
|---|---|---|---|---|---|---|---|
| HR (95% CI) | p-Value | HR (95% CI) | p-Value | HR (95% CI) | p-Value | ||
| Age at onset | 1.139 (0.937, 1.386) | 0.191 | 1.054 (1.040, 10.68) | 0.000 | 1.145 (0.993, 1.320) | 0.063 | |
| Sex (reference = Female) | 1.745 (0.600, 5.073) | 0.307 | 1.253 (0.989, 1.588) | 0.062 | 1.211 (0.383, 3.828) | 0.744 | |
| MS familial (reference = No) | 0.648 (0.184, 2.283) | 0.499 | 0.917 (0.663, 1.269) | 0.601 | 2.067 (0.457, 9.353) | 0.346 | |
| Autoimmune comorbidity (reference = No) | 0.043 (0.00, 101.850) | 0.427 | 0.815 (0.519, 1.280) | 0.374 | 1.366 (0.308, 6.065) | 0.682 | |
| Symptom of onset (reference = Sensory) | Visual | 1.234 (0.237, 6.428) | 0.803 | 0.686 (0.492, 0.959) | 0.026 | 0.689 (0.110, 4.304) | 0.691 |
| Motor | 4.409 (0.677, 28.705) | 0.121 | 1.952 (1.445, 2.637) | 0.000 | 2.301 (0.601, 8.808) | 0.224 | |
| Other | 3.016 (0.577, 15.777) | 0.191 | 1.223 (0.909, 1.645) | 0.184 | 1.975 (0.467, 8.361) | 0.355 | |
| EDSS at first visit | 1.287 (10.47, 1.582) | 0.016 | 1.209 (1.155, 1.265) | 0.000 | 1.518 (1.35, 2.030) | 0.005 | |
| Attack in first two years (reference = No) | 0.895 (0.284, 2.814) | 0.849 | 1.124 (0.887, 1.425) | 0.333 | 0.919 (0.203, 4.171) | 0.913 | |
| Length of first attack interval | 0.953 (0.848, 1.071) | 0.419 | 0.961 (0.942, 0.980) | 0.000 | 0.939 (0.754, 1.170) | 0.577 | |
| Brain gadolinium -enhancement (reference = not applied) | 2.118 (0.558, 8.034) | 0.270 | 0.456 (0.293, 0.711) | 0.001 | 0.044 (0.000, 362.441) | 0.497 | |
| Spinal MRI (reference = normal) | 1.945 (0.726, 5.209) | 0.185 | 1.722 (1.354, 2.191) | 0.000 | 1.787 (1.341, 10.697) | 0.012 | |
| Spinal gadolinium-enhancement (reference = not applied) | 2.044 (0.261, 16.034) | 0.496 | 0.582 (0.327, 1.035) | 0.065 | 4.642 (1.018, 21.163) | 0.047 | |
| Variable | HR (95% CI) | 95% CI | |
|---|---|---|---|
| Early-onset MS | |||
| EDSS at first visit | 1.29 (10.47–15.82) | 0.016 | |
| Adult-onset MS | |||
| Age at onset | 1.04 (1.02–1.06) | 0.000 | |
| EDSS at first visit | 1.22 (1.13–1.31) | 0.000 | |
| Length of first attack interval | 0.95 (0.93–0.97) | 0.000 | |
| Spinal gadolinium-enhancement (reference = not applied) | 0.86 (0.52–1.43) | 0.557 | |
| Spinal MRI (reference = normal) | 1.89 (1.12–3.18) | 0.017 | |
| Symptom of onset (Ref. = Sensory) | Visual | 0.82 (0.54–1.25) | 0.347 |
| Motor | 1.98 (1.32–2.97) | 0.001 | |
| Other | 0.99 (0.66–1.51) | 0.990 | |
| Late-onset MS | |||
| EDSS at first visit | 1.35 (0.97–1.88) | 0.073 | |
| Spinal MRI (reference = normal) | 8.89 (1.70–46.47) | 0.010 | |
| Spinal gadolinium-enhancement (reference = not applied) | 32.09 (4.08–252.76) | 0.001 | |
© 2020 by the authors. Licensee MDPI, Basel, Switzerland. This article is an open access article distributed under the terms and conditions of the Creative Commons Attribution (CC BY) license (http://creativecommons.org/licenses/by/4.0/).
Share and Cite
Mirmosayyeb, O.; Brand, S.; Barzegar, M.; Afshari-Safavi, A.; Nehzat, N.; Shaygannejad, V.; Sadeghi Bahmani, D. Clinical Characteristics and Disability Progression of Early- and Late-Onset Multiple Sclerosis Compared to Adult-Onset Multiple Sclerosis. J. Clin. Med. 2020, 9, 1326. https://doi.org/10.3390/jcm9051326
Mirmosayyeb O, Brand S, Barzegar M, Afshari-Safavi A, Nehzat N, Shaygannejad V, Sadeghi Bahmani D. Clinical Characteristics and Disability Progression of Early- and Late-Onset Multiple Sclerosis Compared to Adult-Onset Multiple Sclerosis. Journal of Clinical Medicine. 2020; 9(5):1326. https://doi.org/10.3390/jcm9051326
Chicago/Turabian StyleMirmosayyeb, Omid, Serge Brand, Mahdi Barzegar, Alireza Afshari-Safavi, Nasim Nehzat, Vahid Shaygannejad, and Dena Sadeghi Bahmani. 2020. "Clinical Characteristics and Disability Progression of Early- and Late-Onset Multiple Sclerosis Compared to Adult-Onset Multiple Sclerosis" Journal of Clinical Medicine 9, no. 5: 1326. https://doi.org/10.3390/jcm9051326