Article

Thermo-Hydraulic Performance of Pillow-Plate Heat Exchangers with Secondary Structuring: A Numerical Analysis

1
Chair of Fluid Process Engineering, Paderborn University, 33098 Paderborn, Germany
2
Chair of Forming and Machining Technology, Paderborn University, 33098 Paderborn, Germany
*
Author to whom correspondence should be addressed.
Energies 2023, 16(21), 7284; https://doi.org/10.3390/en16217284
Submission received: 29 July 2023 / Revised: 18 October 2023 / Accepted: 25 October 2023 / Published: 26 October 2023
(This article belongs to the Special Issue Numerical Heat Transfer and Fluid Flow 2023)

Abstract

:
Pillow-plate heat exchangers (PPHEs) represent a suitable alternative to conventional shell-and-tube and plate heat exchangers. The inherent waviness of their channels promotes fluid mixing in the boundary layers and facilitates heat transfer. The overall thermo-hydraulic performance of PPHEs can further be enhanced by applying secondary surface structuring, thus increasing their competitiveness against conventional heat exchangers. In this work, various secondary structures applied on the PPHE surface were studied numerically to explore their potential to enhance near-wall mixing. Computational fluid dynamics (CFD) simulations of single-phase turbulent flow in the outer PPHE channel were performed and pressure drop, heat transfer coefficients, and overall thermo-hydraulic efficiency were determined. The simulation results clearly demonstrate a positive impact of secondary structuring on heat transfer in PPHEs.

1. Introduction

Progressing climate change and a growing shortage of resources require a transformation of industrial processes towards increasing energy efficiency and reduced raw material consumption. In this regard, optimization of heat exchangers as central elements of numerous industrial plants can make a decisive contribution. For decades, conventional shell-and-tube heat exchangers (STHEs) have been the primary choice for the process industry due to their robustness, reliability and design flexibility. However, their drawback is a lack of compactness. Plate heat exchangers (PHEs) with cross-corrugated channels, on the other hand, are more compact, lighter, and offer higher heat transfer coefficients. Yet, their temperature and pressure range are limited, and they may face leakage problems when constructed with gaskets. Additionally, fully welded PHEs are challenging, if not impossible, to clean (cf. [1]).
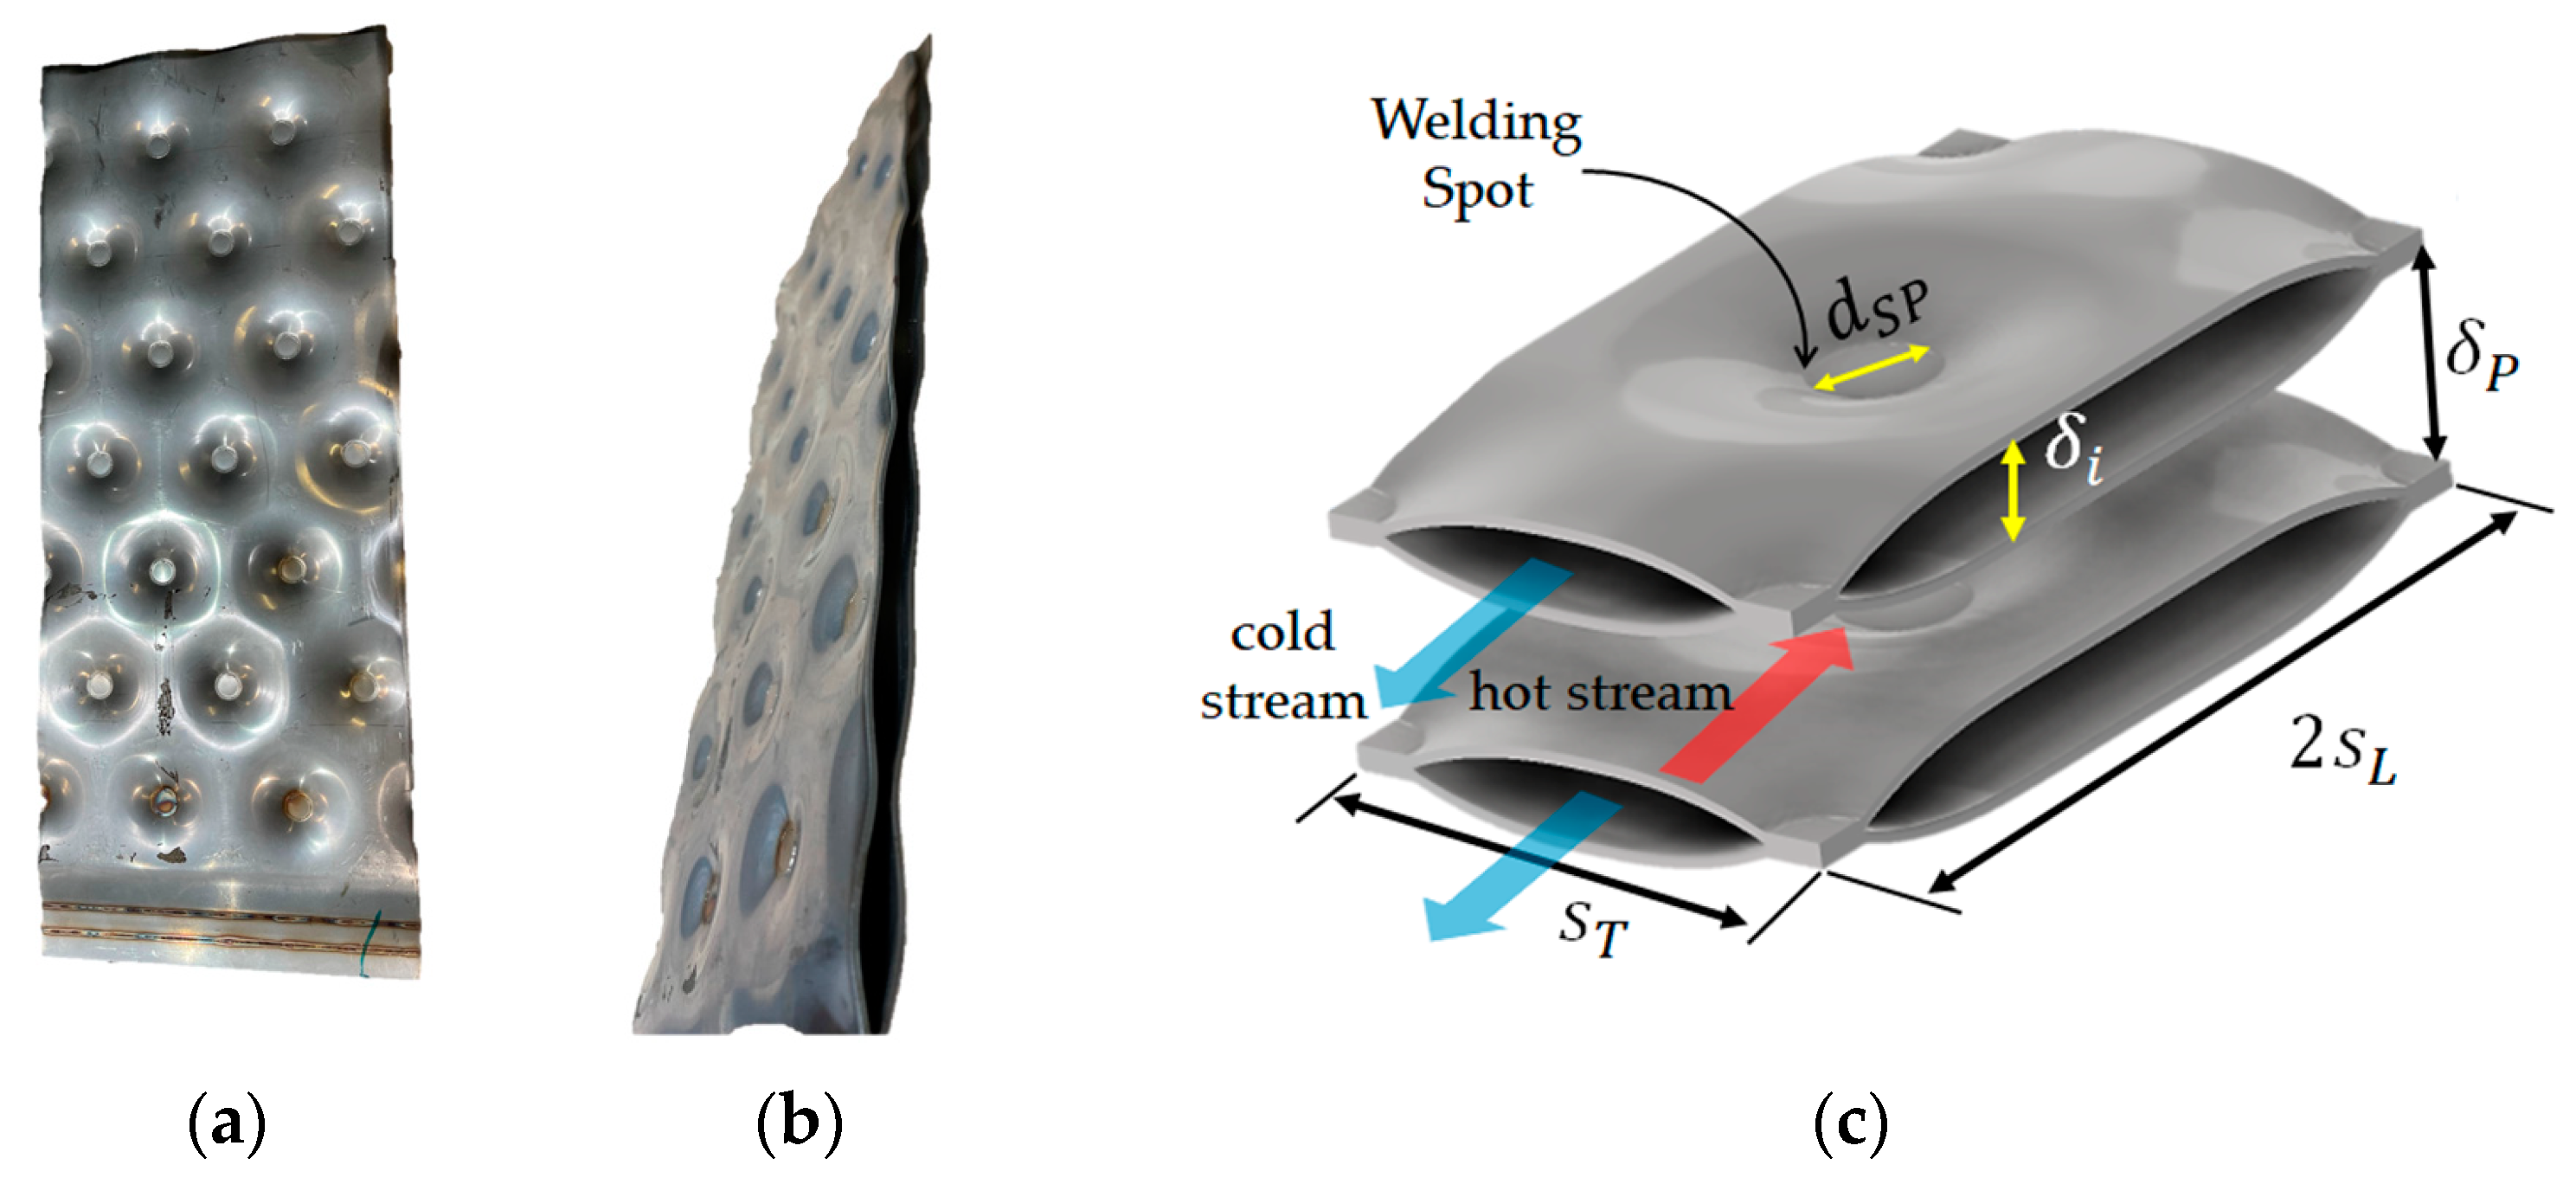
Pillow-plate heat exchangers (PPHEs) offer a promising alternative to conventional STHEs and PHEs. PPHEs consist of multiple pillow plates (PPs) assembled together into a single unit. These PPs are created through spot welding two steel sheets, seam welding along the edges, and then undergoing hydroforming, which results in their characteristic pillow-like surface (Figure 1). The seam welding along the edges ensures leak tightness. Due to the flat structure of the PP, it can be treated as a panel. As a result, constructing a PPHE involves assembling several PP panels together. In this way, two channels are built: one inside the welded PP panel (inner channel) and one between two adjacent welded PPs (outer channel).
PPHEs are lighter, more compact, and efficient than STHEs. However, in order to match the efficiency and compactness of PHEs, PPHEs must undergo further optimization.
Piper et al. [2] conducted a CFD-based study of turbulent flow in the outer channel of PPs. They studied fluid dynamics and heat transfer and revealed that the periodical alteration of the cross-section of the outer channel leads to the corresponding acceleration and deceleration of flow, causing adverse pressure gradient. This leads to a boundary layer separation, which occurs upstream of the welding spots, resulting in large, flat-shaped recirculation zones occupying roughly 30% of the PP surface area. These zones are the primary cause of form drag, and this is responsible for about 50% of the Darcy friction factor.
Moreover, the surface area covered by such recirculation zones is less effective for heat transfer. Therefore, higher heat transfer efficiencies and reduced form drag contribution to the overall pressure loss are expected when the size of these zones is decreased. This can be achieved through intensified turbulent mixing near the surface of the PP, which would retard boundary layer separation. Thus, a further optimization of the PPHEs is possible.
Bergles et al. [3] reviewed different methods to intensify heat exchanger performance. These methods can be subdivided into two groups, namely, “active” and “passive” techniques [3,4]. Active techniques use external power enhancing heat transfer, for instance, different frequency vibrations of a heat exchanger or of a fluid in it. In contrast, passive techniques are based on improved heat transfer through unit surface modifications or the use of fluid additives (nanofluids). The number of publications on passive techniques is considerably higher than those on active ones [5,6].
PPHE performance enhancement was mostly studied in terms of inner channels [7,8,9]. Piper et al. [10] investigated fluid dynamics and heat transfer in the outer channels of a PPHE with secondary dimple structures. The application of secondary structures represents a passive technique extending the heat transfer area. It is capable of reducing the negative impact of the recirculation zones and, hence, shows a significant potential for performance enhancement of the studied PPHE. Such secondary structures can be realized using the method of Electrohydraulic Incremental Forming (EHIF) [10]. This idea has to be explored with respect to different geometrical forms and fluid-dynamic conditions. This paper presents such an investigation based on comprehensive CFD simulations.

2. Geometry Generation and Surface Structuring of Studied PPHEs

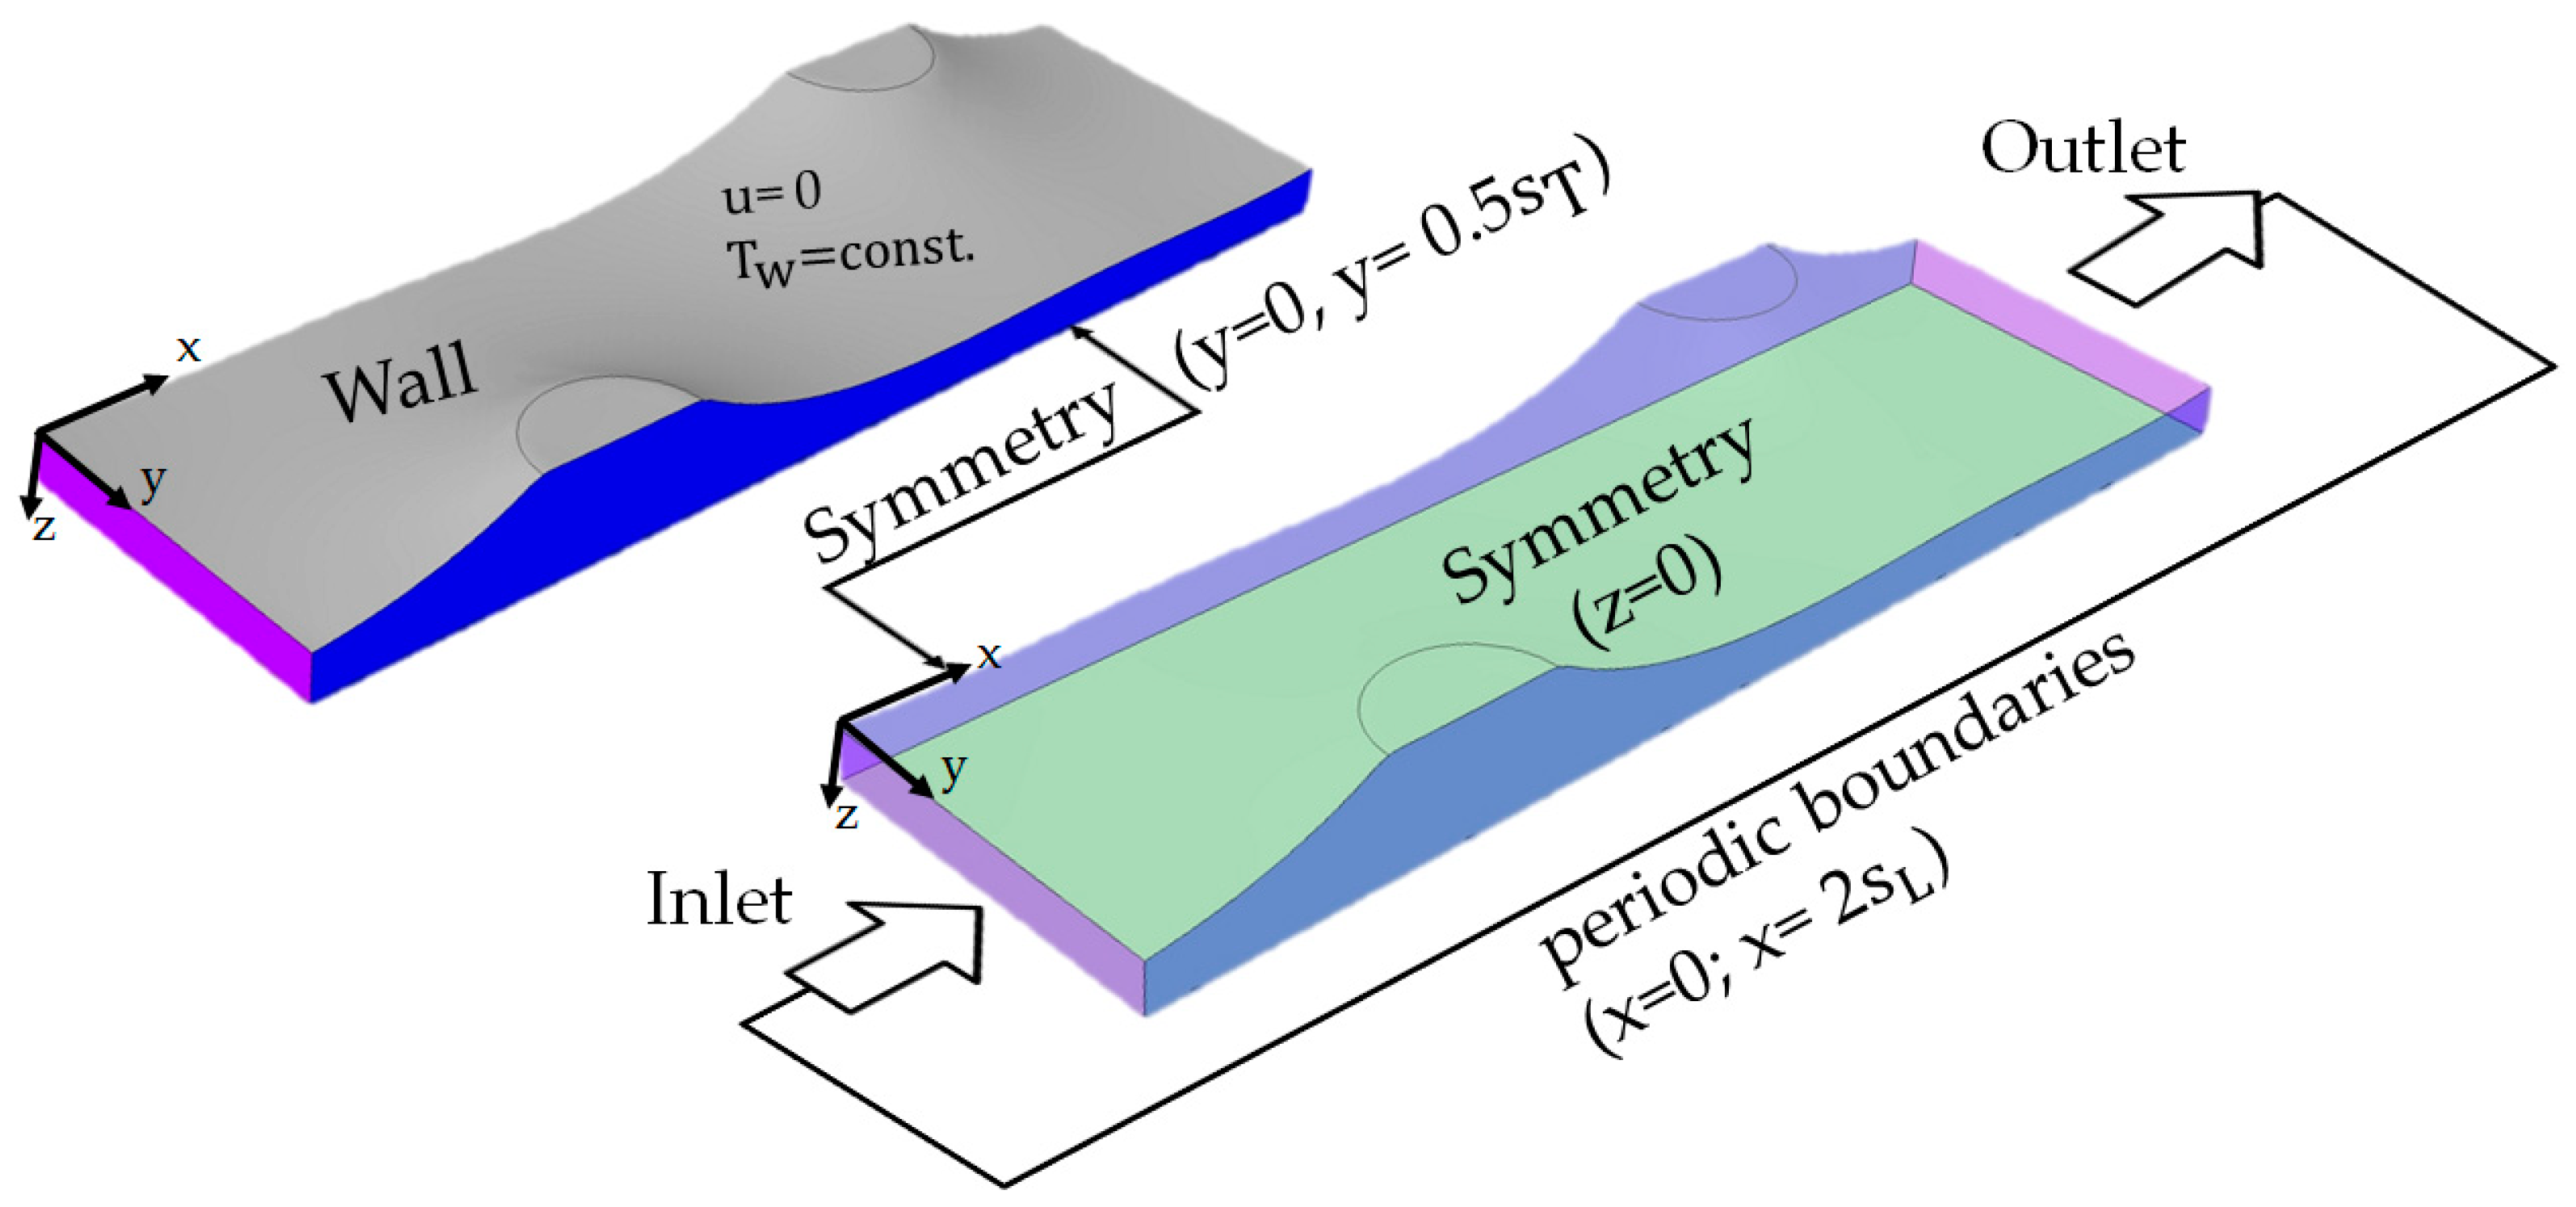
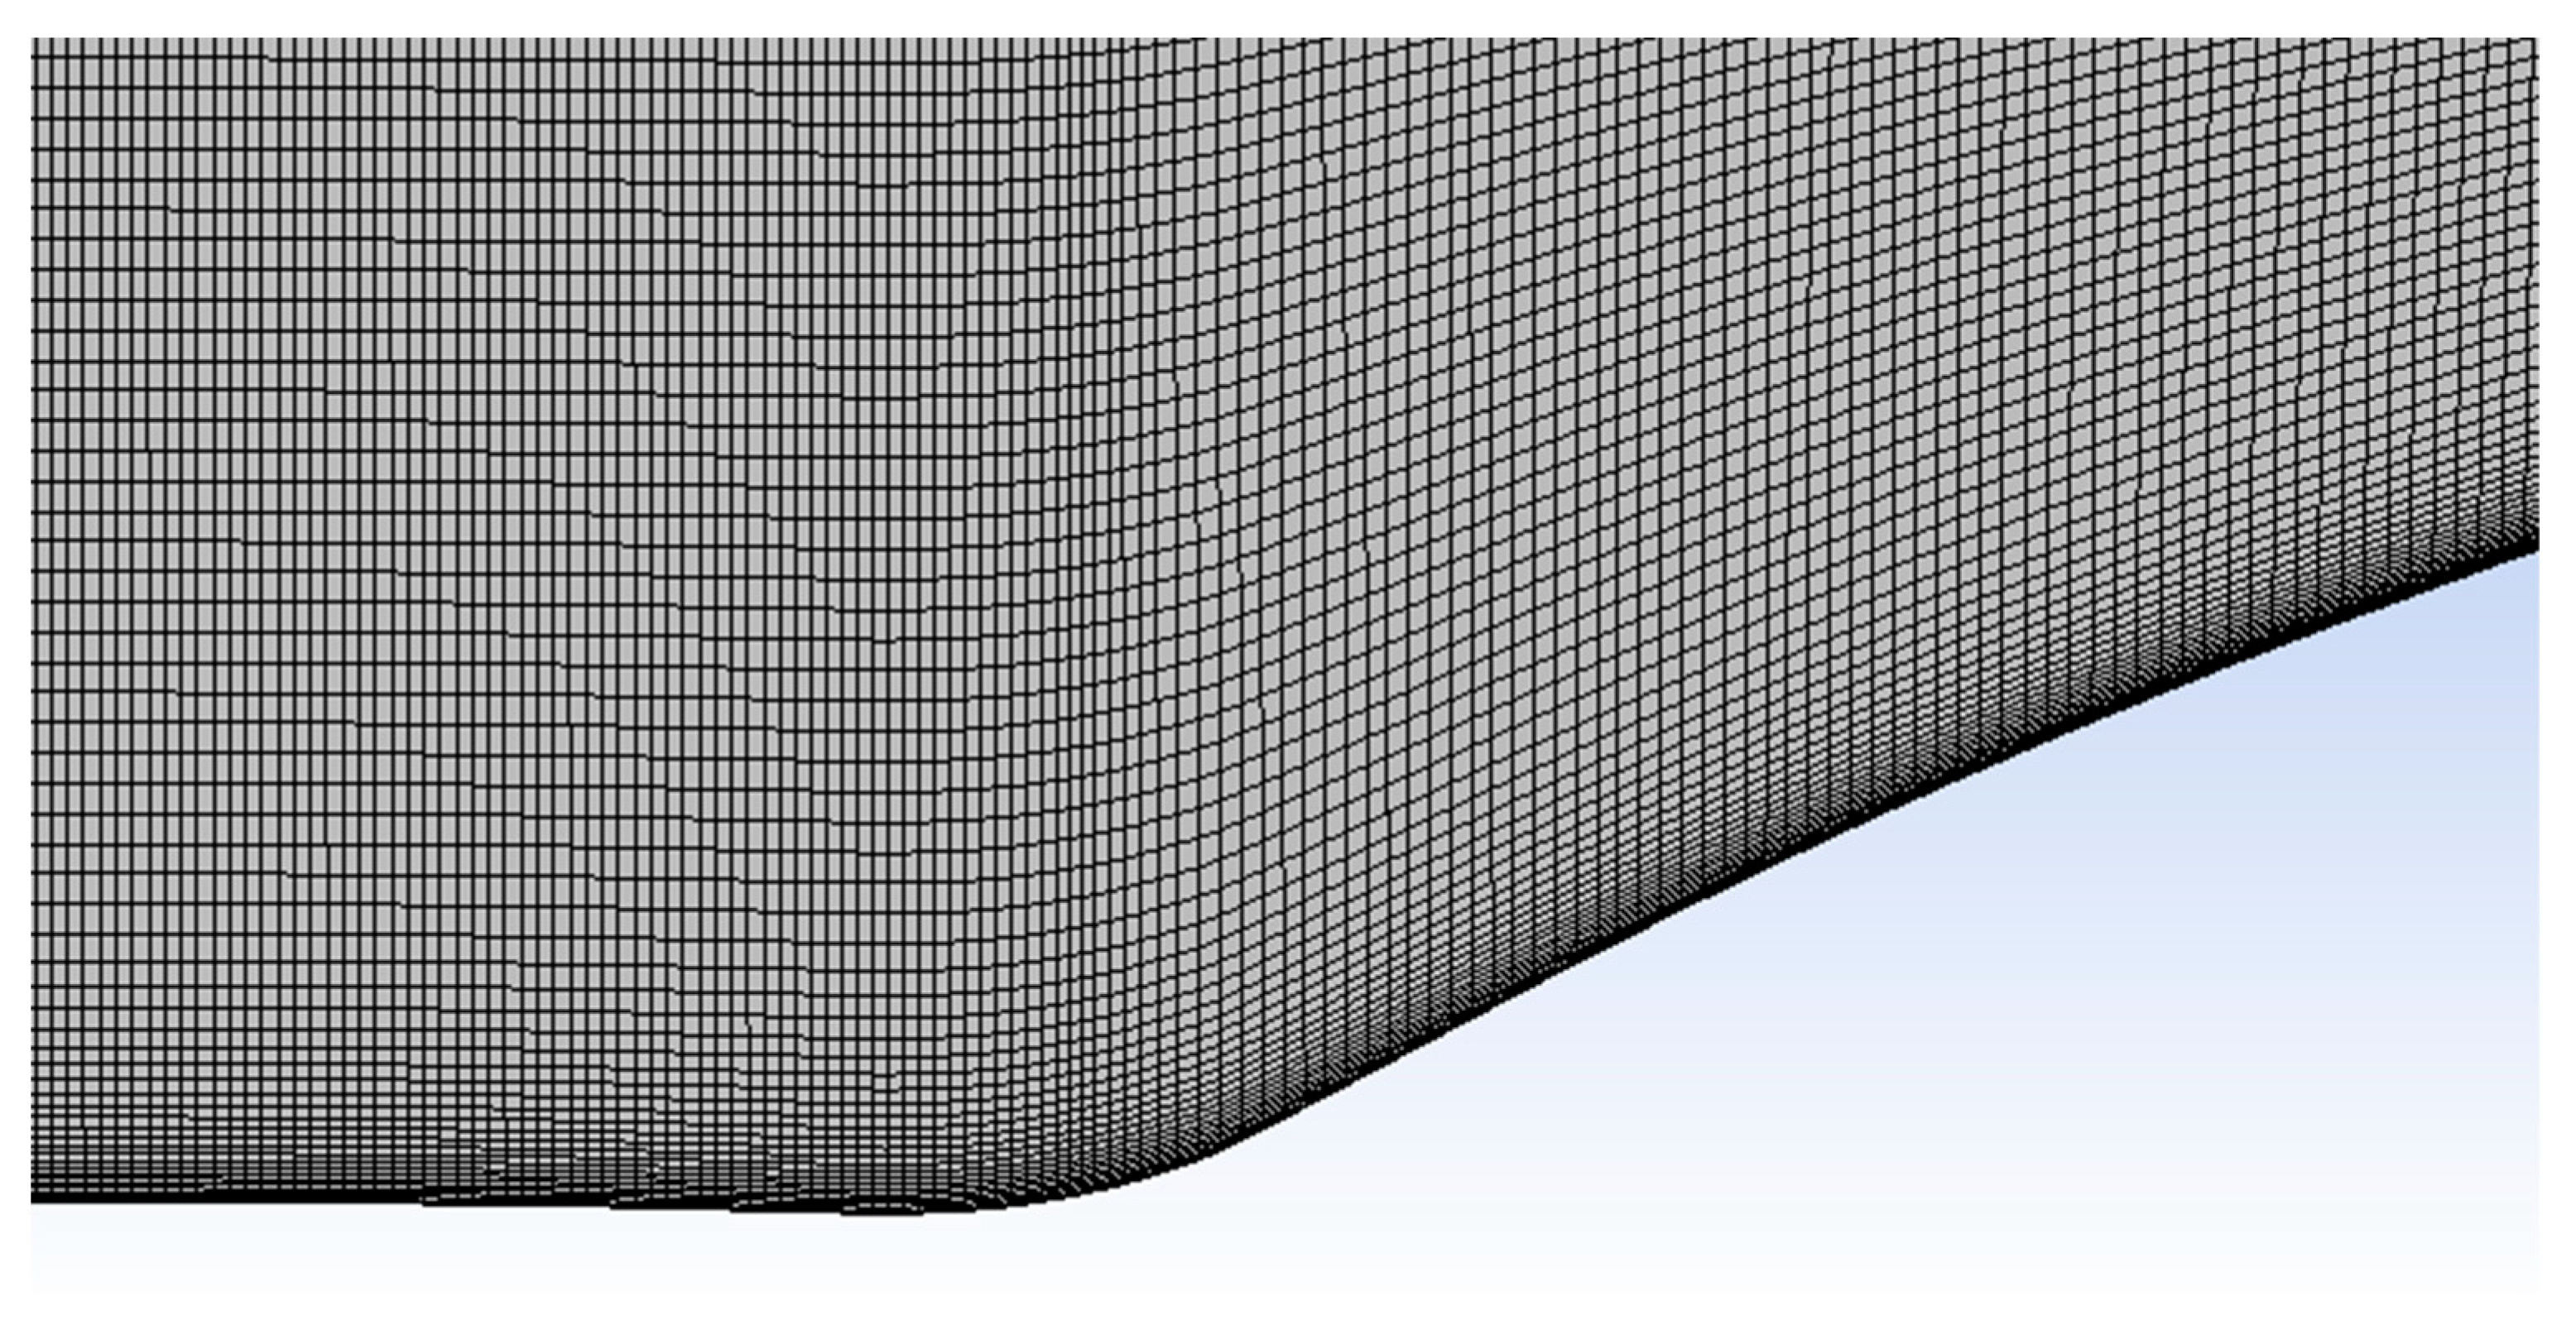
To carry out CFD simulations of PPHEs, a digital image of the PP geometry that defines the computational domain is necessary. A realistic reconstruction of the PP channel is crucial for a more accurate description of fluid dynamics in PPs. For this reason, we utilized a forming simulation method, as detailed in [11], to generate the basic PP geometry. This geometry does not contain secondary structures and is used as a benchmark for comparison with more complex geometries. This benchmark is already optimized with respect to the thermo-hydraulic performance.
In this study, we focused on configurations in which the PPs are arranged parallel to each other and distanced by δ P = 13 mm. The other specific PP properties are an inflation height of δ i = 8 mm and a typical triangular welding spot pattern with a diameter of d SP = 10 mm. The longitudinal and transverse welding spot pitches are s L = 36 mm and s T = 42 mm , respectively.
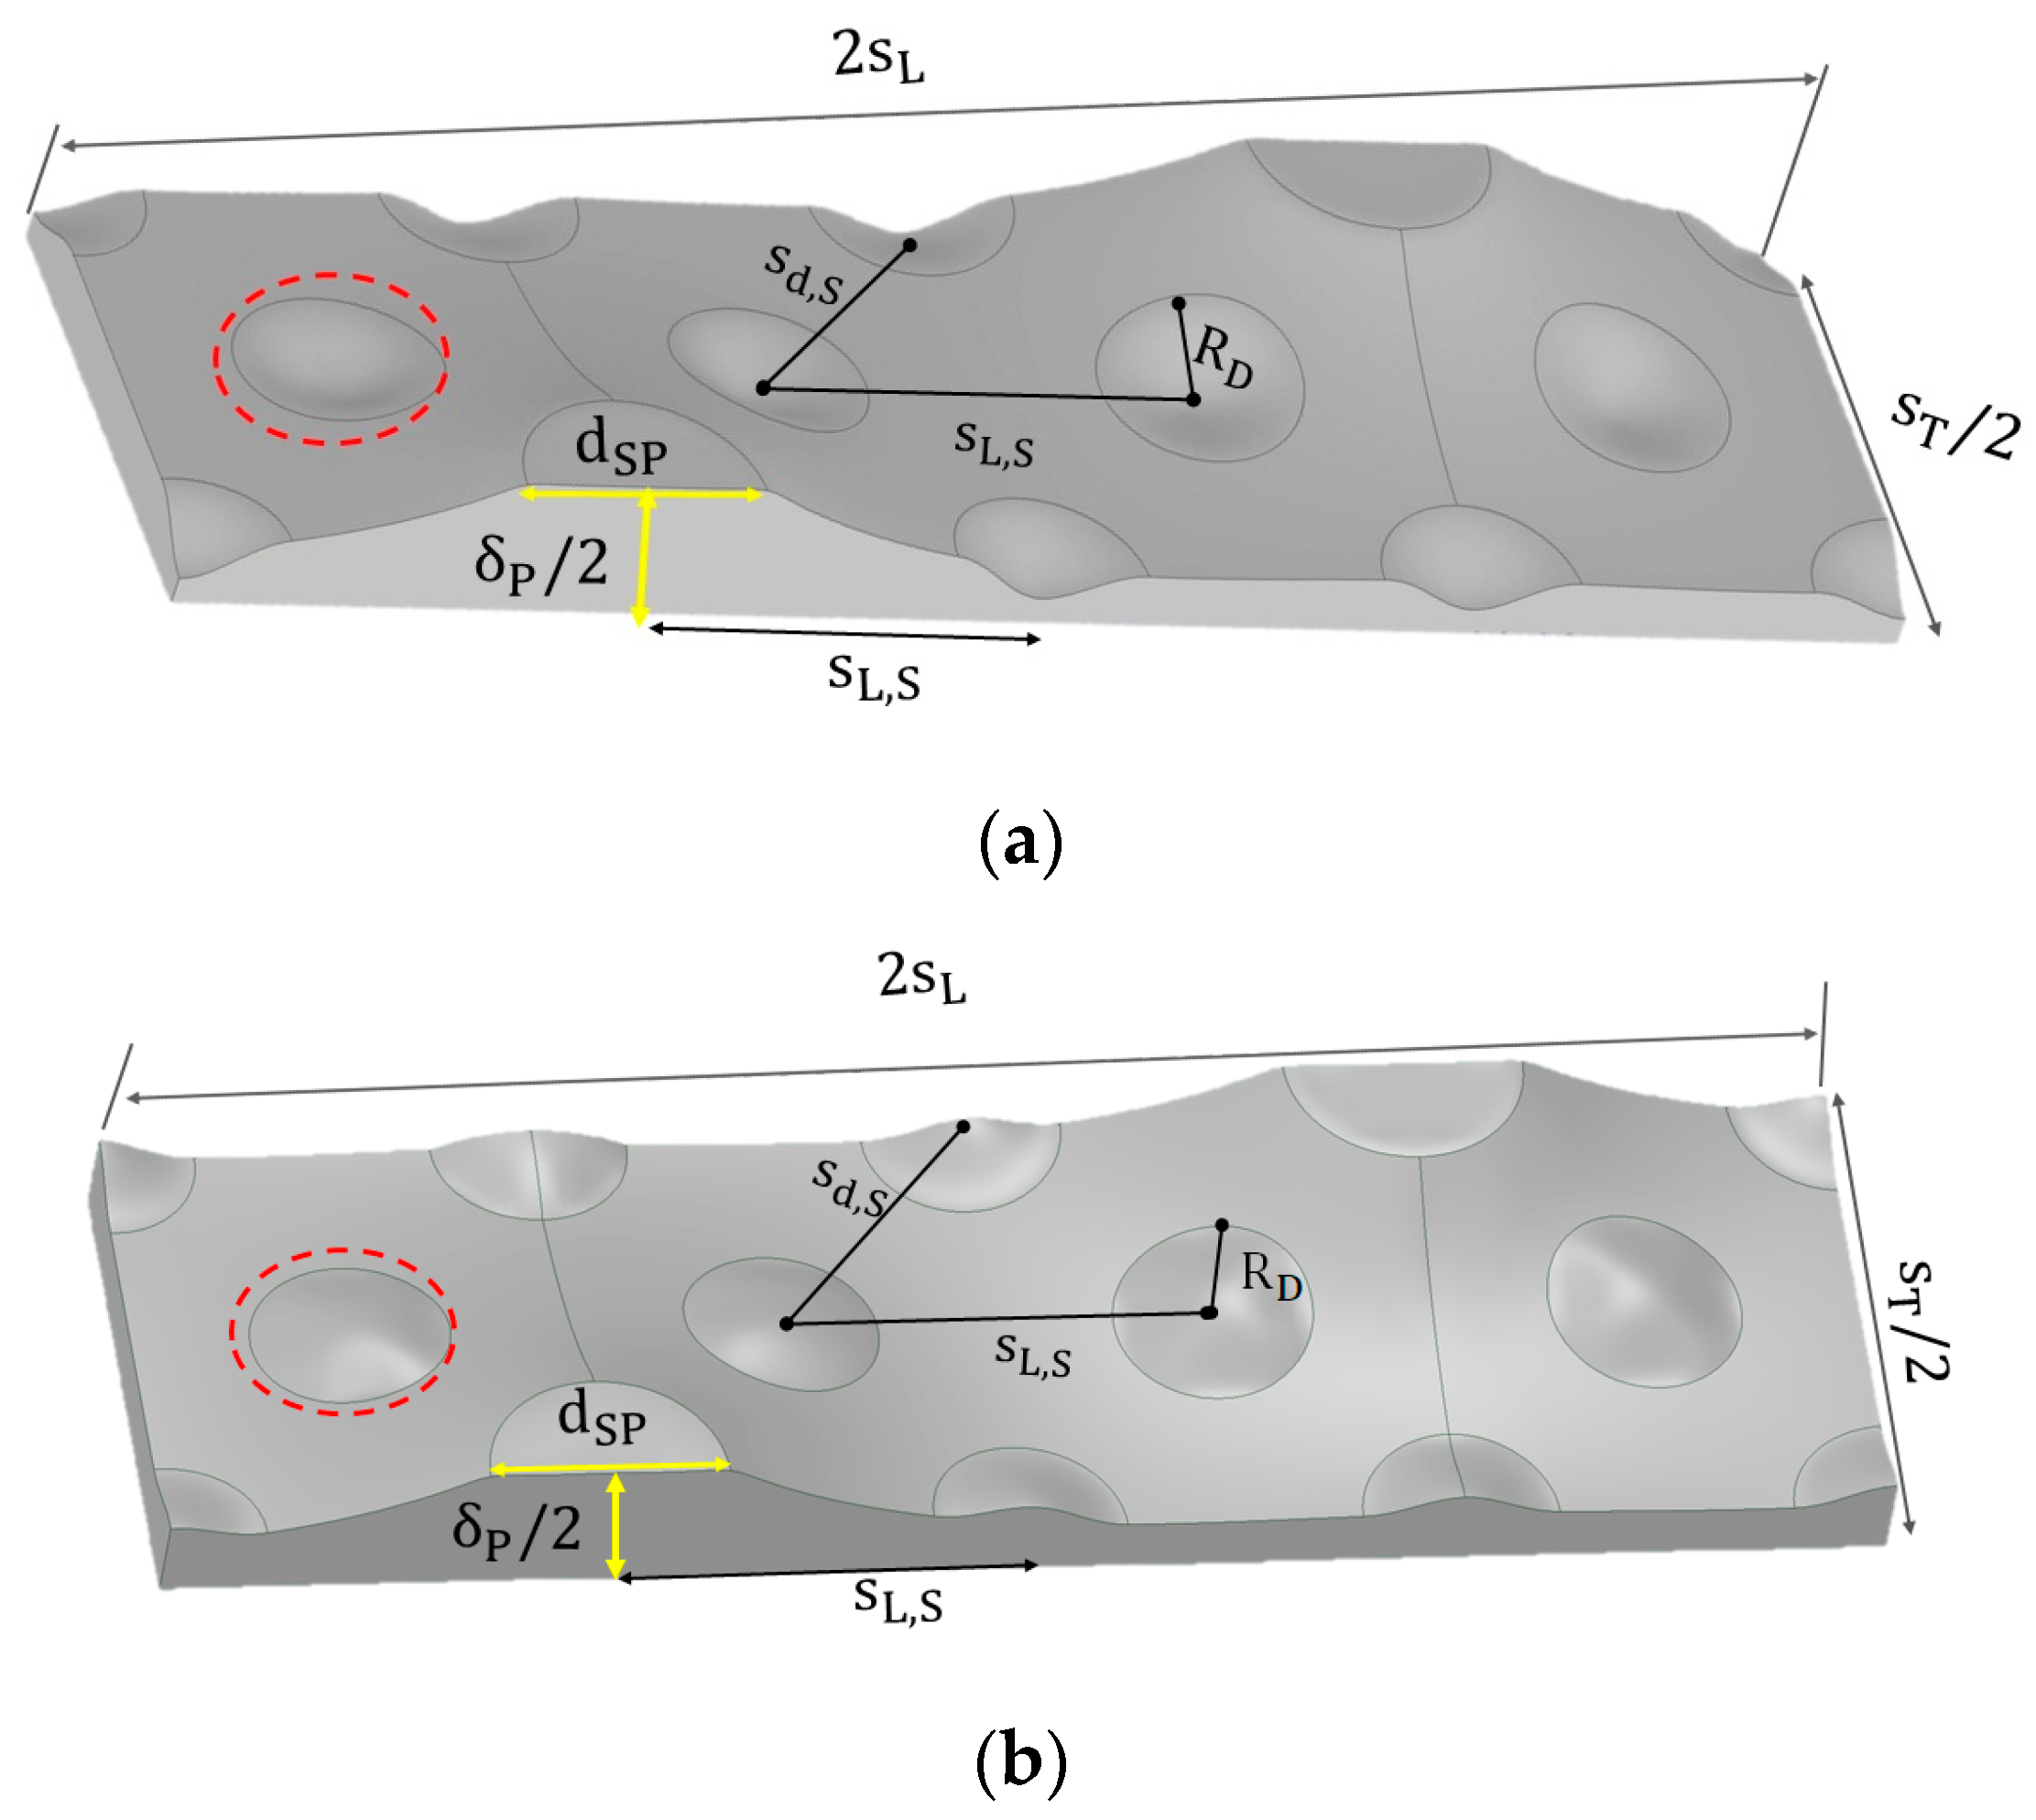
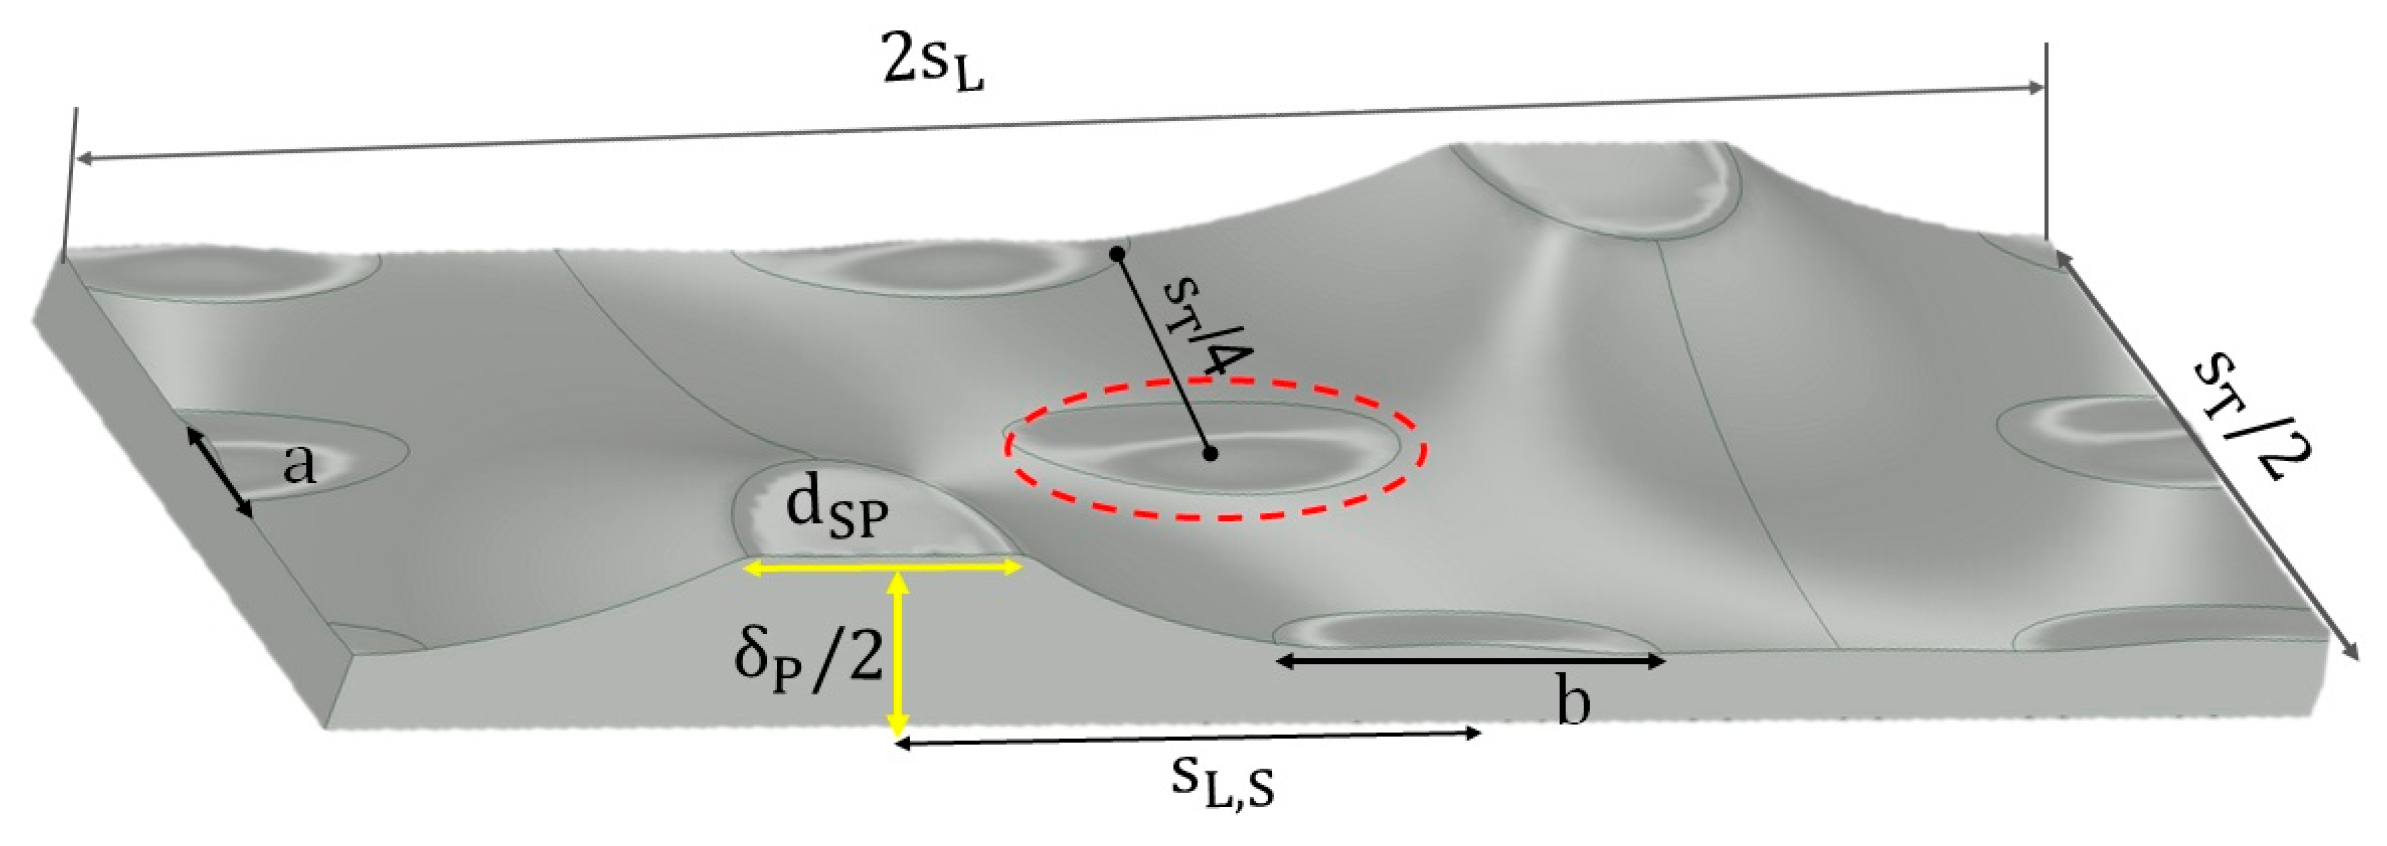
In principle, the choice of a secondary form is nearly unlimited. We have preliminary explored a wide range of different possibilities and selected two following building types: dimples and ellipsoidal forms. Dimples are chosen due to their simplicity. On the other hand, ellipsoids are more streamlined than dimples, thus promising lower form drag. Figure 2 shows PPs with dimpled secondary structures, while Figure 3 depicts PPs with ellipsoidal surface structuring. The digital images of PPs with secondary structures were generated using CAD software SOLIDWORKS.
The secondary structured PPs analyzed in this study are categorized according to the projected geometry and arrangement of their secondary structures. The structures that result in a larger volume of the outer channel are referred to as “positive”, while the structures resulting in a smaller volume of the outer channel are called “negative”. The dimples differ not only by their direction but also by their depth δ S and radius R D . The projected surface area of a single ellipsoid is equal to that of a single dimple with a radius of 4.1 mm. The dimensions of the secondary-structured surfaces used in this study are summarized in Table 1. The abbreviations in this table denote the important geometry characteristics of the secondary structures. Letter D stands for dimple, while the following number gives the radius of the dimple. Letter E denotes ellipsoidal secondary structures with the following numbers a × b according to Figure 3. The number after the slash shows the depth of the secondary structures; here, the plus sign denotes the positive structures, while the minus sign means the negative structures.

3. CFD Simulation

3.1. Model and Solution Method

The flow was modeled as single phase, incompressible, and turbulent, with constant fluid properties and neglected external forces. This was accomplished using the Reynolds-Averaged Navier–Stokes (RANS) equations [12]. Using Einstein’s notation, these equations are written as follows:
u ¯ k t + x j ( u ¯ j u ¯ k ) = 1 ρ p ¯ x k + 2 ν x j ( u ¯ k x j + u ¯ j x k ) x j ( u k u j ¯ )
where x k (k = 1, 2, 3) are Cartesian coordinates and u ¯ k are the corresponding velocity components.
Equation (1) is supplemented by the continuity equation:
u ¯ j x j = 0
The term u i u j ¯ in Equation (1) is called the specific Reynolds stress tensor and it has to be modeled to close the RANS equation (cf. [12]). One such possibility is given by the Boussinesq approximation, resulting in so-called turbulent viscosity [13]. To determine the turbulent viscosity, specially developed turbulence models are required.
Due to the formation of the recirculation zones at the upstream of the welding spot in the outer channel and possible additional recirculation generated by secondary structures [10], it is crucial to choose an appropriate turbulence model that can accurately resolve the flow separation (cf. [12]). In contrast to Piper et al. [2] and Zibart et al. [14], who computed the Reynolds stresses with the elliptic blending k-ε model, we applied the k-ω-SST model. This is a two-equation-based model. Due to its ability to account for both near-wall and far-field behavior of the flow [15,16,17], it has an advantage of a better prediction of boundary-layer and separated flows as compared to the other turbulence models. In our work, the k-ω-SST model suggested in [16] is applied.
The computational effort is reduced by utilizing flow periodicity. It was accomplished by applying periodic boundary conditions for the velocity vector at the inlet (x = 0) and outlet (x = 2   s L ) boundaries of the channel. This means that the outlet velocity profile was mapped to the inlet after twice the longitudinal pitch ( 2   s L ). Furthermore, symmetric boundary conditions at y = 0, y = 0.5   s T and z = 0 were applied. At the wall, a no-slip boundary condition (u = 0) was set.
To determine the temperature field in the studied PPs, the energy equation for the turbulent flow must be solved. By using Reynolds averaging, a corresponding equation for the description of the average temperature field T ¯ ( x , y , z ) can be obtained [13]:
ρ C p ( T ¯ t + x j ( u ¯ j T ¯ ) ) = q v + x j ( λ T ¯ x j ) ρ C p x j ( u j T ¯ )
The last term on the right-hand side of Equation (3) governs turbulent heat transfer; similar to the specific Reynolds stress tensor, it has to be modeled [13].
For the energy equation, a constant surface-averaged temperature was set at the inlet (x = 0) of a periodic element. In the case of a thermally developed flow, the shape of temperature profiles at the successive streamwise location distanced by the period length ( 2   s L ) is similar [18]. In our work, the shape of the temperature profile at the outlet (x = 2   s L ) is used to generate a new inlet temperature profile. To ensure that the original boundary condition at x = 0 is satisfied, this outlet profile is rescaled to the predefined average temperature at the inlet. At the wall, a constant temperature is set.
Figure 4 depicts the simulation domain, while Table 2 summarizes the boundary conditions. In the simulations, second-order approximation schemes for the discretization of convective and diffusive terms were used. The convergence is evaluated based on two criteria. First, the normalized residual for all equations must be below 10−5. Second, the calculated characteristic quantities, such as mean wall shear stress, heat transfer coefficient and mass flow at the periodic inlet and outlet must reach a constant value.
The above equations were solved numerically using the open-source CFD simulation software OpenFOAM 8, which is based on the finite volume method (FVM).

3.2. Grid Generation

The grid was generated with Ansys ICEM CFD software, as it provides more options for block-structured grids than the meshing tool by OpenFOAM 8. A mesh refinement was applied to capture the steep gradients in the vicinity of the walls and along the edge of the welding spot by increasing the mesh density perpendicular to the wall and in the direction of the radius of the welding spot (Figure 5).
A grid independence study was carried out for all of the investigated geometries. Depending on the geometry, different grids were obtained. The grid was accepted as final when doubling the number of cells resulted in just insignificant differences in the pressure drop and heat transfer coefficient (less than 0.1%). Consequently, the number of grid cells ranged from about 17.5 million for the benchmark to 30 million for D4.4/+1.5.
To resolve the boundary layers accurately, the grid construction included the following steps. First, the distance between the wall (heat transfer surface) and the grid node closest to it was estimated using dimensionless wall distance ( y + ) :
y + = u τ y ~ ν   with   u τ = τ w ρ
where u τ and y ~ represent shear velocity and the coordinate normal to the wall, respectively. In all cases, grid independence was achieved for y + values below 0.5. To ensure a smooth transition from viscous sublayer to the buffer layer, at least 4–5 further cells are included in the viscous sublayer. Finally, the cell thickness ( Δ y ~ n ) was determined by linearly stretching in the direction normal to wall, with stretching factor ( Δ y ~ n + 1 Δ y ~ n ) of 1.1.

4. Process Parameters

To evaluate the thermo-hydraulic characteristics of the flow in PPs, several process parameters are used. The average Reynolds number of the flow in the PP channel is defined with the following expression:
Re   = u m d h ν
where u m is the mean stream velocity in the channel of a PP and d h is its hydraulic diameter, which can be calculated by the method proposed in [11].
The overall pressure drop Δ p is calculated from the difference between the surface-averaged pressure values at the inlet and outlet boundaries. Afterwards, the pressure drop coefficient ξ Δ p (also known as the Darcy friction factor) can be evaluated by the Darcy-Weisbach equation:
ξ Δ p = 2 d h Δ p ρ u m 2 2 s L
The overall pressure drop can be expressed as a sum of the pressure drops due to drag and friction (cf. [19]):
Δ p = Δ p Drag + Δ p Friction
In accordance with Buckingham’s π theorem (dimensional analysis), the drag and friction pressure drop can be expressed as [19]:
Δ p Drag = ρ u m 2 2 s L ξ D 2 d h
Δ p Friction = ρ u m 2 2 s L ξ R 2 d h
where ξ D is the form drag coefficient and ξ R is the Fanning friction factor, which can be determined as follows:
ξ R = 8 τ w ρ u m 2
Inserting Equations (7)–(10) in Equation (6), the following equation for the evaluation of the form drag coefficient is obtained:
ξ D = ξ Δ p ξ R
The Nusselt number is defined by:
Nu = h m d h λ
where h m represents the surface-averaged heat transfer coefficient, which can be calculated as follows:
h m = Q ˙ w A w Δ T LMTD
Here Q ˙ w is the heat transferred through the wall and T L M T D is the logarithmic mean temperature in the channel:
Δ T LMTD = Δ T x = 0 , w Δ T x = 2 s L , w ln Δ T x = 0 , w Δ T x = 2 s L , w
In Equation (5), the differences T x = 0 , w a l l and Δ T x = 2 s L , wall are calculated as follows:
Δ T x = 0 , w = T x = 0 ,   m T w = A cs ,   x = 0 uTdA A cs ,   x = 0 udA T w
Δ T x = 2 s L , w = T x = 2 s L ,   m T w = A cs ,   2 s L uTdA A cs ,   2 s L udA T w
The thermo-hydraulic ε efficiency is defined as a ratio of the transferred heat to the pumping power:
ε = | Q ˙ w | V ˙ Δ p
The evaluation of individual secondary structures is based on relative deviations of different quantities from the relevant benchmark quantities defined as follows:
Z * = Z   ( sec ondary   structures )   Z   ( benchmark ) Z   ( benchmark )   × 100

5. Model Validation

For the validation of the CFD model, we used the PP studied by Piper et al. [2], for which experimental data are available. This PP slightly differs from the selected benchmark: it has an inflation height of δ i = 7 mm and a welding spot diameter of d SP = 12 mm. In Figure 6, the specific pressure drop determined by the CFD simulations is shown together with the data obtained from experiments carried out by Piper et al. [2]. The agreement is good over the entire range of investigated Reynolds numbers (7000–14,000), with a relative error below 5%.

6. Results and Discussion

With the validated CFD model, simulations were performed with the aim of investigating the effect of secondary structures on the flow characteristics and heat transfer. The results were obtained for a constant Reynolds number, Re = 5000, which was chosen according to the efficiency analysis carried out in [2].
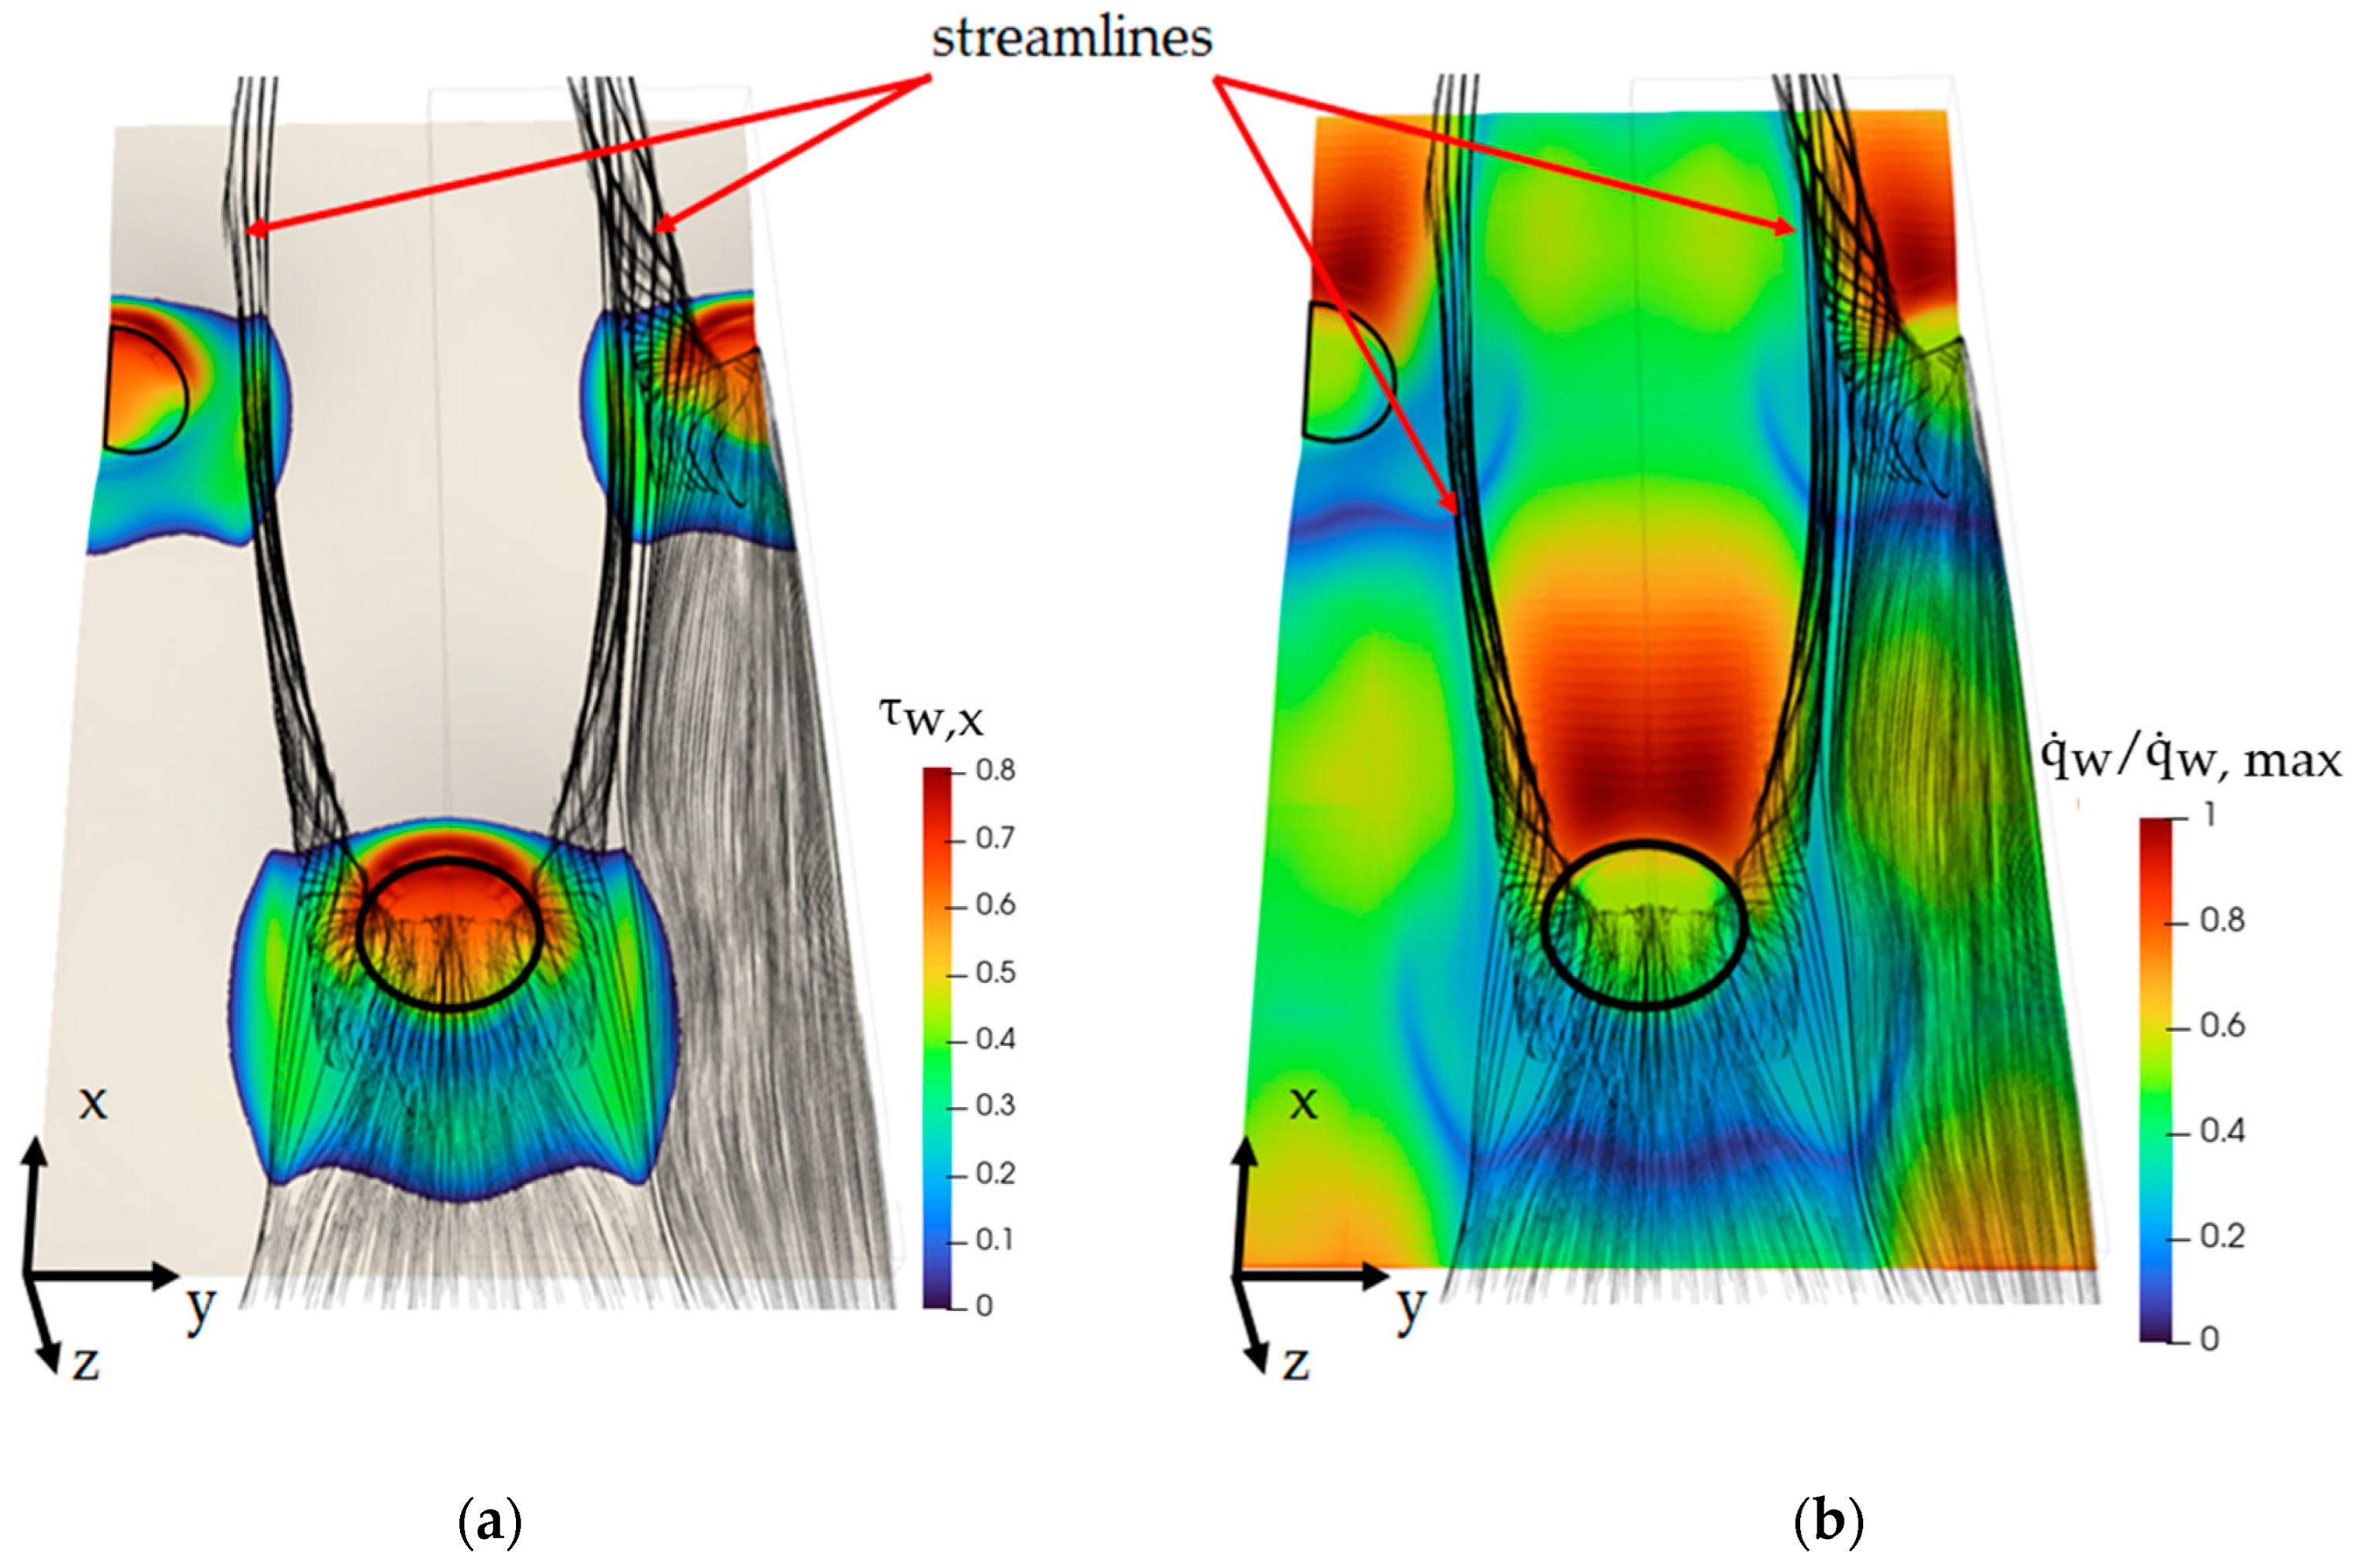
Figure 7 illustrates the flow streamlines and heat transfer phenomena for the benchmark case. In Figure 7a, the formation of recirculation zones upstream of the welding spot is visible; its size can be evaluated by the region of positive wall shear stress in flow direction ( τ w ,   x ). When relating Figure 7b, which shows the normalized wall heat flux ( q ˙ w / q ˙ w ,   max ), to Figure 7a, it becomes obvious that the heat transfer is very slow within this area. Similar results were obtained and evaluated for all investigated PPs with secondary structures. The results are summarized in Table 3.
From the analysis of the data given in Table 3, it can be concluded that deeper secondary structures enhance heat transfer due to the intensified near-wall mixing. However, deeper secondary structures also generate larger and more energetic recirculation zones that cause a higher pressure drop. The near-wall mixing is stronger for dimples with negative structures, thus enhancing heat transfer. 
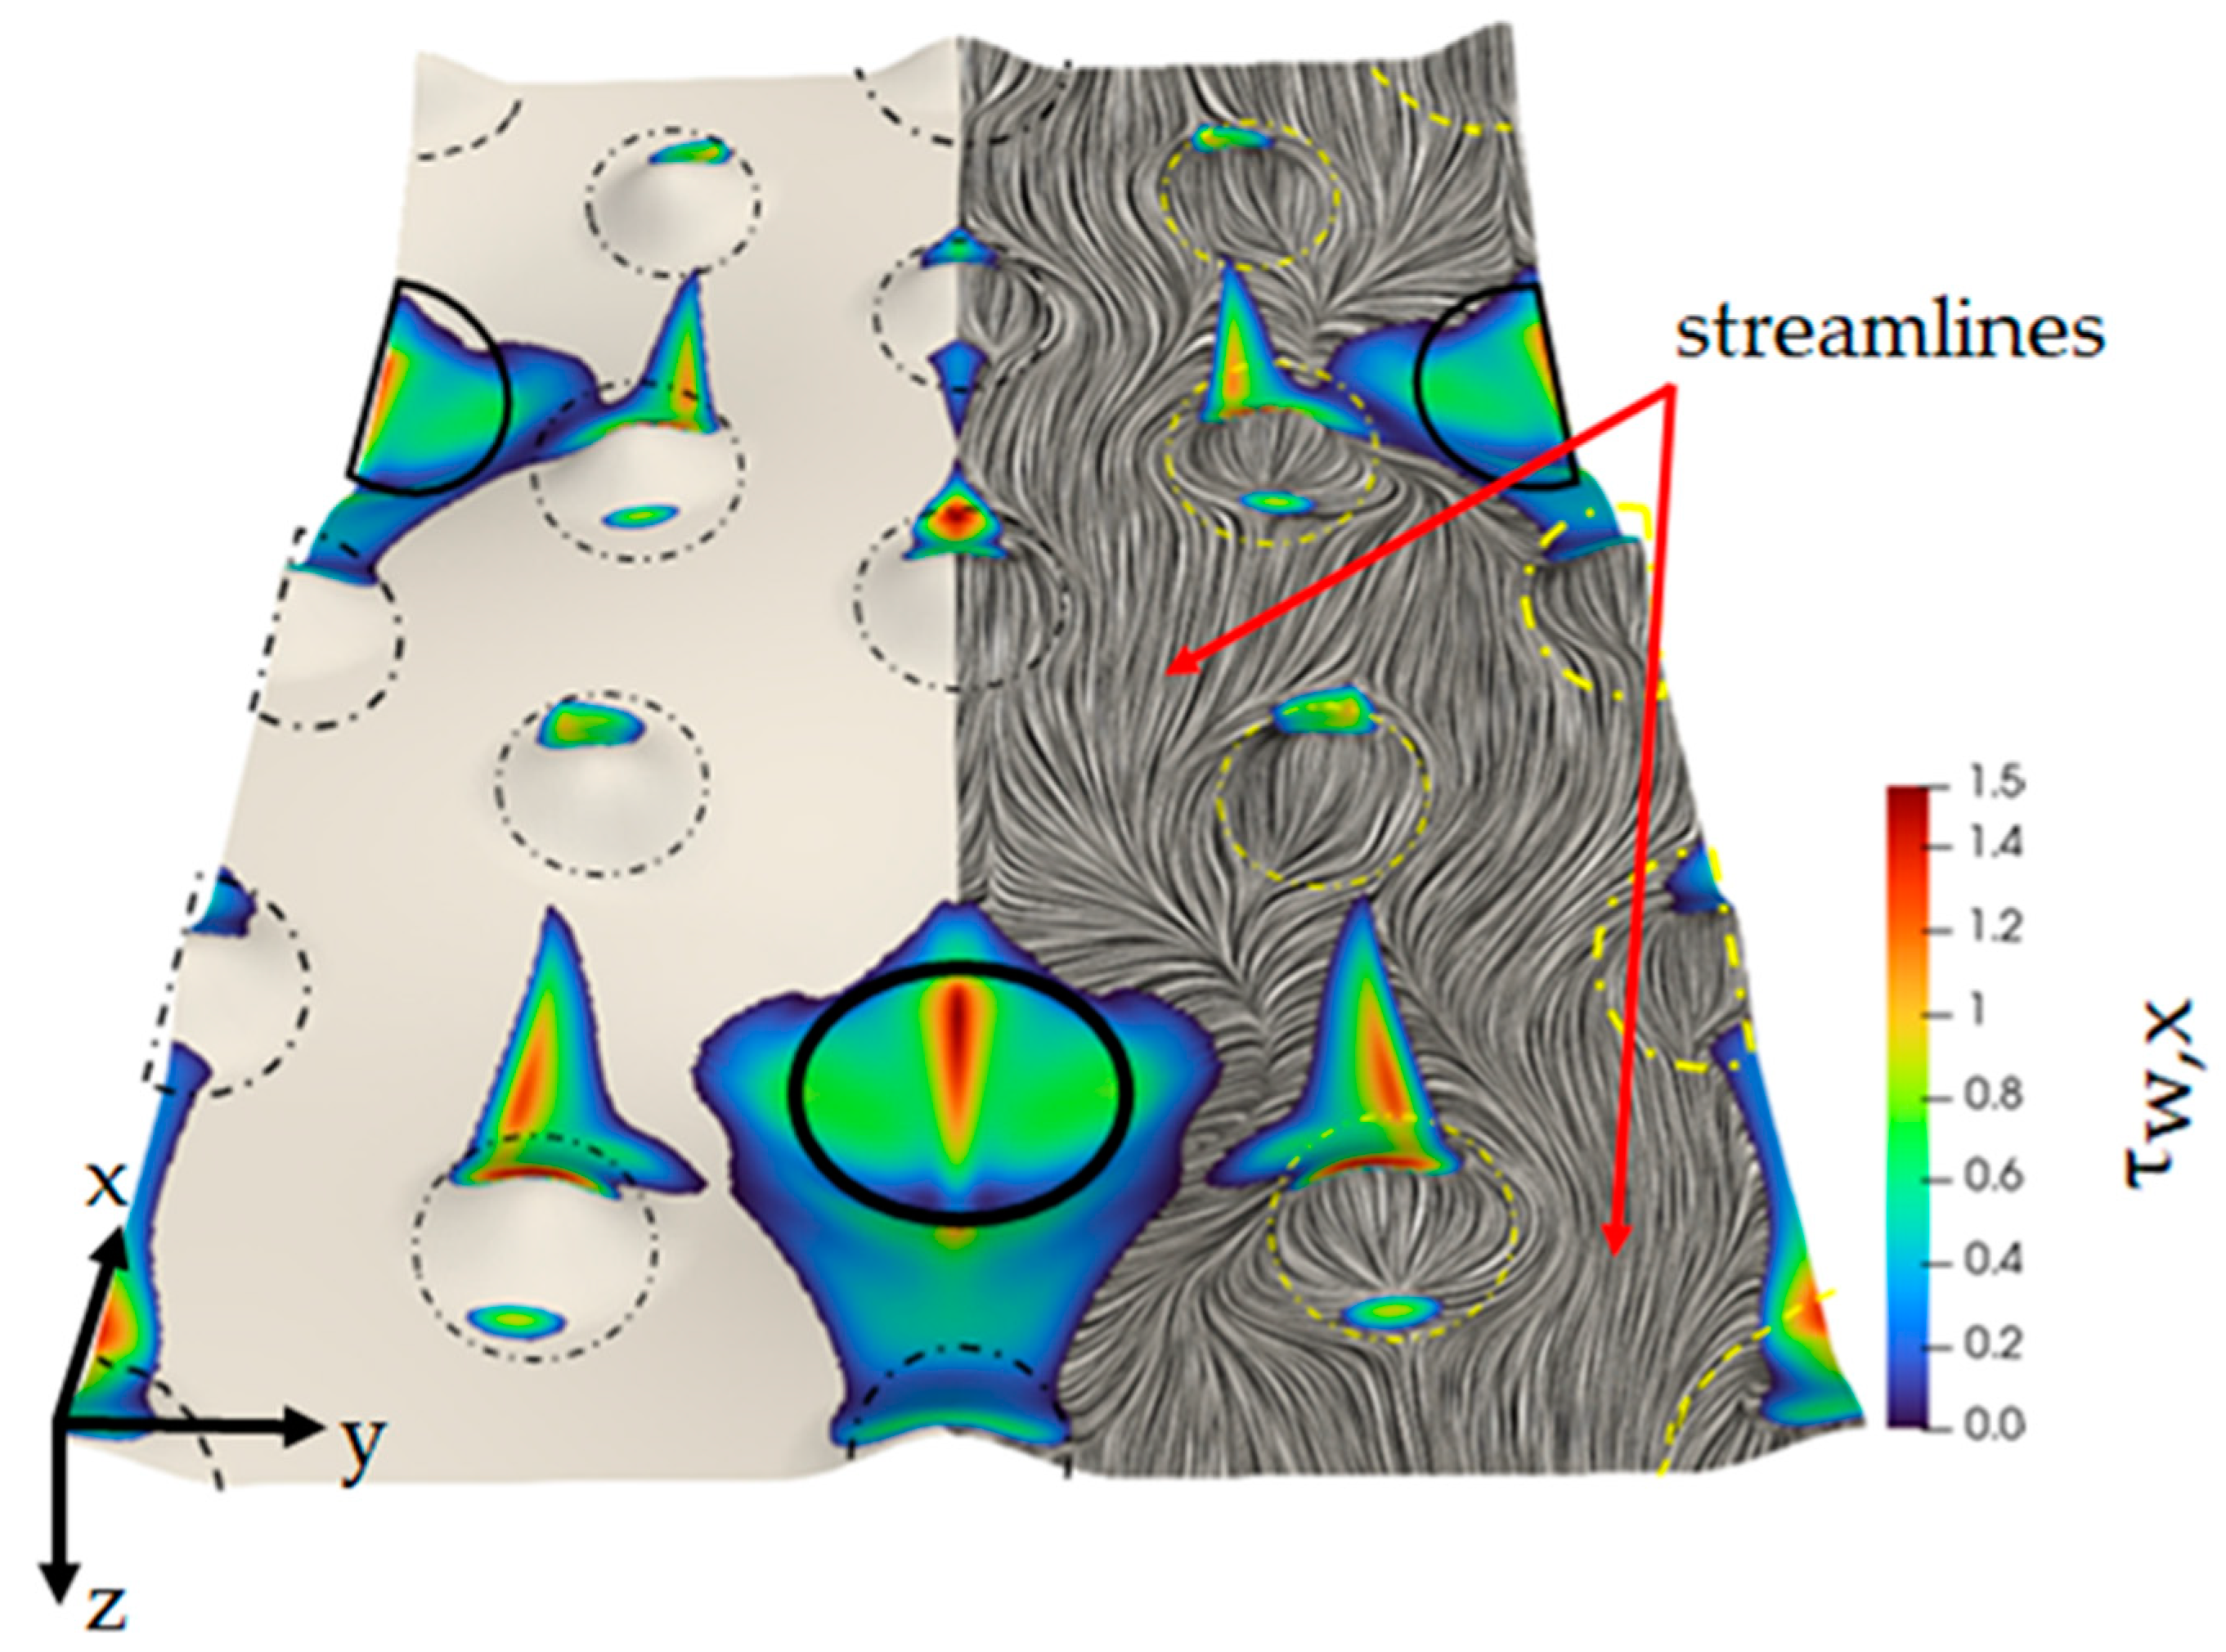
Figure 8 shows the near-wall streamlines and recirculation zones for the geometry D4.1/−1.5, which yields the fastest heat transfer and the highest pressure drop value.
Another factor that contributes to the higher pressure drop in the case of negative structures is the enlargement of the wall surface area, resulting in growing friction. This effect is accompanied by a cross-section decrease further increasing the pressure drop. In contrast, the heat transfer is significantly more intensive due to enhanced near-wall mixing. For a better judgment of the heat exchanger performance, the thermo-hydraulic efficiency ε can be used. In the last column of Table 3, the relative value of this parameter is reported, which is calculated as a difference between the benchmark and secondary structure efficiencies divided by the corresponding value for the benchmark. With increasing depth of the secondary structures, heat transfer improves, yet the ε value drops and is worst for D4.1/−1.5. Therefore, we excluded all negative structures from the following investigations and focused on positive structures.
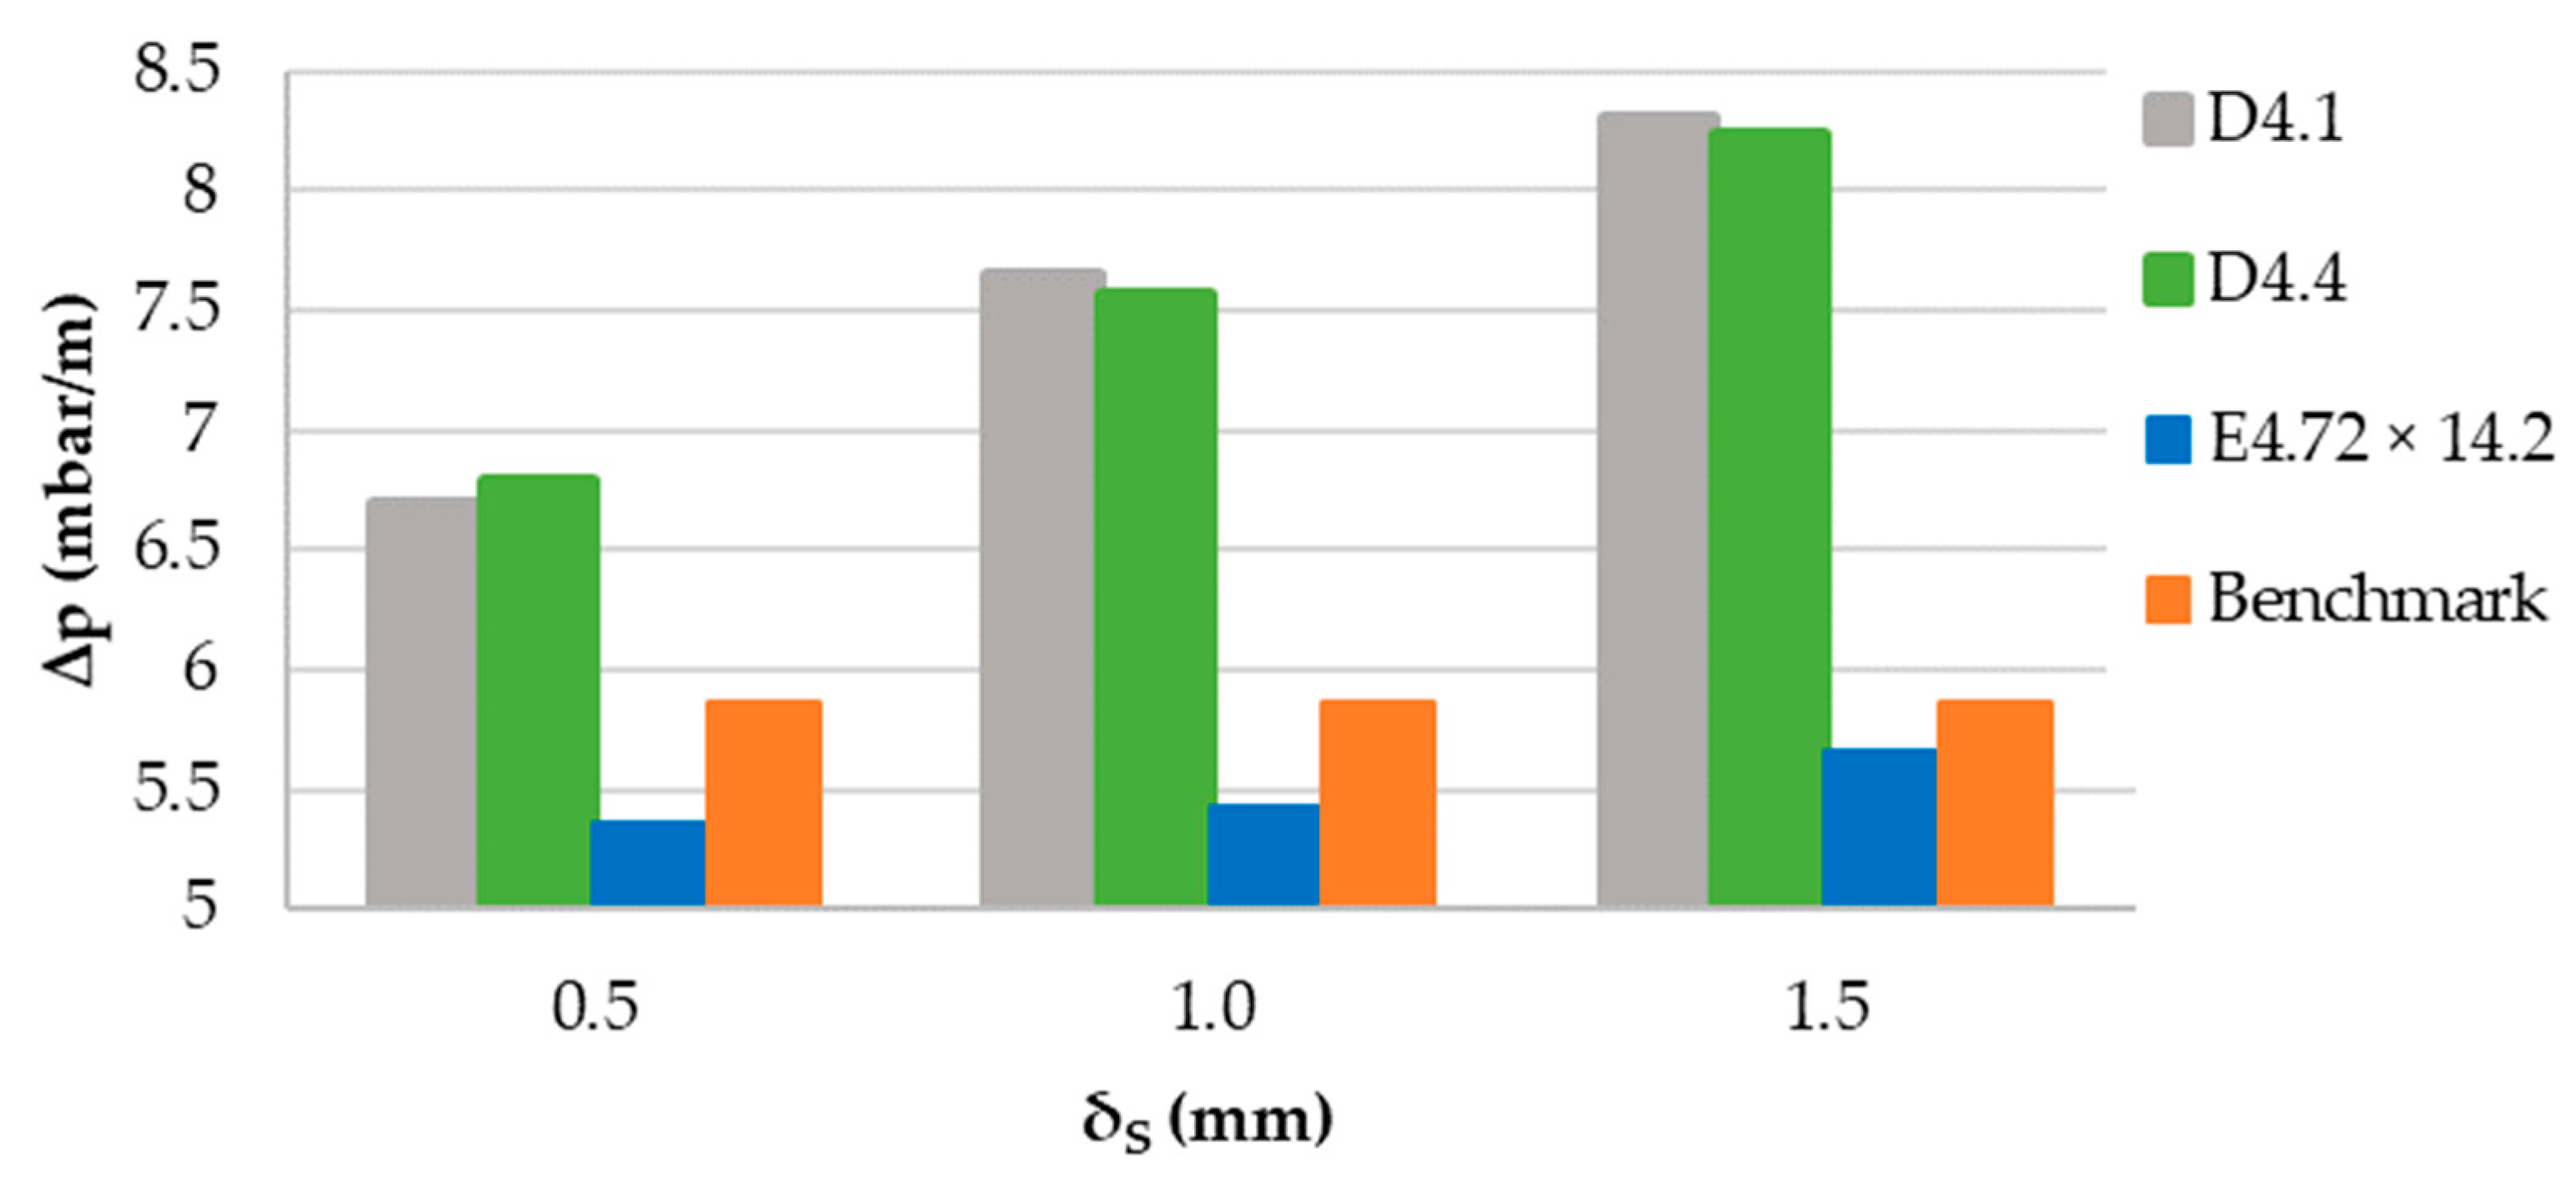
In Figure 9, the pressure drop values for different positive secondary structures are shown. For all positive-structured dimpled surfaces, the pressure drop is higher than for the benchmark. With increasing dimple depth, the corresponding pressure drop also increases. On the other hand, when the radius of the dimple elements ( R D ) is increased while keeping its depth constant, heat transfer is enhanced and the pressure drop decreases slightly. PPHEs with ellipsoidal secondary structures, with their more streamlined form and arrangement, demonstrate a lower pressure drop than the benchmark.
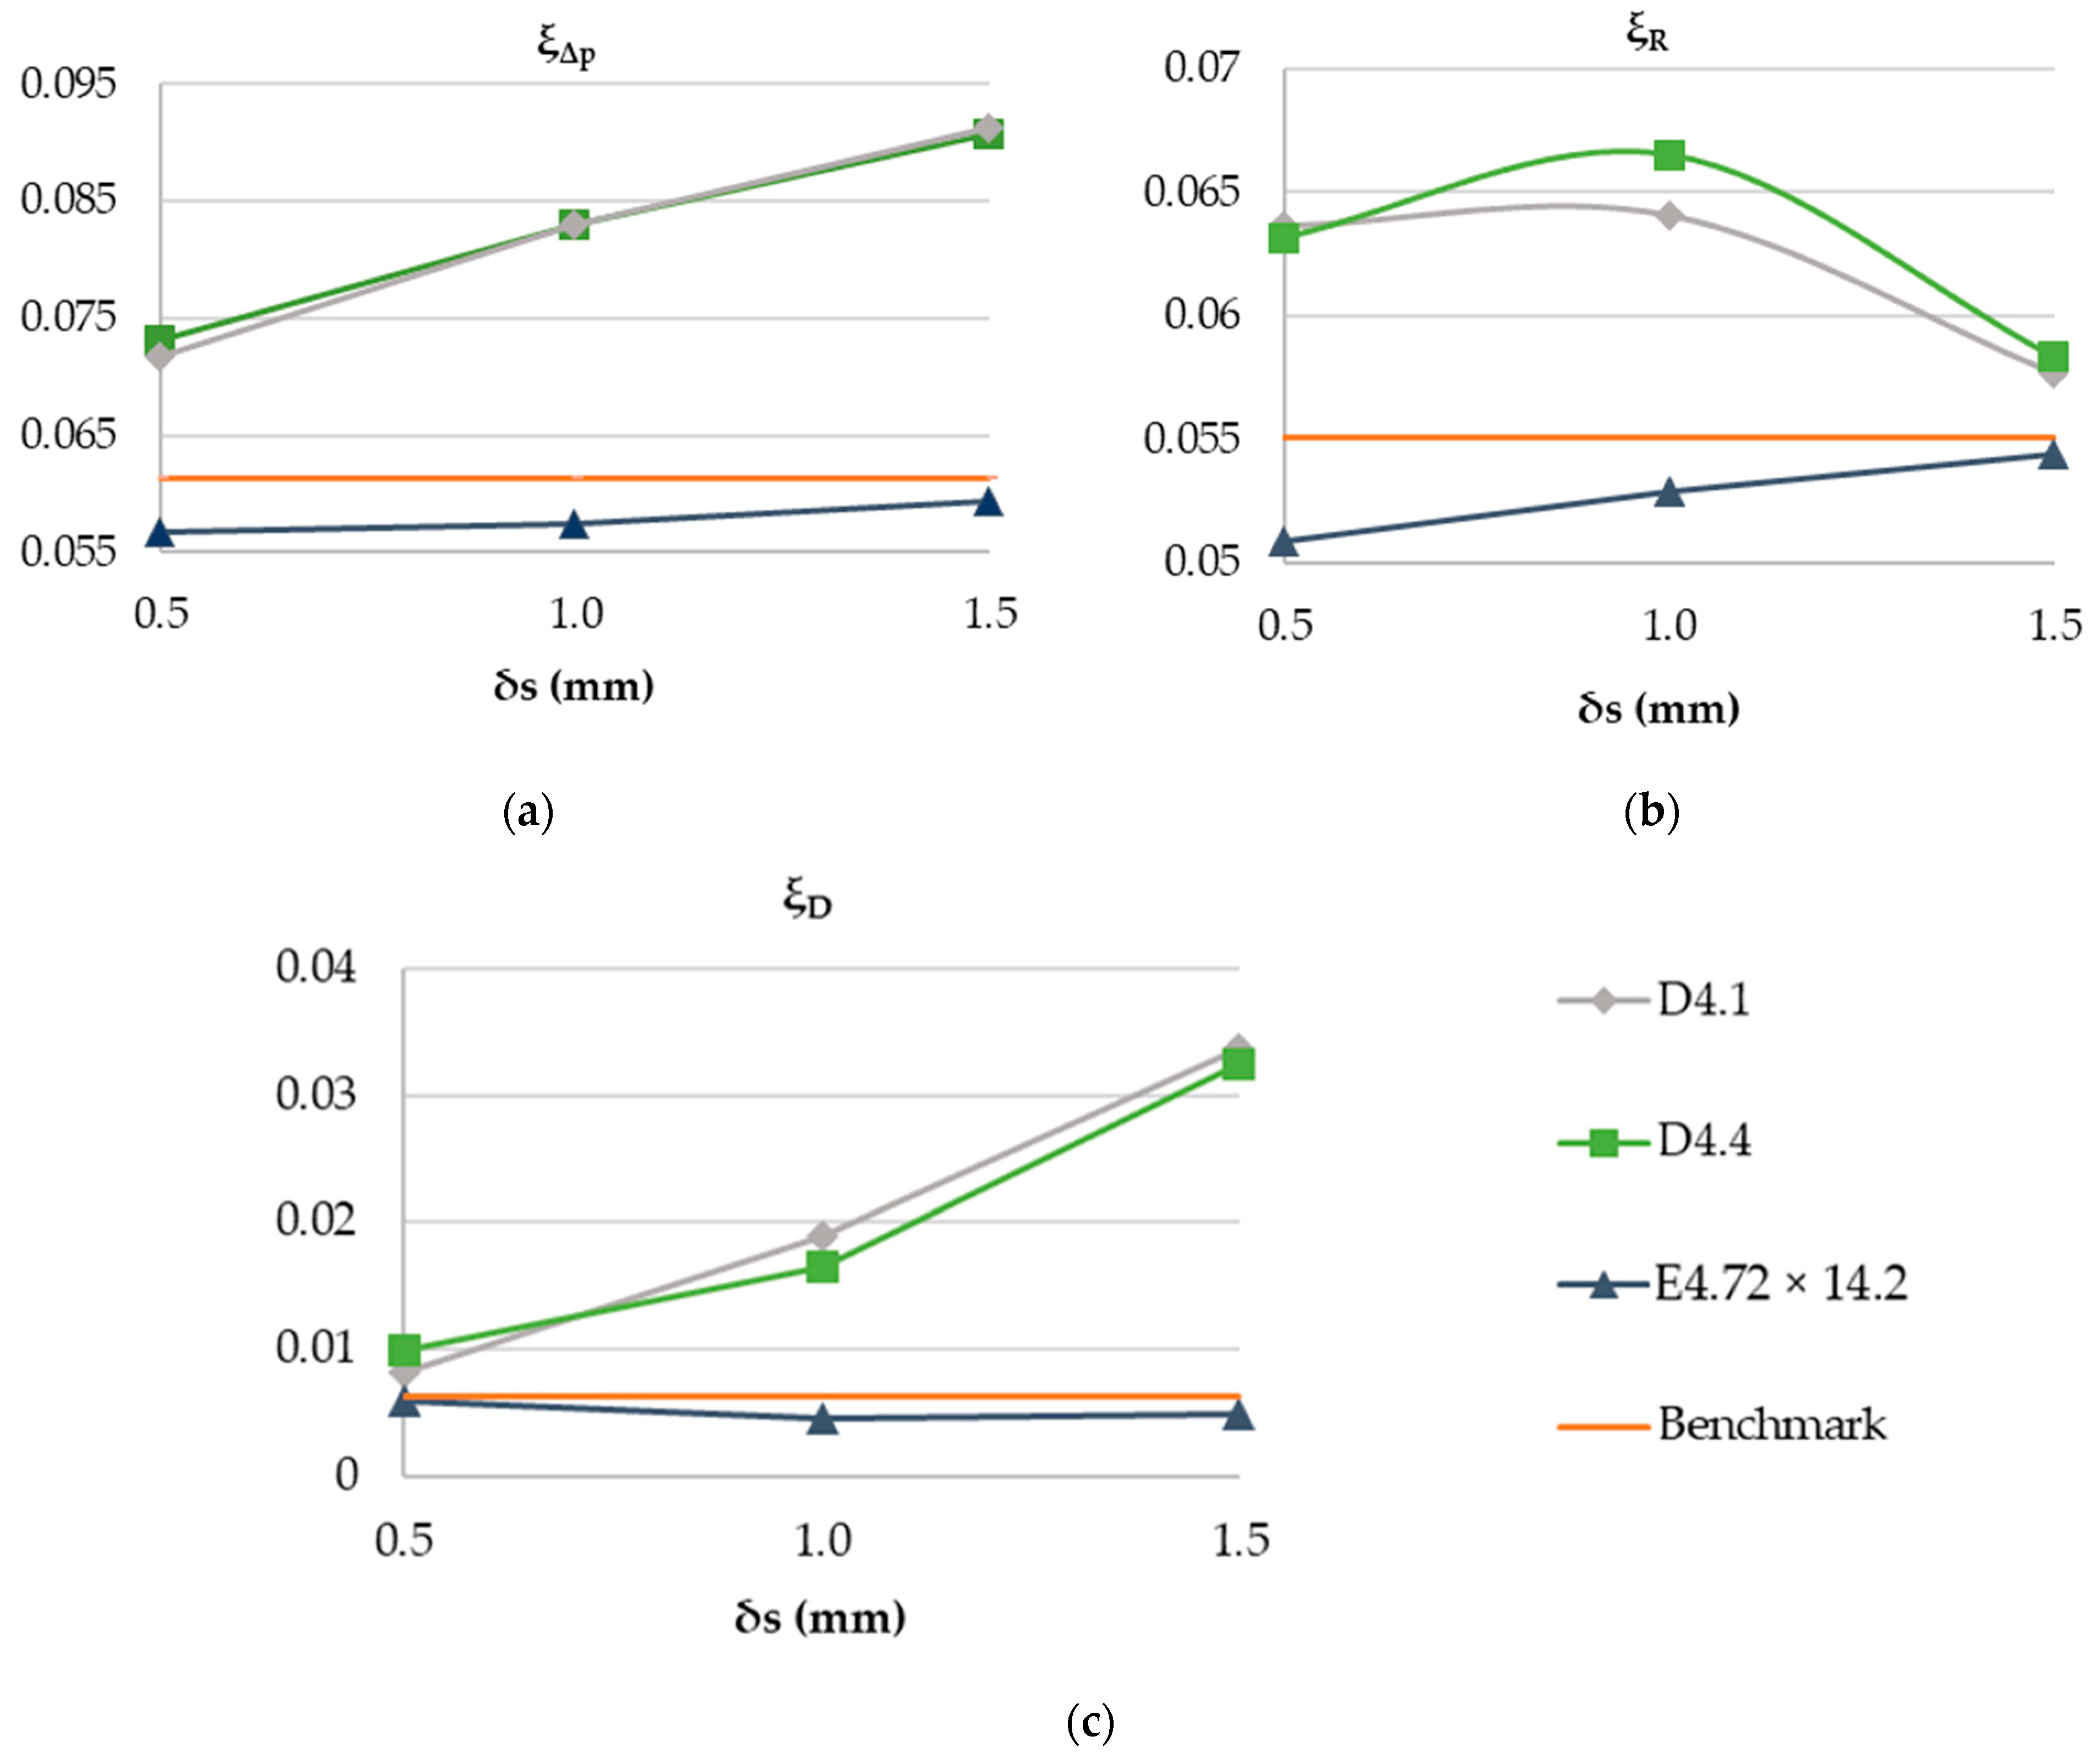
In order to gain a deeper understanding of the impact of secondary structures on the pressure drop, it is helpful to compare the friction coefficients. Figure 10 shows the friction factors for different PPHE configurations. For dimpled secondary structures, the Fanning friction factor is larger than that of the benchmark (Figure 10b). This is as expected, taking into account that the secondary structures increase the surface area of the PPs. The form drag coefficient depends on the shape of the secondary structures and has the smallest value for the E4.72 × 14.2/+0.5 configuration (Figure 10c). In fact, all friction coefficients, and thus the pressure drop values, for all of the ellipsoidal secondary structures are smaller than those of the benchmark and the other studied secondary structures.
The lower friction factor values for ellipsoidal secondary structures can be attributed to their more streamlined shape and their impact on the shape of the vortex. Such vortices can be detected when negative values of the velocity component in the mainstream direction ( u x 0 ) arise. 
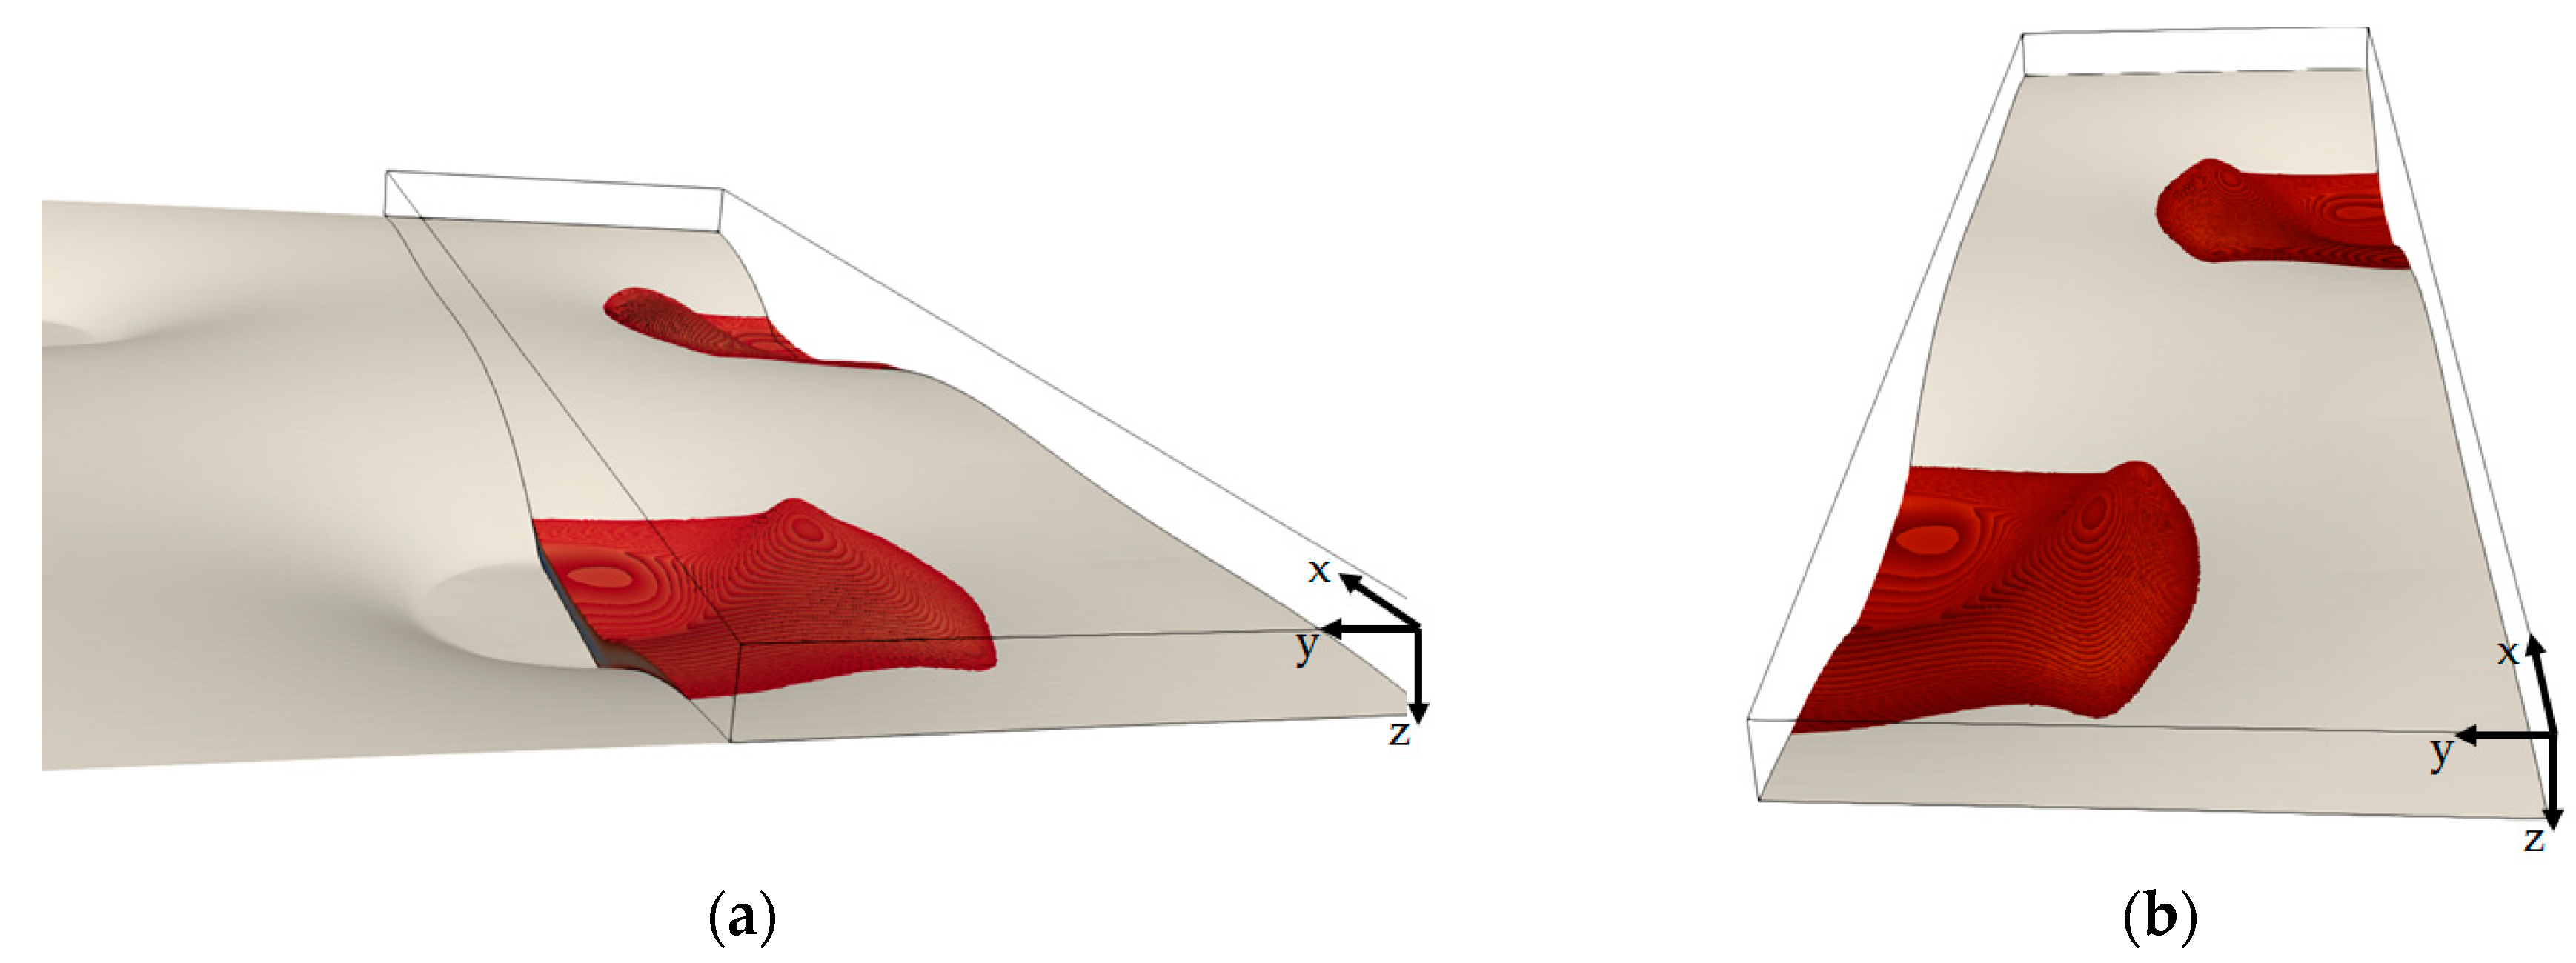
Figure 11 shows the vortices upstream the welding spot in the benchmark. Due to the location and shape of the vortices, the fluid has to bypass these areas, which results in higher form drag and an increased flow path length. This brings about a higher friction. 
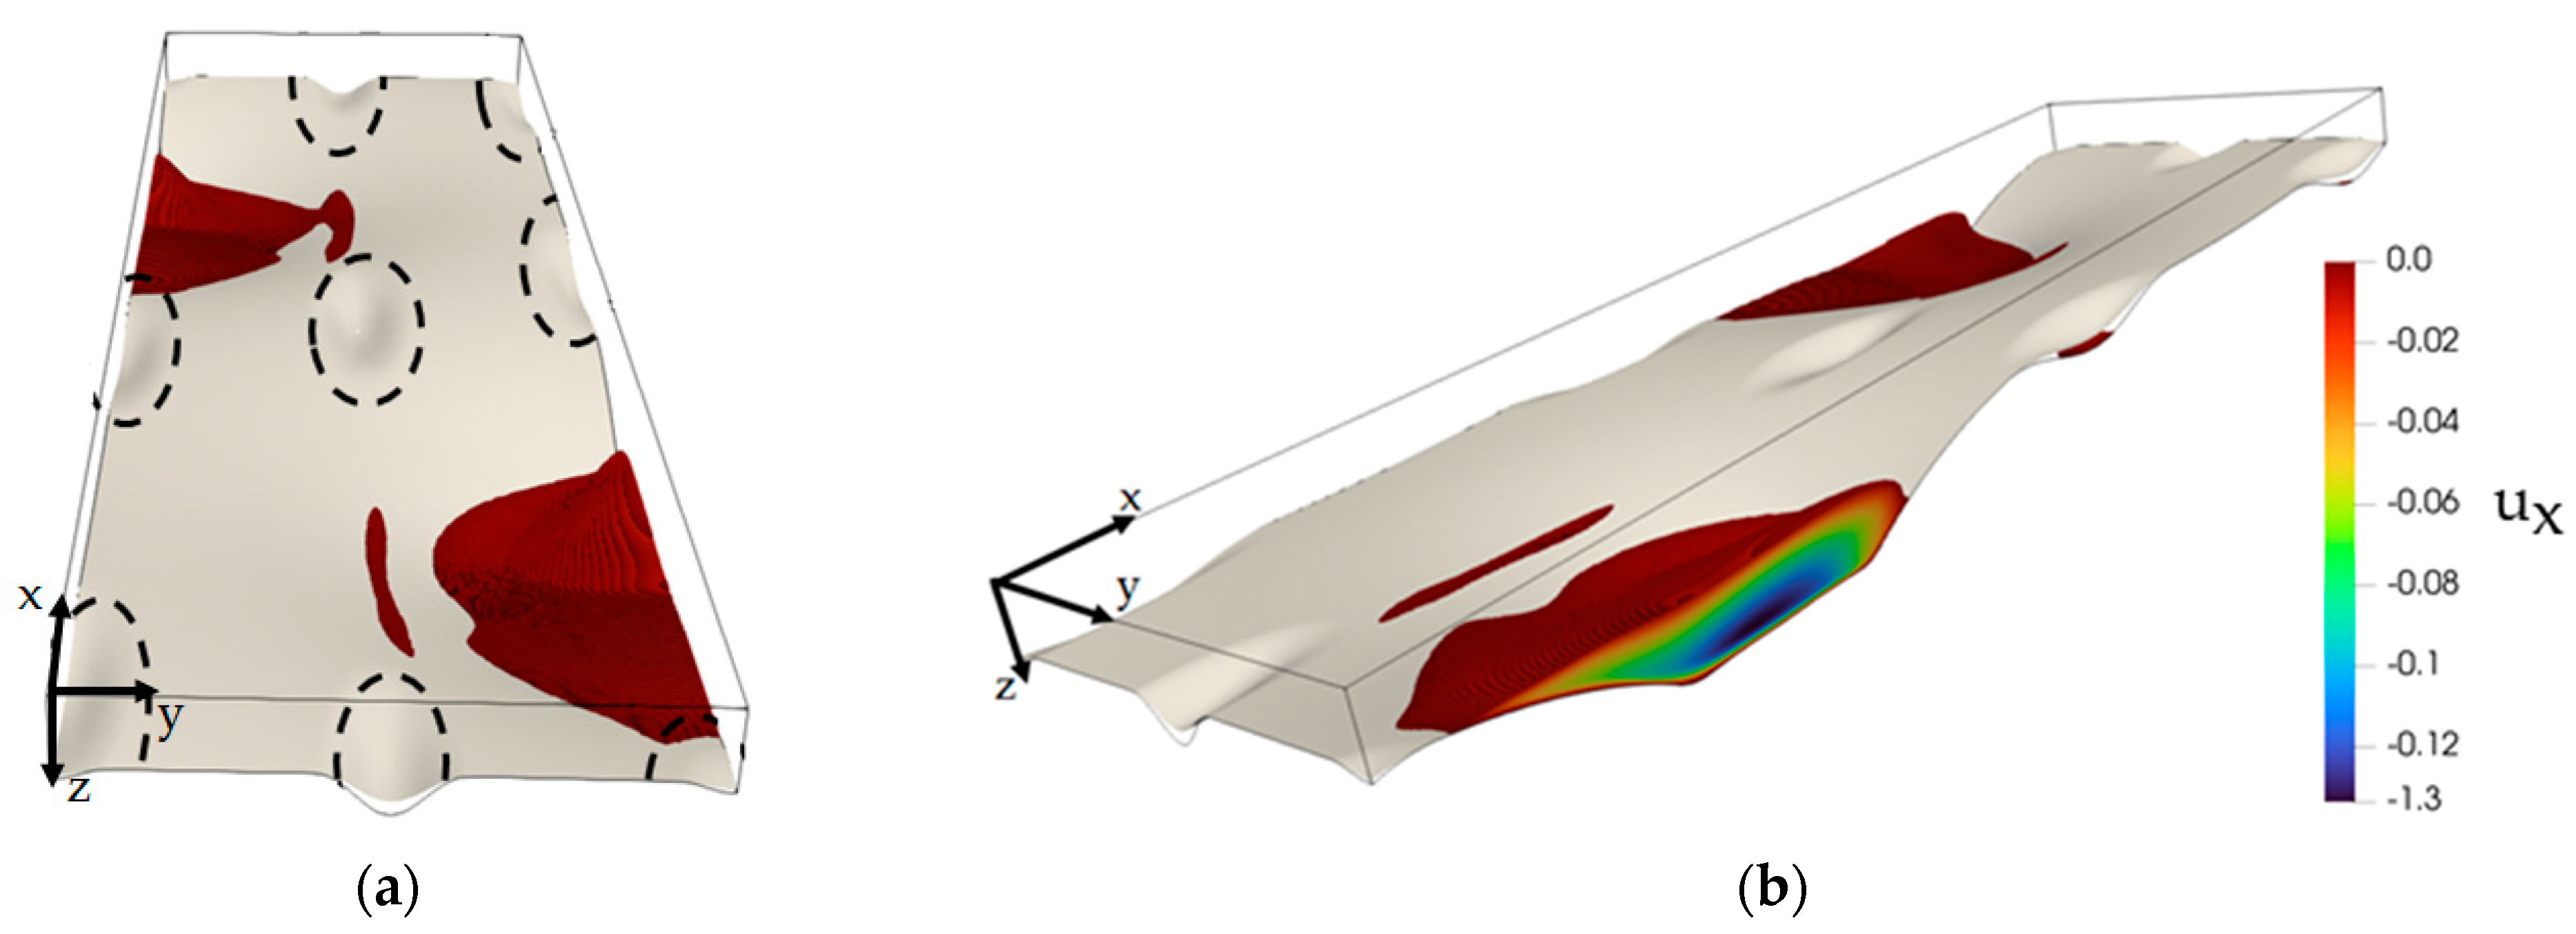
Figure 12 shows the vortices for the case E4.72 × 14.2/+1.5, which has the same Q ˙ W value as the benchmark. Here, the vortices are smaller and cover the welding spot, leaving a larger portion of the channel volume free for the flowing fluid. As a consequence, all friction coefficients are smaller. Also, smaller vortices are less energetic, which results in a lower pressure drop. On the other hand, because of the streamlined shape of the ellipsoid structures, the near-wall mixing reduces. As a result, the heat transfer is slower than for dimpled structuring. Yet, due to the lower pressure drop, the thermo-hydraulic efficiency increases. In fact, it is only ellipsoidal secondary structures that permit the value of ε to increase.
In Figure 10b, a maximum Fanning friction factor is visible for the dimpled surface at δ S = 1 mm. One possible explanation for this maximum is that adding the dimples increases both the surface area of the PP and the turbulence. For smaller δ S and R D , the influence of increasing surface area on Fanning friction is dominant, leading to an increase in friction. For larger dimples, however, the influence of the local turbulence becomes dominant, resulting in a decreasing ξR. The combination of these two opposite effects leads to a maximum Fanning friction factor value. On the other hand, higher turbulence leads to higher form drag. The more streamlined secondary structures can compensate the increase in form drag. Consequently, larger and more streamlined secondary structures can reduce both the Fanning friction factor and the form drag.

7. Conclusions

In this work, a CFD-based study was carried out to investigate the fluid flow and heat transfer in the outer channel of pillow plates (PPs) with various secondary surface structuring. Two basic forms, dimples and ellipsoids, with different geometrical parameters, were selected as elements of secondary structures. Dimples were chosen due to their simple form, while ellipsoids were selected for their more streamlined shape. The structures resulting in a larger volume of the outer channel were denoted “positive”, whereas structures resulting in a smaller volume of the outer channel were called “negative”. For dimples, both negative and positive structures were investigated, while for ellipsoids, only positive structures were studied.
To evaluate the performance of the PPs with secondary structures, it was compared with the performance of a benchmark representing a previously optimized conventional PP geometry.
Deeper secondary structures were found to enhance near-wall mixing and improve heat transfer, yet at the cost of a higher pressure drop. Secondary structures increasing the volume of the outer channel were judged as more promising. Secondary structures with elements having a larger projected surface area and more streamlined arrangement offered enhanced heat transfer with just minimal pressure drop increase, compared to the benchmark.
The evaluation was carried out based on the thermo-hydraulic efficiency. Generally, it decreases with the increasing depth of secondary structures, while it increases with larger projected surface area of secondary structures. This is true for all studied PPs. Due to the preliminary optimization of the benchmark geometry, it was hardly possible to improve both heat transfer and pressure drop characteristics, i.e., there was a common trade-off between them. Only for PPs with ellipsoidal secondary structures, the thermo-hydraulic efficiency was higher than that of the benchmark. This means that further improvement can potentially be achieved with ellipsoidal or more streamlined secondary structures having elements with a larger projected surface area.
It appears reasonable that secondary structuring has an impact on the thermo-hydraulic characteristics in both outer and inner channels. Therefore, the following study will focus on the investigation of the flow and heat transfer in the inner channels of the PPs with secondary structuring.

Author Contributions

Conceptualization, R.A. and E.Y.K.; methodology, R.A.; software, R.A. and Y.G.; validation, R.A. and A.W.; investigation, R.A. and M.H.; resources, E.Y.K.; writing—original draft preparation, R.A.; writing—review and editing, E.Y.K.; supervision, E.Y.K. and W.H. All authors have read and agreed to the published version of the manuscript.

Funding

The authors are grateful for the financial support from the German Research Foundation (DFG, Project number KE 837/46-1). Furthermore, the authors gratefully acknowledge the funding of this project by computing time provided by the Paderborn Center for Parallel Computing (PC 2).

Data Availability Statement

Data sharing not applicable.

Conflicts of Interest

The authors declare no conflict of interest.

Correction Statement

This article has been republished with a minor correction to Equation (9). This change does not affect the scientific content of the article.

Nomenclature

A w surface   area   of   the   channel   wall   ( m 2 ) λ thermal   conductivity   ( W m 1 K 1 )
aminor axis of an ellipsoid element (m)µdynamic viscosity (kg m−1s−1)
bmajor of an ellipsoid element axis (m) ν kinematic   viscosity   ( m 2 s 1 )
C p specific heat capacity (Jkg−1K−1) ξ friction factor (-)
d diameter (m)ω specific   turbulence   dissipation   ( s 1 )
h heat   transfer   coefficient   ( W m - 2 K - 1 )τshear stress (Pa)
k kinetic   turbulent   energy   ( m 2 s 2 )Subscripts
NuNusselt number (-)Ddimple
ppressure (Pa)ddiagonal
PrPrandtl number (-)hhydraulic
Q ˙ heat flow rate (W)iinner
q ˙ w wall   heat   flux   ( W m 2 ) jcartesian system index
q v energy   source / sink   ( W m 3 )kcartesian system index
Rradius (m)Llongitudinal
ReReynolds number (-)mmean
s d ,   S diagonal pitch of neighboring dimples (m)maxmaximum
s L longitudinal welding spot pitch (m)minminimum
s L ,   S longitudinal pitch of secondary structures (m)ngrid node number
s T transversal welding spot pitch (m)oouter
V ˙ volumetric   flow   rate   ( m 3 s 1 )Pplate
Ttemperature (K)Ssecondary structures
u velocity   ( m s 1 ) SPwelding spot
x, y, zCartesian coordinatesSuperscripts
Greek symbols*relative deviation to the benchmark
δ height (m)Other Symbols
Δ p pressure drop (Pa)¯Reynolds-averaged value
ε thermo-hydraulic efficiency (-)fluctuation quantity

References

  1. Shah, R.K.; Sekulic, D.P. Fundamentals of Heat Exchanger Design; John Wiley & Sons: Hoboken, NJ, USA, 2003. [Google Scholar]
  2. Piper, M.; Tran, J.M.; Kenig, E.Y. A CFD Study of the Thermo-hydraulic Characteristics of Pillow-Plate Heat Exchangers. In Proceedings of the ASME Summer Heat Transfer Conference, Washington, DC, USA, 10–14 July 2016. [Google Scholar]
  3. Bergles, A.E.; Nirmalan, V.; Junkhan, G.H.; Webb, R.L. Bibliography on Augmentation of Convective Heat and Mass Transfer; Heat Transfer Laboratory, Iowa State University: Ames, IA, USA, 1983. [Google Scholar]
  4. Webb, R.L. Principles of Enhanced Heat Transfer, 1st ed.; John Wiley & Sons: New York, NY, USA, 1994. [Google Scholar]
  5. Arsenyava, O.; Tovazhnyanskyy, L.; Kapustenko, P.; Klemeš, J.J.; Varbanov, P.S. Review of developments in plate heat exchanger heat transfer enhancement for single-phase applications in process industries. Energies 2023, 16, 4976. [Google Scholar] [CrossRef]
  6. Mastani Joybari, M.; Selvnes, H.; Sevulat, A.; Hafner, A. Potentials and challenges for pillow-plate heat exchangers: State-of-the-art review. Appl. Therm. Eng. 2022, 214, 118739. [Google Scholar] [CrossRef]
  7. Shirzad, M.; Mousavi Ajarostaghi, S.S.; Aghajani Delavar, M.; Sedighi, K. Improve the thermal performance of the pillow plate heat exchanger by using nanofluid: Numerical simulation. Adv. Powder Technol. 2019, 30, 1356–1365. [Google Scholar] [CrossRef]
  8. Piper, M.; Zibart, A.; Tran, J.M.; Kenig, E.Y. Numerical investigation of turbulent forced convection heat transfer in pillow plates. Int. J. Heat Mass Transf. 2016, 94, 516–527. [Google Scholar] [CrossRef]
  9. Ghasemi, K.; Tasnim, S.; Mahmud, S. Second law analysis of pillow plate heat exchanger to enhance thermal performance and its simulation studies. Heat Mass Transf. 2023, 59, 55–66. [Google Scholar] [CrossRef]
  10. Piper, M.; Zibart, A.; Djakow, E.; Springer, R.; Homberg, W.; Kenig, E.Y. Heat transfer enhancement in pillow-plate heat exchangers with dimpled surfaces: A numerical study. Appl. Therm. Eng. 2019, 153, 142–146. [Google Scholar] [CrossRef]
  11. Piper, M.; Olenberg, A.; Tran, J.M.; Kenig, E.Y. Determination of the geometric design parameters of pillow-plate heat exchangers. Appl. Therm. Eng. 2015, 91, 1168–1175. [Google Scholar] [CrossRef]
  12. Wilcox, D.C. Turbulence Modelling for CFD, 3rd ed.; DCW Industries: La Cañada, CA, USA, 2006. [Google Scholar]
  13. Schlichting, H.; Gersten, K. Boundary-Layer Theory, 9th ed.; Springer: Berlin, Germany, 2017. [Google Scholar]
  14. Zibart, A.; Kenig, E.Y. Numerical investigation of conjugate heat transfer in a pillow-plate heat exchanger. Int. J. Heat Mass Transf. 2021, 165, 120567. [Google Scholar] [CrossRef]
  15. Menter, F.R. Two-equation eddy-viscosity turbulence models for engineering applications. AIAA J. 1994, 32, 1598–1605. [Google Scholar] [CrossRef]
  16. Menter, F.R.; Kuntz, M.; Langtry, R. Ten Years of Industrial Experience with the SST Turbulence Model. Turbul. Heat Mass Transf. 2003, 4, 625–632. [Google Scholar]
  17. Menter, F.R. Review of the shear-stress transport turbulence model experience from an industrial perspective. Int. J. Comput. Fluid Dyn. 2009, 23, 305–316. [Google Scholar] [CrossRef]
  18. Patankar, S.V.; Liu, C.H.; Sparrow, E.M. Fully developed flow and heat transfer in ducts having streamwise-periodic variations of cross-sectional area. ASME J. Heat Transf. 1977, 99, 180–186. [Google Scholar] [CrossRef]
  19. Zierep, J.; Bühler, K. Grundzüge der Strömungslehre, Grundlage, Statik und Dynamik der Fluide, 10th ed.; Springer Vieweg: Wiesbaden, Germany, 2015. [Google Scholar] [CrossRef]
Figure 1. Pillow plate representation: front view (a), side view (b) and a digital image with the characteristic geometry parameters (c). Cold fluid flows through inner channels, while hot fluid flows through outer channels.
Energies 16 07284 g001
Figure 2. Periodic section of a PP outer channel with dimpled surface: negative (a) and positive (b). Red dash line denotes one of the dimples.
Energies 16 07284 g002
Figure 3. Periodic section of PP outer channel with ellipsoidal surface structuring. Red dash line denotes one of the ellipsoids.
Energies 16 07284 g003
Figure 4. Periodic computational domain and boundary conditions.
Energies 16 07284 g004
Figure 5. Representation of the mesh near the welding spot.
Energies 16 07284 g005
Figure 6. Comparison of simulated pressure drop in the outer PP channel with the data measured by Piper et al. [2], for 7000 ≤ Re ≤ 14,000.
Energies 16 07284 g006
Figure 7. Simulation results for the benchmark: characteristic vortex and boundary layer separation (a) and normalized wall heat flux (b). The welding spots are indicated by black circles.
Energies 16 07284 g007
Figure 8. Boundary separation and near-wall streamlines for geometry D4.1/−1.5. Recirculation zones are represented by τ w , x 0 . The welding spots are indicated by black circles. The dotted circles show the location of secondary structures.
Energies 16 07284 g008
Figure 9. Pressure drop in PPHEs with different secondary structures and positiv δ S .
Energies 16 07284 g009
Figure 10. Dimensionless friction coefficients for different secondary structures with positive δ S : Darcy friction factor (a), Fanning friction factor (b) and form drag coefficient (c).
Energies 16 07284 g010
Figure 11. Recirculation zones in the benchmark: side view on the periodic element together with its mirror image (a) and top view (b). Tornado-like vortices upstream the welding spots are shown in dark color. The black lines represent the edges of the computational domain.
Energies 16 07284 g011
Figure 12. Illustration of recirculation zones of E4.72 × 14.2/+1.5. Top view of periodic element (a) and side view of simulation domain (b). The black lines represent the edges of simulation domain and the dash lines show the location of the secondary structures.
Energies 16 07284 g012
Table 1. Geometrical parameters of investigated pillow plates with secondary structures.
s L ,   S  (mm) s d ,   S  (mm) R D  (mm) a  (mm) b  (mm) δ S  (mm)Abbreviation
------Benchmark
18 s T 4 2 + s L , S 2 2   = 13.83 4.1--+0.5D4.1/+0.5
1813.834.1--+1.0D4.1/+1.0
1813.834.1--+1.5D4.1/+1.5
1813.834.1--−0.5D4.1/−0.5
1813.834.1--−1.0D4.1/−1.0
1813.834.1--−1.5D4.1/−1.5
1813.834.4--+0.5D4.4/+0.5
1813.834.4--+1.0D4.4/+1.0
1813.834.4--+1.5D4.4/+1.5
---4.7214.2+0.5E4.72 × 14.2/+0.5
---4.7214.2+1.0E4.72 × 14.2/+1.0
---4.7214.2+1.5E4.72 × 14.2/+1.5
Table 2. Applied boundary and initial conditions.
x = 0 x = 2   s L y = 0 y = 0.5   s T z = 0WallInitial
uperiodicperiodicsymmetrysymmetrysymmetryno-slip (u = 0)0 m/s
T T x = 0 , m = 323   K zero gradientsymmetrysymmetrysymmetry T w = 303   K 323 K
p-1 barsymmetrysymmetrysymmetry-1 bar
Table 3. Thermo-hydraulic characteristics of the flow in the outer channel of the studied PPs at Re = 5000.
PPHE Δ p
mbar m
Δ p * | Q ˙ W |   ( W ) Q ˙ W * h   ( W m 2 K ) h * A W   ( mm 2 ) A W * d h   ( mm ) ε *
Benchmark5.9-126-3209-1547-13.8-
D4.1/−0.56.7151303.833223.515510.2713.6−9.8
D4.1/−1.08.95114716.9372716.115620.9413.4−23.3
D4.1/−1.512.511316934.2426432.915771.9313.1−38.3
D4.1/+0.56.7141335.533464.315500.1613.9−7.8
D4.1/+1.07.73014112.2354610.515580.7113.9−14.7
D4.1/+1.58.34214314.0358011.515781.9614.0−21.1
D4.4/+0.56.8161357.533965.815500.1513.9−7.4
D4.4/+1.07.62913810.034758.315580.6714.0−15.3
D4.4/+1.58.24015120.1371315.715721.6214.0−15.9
E4.72 × 14.2/+0.55.4−8.5121−3.63053−4.915500.1613.85.1
E4.72 × 14.2/+1.05.4−7.4123−2.43099−3.415580.7113.84.7
E4.72 × 14.2/+1.55.7−3.51260.03134−2.415711.5413.82.0
* Relative deviation to the benchmark in percent.
Disclaimer/Publisher’s Note: The statements, opinions and data contained in all publications are solely those of the individual author(s) and contributor(s) and not of MDPI and/or the editor(s). MDPI and/or the editor(s) disclaim responsibility for any injury to people or property resulting from any ideas, methods, instructions or products referred to in the content.

