
Reliability of Biodegradation Measurements for Inhibitive Industrial Wastewaters


Research Unit of Sustainable Chemistry, University of Oulu, P.O. Box 4300, FI-90014 Oulu, Finland
*
Author to whom correspondence should be addressed.
ChemEngineering 2022, 6(1), 15; https://doi.org/10.3390/chemengineering6010015
Submission received: 15 December 2021
/
Revised: 18 January 2022
/
Accepted: 26 January 2022
/
Published: 3 February 2022
(This article belongs to the Special Issue Feature Papers in Chemical Engineering)
Abstract
:Industrial wastewaters may contain toxic or highly inhibitive compounds, which makes the measurement of biological oxygen demand (BOD) challenging. Due to the high concentration of organic compounds within them, industrial wastewater samples must be diluted to perform BOD measurements. This study focused on determining the reliability of wastewater BOD measurement using two different types of industrial wastewater, namely pharmaceutical wastewater containing a total organic carbon (TOC) value of 34,000 mg(C)/L and industrial paper manufacturing wastewater containing a corresponding TOC value of 30 mg(C)/L. Both manometric respirometry and the closed-bottle method were used in the study, and the results were compared. It was found that the dilution wastewaters containing inhibitive compounds affected BOD values, which increased due to the decreased inhibiting effect of wastewater pollutants. Therefore, the correct BOD for effluents should be measured from undiluted samples, while the diluted value is appropriate for determining the maximum value for biodegradable organic material in the effluent. The accuracy of the results from the blank samples was also examined, and it was found that the readings of these were different to those from the samples. Therefore, the blank value that must be subtracted may differ depending on the sample.
1. Introduction
Biodegradability is an important indicator when assessing the environmental friendliness of pollutants in wastewater that refers to the activity of degradation by bacteria and microorganisms. Biodegradation is nature’s own treatment method for mineralizing organic compounds that are widely used in wastewater treatment. It is a cheap and effective means of doing so, as the bacteria degrade the pollutants [1,2]. The biological oxygen demand (BOD) refers to the amount of oxygen consumed in the biodegradation of a particular compound. The samples examined in this study were inhibitory industrial wastewaters [3,4]. This means that the BOD of the raw water was low or zero, since the bacteria could not decompose the sample when they could not function in the solution. This BOD value of the raw sample was correct for the wastewater samples (WWP1 and WWP2) [5]. As the sample was inhibitory rather than non-degradable, its biodegradability increased as the dilution factor increased. This was because the bacteria were then able to use the compounds as food, which they did not do in the case of a nonbiodegradable compound, and thus the BOD of the diluted solution was high. This diluted figure indicated how much organic biodegradable material the sample contained [6]. This BOD for the maximum value for biodegradable organic material was obtained by using the value above which dilution no longer had an augmenting effect on the BOD value [7]. The proportion of total organic matter was obtained through total organic carbon (TOC) measurement. If the degree of biodegradability was lower than 100%, the remaining part was nonbiodegradable. Therefore, degrees of biodegradability were calculated for these results, from which it could then be seen that the sample did not contain a nonbiodegradable fraction at high dilutions.
The traditional way of measuring BOD values is called the closed-bottle method, while the oxygen content is determined using electrodes or titration, depending on the standard used [5,8,9,10,11]. In the closed-bottle method, the initial and final oxygen concentrations are measured, from which the BOD value of the wastewater is calculated. The name of this method is derived from the fact that there is no air space in the bottle. The organic pollutants in wastewater consume only the oxygen present in the solution. In the Organisation for Economic Co-operation and Development (OECD) Guidelines for the Testing of Chemicals, OECD 301D is the standard for the closed-bottle test [8]. The manometric respirometry test, which is based on measuring pressure and calculating the BOD value using the modified ideal gas law, [8,10] is another means of measuring BOD values [8,9] and also a way to measure oxygen consumption, according to the OECD guidelines [8]. The OxiTop measuring device used in this method takes multiple measuring points as a function of time with one measurement. Both the closed-bottle and manometric respirometry methods are used in routine BOD measurements.
In the present study, measurements were performed on two factory effluents with significantly different TOC values via both manometric respirometry and the closed-bottle method by using titration and electrodes to measure oxygen content. We examined the biodegradability of wastewaters containing inhibitive pollutants and the differences between the BOD values of undiluted and diluted wastewaters. The purpose of the study was to determine whether these waters had a maximum BOD value and whether they were completely biodegradable at high dilutions. We also determined whether the sampled waters contained nonbiodegradable components. Generally, only BOD7 (the amount of oxygen consumed over a seven-day period) is determined for wastewaters, but in this study, the measurement time was extended to BOD28 (28 days), following OECD guidelines [8]. Also, the nondiluted values were measured to obtain the correct BOD values for the wastewaters [12]. The correctness of the blank value was addressed, as the inhibitive pollutants also affected the BOD value of the blank sample.
2. Materials and Methods
Biodegradability measurements were taken for two different industrial wastewaters: WWP1, which was pharmaceutical wastewater; and WWP2, which was wastewater from the paper manufacturing industry. WWP1 was orange colored and WWP2 contained white precipitation that was filtered off with filter paper (7 μm pore size) from the solution before measurement. The added bacteria strain (incoming wastewater) was gathered from a municipal wastewater treatment plant located in Oulu in northern Finland.
The BOD values were measured using the manometric respirometry method. They were also determined by using the closed-bottle method using both electrodes and titration to measure the oxygen content at the outset, after 7 days, and after 28 days. The inhibitory effects of the wastewaters were determined at the same time [5,8,9,10,11].
The TOC values of the wastewaters in the study were determined with a TOC analyzer (Sievers 900 Portable, GE Analytical Instruments. Theoretical oxygen consumption (ThOD), which refers to the consumption of oxygen theoretically necessary for enumerating the degree of biodegradability, was calculated according to Equation (1):
where 12 is the molecular weight of carbon and 32 is the molecular weight of oxygen.
ThOD = TOC*32/12
The theoretical value of biodegradation does not consider the amount of oxygen consumed by hydrogen, which can be very significant and reduces the calculated degree of biodegradability. The ThOD is therefore indicative only.
The TOC, ThOD, and pH values of the WWP1 and WWP2 samples are presented in Table 1.
For BOD analysis, samples were prepared using the closed-bottle method with the same dilution coefficients as used in the measurements taken with manometric respirometry. The WWP1 sample solutions examined were either raw (undiluted) or diluted at: 1:5, 1:10, 1:50, 1:100, 1:500, 1:1000, 1:5000, or 1:10,000. The WWP2 sample solutions examined were either raw (undiluted) or diluted at: 1:2, 1:5, 1:10, 1:50, 1:100, or 1:200. The highest dilution coefficient was determined based on the TOC value.
The solutions used for dilution were prepared as presented in the OECD 301F standard to enable proper comparison of the results. According to European Standards (EN), 10% of the buffer solution should be used for measurements [8]. The reagents used were analytical grade. Mineral solutions and the buffer solution were prepared according to the OECD 301F measurement, as follows:
- (a)
- Buffer solution
- -
- KH2PO4 (AnalaRNORMAPUR)→8.50 g
- -
- K2HPO4 (Hipersolv for HPLC)→21.75 g
- -
- Na2HPO4·2H2O (GRP Rectapur)→33.40 g
- -
- NH4Cl (Merck)→0.50 g
Mineral solutions:
- (b)
- CaCl2·2H2O (Riedel–de Haën)→36.40 g
- (c)
- MgSO4·7H2O (VWR)→22.50 g
- (d)
- FeCl3·6H2O (Sigma–Aldrich)→0.25 g
All dilutions (a–d) were prepared in quantities up to one liter. A total of 10 mL/L of the buffer solution was added to the dilution water, as well as 1 mL/L of the other saline solutions. The amount of inoculum used was 5mL/L. Each 100 mL of the primarily treated effluent of municipal wastewater used as the inoculum contained a total of 44,000,000 coliforms, 2,200,000 Enterococci, and 22,000 F-RNA coliphages [13]. The measuring temperature was kept at 20.0 ± 0.2 °C. The undiluted sample was not inoculated because the measurement was undertaken according to the standard [5]. The raw samples were measured as such, without the addition of allyl thiourea (ATU), while 5 g/L of ATU was added at 0.5 mL per liter to the dilution water to prevent nitrification.
Measurements using the closed-bottle method were performed according to EN standards [5,8,9,10,11], which state that the oxygen consumed during measurement should be under 6000 mg/L in total to obtain a result.
From each diluted sample, two samples were taken for incubation and one was titrated and measured with an electrode. Examination of biodegradation with this method requires separate sampling. The bottles were filled so that there was no air space left and placed in an incubation chamber at 20.0 ± 0.2 °C. All three samples were titrated with 0.1 N sodium thiosulfate (Na2S2O3; Merck) solution with two replicates, using 100 mL of the sample. The samples had to be moved to another container for titration. Oxygen content was measured with an electrode (Hach Lange LDO, HACH LANGE GmbH, Düsseldorf, Germany) in the same sample flasks before titration with one replicate. The oxygen dissolved in the sample reacted with manganese hydroxide. The sample was acidified and the iodide was oxidized with a manganese compound. At the same time, an equivalent amount of iodine was released, and this iodine was determined by titration with sodium thiosulphate [10]. The oxidizing and reducing compounds were investigated according to the standard [10] before titration, given that analysis was based on oxidation–reduction reactions.
The stoichiometric equations for the reactions described above are as follows [14]:
Mn+2 + 2 OH− → Mn(OH)2
2 Mn(OH)2 + ½ O2 + H2O →2 MnO(OH)2
Oxidation of Mn(II) → Mn(III)
2 Mn(OH)3 + 2 I− + 6 H+ → 2 Mn+2 + I2 + 6 H2O
Oxidation of I− to I2
I2 + I− → I3−
Oxidation of S2O3−2 → S4O6−2
Reduction of I3− → 3I−
I3− + 2S2O3−2 → 3I− + S4O6−2
Reduction of I3− → 3I−
I3− + 2S2O3−2 → 3I− + S4O6−2
(Mn(II)sulphate, Merck; sodium thiosulphate 1 N standard solution, Merck; KI, FF Chemicals; KIO3, Baker Analyzed).
In the closed-bottle method, the start and end points for the oxygen content were obtained by titration or with an electrode, and the oxygen content of the test sample was given by using the respective formulas:
where Mr is the relative molecular mass of the oxygen (32 g mol/L), V1 is the volume of the test sample (ml), V2 is the volume of the titration solution used to titrate the sample solution (ml), and c is the concentration of the sodium thiosulphate solution (mmol/L); and
where V0 is the volume of the bottle (ml) and V′ is the volume of both the manganese (II) sulphate solution (1 mL) and the alkaline reagent (2 mL).
The manometric measurement was done using a BOD OxiTop Control (WTW, XYLEM ANALYTICS UK LTD, Hertfordshire England instrument to determine the BOD values of the wastewater samples. Constant stirring was performed during incubation. The manometric respirometry method (BOD OxiTop C110, WTW: Weilheim, Germany) is based on pressure change in the air space of a bottle [15,16]. The undiluted and blank values of WWP1 were determined in the 0–40 mg/L measuring area (432 mL filling) and the others in the 0–200 mg/L measuring area (250 mL filling). For WWP2, the measuring area was 0–40 mg/L for all samples. With this method, a decrease in pressure is achieved when oxygen is consumed from the air space, and the carbon dioxide and water that form are absorbed into NaOH pellets. An anaerobic biodegradation reaction increases the pressure, as nothing is consumed from the air phase, and methane and carbon dioxide are formed. The equipment calculated the BOD value from the pressure value using the modified ideal gas law (Equation (9)):
where M(O2) is the molecular weight of oxygen (32 g/mol), R is a gas constant (83.144 hPa/mol/K), Tm is the measuring temperature (K), T0 is 273.15 (K), Vtot is the bottle volume (mL), V1 is the liquid phase volume (mL), α is the Bunsen absorption coefficient (0.003103), and Δp is the difference in partial oxygen pressure (hPa). The mineral solutions and dilutions were the same as in the closed-bottle method.
BOD (mg/L) = M(O2)/RTm * [(Vtot − V1)/V1 + αTm/T0] * Δp(O2),
The blank values were also determined alongside the values of the actual samples. The blank samples contained mineral solutions and the inoculum at the same concentrations as the actual samples.
3. Results
3.1. Biodegradation of WWP1 Sample
The WWP1 sample biodegraded at high dilutions, and more than 100% biodegradability was obtained with the manometric method at a dilution of 1:10,000. The explanation for this exceedance was the formation of water, which could not be taken into account because only the carbon content was known. Table 2 and Table 3 show the BOD values and biodegradation degrees of the WWP1 sample after 7 and 28 days. The sample was highly inhibitive at low dilutions and biodegradable at high dilutions. The correct BOD value was measured from the undiluted sample, and the determination of the maximum value for biodegradable organic material was performed with a diluted sample. The largest BOD value had to be such that the dilution would no longer increase it. If a sample contained nonbiodegradable material, a higher dilution coefficient would have no effect on the result, which would stay at a level typical for the sample in question. This value was not found in the results of the present study because higher dilution led to degrees of biodegradation above 100%. In these results, the oxygen consumed by the formation of water could not be taken into account, which caused a large error elevating the calculated degree of biodegradation. The sample that was degraded at the highest dilutions exhibited 51% biodegradability during a seven-day electrode measurement. This result was in line with the 28-day measurements, for which the biodegradation degree at the highest dilution was 75%. With the respirometry method, 74% biodegradability was achieved at a dilution of 1:1000. Dilutions higher than this are already at the limit of quantification, and the results should be considered very critically.
It is clear from Table 2 and Table 3 that inhibition strongly affected the results, even at a dilution of 1:100, a case for which no biodegradation reaction had been observed. Moving from a 1:100 dilution to higher dilutions, the biodegradation results increased, leading to biodegradation values greater than 100% at the highest dilutions. This indicated that the samples consumed more oxygen than was theoretically possible. The first reason for this was related to the blank sample, which is of great importance at such high dilutions. Another reason was the calculation of the theoretical value, which did not take into consideration water formation when the samples contained oxygen. This deficiency in the calculation method could have caused a large error in the measurement results. At low dilutions, the results for the degrees of both BOD and biodegradation were lower with the manometric method than with the electrode method and, the same was true at higher dilutions. The electrochemical probe indicated a value of 8.76 mg/L for the initial oxygen concentration after being bubbled for one hour with compressed air. The oxygen content without bubbling was 2.49 mg/L.
The electrode measurements indicated oxygen content, while the titration measurements were not successful. The problems in determining oxygen content by titration may have been due to various factors, including the presence of suspended matter capable of fixing or consuming iodine or, for example, iodine reacting with a double bond [17].
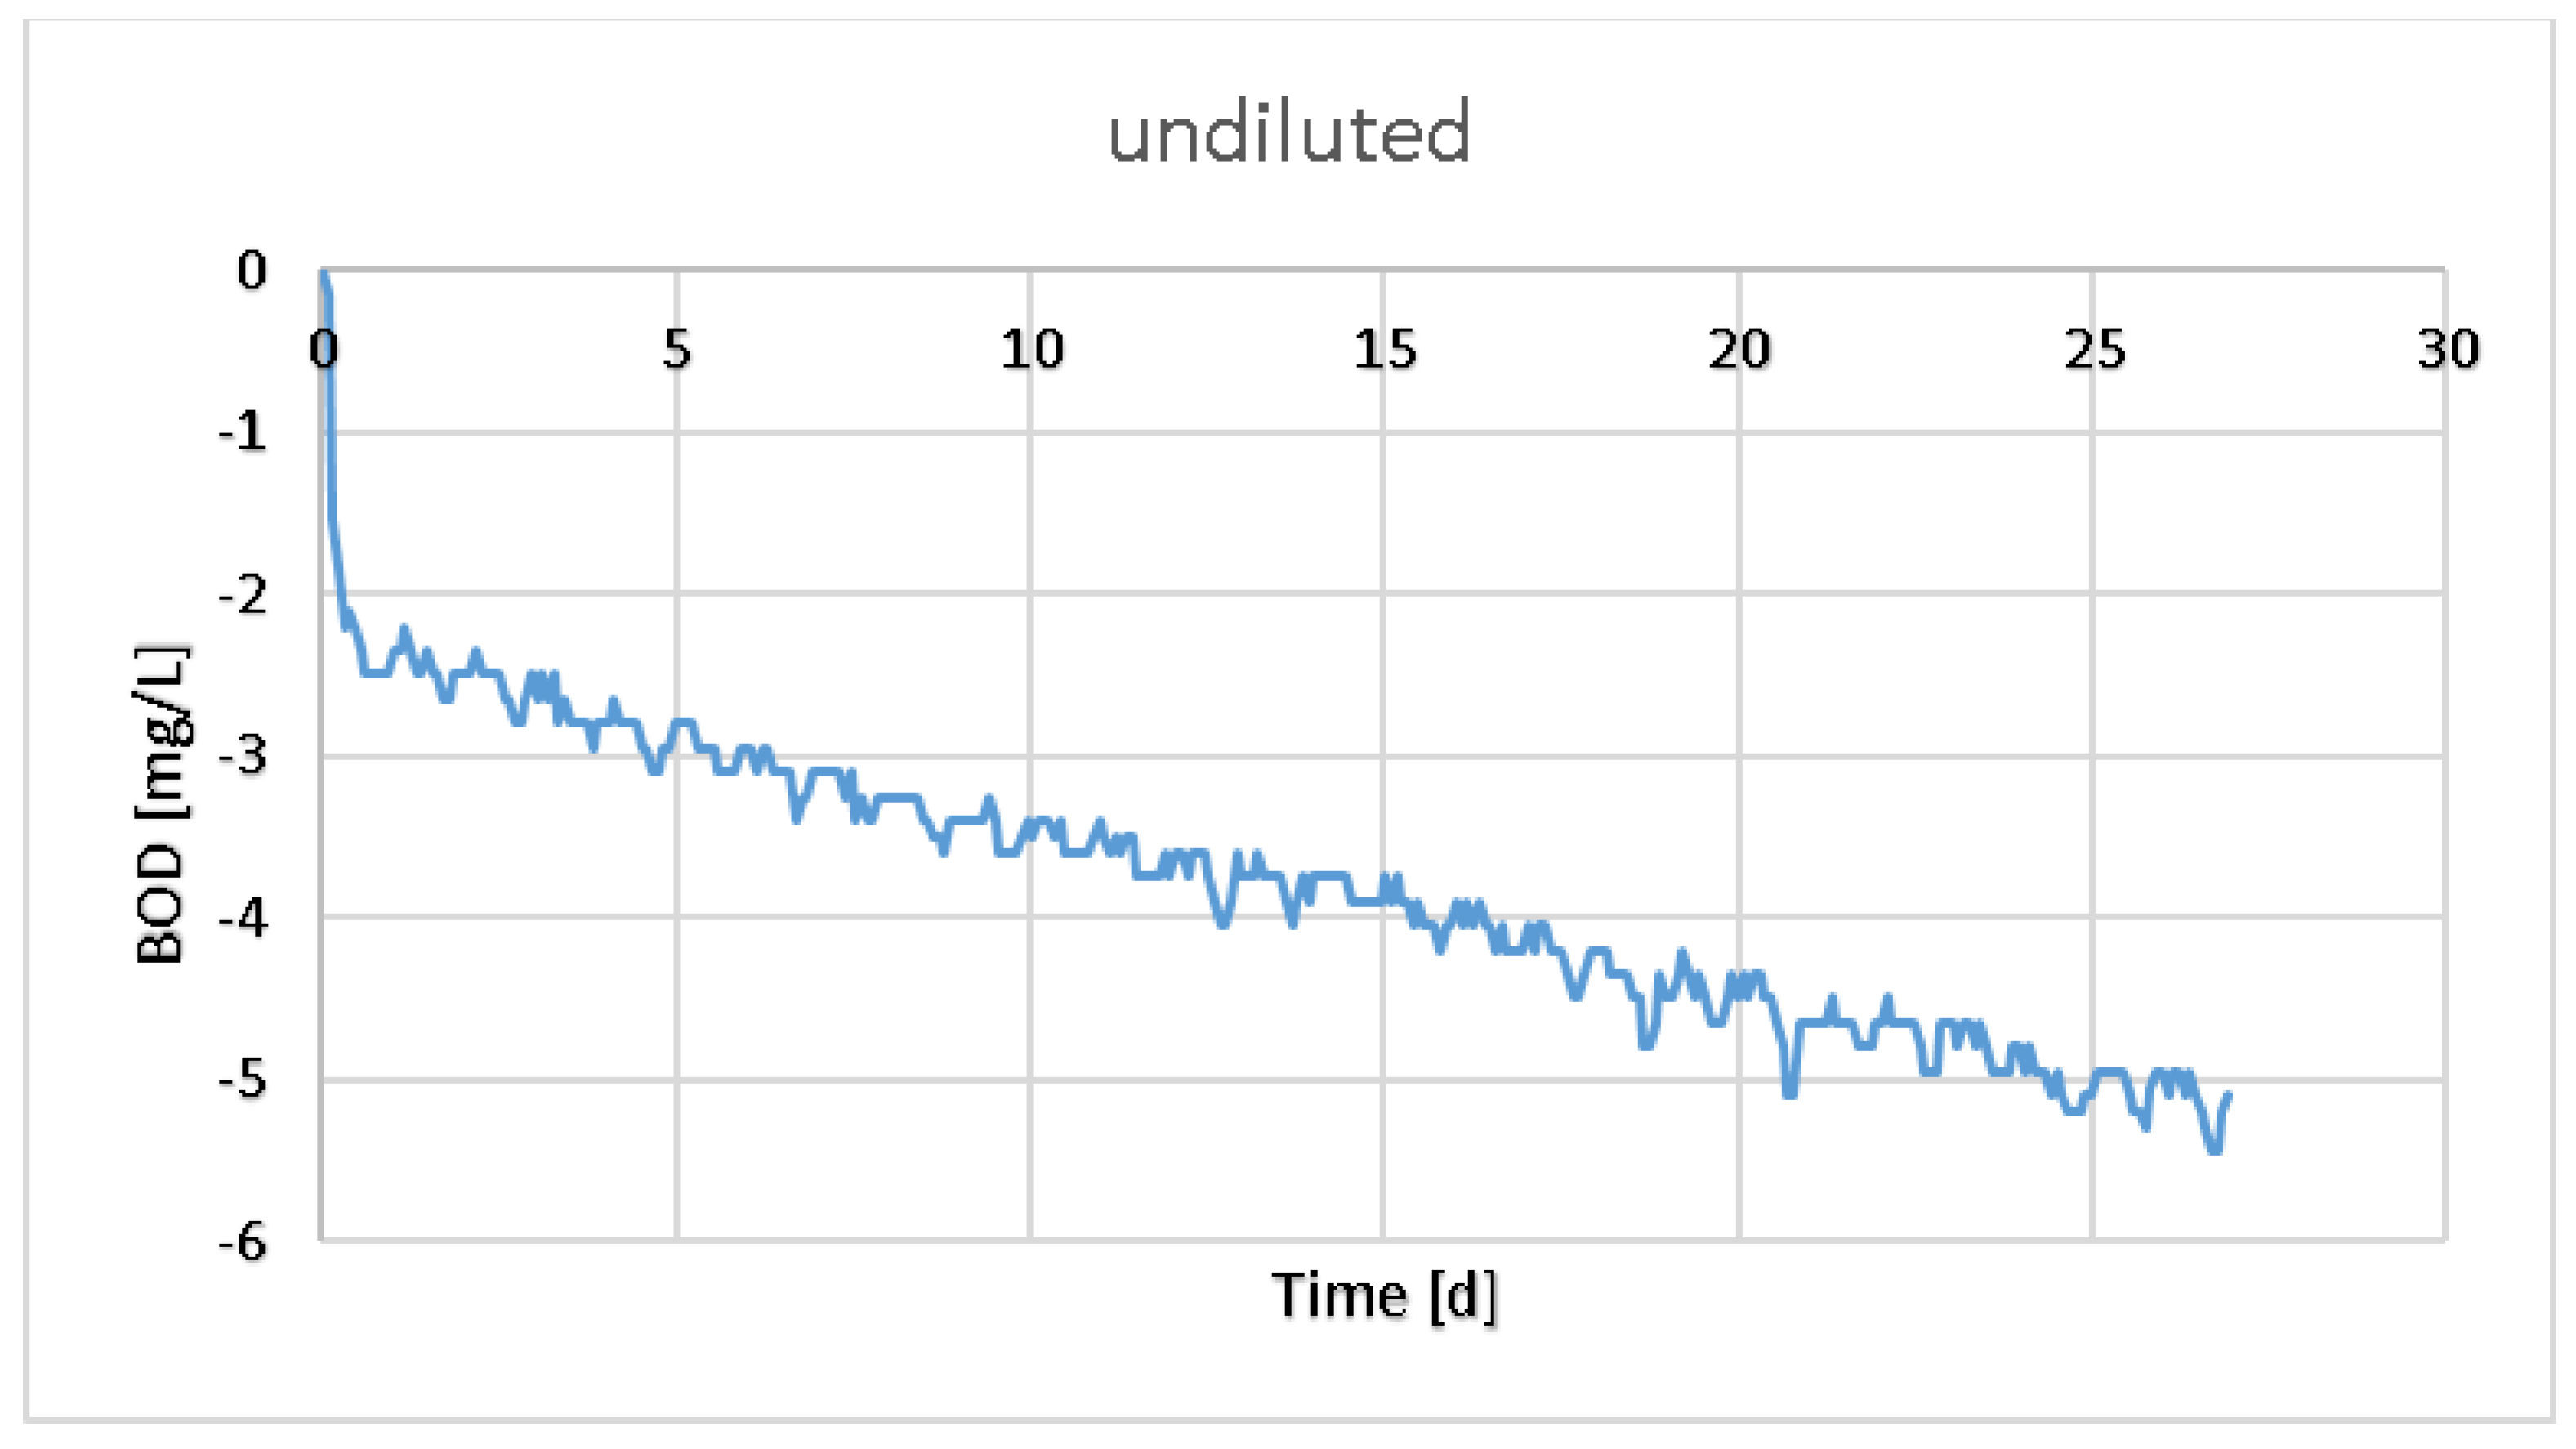
The BOD values of the WWP1 raw sample were measured without an inoculum (Figure 1). As a result, very small negative values were obtained with the manometric method, indicating that the sample without aerobic bacterial transfer was degraded by its own bacteria, which may have been anaerobic [18]. However, the result was close to zero. The advantage of measuring pressure is that a detected increase in pressure indicates anaerobic activity. The anaerobic reaction yields carbon dioxide, methane, and possibly hydrogen sulfide [19]. The BOD value is calculated as a reference only and does not indicate exact the biodegradability of the anaerobic reaction.
If the oxygen content is greater than the initial concentration obtained at the end using the closed-bottle method, there is something wrong with the measurement. With the electrode, the BOD value of the raw sample was zero.
3.2. Biodegradation of the WWP2 Sample
There were differences in the results obtained from the WWP2 sample when using the electrode and titration methods for BOD value determination (Table 4) that can be seen in the differences in measured oxygen consumption. The BOD value of the WWP2 sample was strongly affected by inhibition, the carbon content was lower than in WWP1, and it was easier to find a proper dilution factor in this case. As can be seen in Table 4 and Table 5, the biodegradation degree increased along with the dilution coefficient.
Repeats (after 7 or 28 days) were undertaken with separate flasks, and the biodegradation reaction was not necessarily the same in every bottle, since the reaction is very sensitive to changes in the environment. In Table 4 and Table 5, the differences in the measurements can be seen. The electrode and titration results were quite similar, while the manometric measurements were very different from the others, although the trend was the same. Both titrated and electrode-measured BOD values contained only one blank sample, and the manometric measurement test included two. The undiluted sample contained no inocula, since the measurement was undertaken according to the EN 1899-2:1998 standard. The BOD7 of the raw sample was 1.3 mg/L when titrated, 0.1 mg/L with the electrode, and 8.6 mg/L using the manometric method. As shown in Table 4 and Table 5, the blank values could differ with the same inoculum added to sample solutions, especially after 28 days. It was quite clear that when the coefficient was large, the blank value deduced was crucial. The BOD values obtained with both the electrode and titration methods were very similar, so the biodegradation degree was not calculated separately. The BOD values were the mean values of two repeats. However, each measurement that was performed provided different results. Titration provided lower BOD results than electrode measurements. The sample did not contain iodine-binding matter. Although the sample was clearly inhibitory, a biodegradation reaction was obtained for the undiluted sample measured with the manometric method. The dispersion of the results may have indicated the inhomogeneity of the sample. This could explain the differences between the manometric and closed-bottle methods, since the titration and electrode measurements were undertaken in the same bottle, whereas the samples were diluted separately for the manometric measurement. It can be concluded from the results that the BOD of this wastewater was very difficult to determine, as all methods provided such different values. The manometric method provided completely different results, from which alone their incorrectness cannot be inferred. WWP2 biodegraded within 7 days as measured by the closed-bottle method, but only within 28 days with the manometric method.
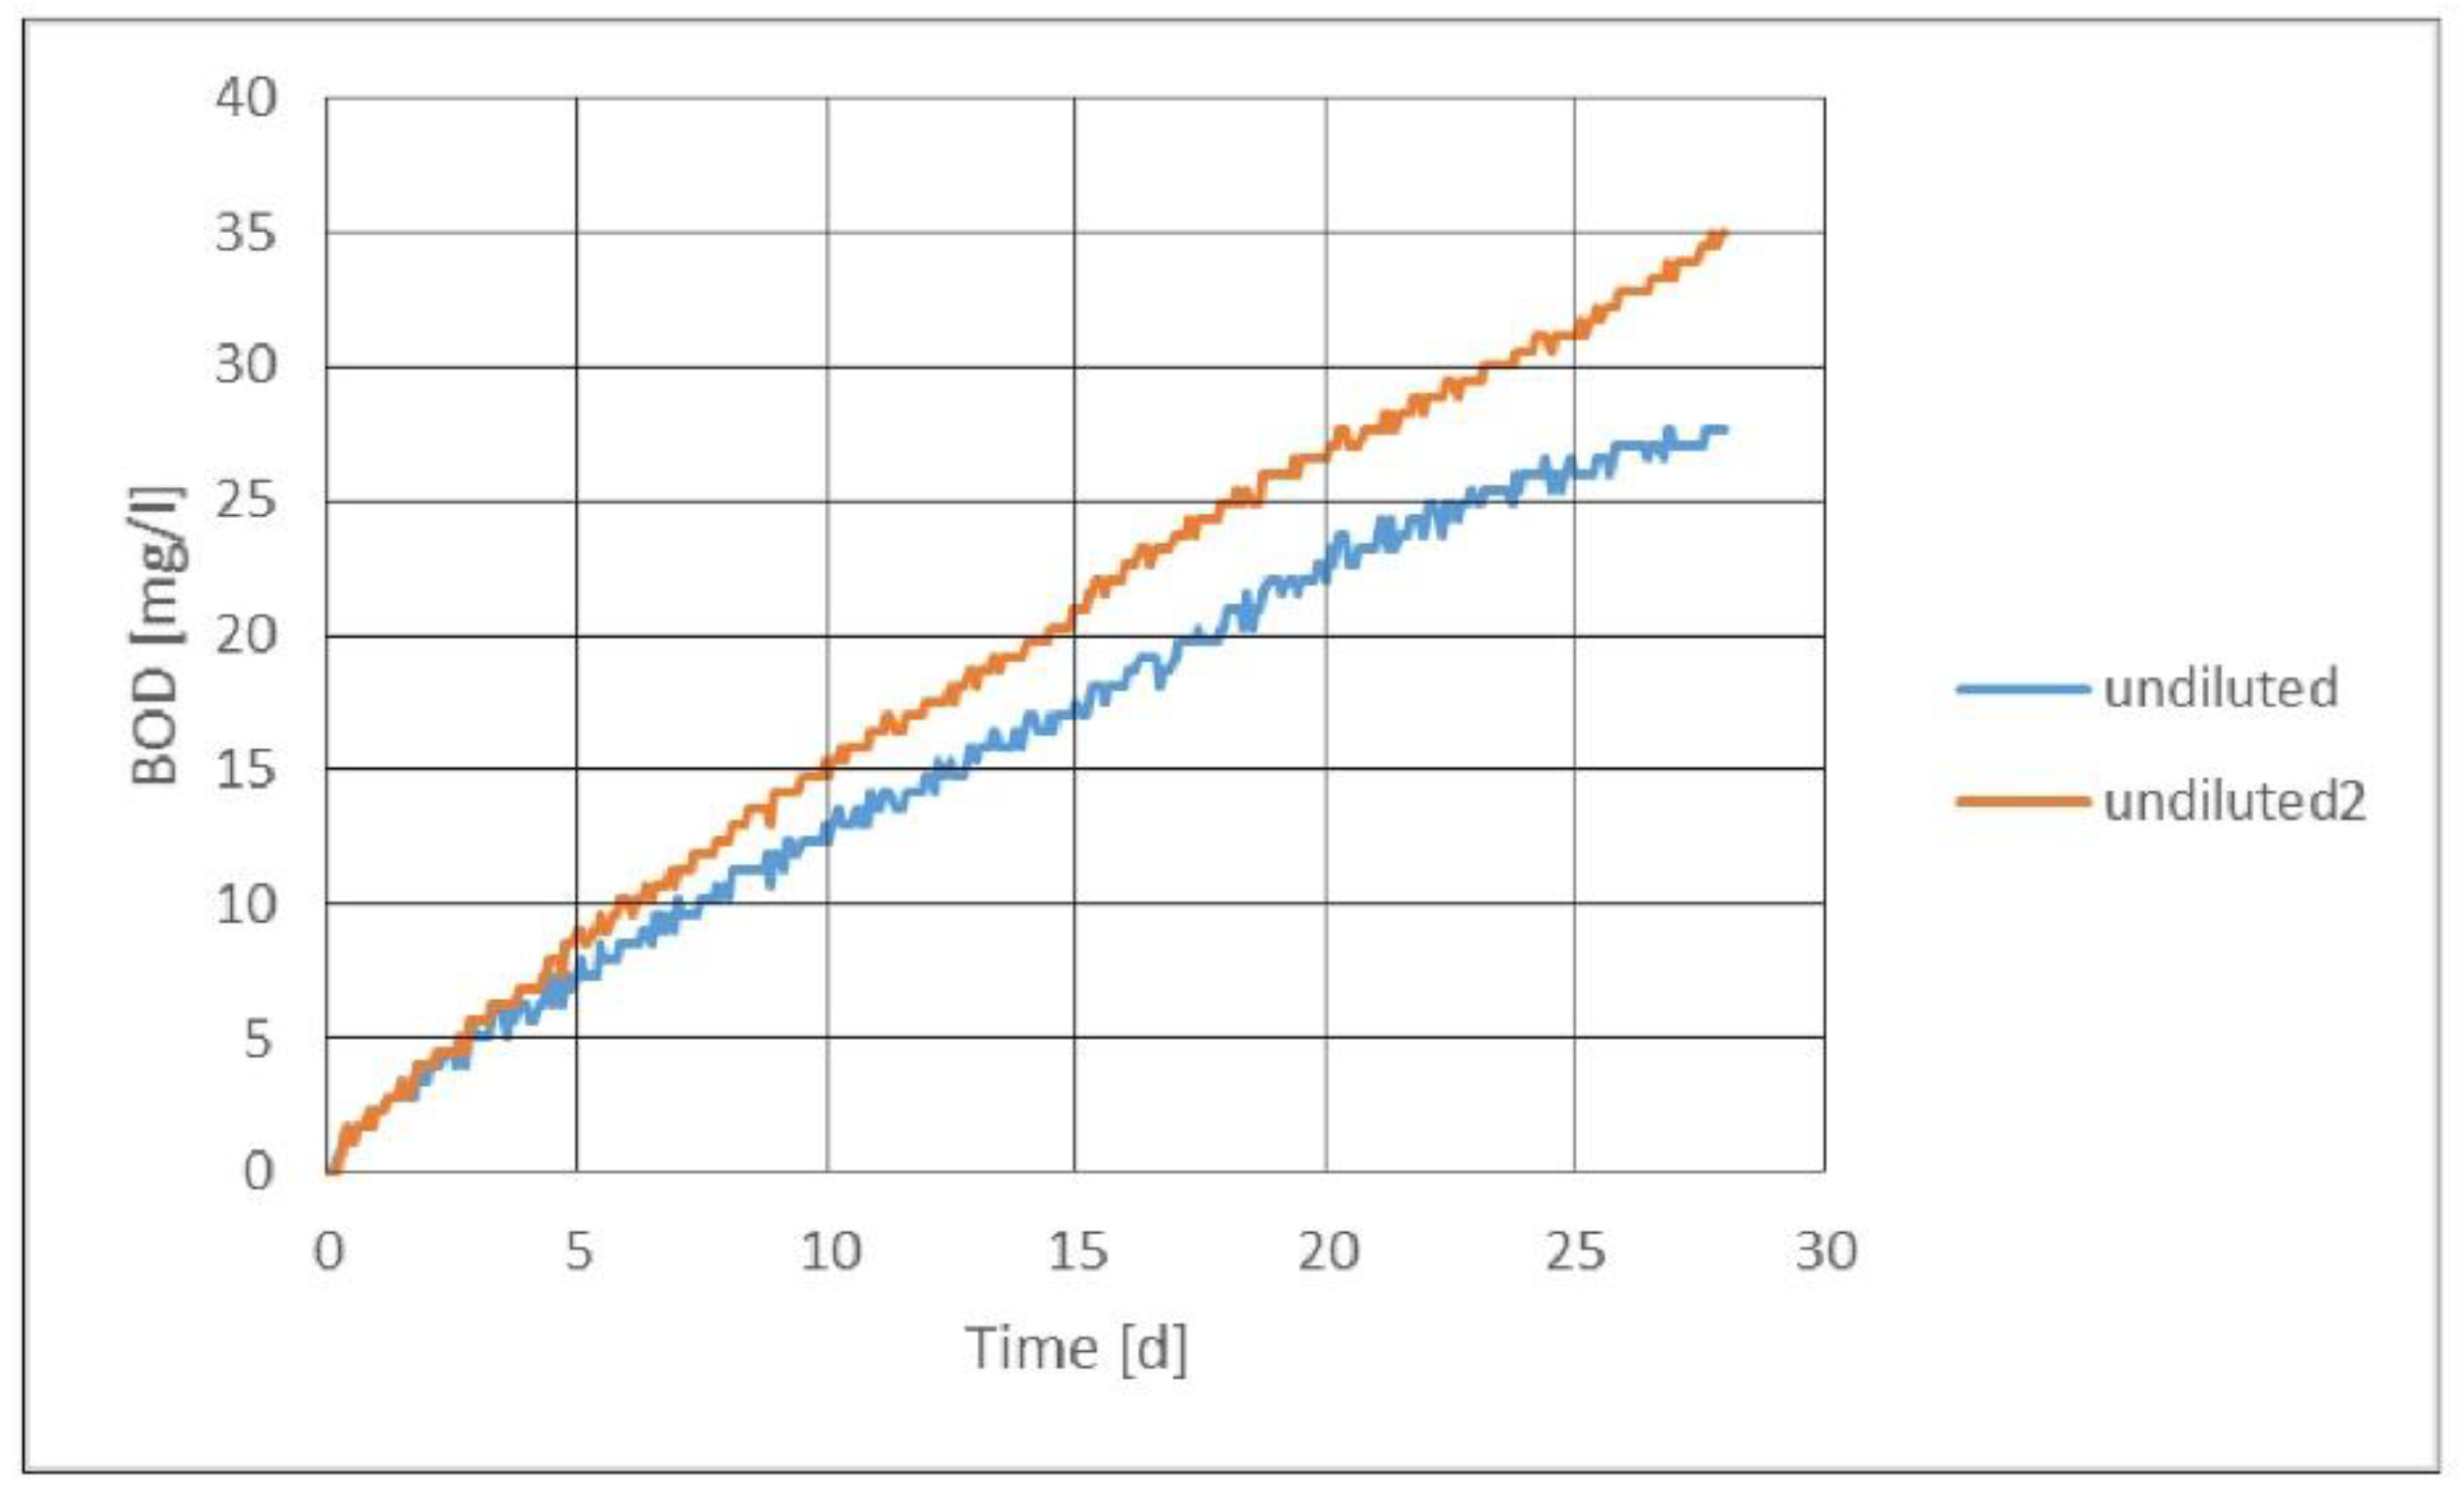
Figure 2 presents the manometric respirometric biodegradation curve, from which it can be seen that biodegradation continued after 28 days. However, the measurement was not continued after 28 days, as only three vials were analyzed at the beginning, after 7 days, and after 28 days with the closed-bottle method. The measurements were performed according to OECD guidelines. By titrating with the closed-bottle method, the WWP2 sample was completely biodegraded within 7 days at a dilution of 1:50. The WWP2 sample could be classified as moderately biodegradable when undiluted and over 90% biodegradable at a dilution of 1:10. As the manometric method does not require separate sampling, the curve could be traced by observing when a sample was completely degraded. This was not possible with the closed-bottle method, as all samples required their own measurements at different times.
3.3. Blank Samples
Measurements with blank samples are always undertaken in addition to the actual samples to ensure that environmental disturbances are eliminated from the results. In biodegradability measurements, a bacterial inoculum is typically added to the sample to ensure that the sample is biodegradable, so that comparable values can be obtained from different laboratories. The wastewater used as an inoculum must contain the widest possible range of bacteria, and it has been found that municipal wastewater works well for this purpose. The bacterial inoculum from the wastewater treatment plant was added to the mineral solution in which the samples were also placed. This mineral solution was used to dilute the sampled effluents of WWP1 and WWP2.
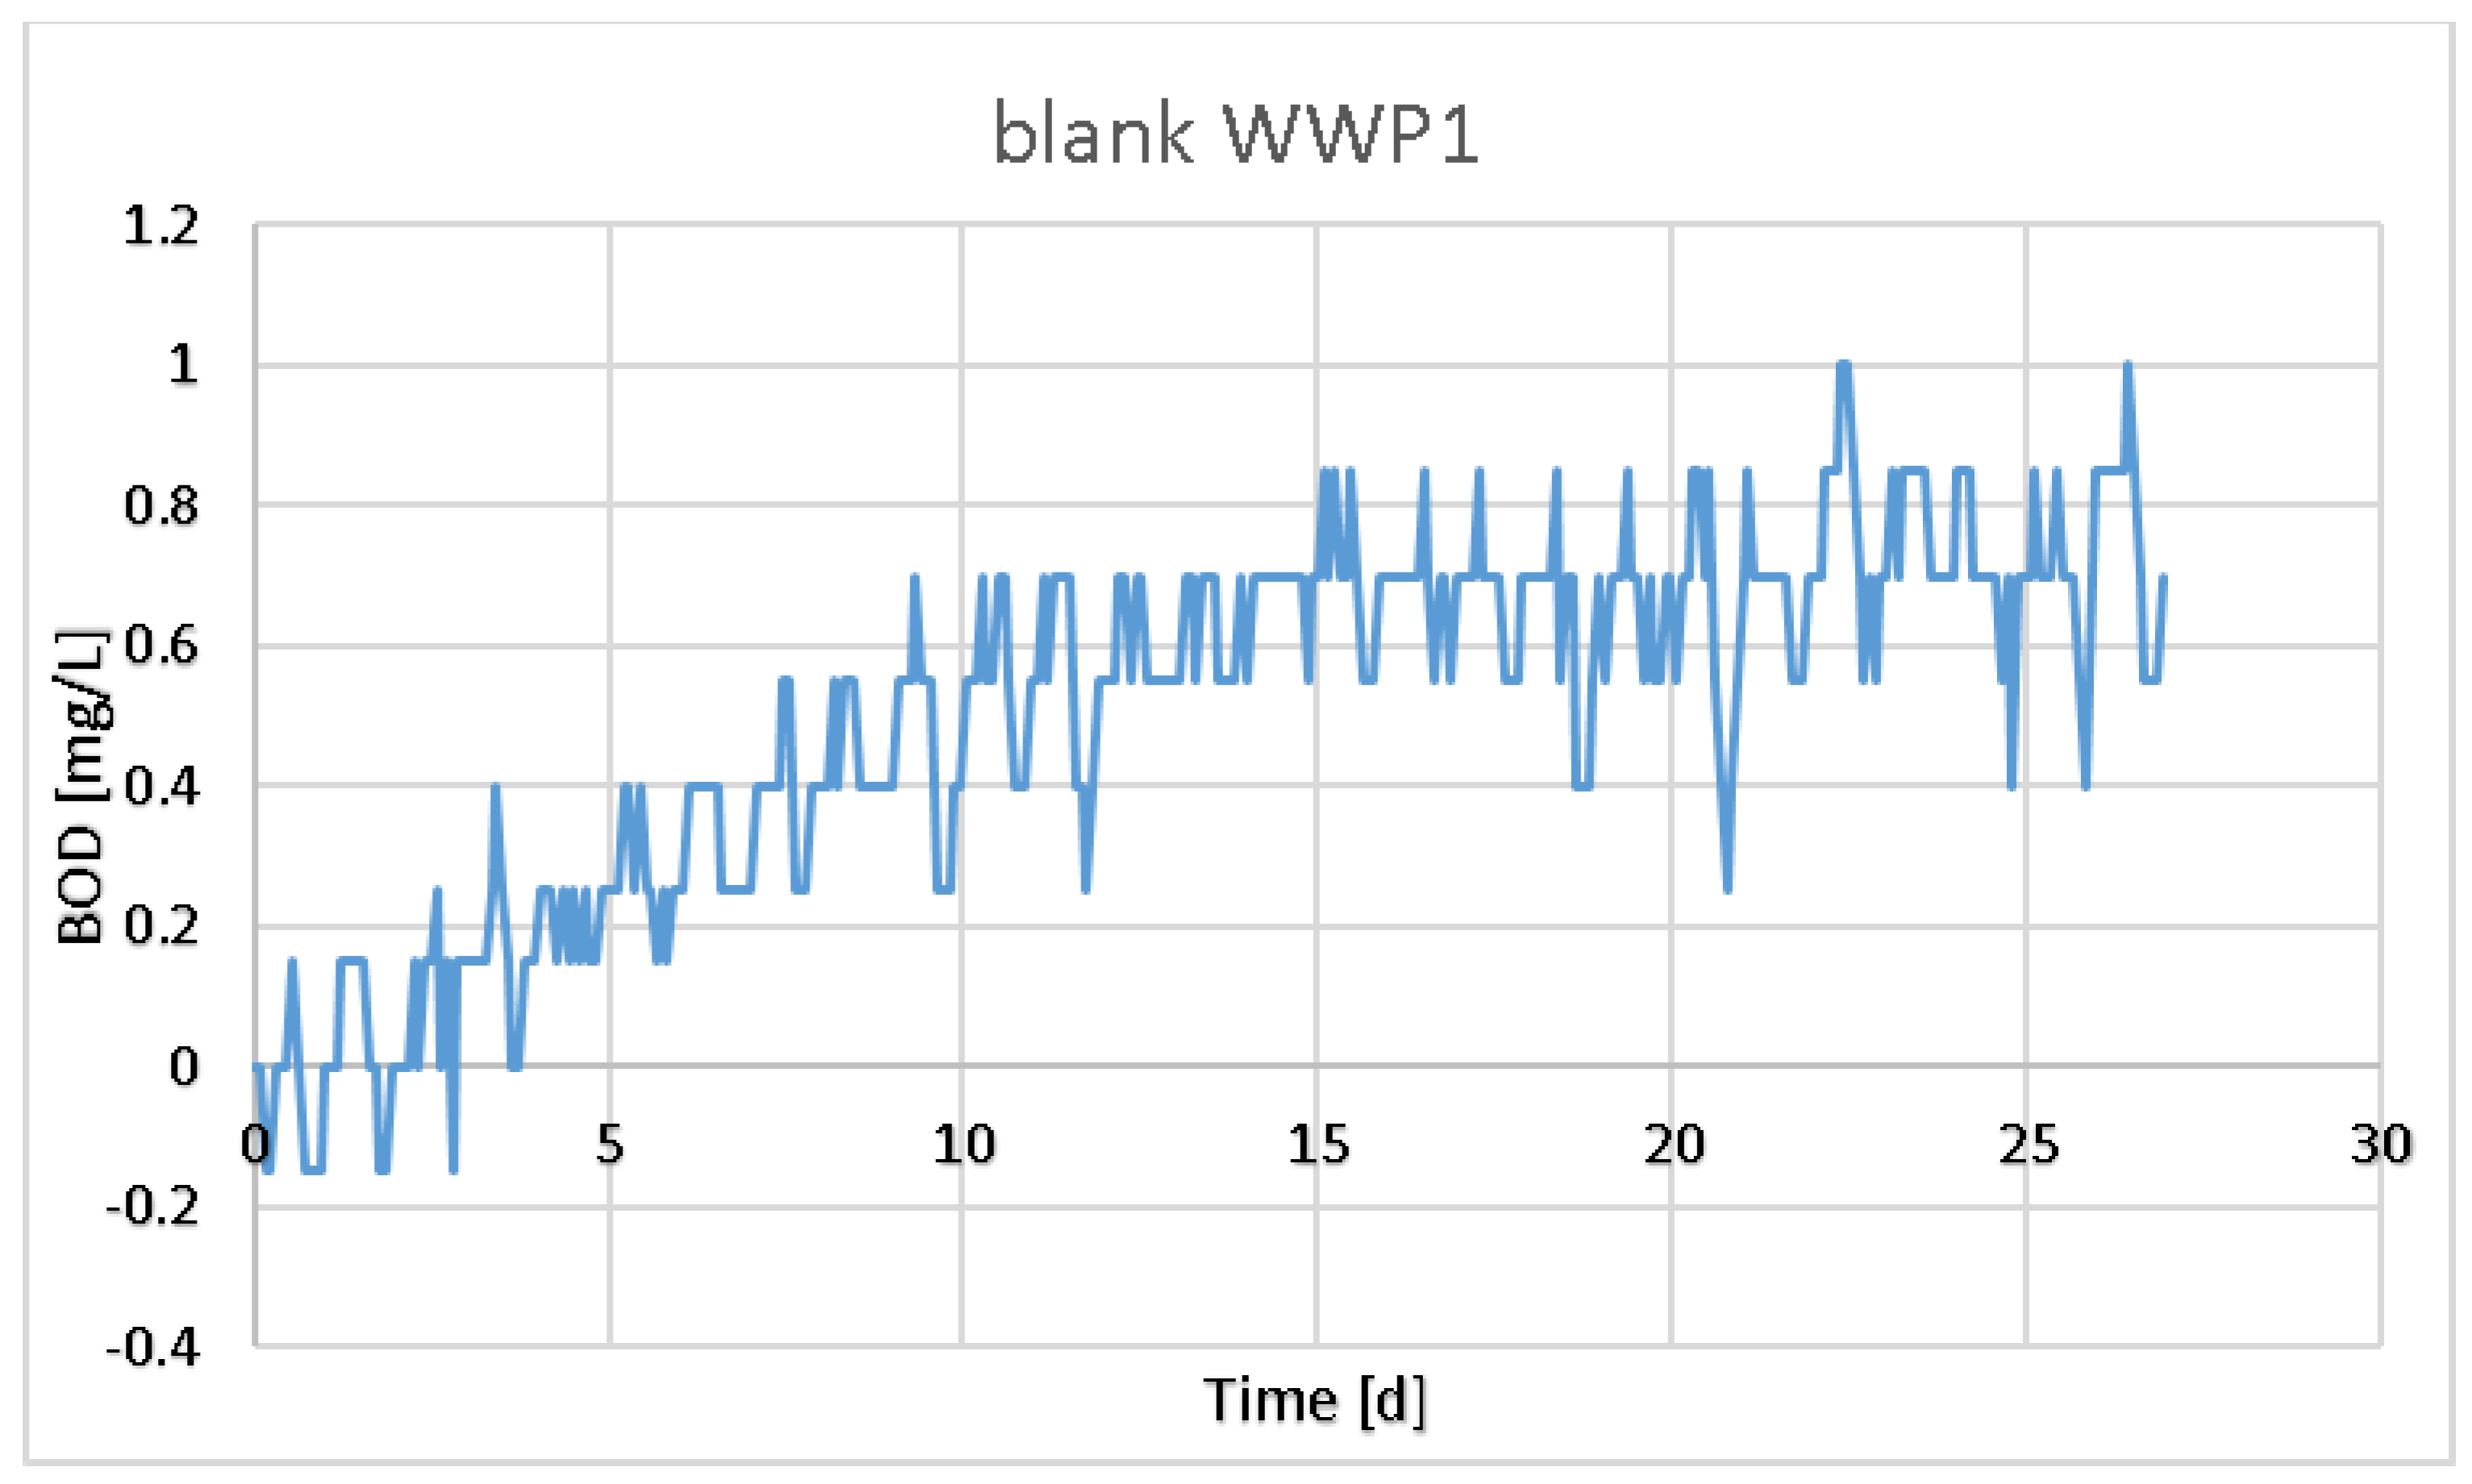
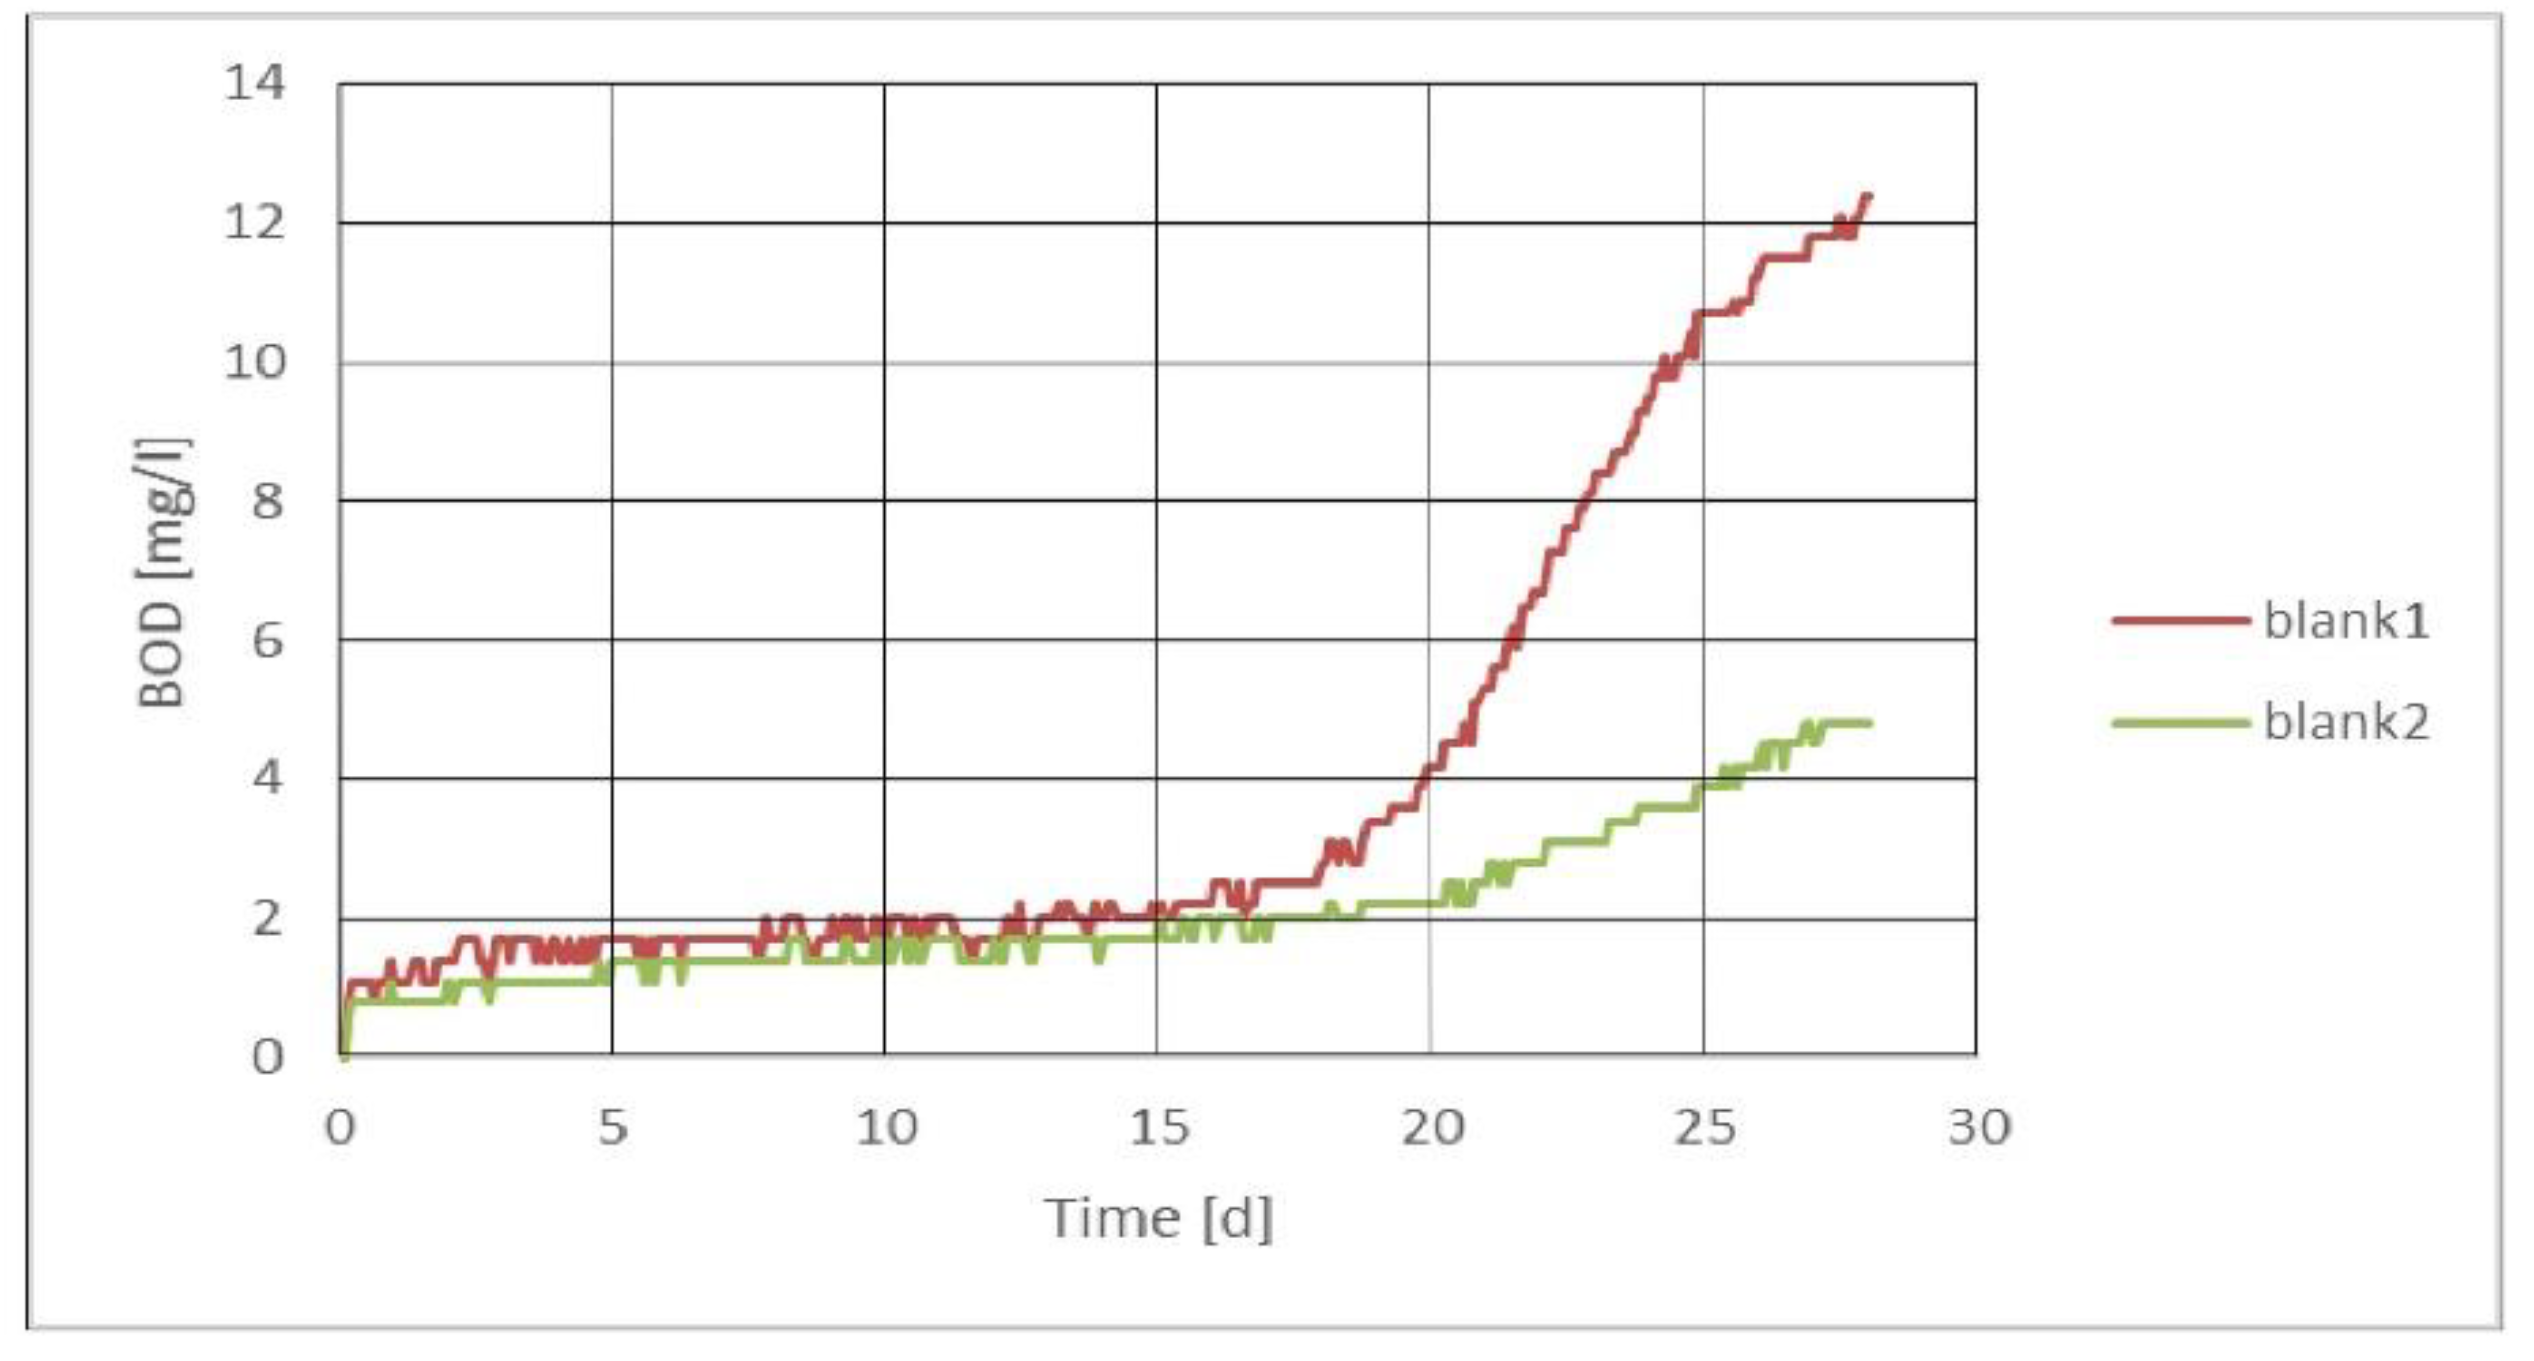
In general, the blank values of the WWP1 sample were slightly lower than the average over the years (Figure 3). All the measurements used a bacterial source from municipal wastewater, which has been used as a bacterial transfer for more than 15 years [20,21]. Municipal wastewater used as an inoculum is always filtered through at least 7 μm of porous filter paper. However, it has been suggested in previous studies that pretreatments can adversely affect bacterial graft function [22]. Nevertheless, it can be seen from Figure 4 that biodegradable material, albeit slowly degradable, remained in the bacterial graft. As can be seen from Figure 3 and Figure 4, the wastewater used as an inoculum resulted in significantly different graphs—one was made for the WWP1 sample (Figure 3) and the other for WWP2 (Figure 4).
Figure 4, on the other hand, shows a very different curve, from which it can be concluded that the blank sample did not provide a “correct” result. This same behavior was not observed in the sample itself at low dilutions, to which this inoculum was added. If this value was subtracted from the sample result, it would be too low for the biodegradability of the sample. The cause of this behavior is likely to have been the slowly decomposing solids remaining after filtration. As can be seen from Figure 4, when the BOD7 was measured, the result was good, but the BOD28 was no longer reliable. In the measurement, a blank sample was prepared separately for manometric measurement, but the same blank was also prepared for electrode measurement and titration. Results from the titration and electrode measurements provided very similar values as those for the blank with the WWP1 sample. Again, the titration had a higher value than the electrodes, and the manometric method provided the same result as that obtained with titration. When measuring biodegradation values with the closed-bottle method, it may sometimes be difficult to detect the strange behavior of the blank because the whole BOD curve cannot be seen. This is not the case with manometric measurements, as it is immediately clear from the curve when the blank is not working properly.
4. Discussion
Heterophilic metabolism, which involves aerobic biodegradation, generates ATP for cellular energy needs, and organic compounds are oxidized in the reactions. This degradation process results in the formation of simpler organic compounds that the bacterial cell needs for biosynthetic or assimilation reactions. The compounds continue to biodegrade to form carbon dioxide and water upon completion of the biodegradation reaction [23]. Bacteria are very selective in relation to biodegradable material. For each chemical reaction, an individual enzyme functions as a catalyst in the organic world. Enzymes have high specificity because they are able to distinguish slightly different substrate molecules [24].
The WWP1 sample did not contain nonbiodegradable components, since its pollutants were 100% biodegradable at high dilutions. A nonbiodegradable compound does not degrade under any circumstances. The difference between toxic and inhibitive substances is not well known. Loftus [7] stated that with toxic samples, the right value is the highest value. The terms “inhibitive” and “toxic” are both used in the literature. This indicates that the toxic sample would also be biodegradable at high dilutions [25].
Generally, industrial wastewater can be divided into two types, inorganic and organic, which contain many different pollutants. BOD5 can be measured only for organic waste. Factories manufacturing pharmaceuticals, cosmetics, organic dyes, adhesives, glues, soaps, synthetic detergents, pesticides, and herbicides generally have COD levels of around 5000–15,000 mg/L, and BOD5 levels are estimated to be 1500–4500 mg/L; the BOD5:COD ratio is lower than 30% [26]. This means that either the toxicity is too high or these wastewaters contain nonbiodegradable components. Staining emissions, including those from re-tanning, have an average BOD5 of 4200 ± 70 mg/L and COD of 71,040 ± 40 mg/L. Lower values of BOD 700 ± 10 mg/L and COD 4200 ± 10.5 mg/L are characteristic of descaling waste and tanning plants [27]. Textile mill effluents typically contain 145–236 mg/L BOD5 [28]. Cellulose and paper manufacturing plants have black wastewaters wherein the BOD is 700 mg/L and white wastewaters with a BOD of 350 mg/L [29]. The wastewater from factories in the oil refining industry has a BOD of 150–250 mg/L [30]. Brewery and fermentation factories have a BOD of 1200–3600 mg/L [31]. Brewery wastewater shows a COD of 1500–5000 mgO2/L and a BOD5 of 1000–3000 mg/L [30]. Batik wastewater contains both coloring and wax removal wastewater, wherein the BOD5 values are 261.25 mg/L and 8126 mg/L, respectively [32]. The BOD is 3300 mg/L and 500 mg/L in the case of leather effluents and textile effluents, respectively. The COD values of leather effluents are very high (2100–3400 mg/L) when compared to textile effluents (1050–1300 mg/L) [33].
Biodegradability tests use wastewater or sludge as an inoculum source that biodegrades various compounds [12]. Wastewater used as inocula naturally contains bacteria that can degrade a sample more easily than added bacteria because they are adapted to the compounds in the sample [34]. Domestic wastewater as a source of inoculum has an average BOD7 value of 207 mg(O2)/L. The calculated BOD value for the inoculum was about 1 mg (O2)/L after an addition of 5 mL/L. However, the BOD should always be measured separately if there are seasonal variations in the wastewater used as an inoculum [35]. If undiluted samples are examined, no inoculum is added to the sample solution and no blank sample is required [5]. By adding bacteria, the aim is to create the most favorable conditions for the comparison of results among different laboratories. The blank sample contains everything (mineral solution and inoculum) but the sample itself [5,8,9,10,11]. The use of inoculation is a good way in general to promote the biodegradation reaction, although its behavior in wastewater may be quite different depending on the wastewater in question, especially if it is inhibitory or toxic. Pretreatments of inocula have been studied, and the natural variation between different environments and variation due to differential selection of bacterial communities (by different pretreatment methods) have been offered as explanations for the historical high variability in standard OECD-ready biodegradability tests [22]. In studies on the use of activated sludge as a bacterial inoculum, it has been found that BOD experiments inoculated with fresh activated sludge better describe the diversity of bacteria in water than inocula adapted to a particular substance [35]. Furthermore, toxic compounds in wastewater also prevent the biodegradation of added samples, such as glucose [36]. If the inhibitory compounds are diluted, they will be biodegradable, but the Finnish Waste Act prohibits the dilution of waste [37,38]. For this reason, such wastewater is treated separately and not discharged into the sewer system.
There was little variation in the blank samples in this study. Titration provided a slightly higher result than the calculated value and an electrochemical value that was slightly too low. Both titration and electrode measurements used the same blank, which was first measured with an electrode and then by titration. Nevertheless, the differences among the measurements were large. The blank value (WWP1) obtained manometrically in this measurement was closest to the theoretical value. A blank was prepared separately for the manometric measurement, but it was inoculated with the same wastewater.
We can note that the correct BOD value for effluent containing inhibitory substances should be measured without dilution. The BOD values for diluted samples showed that WWP1 and WWP2 were biodegradable when dilution was sufficiently high. These samples provided different results from the closed-bottle versus the manometric methods.
When increasing the dilution coefficient, at some point the BOD value no longer increases as a function of dilution, and the maximum value for biodegradable organic material can be detected from this value. The sample’s own bacteria also participate in the degradation activity and in competition for nutrients. When deducing a blank value, it should be remembered that the functional bacteria may be quite different in blank samples than in actual ones, especially when the water is inhibitive. The inhibitory compounds interfere with the function of the added bacteria. In the closed-bottle method, only the start and end points are obtained, so the shape of the curve cannot be seen, and one can then subtract an incorrect blank value. The iodometric titration method does not work in all wastewaters.
The main differences between the undiluted and diluted samples were the effects of inhibition on the result and the activity of different bacteria, and the fact that inhibition decreased as the samples were diluted. And as a result, both samples were completely biodegradable when diluted after a measurement period of 28 days with the manometric method. WWP1 biodegraded by only 75% with titration, and WWP2 did so by about 91–100% with titration. The preliminary data did not take into account water formation, which can cause results that are too high. Only the amount of organic carbon was used to calculate the biodegradation degree of the samples. The other difference between the nondiluted samples and the diluted ones was that no bacteria were added to the nondiluted ones, in which case the samples were only broken down by their own bacteria. It was very difficult to find a sample that was sterile, and for this reason, biodegradability also occurred in inhibitory wastewater.
Author Contributions
Conceptualization: H.P., and U.L.; methodology: H.P.; validation: H.P., A.H., and J.P.; formal analysis: H.P., and A.H.; investigation: H.P., A.H., and J.P.; resources: U.L., and T.K.; data curation: H.P.; writing (original draft preparation): H.P.; writing (review and editing): U.L., A.H., J.P., and T.K.; visualization: H.P.; supervision: U.L., and T.K.; project administration: U.L.; funding acquisition: T.K. All authors have read and agreed to the published version of the manuscript.
Funding
This research received no external funding.
Institutional Review Board Statement
Not applicable.
Informed Consent Statement
Not applicable.
Data Availability Statement
The data presented in this study are available within the article (tables and figures). The data are available on request from the corresponding author.
Conflicts of Interest
The authors declare no conflict of interest.
References
- Grady, C.P.L.; Daigger, G.T.; Love, N.; Filipe, C.D.M. Biological Wastewater Treatment, 3rd ed.; Taylor and Francis Group: Abingdon, UK, 2011. [Google Scholar] [CrossRef]
- Mittal, A. Biological Wastewater Treatment. Water Today. August 2011, pp. 32–44. Available online: https://www.watertoday.org/Article%20Archieve/Aquatech%2012.pdf (accessed on 30 October 2021).
- Cetecioglu, Z.; Atasoy, M. Biodegradation and inhibitory effects of antibiotics on biological wastewater treatment systems. In Toxicity and Biodegradation Testing. Methods in Pharmacology and Toxicology; Bidoia, E., Montagnolli, R., Eds.; Humana Press: New York, NY, USA, 2018. [Google Scholar] [CrossRef]
- Kumar, A.; Chandra, R. Biodegradation and toxicity reduction of pulp paper mill wastewater by isolated laccase producing Bacillus cereus AKRC03. Clean. Eng. Technol. 2021, 4, 100193. [Google Scholar] [CrossRef]
- EN 1899-2:1998; Water Quality. Determination of Biochemical Oxygen Demand after n Days (BODn). Part 2: Method for Undiluted Samples. European Committee for Standardization, Central Secretariat: Rue de Stassart, 36 B-1050 Brussels. ISO: Geneva, Switzerland, 1998.
- Lepik, R.; Tenno, T. Determination of biodegradability of phenolic compounds, characteristic to wastewater of the oil-shale chemical industry, on activated sludge by oxygen uptake measurement. Environ. Technol. 2012, 33, 329–339. [Google Scholar] [CrossRef] [PubMed]
- Loftus, T. BOD Techniques (3rd of 3 BOD Articles). Available online: https://polyseed.com/wp-content/uploads/2020/06/bodtech.pdf (accessed on 21 November 2021).
- OECD. OECD Guideline for Testing of Chemicals, 301 F: Manometric Respirometric; OECD: Paris, France, 1992. [Google Scholar]
- EN 1899-1:1998; Water Quality. Determination of Biochemical Oxygen Demand after n Days (BODn). Part 1: Dilution and Seeding Method with Allylthiourea Addition. European Commmittee for Standardization, Central Secretariat: Rue de Stassart, 36 B-1050 Brussels. ISO: Geneva, Switzerland, 1998.
- EN 25813:1992; Water Quality. Determination of Dissolved Oxygen. Iodometric Method. European Commmittee for Standardization, Central Secretariat: Rue de Stassart, 36 B-1050 Brussels. ISO: Geneva, Switzerland, 1993.
- EN 25814:1992; Water Quality. Determination of Dissolved Oxygen. Electrochemical Probe Method. European Commmittee for Standardization, Central Secretariat: Rue de Stassart, 36 B-1050 Brussels. ISO: Geneva, Switzerland, 1993.
- Klein, K.; Kattel, E.; Goi, A.; Kivi, A.; Dulova, N.; Saluste., A.; Zekker., I.; Trapido., M.; Tenno., T. Combined treatment of pyrogenic wastewater from oil shale retorting. Oil Shale 2017, 34, 82–96. Available online: https://doi.org/10.3176/oil.2017.1.06 (accessed on 29 January 2022). [CrossRef] [Green Version]
- Matikka, V.; Veijalainen, A.-M.; Vilpas, R. Haja-Asutuksen Jätevesien Niukkaresurssiset Käsittelykonseptit, Loppuraportti, Savonia. Available online: http://portal.savonia.fi/pdf/julkaisutoiminta/MASU_raportti.pdf (accessed on 1 January 2022).
- King, W. Winkler Titrations—Measuring Dissolved Oxygen. Available online: https://web.colby.edu/colbyatsea/2011/02/11/winkler-titrations-measuring-dissolved-oxygen/ (accessed on 25 October 2021).
- Prokkola, H.; Kuokkanen, T.; Lassi, U. Material-efficient utilization of waste oils—Biodegradability and other chemical properties of vegetable recycling oils. Green Sustain. Chem. 2012, 2, 133–140. [Google Scholar] [CrossRef] [Green Version]
- Prokkola, H.; Kuokkanen, T.; Vähäoja, P.; Lassi, U.; Rämö, J. Characterization and biodegradation rates of tall oil soaps in different water and soil environments. Water Air Soil Pollut. 2014, 225, 11. [Google Scholar] [CrossRef]
- EN 14111; Fat and Oil Derivatives—Fatty Acid Methyl Esters (FAME)—Determination of Iodine Value. European Commmittee For Standardization, Central Secretariat: Rue de Stassart, 36 B-1050 Brussels. ISO: Geneva, Switzerland, 2003. Available online: https://shop.bsigroup.com/products/fat-and-oil-derivatives-fatty-acid-methyl-esters-fame-determination-of-iodine-value/standard (accessed on 25 October 2021).
- Cyprowski, M.; Stobnicka-Kupiec, A.; Ławniczek-Wałczyk, A.; Bakal-Kijek, A.; Gołofit-Szymczak, M.; Górny, R.L. Anaerobic bacteria in wastewater treatment plant. Int. Arch. Occup. Environ. Health 2018, 91, 571–579. [Google Scholar] [CrossRef] [PubMed] [Green Version]
- Peu, P.; Sassi, J.-F.; Girault, R.; Picard, S.; Saint-Cast, P.; Béline, F.; Dabert, D. Sulphur fate and anaerobic biodegradation potential during co-digestion of seaweed biomass (Ulva sp.) with pig slurry. Bioresour. Technol. 2011, 102, 10794–10802. [Google Scholar] [CrossRef] [PubMed]
- Vähäoja, P.; Roppola, K.; Välimäki, I.; Kuokkanen, T. Studies of biodegradability of certain oils in forest soil as determined by the respirometric BOD OxiTop method. Int. J. Environ. Anal. Chem. 2005, 85, 1065–1073. [Google Scholar] [CrossRef]
- Kuokkanen, T.; Vähäoja, P.; Välimäki, I.; Lauhanen, R. Suitability of the respirometric BOD Oxitop method for determining the biodegradability of oils in ground water using forestry hydraulic oils as model compounds. Int. J. Environ. Anal. Chem. 2004, 84, 677–689. [Google Scholar] [CrossRef]
- Goodhead, A.K.; Head, I.M.; Jason, R.; Snape, J.R.; Davenport, R.J. Standard inocula preparations reduce the bacterial diversity and reliability of regulatory biodegradation tests. Environ. Sci. Pollut. Res. 2014, 21, 9511–9521. [Google Scholar] [CrossRef] [PubMed] [Green Version]
- Jurtshuk, P., Jr. Bacterial metabolism. In Medical Microbiology, 4th ed.; Baron, S., Ed.; University of Texas Medical Branch: Galveston, TX, USA, 1996; Chapter 4. Available online: https://www.ncbi.nlm.nih.gov/books/NBK7919/ (accessed on 29 December 2021).
- Quax, W.J. Bacterial enzymes. In The Prokaryotes: An Evolving Electronic Resource for the Microbiological Community; Springer: Berlin/Heidelberg, Germany, 2013; pp. 193–211. [Google Scholar] [CrossRef]
- Young, L.Y.; Häggblom, M.M. Biodegradation of toxic and environmental pollutants. Curr. Opin. Biotechnol. 1991, 2, 429–435. [Google Scholar] [CrossRef]
- Hanchang, S.H.I. Industrial Wastewater Types, Amounts, and Effects, Point Sources of Pollution: Local Effects and It’s Control—Vol. I. Industrial Wastewater-Types, Amounts and Effects. Available online: https://www.eolss.net/sample-chapters/c09/e4-11-02-02.pdf (accessed on 24 October 2021).
- Chowdhury, M.; Mostafa, M.G.; Biswas, T.K.; Mandal, A.; Saha, A.K. Characterization of the effluents from leather processing industries. Environ. Process 2015, 2, 173–187. [Google Scholar] [CrossRef] [Green Version]
- Aslam, M.M.; Baig, M.A.; Hassan, I.; Qazi, I.A.; Malik, M.; Saeed, H. Textile wastewater characterization and reduction of its COD & BOD by oxidation. Electron. J. Environ. Agric. Food Chem. 2004, 3, 804–811. [Google Scholar]
- Goletić, Š.A.; Avdić, N. The cellulose and paper industry wastewater treatment. Glas. Hem. Tehnol. Bosne Herceg. 2012, 39, 45–50. [Google Scholar]
- Lenntech. Available online: https://www.lenntech.com/petrochemical.htm (accessed on 12 October 2021).
- Simate, G.S.; Cluett, J.; Iyuke, S.E.; Musapatika, E.T.; Ndlovu, S.; Walubita, L.F.; Alvarez, A.E. The treatment of brewery wastewater for reuse: State of the art. Desalination 2011, 273, 235–247. [Google Scholar] [CrossRef]
- Tangahu, B.V.; Putri, A.P. The degradation of BOD and COD the batik industry wastewater using Egeria densa and Salvinia molesta. J. Sains Teknol. Lingkung. 2017, 9, 82–91. Available online: https://media.neliti.com/media/publications/139797-EN-the-degradation-of-bod-and-cod-of-batik.pdf (accessed on 29 December 2021). [CrossRef]
- Hasan, M.; Alam, M.; Haque, M.; Moly, H.H.; Tanji, M. Impacts of textile and leather effluent on environment: An assessment through life cycle of fishes and plants. J. Text Eng. Fash Technol. 2021, 7, 3. [Google Scholar] [CrossRef]
- Vázquez-Rodríguez, G.A.; Beltrán-Hernández, R.I.; Coronel-Olivares, C.; Rols, J.-L. Standardization of activated sludge for biodegradation tests. Anal. Bioanal. Chem. 2011, 401, 1127–1137. [Google Scholar] [CrossRef] [PubMed] [Green Version]
- Oulu Waterworks. Annual Report. 2020. Available online: https://www.oulunvesi.fi/documents/399509/1456592/oulun_vesi_toimintakertomus_2020_sa.pdf/6192e648-aa82-4fb1-9183-d12d9ac13724 (accessed on 20 January 2022).
- Zeng, G.; Fu, H.; Zhong, H.; Yuan, X.; Fu, M.; Wang, W.; Huang, G. Co-degradation with glucose of four surfactants, CTAB, Triton X-100, SDS and rhamnolipid, in liquid culture media and compost matrix. Biodegradation 2007, 18, 303–310. [Google Scholar] [CrossRef] [PubMed]
- Lilja, R.; Mikkola, I. Teollisuusjätevesiä Koskevan Lupasääntelyn Keventämismahdollisuudet; Ekoleima: Otava, Finland, 2017; Available online: https://ym.fi/documents/1410903/38439968/Teollisuusjatevesia-koskevan-saantelyn-keventaminen-0F3C0521_6D04_4D5C_A50C_6AABDF86FC23-142771.pdf/83aca9a8-73cf-11cd-0bb5-4a7a47c2f7e5/Teollisuusjatevesia-koskevan-saantelyn-keventaminen-0F3C0521_6D04_4D5C_A50C_6AABDF86FC23-142771.pdf?t=1603261097230 (accessed on 29 January 2022).
- Waste Act (646/2011; Amendments Up to 528/2014 Included) Section 17. Available online: https://www.finlex.fi/fi/laki/kaannokset/2011/en20110646_20140528.pdf (accessed on 20 September 2021).
Figure 1.
BOD value of the raw WWP1 sample measured with BOD OxiTop for 28 days.

Figure 2.
Graph of an undiluted sample with one replicate of WWP2 measured with BOD OxiTop for 28 days.
Figure 2.
Graph of an undiluted sample with one replicate of WWP2 measured with BOD OxiTop for 28 days.

Figure 3.
BOD graph of the blank sample prepared for WWP1.

Figure 4.
BOD graph of the blank sample prepared for WWP2.


Table 1.
The TOC, ThOD, and pH values of the WWP1 and WWP2 samples.
| Sample | TOC | ThOD | pH |
|---|---|---|---|
| WWP1 | 34000 mg(C) L−1 ± 1160 mg/L * | 90670 mg(O2) L−1 | 6.60 ± 0.06 * |
| WWP2 | 30 mg(C) L−1 ± 1.44 mg/L * | 80 mg(O2) L−1 | 8.10 ± 0.06 * |
* Measurements were repeated several times.
Table 2.
The sample, dilution factor, and BOD values and the calculated degrees of biodegradation of the WWP1 sample measured with titration and electrochemical probe.
Table 2.
The sample, dilution factor, and BOD values and the calculated degrees of biodegradation of the WWP1 sample measured with titration and electrochemical probe.
| Sample | Dilution Factor | Time (d) | Titrated BOD (mg L−1) | El. Chem. BOD (mg L−1) | El. Chem. Biodegradation Degree (%) |
|---|---|---|---|---|---|
| WWP1 | Blank | 7 | 1.6 | 0.2 | |
| Raw | --- | 6.9 | 0 | ||
| 1:5 | --- | 11 | 0.01 | ||
| 1:10 | --- | 9.2 | 0.01 | ||
| 1:50 | 0 | 0 | --- | ||
| 1:100 | 0 | 40.2 | 0.04 | ||
| 1:500 | --- | 3125 | 3.4 | ||
| 1:1000 | --- | 7230 | 8 | ||
| 1:5000 | --- | 33,650 | 37 | ||
| 1:10,000 | 42,760 | 46,000 | 51 | ||
| WWP1 | Blank | 28 | 2.0 | 0.3 | |
| Raw | --- | 7.6 | 0.008 | ||
| 1:5 | --- | 36.3 | 0.04 | ||
| 1:10 | --- | 39.4 | 0.04 | ||
| 1:50 | 0 | 320 | 0.4 | ||
| 1:100 | --- | 820 | 0.9 | ||
| 1:500 | --- | 3900 | 4 | ||
| 1:1000 | --- | 7490 | 8 | ||
| 1:5000 | --- | 36,750 | 40 | ||
| 1:10,000 | --- | 68,100 | 75 |
Table 3.
The sample, dilution factor, and BOD values and the calculated degrees of biodegradation of the WWP1 sample measured with the manometric respirometry method.
Table 3.
The sample, dilution factor, and BOD values and the calculated degrees of biodegradation of the WWP1 sample measured with the manometric respirometry method.
| Sample | Dilution Factor | Time (d) | Manometric Respirometry BOD (mg L−1) | Manometric Respirometry Biodegradation Degree (%) |
|---|---|---|---|---|
| WWP1 | Blank | 7 | 0.7 ± 0.5 | |
| Raw | negative | --- | ||
| 1:5 | 0 | 0 | ||
| 1:10 | 0 | 0 | ||
| 1:50 | 23 ± 12.5 | 0.03 | ||
| 1:100 | 470 ± 355 | 0.54 | ||
| 1:500 | 21,400 ± 21,500 | 25 | ||
| 1:1000 | 44,200 ± 2100 | 51 | ||
| 1:5000 | 12800 | 15 | ||
| 1:10,000 | 96,000 ± 14,500 | >100 | ||
| WWP1 | Blank | 28 | 0.7 ± 0.2 | |
| Raw | 0 | --- | ||
| 1:5 | 0 | 0 | ||
| 1:10 | 0 | 0 | ||
| 1:50 | 60 ± 12.5 | 0.08 | ||
| 1:100 | 26,500 ± 2050 | 30 | ||
| 1:500 | 36,400 ± 32,125 | 42 | ||
| 1:1000 | 64,800 ± 8.7 | 74 | ||
| 1:5000 | 77,500 ± 2100 | 89 | ||
| 1:10,000 | 107,500 ± 0 | >100 |
Table 4.
The sample, dilution factor, and BOD values and the calculated biodegradation degrees of the WWP2 sample measured with titration and electrochemical probe.
Table 4.
The sample, dilution factor, and BOD values and the calculated biodegradation degrees of the WWP2 sample measured with titration and electrochemical probe.
| Sample | Dilution | Time (d) | Titrated BOD (mg L−1) | El. Chem. BOD (mg L−1) | El. Chem. Biodegradation Degree (%) |
|---|---|---|---|---|---|
| WWP2 | Blank | 7 | 1.6 ± 0.8 | 0.2 | |
| Raw | 1.3 ± 0.04 | 0.1 | 0.1 | ||
| 1:2 | 12.0 ± 2.5 | 14 | 18 | ||
| 1:5 | 22 ± 3.9 | 31 | 39 | ||
| 1:10 | 34 ± 1.9 | 47 | 59 | ||
| 1:50 | 98 ± 2 | 105 | >100 | ||
| 1:100 | 0 | 0 | - | ||
| 1:200 | 0 | 92 | >100 | ||
| WWP2 | Blank | 28 | 2.0 | 0.3 | |
| Raw | 5.2 | 4.3 | 5 | ||
| 1:2 | 11 ± 1.5 | 15 | 19 | ||
| 1:5 | 14 ± 0 | 35 | 44 | ||
| 1:10 | --- | 73 | 91 | ||
| 1:50 | 126 | 123 | >100 | ||
| 1:100 | 460 | 76 | 95 | ||
| 1:200 | 0 | 72 | 90 |
Table 5.
The sample, dilution factor, and BOD values and the calculated biodegradation degrees of the WWP2 sample measured with the manometric respirometric method.
Table 5.
The sample, dilution factor, and BOD values and the calculated biodegradation degrees of the WWP2 sample measured with the manometric respirometric method.
| Sample | Dilution Factor | Time (d) | Manometric Respirometry BOD (mg L−1) | Manometric Respirometry Biodegradation Degree (%) |
|---|---|---|---|---|
| WWP2 | Blank | 7 | 1.6 ± 0.15 | |
| Raw | 9.2 ± 0.55 | 12 | ||
| 1:2 | 9.4 ± 1.1 | 12 | ||
| 1:5 | 17 ± 1.25 | 21 | ||
| 1:10 | 17 ± 0 | 21 | ||
| 1:50 | 0 | - | ||
| 1:100 | 30 ± 0 | 38 | ||
| 1:200 | Negative | |||
| WWP2 | Blank | 28 | 8.6 ± 3.8 | |
| Raw | 30 ± 3.7 | 26 | ||
| 1:2 | 41 ± 12 | 51 | ||
| 1:5 | 66 ± 4.25 | 82 | ||
| 1:10 | 140 ± 30 | >100 | ||
| 1:50 | 340 ± 50 | >100 | ||
| 1:100 | 370 ± 20 | >100 | ||
| 1:200 | Negative | - |
Publisher’s Note: MDPI stays neutral with regard to jurisdictional claims in published maps and institutional affiliations. |
© 2022 by the authors. Licensee MDPI, Basel, Switzerland. This article is an open access article distributed under the terms and conditions of the Creative Commons Attribution (CC BY) license (https://creativecommons.org/licenses/by/4.0/).
Share and Cite
MDPI and ACS Style
Prokkola, H.; Heponiemi, A.; Pesonen, J.; Kuokkanen, T.; Lassi, U. Reliability of Biodegradation Measurements for Inhibitive Industrial Wastewaters. ChemEngineering 2022, 6, 15. https://doi.org/10.3390/chemengineering6010015
AMA Style
Prokkola H, Heponiemi A, Pesonen J, Kuokkanen T, Lassi U. Reliability of Biodegradation Measurements for Inhibitive Industrial Wastewaters. ChemEngineering. 2022; 6(1):15. https://doi.org/10.3390/chemengineering6010015
Chicago/Turabian StyleProkkola, Hanna, Anne Heponiemi, Janne Pesonen, Toivo Kuokkanen, and Ulla Lassi. 2022. "Reliability of Biodegradation Measurements for Inhibitive Industrial Wastewaters" ChemEngineering 6, no. 1: 15. https://doi.org/10.3390/chemengineering6010015