Adaptive Grain Yield Patterns of Triticale (×Triticosecale Wittmack) Cultivars in Six Regions of Poland


1
Department of Biometry, Warsaw University of Life Sciences—SGGW, Nowoursynowska 166, 02-787 Warsaw, Poland
2
Research Center for Cultivar Testing (COBORU), 63-022 Słupia Wielka, Poland
*
Author to whom correspondence should be addressed.
Agronomy 2020, 10(3), 415; https://doi.org/10.3390/agronomy10030415
Submission received: 23 February 2020
/
Revised: 16 March 2020
/
Accepted: 18 March 2020
/
Published: 19 March 2020
(This article belongs to the Special Issue Analysis and Modelling of Genotype by Environment Interactions in Field Crops)
Abstract
:The recommendation of cultivars for a larger number of locations relies on similar agricultural environment or similar crop yield obtained in these locations. There are many studies on the impact of environmental conditions on the yield of cultivars of agricultural crops and recommendation for their cultivation. However, there is little research on triticale in comparison to other cereals. We presented the influence of the cultivar, location nested in region, year, and their interactions on triticale grain yield separately for two levels of crop management intensity. In this work, we checked compatibility in the rankings of cultivars between six regions and compatibility in the rankings of cultivars between locations belonging to the same region. The results indicated a large variation in the rankings of cultivars between locations in the regions, i.e., the ranking of cultivars in locations belonging to the same region was different. We observed low compatibility in rankings between locations for both crop management intensities. The low compatibility of cultivar rankings in trial locations also translates into low precision when determining regions. This means that the process of recommending cultivars to environments should be constantly checked and improved. In addition, using GGE biplot and measure of yield superiority (Pi) we presented an adaptive response of 12 cultivars in six regions at two levels of crop management intensity and their stability during five growing seasons.
1. Introduction
Triticale (Triticosecale Wittmack) is a hybrid crop obtained by crossing wheat (Triticum ssp.) and rye (Secale cereale L.). The purpose was to produce cereal combining the beneficial qualities of the two starting species. Triticale is grown in worse soils than those for wheat and slightly better soils than those for rye. The quality of triticale grain, and thus its use, is much better than in case of rye. In certain types of marginal soils, triticale cultivars out-perform the best wheat cultivars [1]. Triticale is cultivated on a global scale with the main production areas in Central and Eastern Europe, where the largest producers are Poland, Germany, France, Belarus, and Russia [1]. The current global production quantity reaches about 17 million tons, of which 90% is produced in Europe [1]. Numerous genetic studies on triticale were carried out in Poland. Triticale is characterized by high yielding potential, good quality of grain for making food products for people and livestock, and robustness to biotic and abiotic stress [2,3]. Moreover, triticale is a plant which biomass can potentially be used in bioethanol production [4]. These advantages make triticale a competitive species in comparison to other cereals. Therefore, interest in triticale and possibilities of its use are increasing all over the world.
A suggested approach in cultivar recommendations is to assess the adaptability of cultivars within specific trial locations [5]. Data for the assessment of cultivar adaptive patterns can be obtained from multi-environmental trials (MET). An example of MET is Polish Post-registration Variety Testing System (PVTS). The main goal of the PVTS system is to recommend cultivars for cultivation by farmers. This goal is achieved by creating lists of cultivars recommended for cultivation in a given (predetermined) region. These lists are based on the annual results of experiments carried out in six regions throughout Poland. Thus, farmers can receive information about the cultivars recommended to the conditions in their region. It is important to provide farmers with information that is accurate and regards a sufficiently small scale to allow individual growers to choose the best cultivars for their needs and environmental conditions of their fields [6]. In this study, it was checked whether locations belonging to one region were properly selected to assess triticale grain yield.
There are numerous studies on adaptability assessment, e.g., for sorghum [7,8], for winter wheat [9,10] for durum wheat [11], for rye [12], or for maize. However, there is still a lack of similar research on triticale cultivars adaptive response and recommendation, and an explanation of the cultivar × environment interaction for triticale. In [13,14,15], the authors suggested that triticale had not been intensively studied in terms of its response to the environment or/and crop management. Therefore, we decided to raise this issue in the presented work. The objectives of this research were:
- assessing the compatibility of cultivars’ rankings between locations in each region and between the regions to evaluate precision in determining these regions;
- graphic visualization on the adaptive response of triticale cultivars to regions and determination of widely adapted cultivars through five growing seasons.
2. Materials and Methods
2.1. Trial Dataset
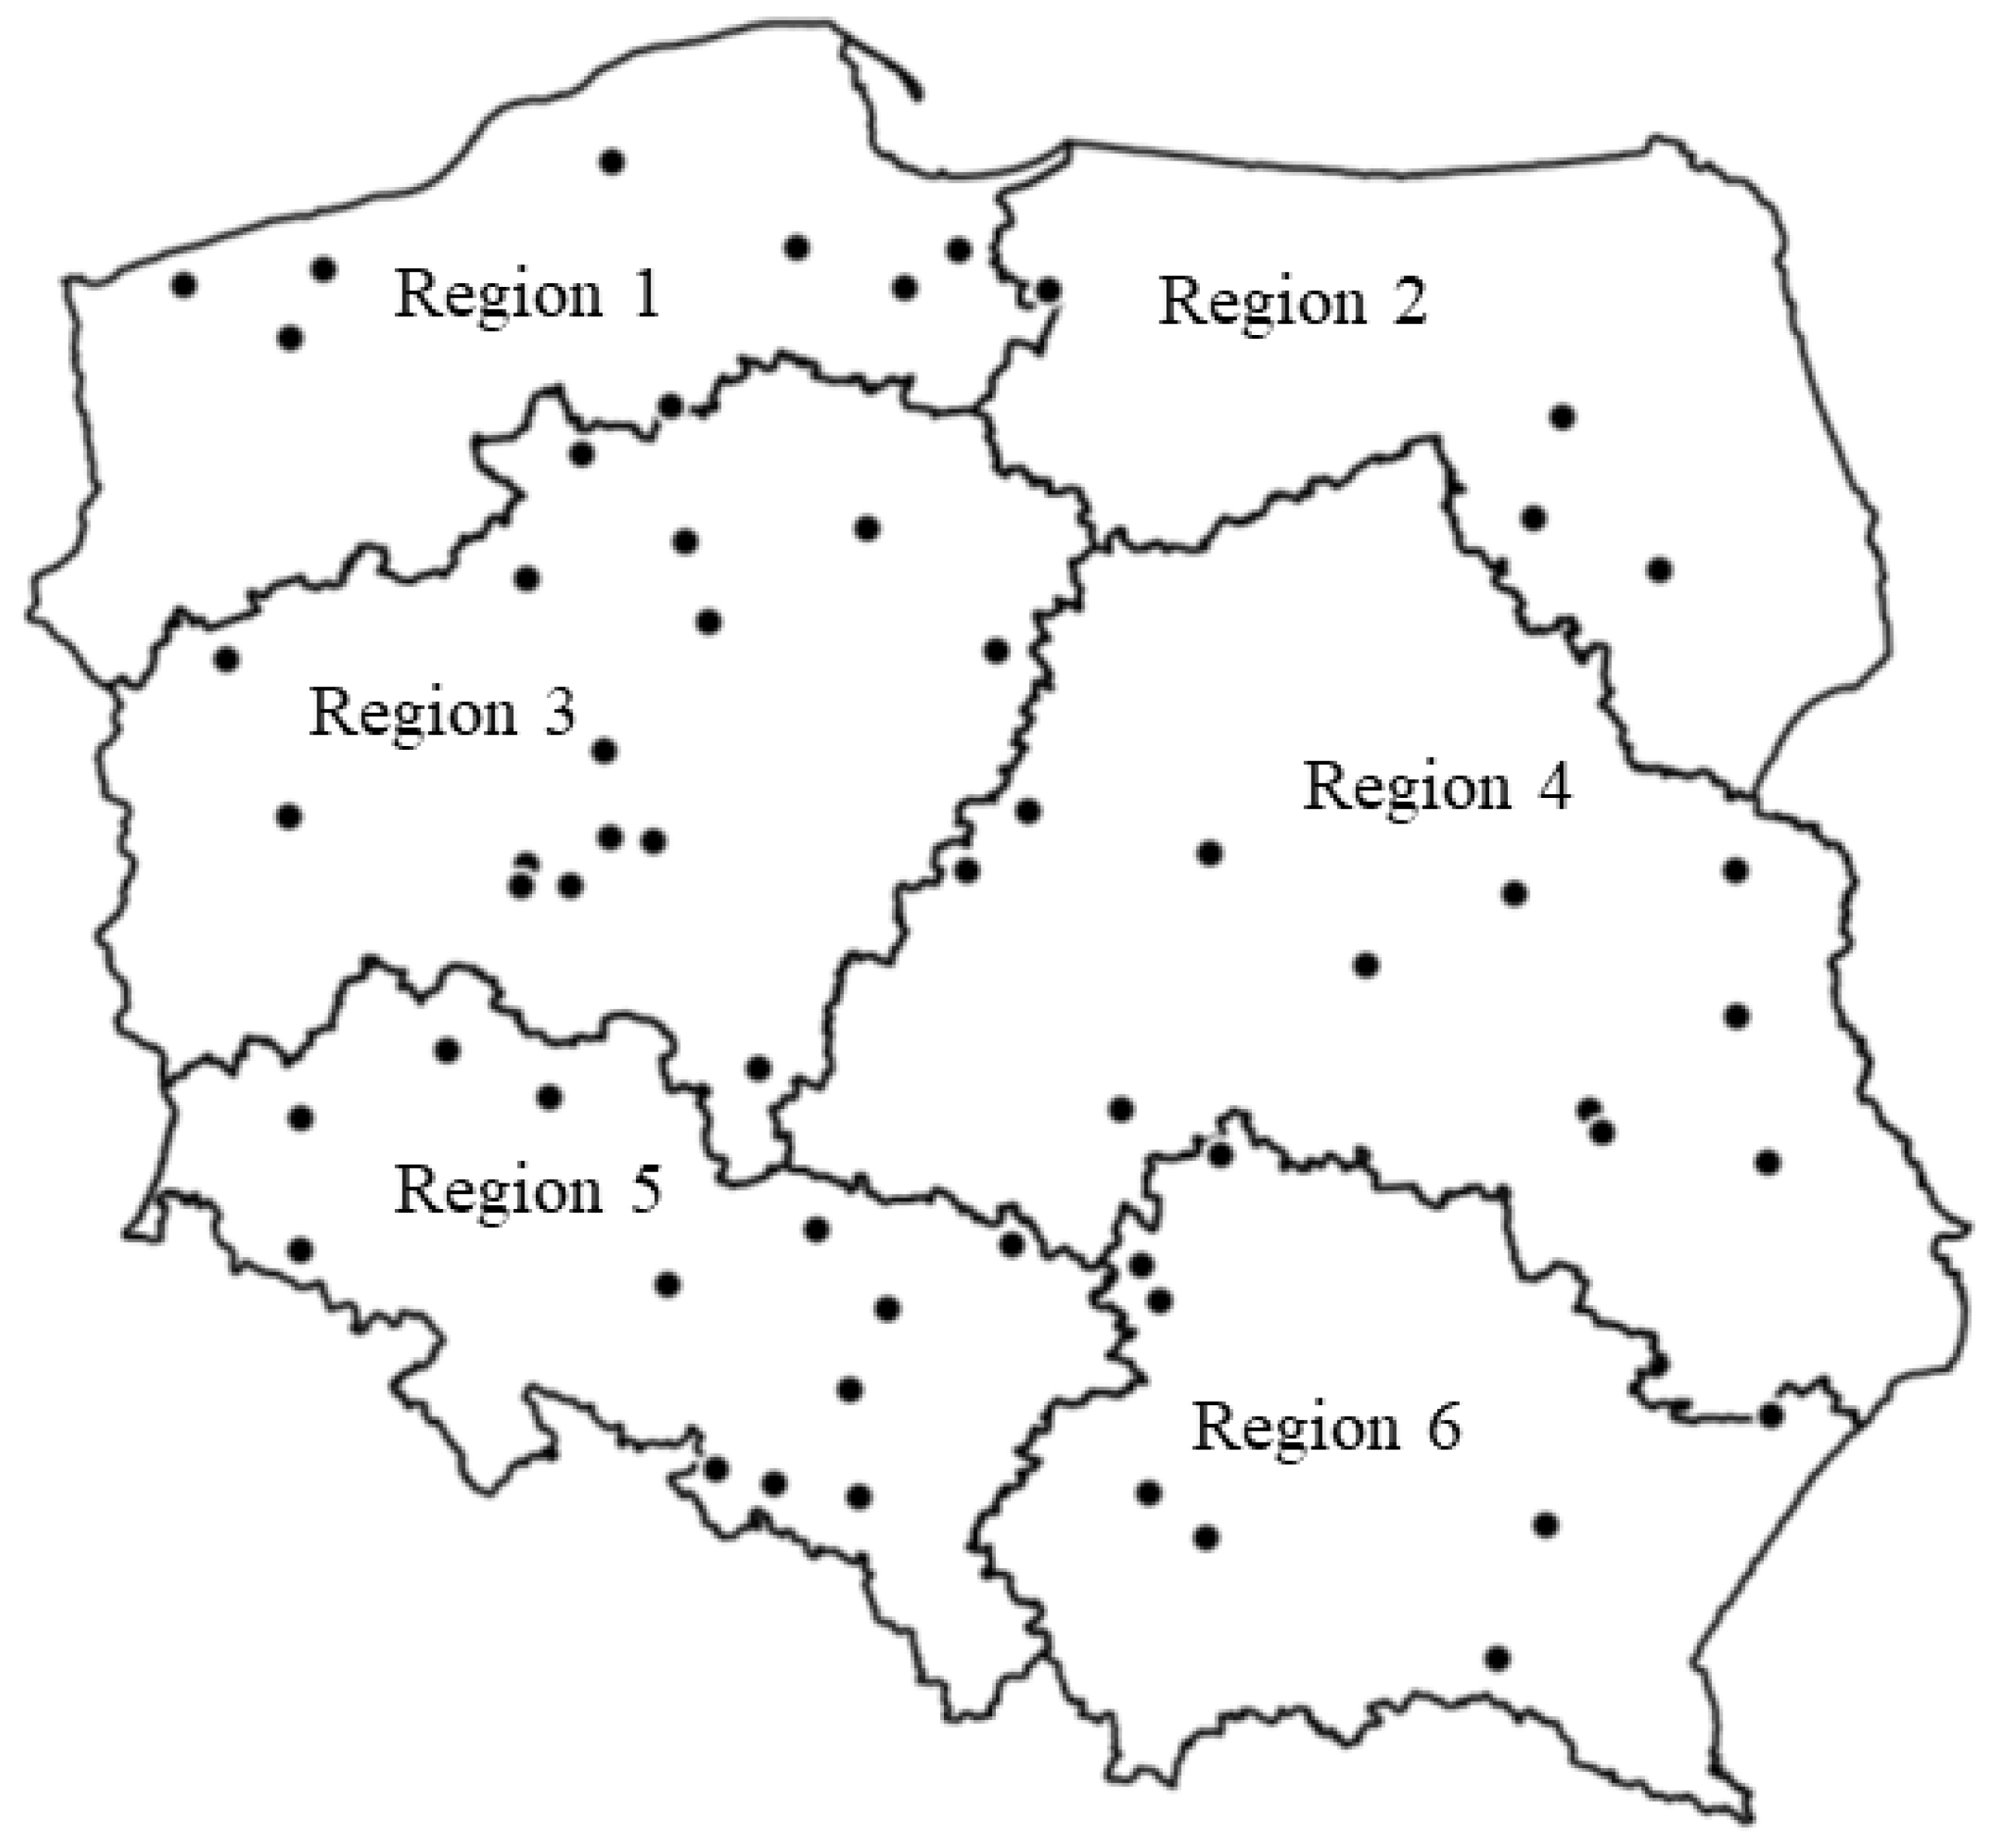
The data on grain yield used in this study come from multi-environmental trials (MET) in 58 locations (Figure 1) for 12 modern triticale cultivars during five growing seasons (years)—from 2009/2010 to 2014/2015. These MET experiments were carried out in the framework of the Post-Registration Variety Testing System, which is used for many crop species (e.g., cereals, industrial plants, and potato). Each of the 58 locations was assigned to one of six regions (Table 1). The division into regions is based on the climatic and soil conditions in Poland. However, their borders were created based on the administrative structure of Poland. The average annual rainfall in the regions ranges from 550 to 600 mm. This does not apply to mountainous regions (region 5 and 6), where the rainfall ranges from 1000 mm to even 1700 mm. Rainfall is distributed almost evenly throughout the rest of regions. Although the lowest rainfall is in the Central Poland. This is due to the lack of any hills on which wet masses could stop. The amount of rainfall in summer is higher than in winter (Table 1). The temperature course is quite similar; however, in regions 5 and 6 there are the largest temperature amplitudes and the longest period with snow cover. In Poland, soil quality is one of the lowest in Europe [1]. The soil quality in Poland is classified from the best soil to the worst soil using soil classes from I to VI. Triticale is most often grown on soils of class IV and V. Soils of these classes account for about 65% of all soils in the six regions. Percentage shares of each soil class in arable land of studied regions are presented in Table 2. The values come from the Polish Central Statistical Office. In each studied location the triticale cultivars were grown at two levels of crop management intensity - a moderate-input crop management (MIM) and a high-input crop management (HIM).
MIM included fungicide seed treatment before sowing, N fertilization, and use of herbicides (triasulfuron, florasulam, MCPA). Depending on the location, the total rate of N for MIM ranged from 65 to 100 kg ha−1, with 30–40 kg N applied before sowing and the remainder applied at Zadoks Growth Stage (GS) 49. At the HIM level, an additional N dose of 40 kg ha−1 at GS 59, foliar fertilizers, two fungicide at GS 31–32 and GS 49–60 and a growth regulator (trinexapac–ethyl) at GS 31 were applied. Fungicidal active agents (azoxystrobin, cyproconazole, propiconazole) were selected depending on the severity of the occurrence of the fungal diseases.
Each trial was established as a two–factorial (cultivar and crop management) strip–plot design with two replicates (blocks). The size of each trial plot was 15 m2. The cultivar × region × growing season data set was unbalanced. Six-thousand two-hundred thirty-nine combinations were filled, representing 89% of all the combinations possible in the corresponding balanced classification.
2.2. Statistical Methods
The analysis of triticale grain yield data was performed in a two–stage approach for each crop management (MIM and HIM) separately. In the first step we evaluated the significance impact of main effects of cultivar, region, year, and interactions between them. In this stage, we analyzed the grain yield data in a single trial (for each location–year combination) using a mixed model ANOVA approach for a strip–plot design, modeling cultivar and crop management effects as fixed ones and block and error effects as random [16]. In this way, the least squares (LS) means for cultivar and management combinations were estimated. Then, they were used in the LMM model shown below:
where: xikq is the LS mean of yield for of the i–th year, the q–th region, the k–th cultivar; µ is the overall mean; ai is the random main effect of the i–th year; rq is the random main effect of the q–th region; gk is the random main effect of the k–th cultivar; ariq is the random interaction effect of the i–th year and the q–th region; agik is the random interaction effect of the k–th cultivar, the i–th year and the error term associated with the xikq mean. The variance components for studied effects were estimated using the restricted maximum likelihood (REML). The likelihood ratio test was used to evaluate the significance of the studied effects and their variance components.
xikq = µ + ai + rq + gk + ariq + agik + argikq
In the second step we estimated the adjusted means for the cultivar and region combinations, based on the heterogeneous linear mixed model with a single–stage approach:
where: µ is the overall mean; zq is the fixed effect of the q–th region; gk is the random effect of the k–th cultivar; ai is the random effect of the i–th year; zlq(j) is the fixed effect of the j–th location nested in q–th region; zaqi is the random interaction effect of the i–th year and the q–th region; gzkq is the random interaction effect of the k–th cultivar and q–th region; glzkq(j) is the random interaction effect of the k–th cultivar and j–th location nested in q–th region; zlaiq(j) is the random interaction effect of the i–th year and j–th location nested in q–th region; gzakq(j) is the random interaction effect of the k–th cultivar and j–th location nested in q–th region; gzlakq(j)i is the random interaction effect of the k–th cultivar, i–th year and j–th location nested in q–th region; rjih is the random effect of the h–th replication nested in j–th location at i–th year; bjihm is the random effect of the m–th block nested in h–th replication at the j–th location and i–th year; and eijhklmq is the random effect of error associated with the yield observation yijhklmq.
yijhklmq = µ+zq+zlq(j)+gk+ai+zaqi+gzkq+glzkq(j)+gaki+zlaiq(j)+gzakq(j)+gzlakq(j)i+rjih+bjihm+eijhklmq
In the second model, for the random effects of cultivars in each region, we assumed factor analytic structure with two components (FA(2)) for the variance–covariance matrix. The FA structure was used assuming heterogeneity of cultivar variances in each studied region [6,17]. In LMM, the adjusted means of yield for cultivar × region combinations and cultivar × location combinations were calculated using the algorithm described by Welham et al. [18] The linear mixed model (2) was estimated using the restricted maximum likelihood (REML) method.
The obtained adjusted means from model (2) for appropriate combinations were used to assess the compatibility of cultivars’ rankings between studied regions and trial locations. The compatibility was evaluated using Spearman’s rank correlation coefficient. The cultivars wide adaptation was evaluated using superiority measure Pi [19] separately for each region. This parameter was obtained as a difference between the yield means of the maximum response averaged over all regions and the yield mean of best cultivars in regions. Additionally, using the adjusted means from model (2) for cultivar × region, we described cultivars adaptation to regions with the help of GGE (genotype main effects plus G × E interaction effects) biplot analysis. The biplot analysis is based on the environment–centered (in our case region–centered) principal component analysis (PCA).
The statistical analysis was carried out using the R 3.2.5 software package (The R Foundation for Statistical Computing, Vienna, Austria). The model (2) was fitted using ASReml 3.0, implemented in the R software package ASReml–R. The gge package in R software was used to prepare the GGE biplot.
3. Results
The share of variance components in triticale yield was different between the two levels of management intensity. The effect of region was significant for moderate management. Its share was 30% of the total variance (Table 3), while in high-input management, the region’s share was 10 times lower. That indicated a significant difference in mean grain yields between the six regions. The yield means varied from 10.30 t ha−1 in Region 6 to 12.52 t ha−1 in Region 5 (Table 1).
The effect of year can be considered the main factor determining triticale yield at HIM. Its share was 38% of the total variance. In the case of MIM it was only 11% and the whole environmental effect (region, year, and their interaction) accounted for ¾ of total variance. The remaining shares of variance components and their interactions are similar at both levels of crop management intensity.
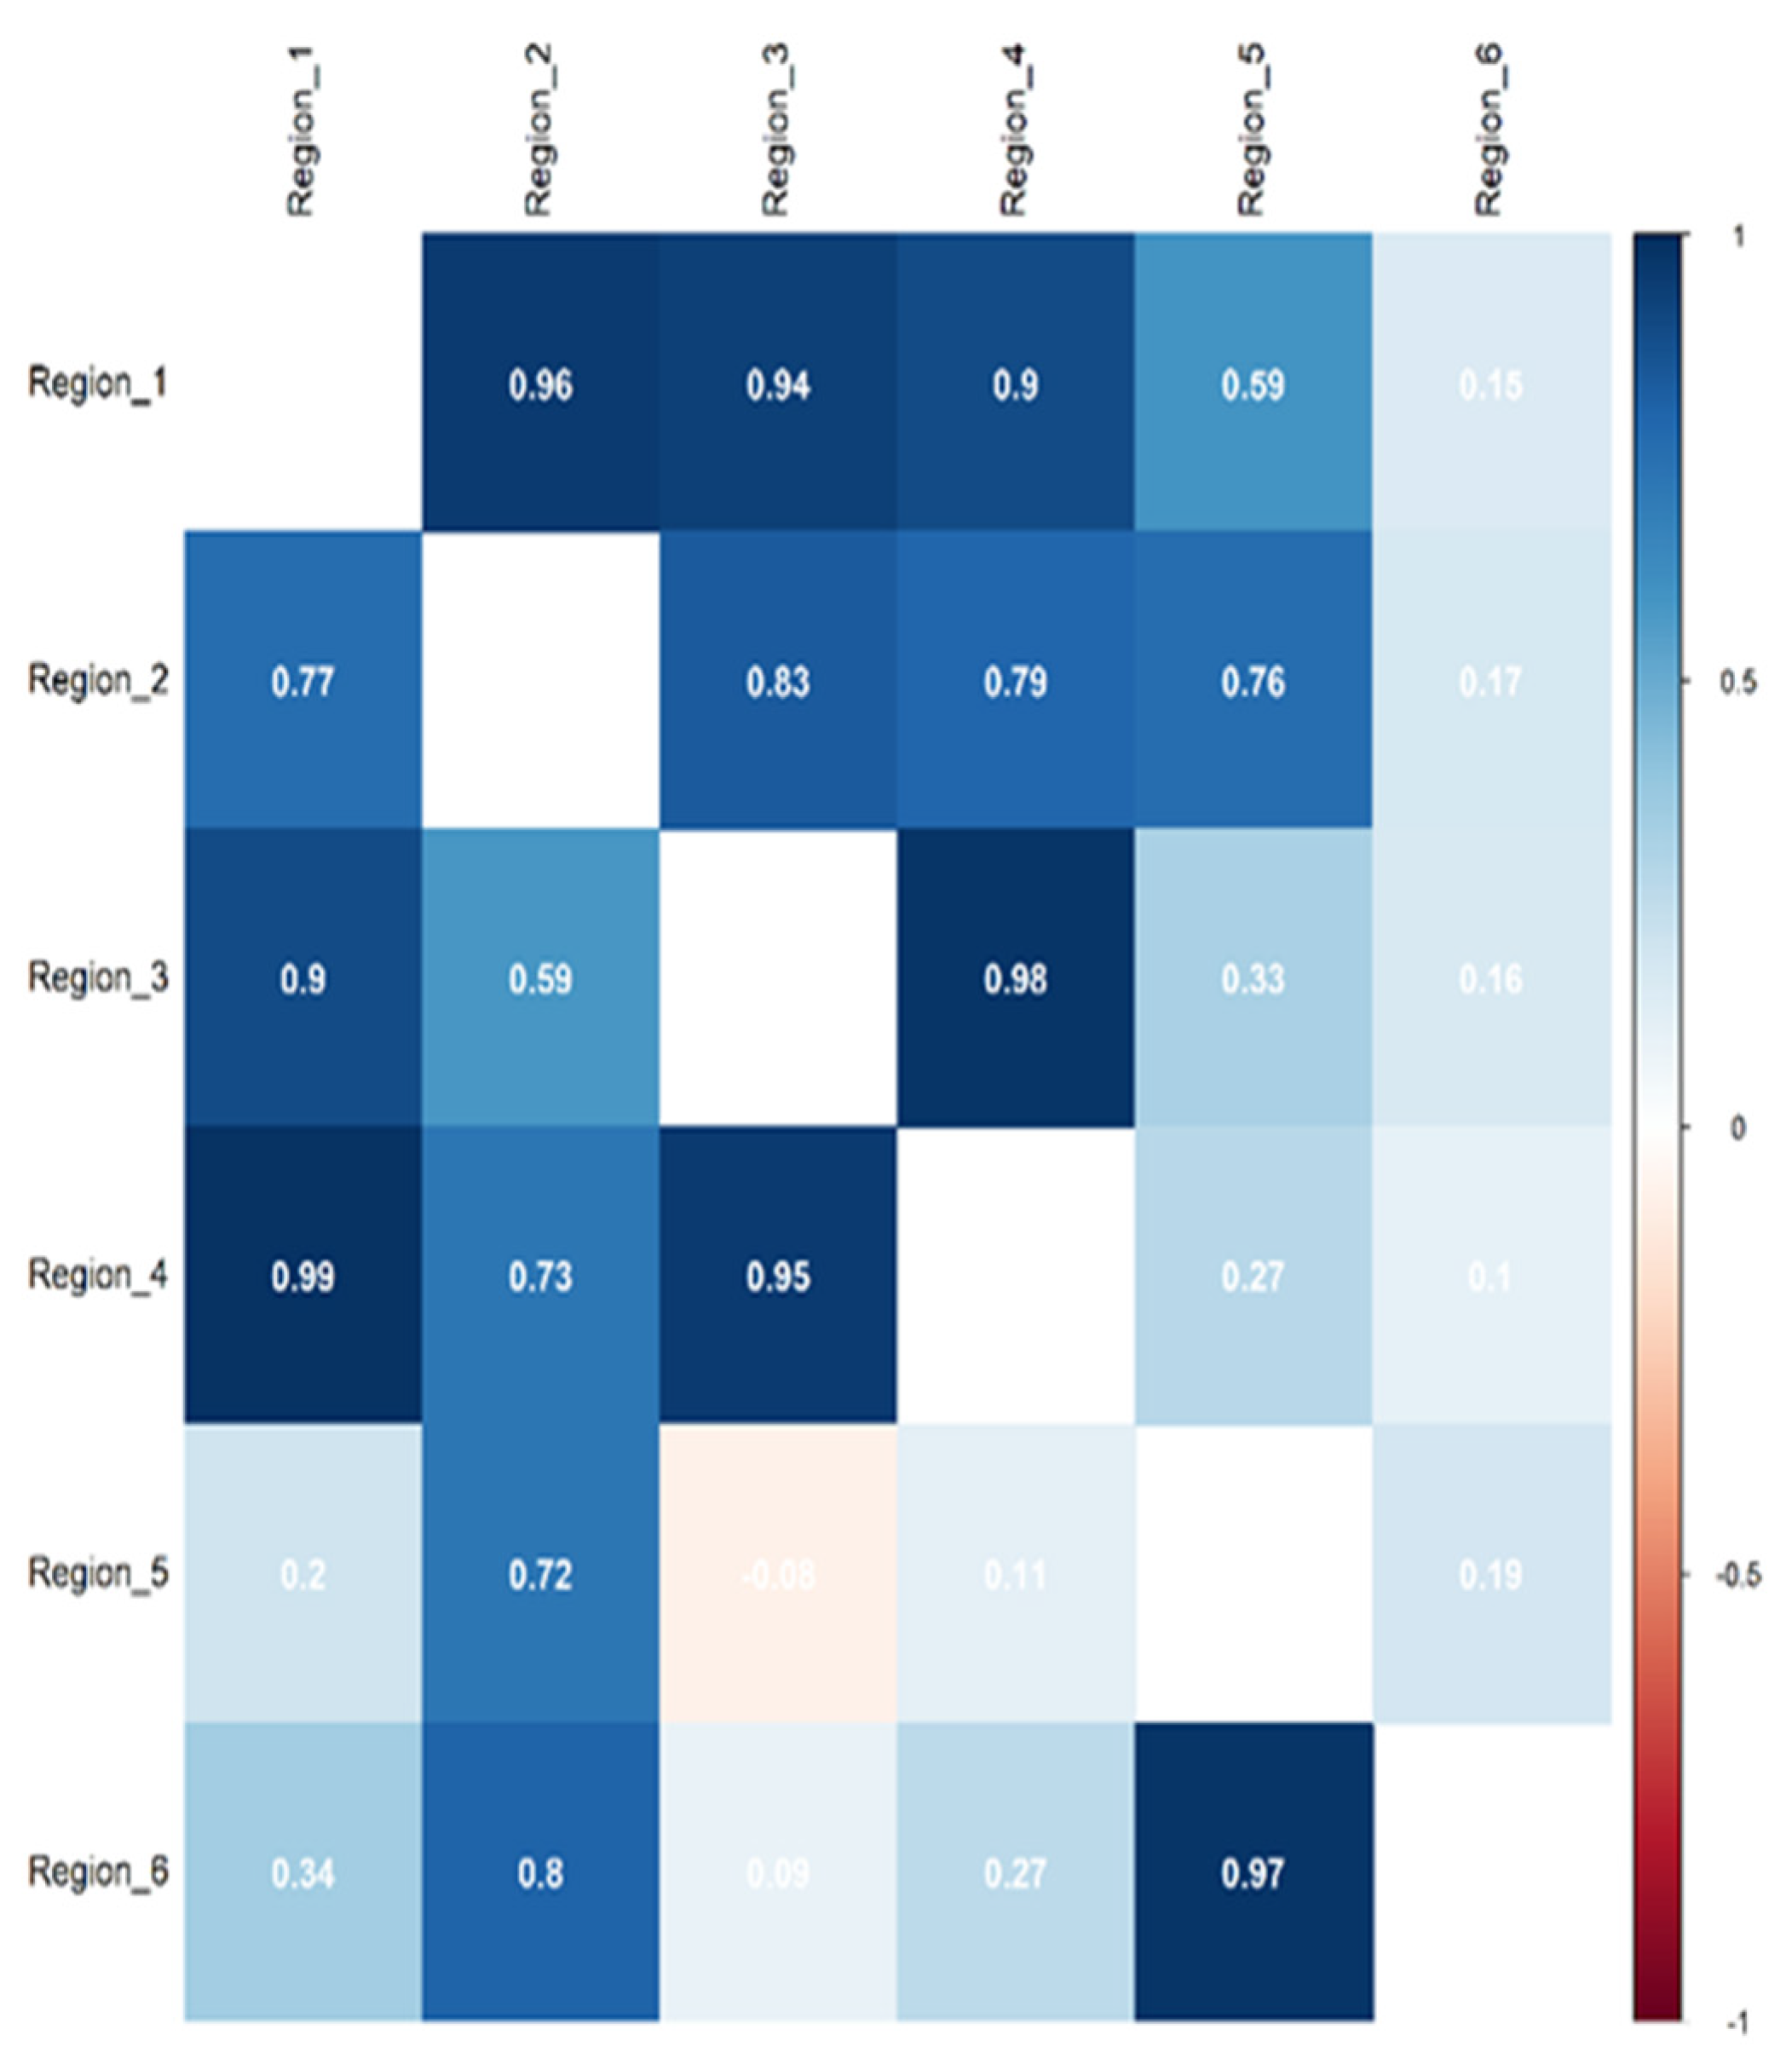
In Figure 2, we presented the results of compatibility assessment of triticale cultivars yield rankings in six regions separately for two levels of management intensity. The closer to 1 the Spearman’s rank correlation coefficient between regions is, the more consistent the rankings are. The high value of the correlation coefficient for cultivar rankings between regions 1 and 4 at HIM (r = 0.99) and regions 3 and 4 at MIM (r = 0.98) indicates that the rankings between these regions are comparable. This means that in these regions the same cultivars can be considered the highest yielding and the same the lowest yielding ones. On the other hand, a low value of the correlation coefficient (closer to 0) means that the rankings of cultivars in both compared regions are different. The highest yielding cultivars are different in these regions. The lowest values of correlation coefficients between cultivars’ rankings at HIM were obtained for regions 3 and 6 (r = −0.09), and for MIM all regions 1, 2, 3, 4, 5 have rankings correlation coefficients with region 6 at the level of r = 0.1–0.17. There is also a negative value of correlation between regions 3 and 5, where r = −0.08. This result indicates a very strong impact of crop management on rankings of cultivars in comparison to the environmental impact. We observed high correlation coefficient at MIM between regions 1 and 2 (r = 0.96) characterized by extremely different environmental conditions (Table 1). On the other hand, there is a high correlation in cultivars’ rankings between regions 3 and 4 with a very similar soil and climate conditions (r = 0.98). Similarly, at HIM we obtained high agreement in the rankings of cultivars between regions with similar environmental conditions (regions 5 and 6 with r = 0.97), and with very different environmental conditions (regions 1 and 4 with r = 0.99).
Both the low and negative values of correlation coefficient indicate inconsistent, different rankings. This result shows that region 6 is clearly different from others especially at the MIM crop management. Region 6 has the worst soils compared to the other regions, the largest temperature amplitudes, and the largest amount of precipitation (Table 2).
In addition, we examined the compatibility of cultivars’ rankings between locations in the same region (Figure 3). The high consistency of the rankings within each region would mean that the regions were well assigned and represent similar conditions for the cultivation of triticale. Results presented in Figure 3 suggest similarity in the adaptation of cultivars between locations in regions 1 and 4. In other regions (2, 3, 5, and 6), we observe incompatibility of the cultivar yield rankings between locations (Figure 3). The values of Spearman’s rank correlation coefficients were under 0.50 and were often negative. It can be noticed that the correlation coefficients were different for the two crop management intensities. The best compatibility of cultivars yield rankings was observed for the locations of the region number 4 for both levels of crop management intensity. Surprisingly, cultivars’ rankings between regions were more consistent and comparable than inside the regions for both levels of crop management (Figure 2).
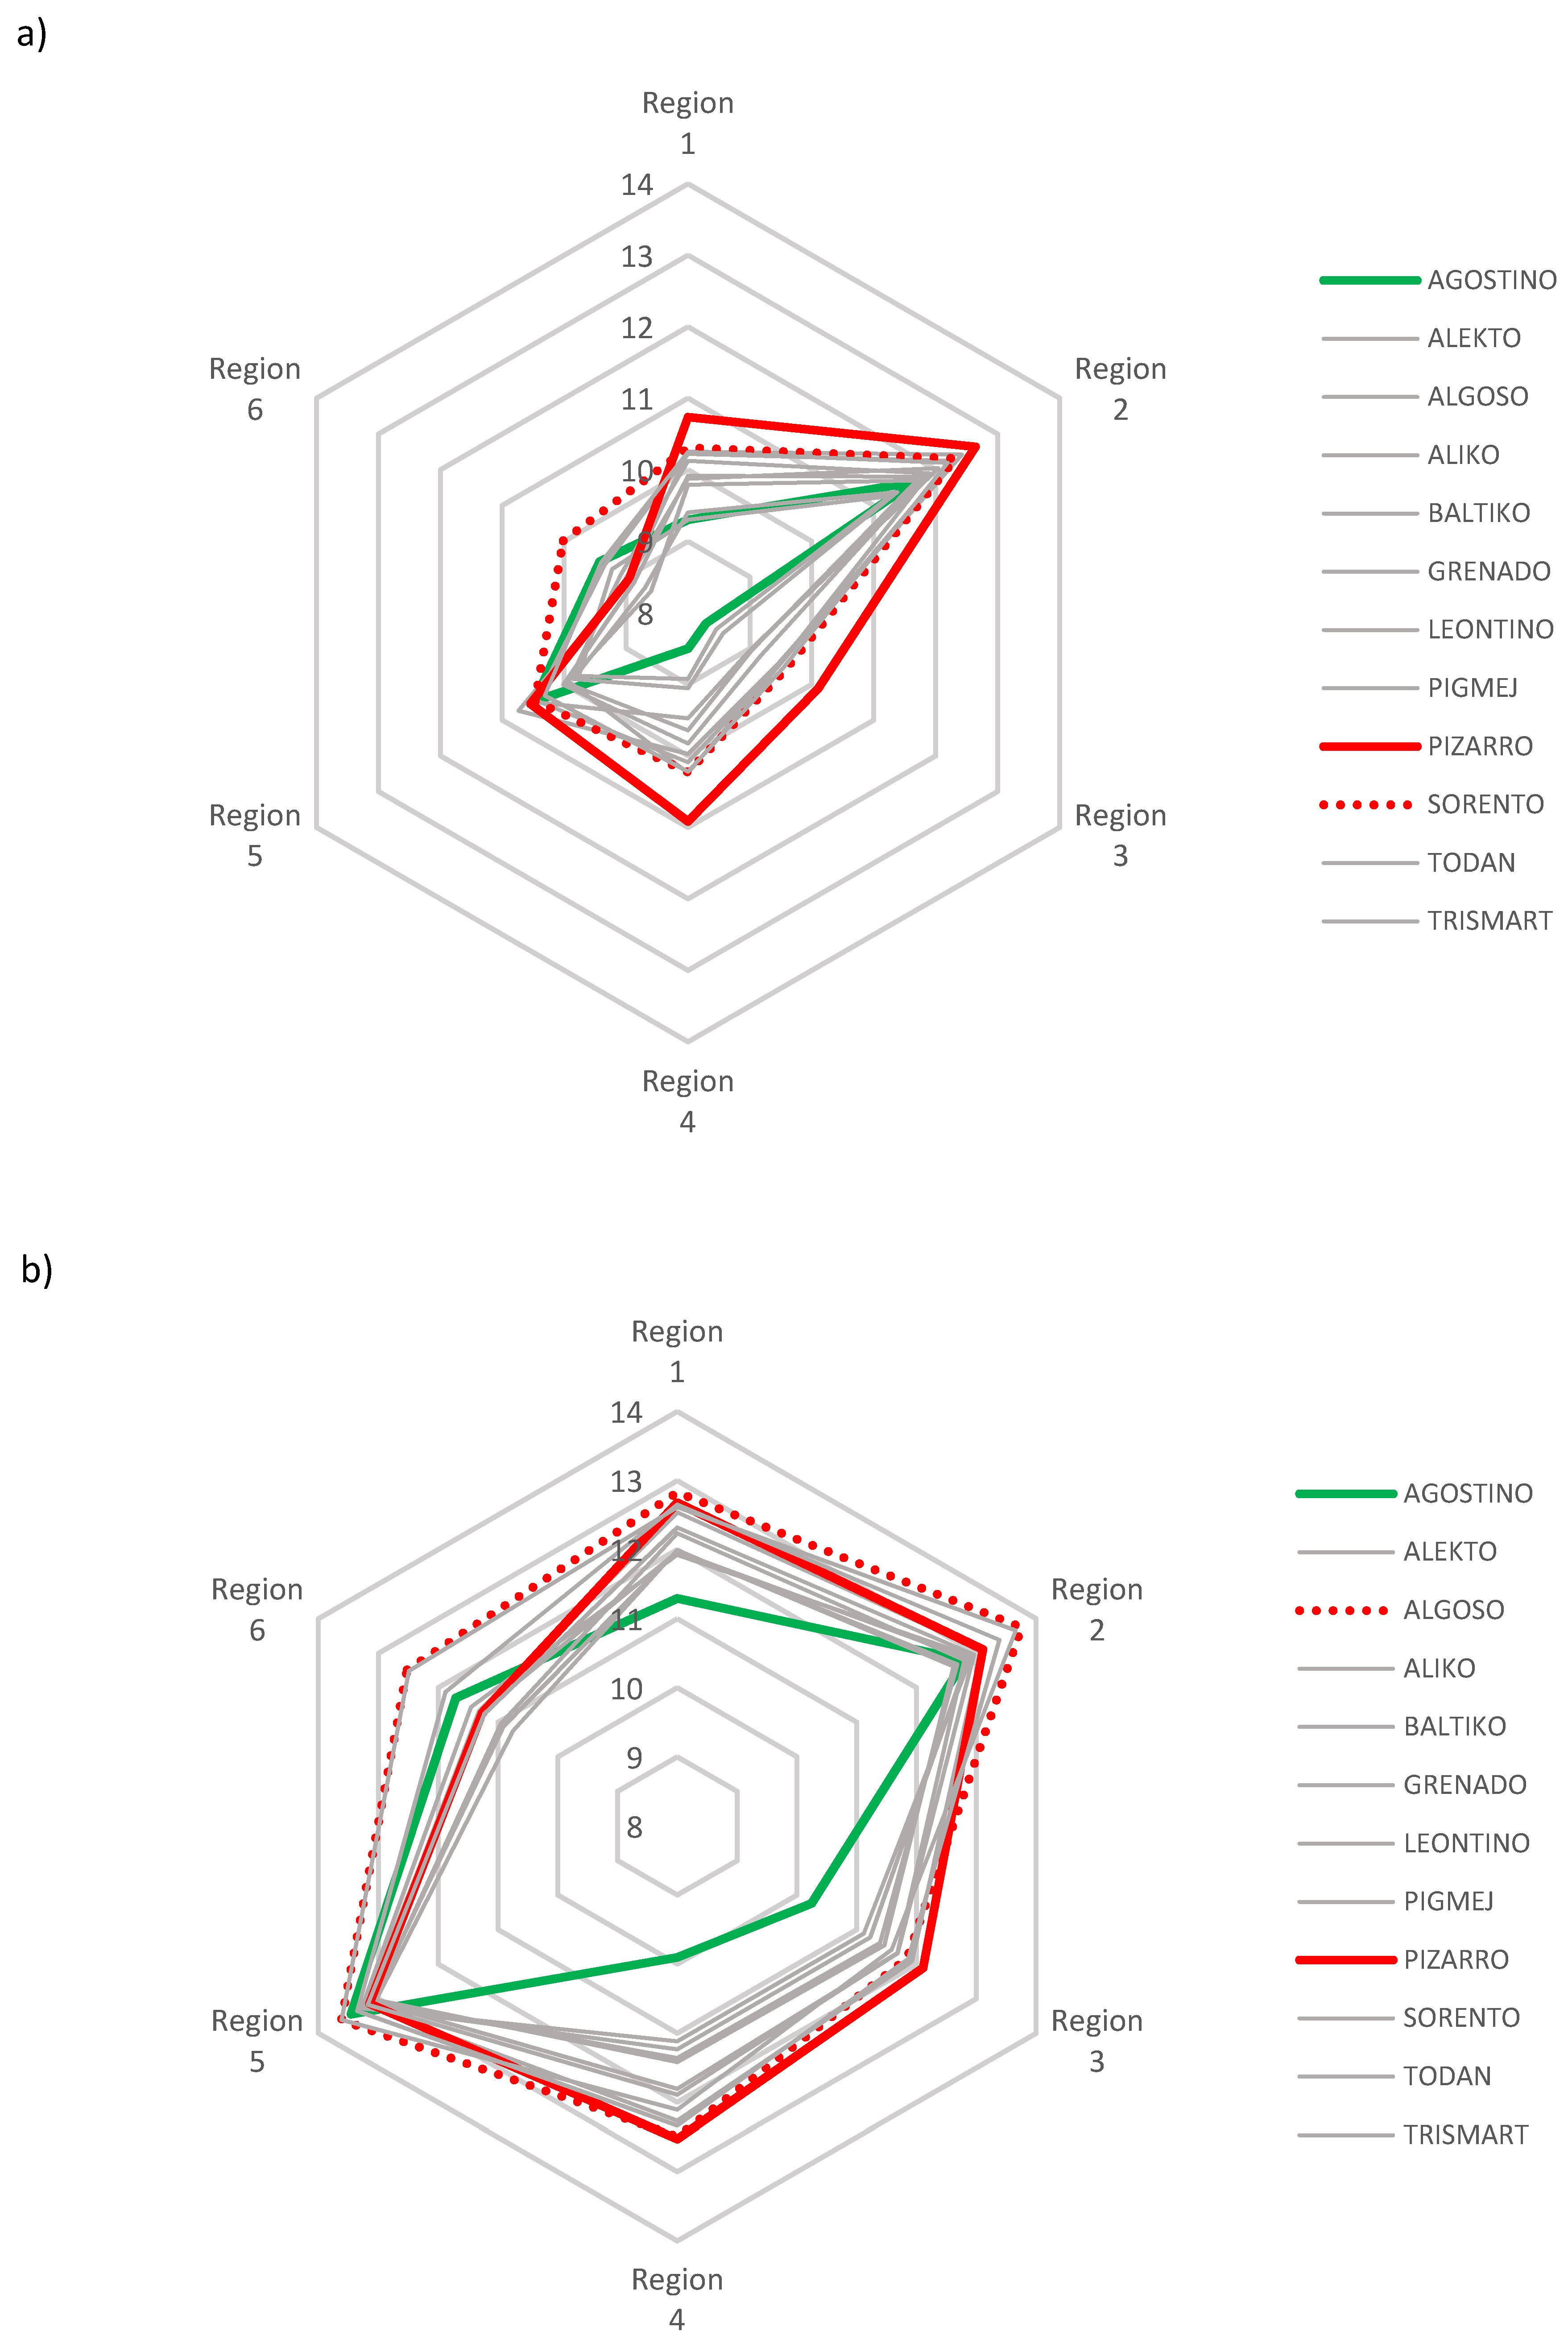
In the next step, we examined the adaptive response of 12 triticale cultivars for two crop managements, MIM and HIM. The response of the triticale cultivars tested under different environmental conditions is similar for both levels of crop management intensity; however, it is not the same (Figure 4a,b). The highest yielding cultivar in most of the studied environments at MIM is Pizarro (but in regions 5 and 6 it was the 8 and 9 lowest yielding cultivar, respectively) and Sorento (Figure 4a). Nevertheless, the highest yielding cultivar in most of the regions at HIM is Algoso (Figure 4b). The remaining cultivars, although they could have been the highest yielding ones, were cultivars with narrow adaptability, because only in some of the regions they achieved high yields. Agostino at high-input management is the lowest–yielding cultivar of all other cultivars, except for region 6, where it is ranked third among the highest yielding cultivars. Also at MIM, Agostino is poorly yielding in most regions, although slightly better in comparison to HIM in regions 1–4, while in region 5 it is a very high yielding cultivar.
It can also be concluded from Figure 4a,b that regions 5 and 6 are the most different from other regions in terms of the response of tested triticale cultivars at two crop management intensity levels. The most similar reaction of 12 triticale cultivars at both levels of crop management occurs in regions 1, 2 and 3.
To complete the adaptability assessment of cultivars, a measure of yield superiority (Pi) was calculated. The superiority of a cultivar applies to its adaptation assessment, i.e., how close to the maximum is cultivar yield in different locations. The smaller the value of this measure (closer to zero), the higher the degree of broad adaptation of a cultivar [20]. The Pi measure was calculated for six regions, separately for two levels of crop management intensity. Table 4 shows that the adaptive patterns in the rankings of 12 triticale cultivars is similar for both levels of crop management intensity. Application of this measure for the grain yield showed that the cultivars with the greatest degree of wide adaptation in terms of grain yield are Sorento and Pizarro but also Trismart and Algoso at both levels of input management intensity. These cultivars, in addition to wide adaptability, are characterized by stable yield regardless of environmental conditions and are appropriate for recommending to farmers. The correlation coefficient for the cultivars’ rankings between the two crop management intensity levels is r = 0.87. This means that there is a high compatibility in the rankings of cultivars between these two levels of management intensity, whereas Agostino is a cultivar with narrow adaptability at both levels of management intensity, because its measure of yield superiority is the highest in comparison to other cultivars of triticale.
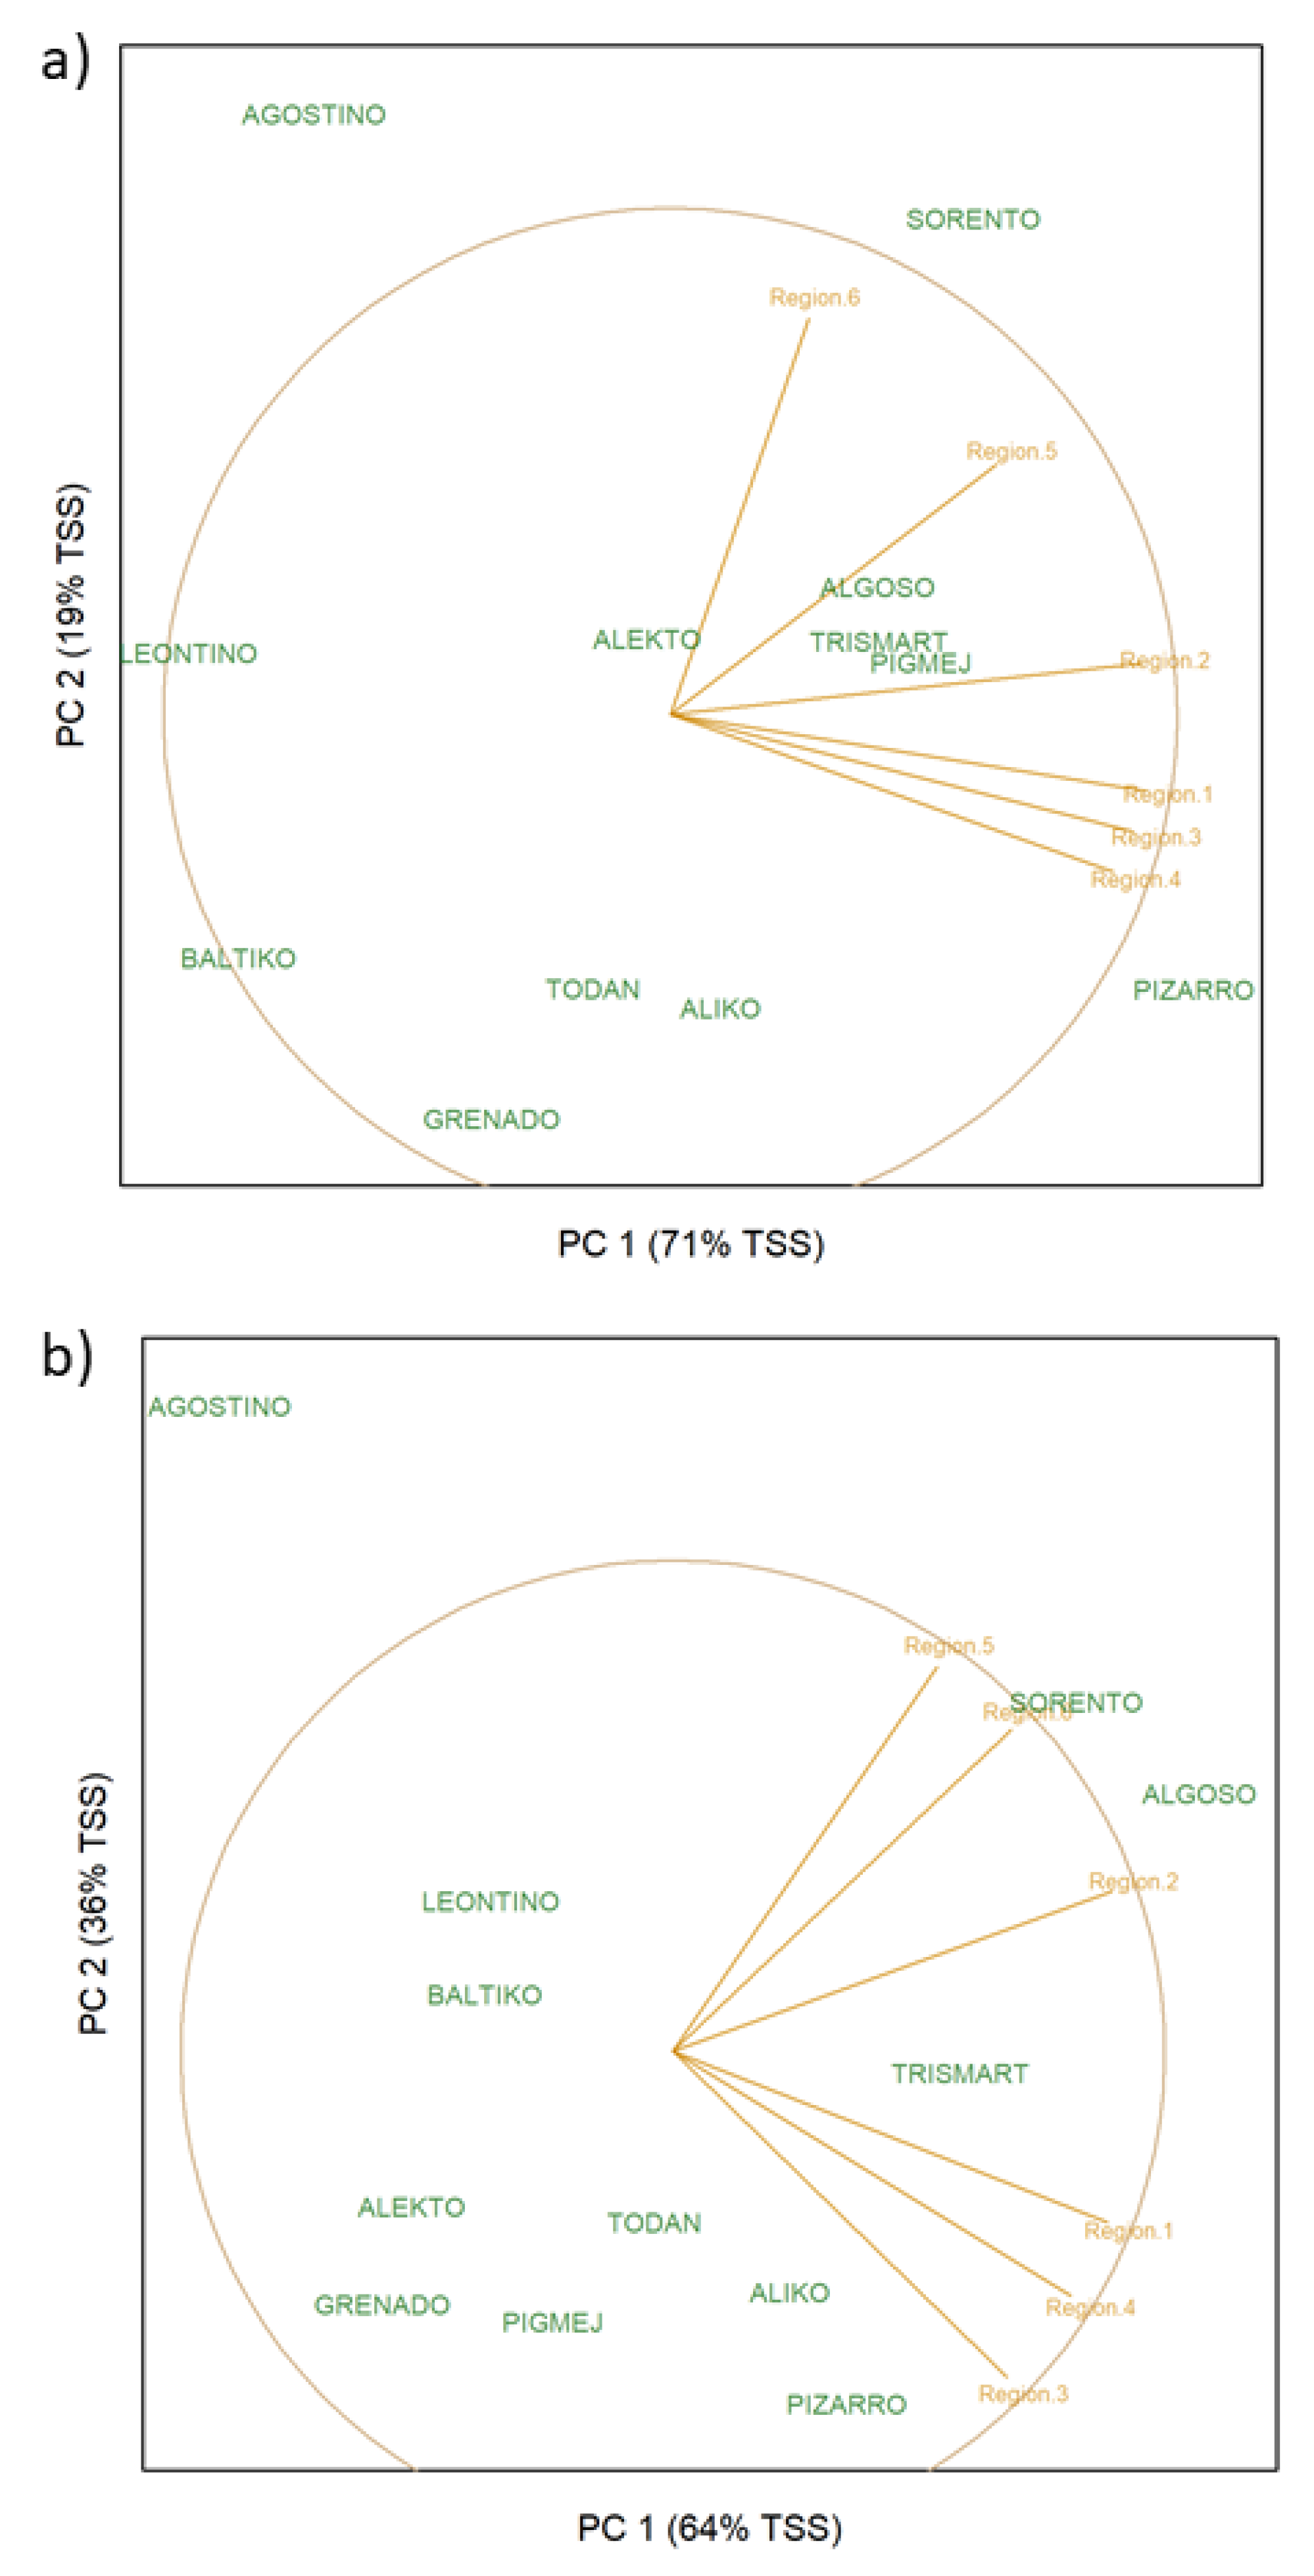
Cultivars widely adapted to the regions of Poland at both levels of crop management intensity were identified on the basis of the GGE biplots (Figure 5a,b). The Sorento cultivar was well-adapted in region 5 and 6 at the MIM crop management (Figure 5a). These two regions can be considered to be one mega-environment. Pizarro was well-adapted in the remaining four regions (region 1, 2, 3, 4) at MIM. These four regions form the second mega-environment. Similarly, at HIM we can distinguished two mega-environments (Figure 5b). Regions 2, 5 and 6 form the first mega-environment in which Sorento and Algosto can be considered to be well-adapted cultivars. The second mega-environment is formed by regions 1, 3 and 4, and there Pizzaro can be considered a well-adapted cultivar.
4. Discussion
The variability of triticale yield in the studied MET data was mainly determined by the impact of environment (regions, years, and their interactions) and slightly by the effect of cultivar for both levels of management intensity. We observed large differences in the impact of region between the two crop managements. For the high-input management, the variance of yields in regions is much smaller than for the moderate-input level. This may be due to the fact that high-input levels create optimal (without stress) conditions for triticale growth, which allows cultivars to demonstrate their full yielding potential. Thus, modern cultivars are very little diversified in yields. They achieve a similar yield in optimal soil and climate conditions [12,13]. This is why, with moderate-input managements, greater sensitivity of the cultivars yielding potential to environmental conditions is observed.
The share of environmental effects accounted for 73% and 80% of the total variance for MIM and HIM, respectively. The environmental effect explained a significant part of triticale yield variability. This indicates a diverse environmental conditions of the trials in regions. Numerous studies show similar results e.g., Laidig et al. [12], who studied the impact of genotype and environment on variability of grain yield and quality features of winter rye hybrid and population varieties. Environment (year or location) had a significant effect on grain yield for winter wheat in study by Barraclough et al. [21], for durum wheat in study by Rossini et al. [22], and for oat in study by Martinez et al. [23]. The authors found that the variability was mainly influenced by environment and less by genotype. In our study, cultivar × year interactions are irrelevant for both crop managements, which indicates that the adaptive response of cultivars is similar in different years. Mortazavian et al. [24] obtained similar results for barley cultivars. The cultivar × year × region interaction is significant and accounts for about 1/10 of the total variance in both crop managements. This means that the reaction of cultivars in regions throughout the years is not the same. The interaction cultivar × environment (region, growing season, and their interaction) makes it difficult for breeders and agronomists to predict the response of cultivar in the environment and thus to recommend the cultivar.
We also presented triticale cultivars yield rankings in six regions. We noticed greater compatibility of cultivars’ rankings between regions than between locations in the same region. This means that the adaptive pattern of the studied triticale cultivars was not the same for all locations in the region. Thus, inside the region there are locations with different adaptive patterns and recommendation referring to the entire agro-ecological might be incorrect and ineffective. However, based on the results presented in this study, we believe that it is possible to identify sub–regions with the same cultivar’s ranking. The highest compatibility in the ranking of cultivars was observed in regions 1 and 4. This means that the environmental conditions in these locations correspond to the conditions of the entire region. We showed low compatibility in the rankings of cultivars in regions 2, 3, 5 and 6. However, in each of them there were locations with high compliance in the rankings of cultivars. Such examples in region 2 are Krzyżewo and Rychliki (r = 0.89 at HIM). It is a region with the lowest temperatures and low rainfall. In addition, there are only four locations that characterize this region and they are unevenly distributed (Figure 1). After removing the location Małyszyn and Nowa Wieś from the region 3, rankings of cultivars were more consistent at MIM. There are many locations in this region, and we believe that their number could be reduced. In particular, when locations are not distant from each other. In regions 5 and 6 there are locations close to the mountains. The weather conditions for these locations differ from those for other locations in regions 5 and 6. Cultivars rankings for locations in region 5 are not compatible for any agricultural intensity level. This means that the choice of location cannot be limited only to the criterion of geographical area and might need broader investigation. Side-by-side locations do not necessarily have similar climatic or soil conditions. In region 6, the rankings of cultivars were not compatible at MIM. However, at HIM it would be enough to remove Chroberz, Dukla, and Modliszewice to significantly increase the compatibility of the cultivars’ rankings. The advantage of creating subregions is a more accurate recommendation of triticale varieties. In addition, the cost of experiments might be reduced by eliminating locations with incompatible rankings of triticale cultivars. Additionally, good compatibility of cultivars’ rankings between regions suggests that their number can be reduced for triticale cultivars assessment. This will reduce the cost of maintaining a large number of test locations [25,26].
Moreover, we observed differences in compatibility rankings between the studied management intensity levels. Indirectly it means more significant effect on triticale yield of management than environment (growing season, region). The opposite results were obtained in the work by Studnicki et al. [10] with winter wheat. The ranking of cultivars between regions was incompatible, while the ranking of cultivars between locations in one region was in good agreement and there was no differences in compatibility rankings between the two levels of management intensity tested. Based on the triticale results, we concluded that triticale is less dependent on environmental conditions and more on management intensity. Also, the potential for using triticale in worse environmental conditions is higher than for other cereals.
The agreement in the rankings of cultivars between regions 1 and 6 is greater for HIM than for MIM. In these two regions, triticale was cultivated on low quality soils and the average annual rainfall was much higher than the average for the whole Poland. In these regions, the value of average yields was also lower. On the other hand, in the locations of region 3 we observed greater compatibility in cultivar rankings at MIM. Region 3 was characterized by good soils with occasional drought. Region 5 had the best quality soils and the optimal amount of rainfall, and crop management had small impact on the differentiation of compatibility in the rankings of evaluated cultivars. Derejko et al. [27] also reported stronger impact of crop management on triticale grain yield when environmental conditions were unfavorable. However, in [27] studies were conducted separately for each year of experiments, similarly to [24] and [10]. Unfortunately, the results based on one growing season only are not very useful. Losert et al. [13] stated that the trend of yield behavior can only be identified by observing yields for several growing seasons. When cultivars are evaluated over several years, the assessment is more reliable and cultivar means are characterized by a smaller error of estimation [10,28]. Finding locations in region that are similar in terms of crop yield has several advantages. Cultivar evaluation can only be made in one place in any mega-environment instead of in all locations. Cultivars can be selected based on differences in yield ranking or difference in grain quantity. Depending on the purpose of researcher, specific or wide adaptation can be considered the main selection factor [24].
To identify cultivars widely adapted to all or most regions, we used two methods of visualization of cultivar × environment interaction, i.e., GGE biplot and the measure of yield superiority (Pi). The GGE method and its effectiveness were also demonstrated in work [29]. The authors of this research stated that in the studies of combined effects of genotype, environment, and genotype × environment interaction, only G and GE are relevant for cultivar evaluation and identification of mega-environments. This means that the locations may be similar in terms of adaptive response of cultivars, despite the significant geographic distance. Mortazavian et al. [24] stated that GGE biplot defines an ideal genotype, based on both mean performance and stability across environments. In work [30] Kaya et al. indicated that the ideal genotype should achieve the highest grain yield, as well as be absolutely stable. However, the authors also emphasized that in practice there are no genotypes that meet these conditions. Despite this, in the agricultural practice, as well as in plant breeding, cultivars with broad adaptation to the environment are sought [31]. Despite the prevailing influence of environmental factors on the triticale yield and regions diversified in terms of environmental conditions we managed to demonstrate cultivars with broad adaptability as well as with stable yield. In our work, both methods have led to similar conclusions regarding adaptation patterns of triticale cultivars for different regions at two crop managements. Considering Pi and GGE results, Pizzarro and Sorento are recommended as the ideal cultivars at both levels of management intensity. GGE was helpful in comparing the adaptive response of triticale cultivars in different regions, and also in identifying cultivars appropriate to grow in all regions. Based on our results, the cultivars which will successfully achieve a stable yield in each test location regardless of region or year are Pizzarro, Sorento and Algosto. In study [10] authors showed that well-adapted cultivars are characterized not only by high values of grain yield but also by good quality of other traits. However, in the studies by Kahram et al. [11] it was possible to select two cultivars with a broad adaptation and the highest values of grain yield from 18 genotypes in six locations. Repeatability of high yield in various climatic and soil conditions indicates a well-adapted, stable cultivar. It gives the possibility of recommending such cultivars, because their behavior in other years can be repeatable. Other cultivars are characterized by specific adaptation. Specific adaptation can be characterized as positive coincidence of plant phenology with such environmental reducing events as frost damage in winter and/or terminal drought. In studies [24,28] with durum wheat, authors showed a specific or narrow adaptation of grain yield to local environmental conditions in Iran. There, the factor limiting wheat production was the air temperature.
5. Conclusions
Triticale has become a competition for other cereals. It has good yielding potential even in unfavorable environments and offers many possibilities for using its grain. However, research is still paying more attention to wheat, barley, or rye than to triticale. Correct and effective recommendation on triticale cultivars for farmers must be adapted to the region of their fields. Thus, recommendation should be based on the results from locations well representing climatic and soil conditions of the region. Our results demonstrated that the compatibility assessment of cultivar rankings of can reduce the costs of MET experiments and even contribute to reduction of the yield gap. Due to the high compatibility in the rankings of cultivars between the six studied regions, their number can be reduced to four or maybe even three without lowering the chance for a high and stable yield. The proposed statistical methodology can be successfully used in research on adaptive response and recommendation of cultivars of different plant species.
Author Contributions
A.D.: concept, writing, editing; M.S.: statistical analysis, editing; E.W.-G.: writing—review and editing; E.G.: data curation. All authors have read and agreed to the published version of the manuscript.
Funding
This research received no external funding.
Acknowledgments
Thanks to the Director of Development of Polish Official Variety Testing for providing data on the grain yield of the triticale cultivars used in this work.
Conflicts of Interest
Authors declare no conflict of interest.
References
- FAO. Statistical Yearbook; Word Food and Agriculture: Roma, Italy, 2015. [Google Scholar]
- Ammar, K.; Mergoum, M.; Rajaram, S. The history and evolution of triticale. In Triticale Improvement and Production; Mergoum, M., Gómez–Macpherson, H., Eds.; Food and Agriculture Organization of the United Nations: Roma, Italy, 2004; pp. 1–10. [Google Scholar]
- Peña, R.J. Food uses of triticale. In Triticale Improvement and Production; Mergoum, M., Gómez–Macpherson, H., Eds.; Food and Agriculture Organization of the United Nations: Roma, Italy, 2004; pp. 37–48. [Google Scholar]
- Wang, S.; Thomas, K.C.; Ingledew, W.M.; Sosulski, K.; Sosulski, F.W. Rye and triticale as feedstock for fuel ethanol production. Cereal Chem. 1997, 74, 621–625. [Google Scholar] [CrossRef]
- Eckl, T.; Piepho, H.P. Analysis of Series of Cultivar Trials with Perennial Grasses for Subdivided Target Regions. Crop Sci. 2015, 55, 597–609. [Google Scholar] [CrossRef]
- Smith, A.; Ganesalingam, A.; Kuchel, H.; Cullis, B.R. Factor analytic mixed models for the provision of grower information from national crop variety testing programs. Theor. Appl. Genet. 2015, 128, 55–72. [Google Scholar] [CrossRef] [PubMed]
- Hammer, G.L.; McLean, G.; Chapman, S.; Zheng, B.; Doherty, A.; Harrison, M.; van Oosterom, E.; Jordan, D. Crop design for specific adaptation in variable dryland production environments. Crop Pasture Sci. 2014, 65, 614–626. [Google Scholar] [CrossRef]
- DeLacy, L.H.; Kaul, S.; Rana, B.S.; Cooper, M. Genotypic variation for grain and stover yield of dryland sorghum in India. 2. A characterization of genotype x environment interactions. Field Crop Res. 2010, 118, 236–242. [Google Scholar] [CrossRef]
- Richards, R.A.; Hunt, J.R.; Kirkegaard, J.A.; Passioura, J.B. Yield improvement and adaptation of wheat to water–limited environments in Ausralia—A case study. Crop Pasture Sci. 2014, 65, 676–689. [Google Scholar] [CrossRef]
- Studnicki MDerejko, A.; Wójcik–Gront, E.; Kosma, M. Adaptation patterns of winter wheat cultivars in agro–ecological regions. Sci. Agric. 2019, 76, 148–156. [Google Scholar] [CrossRef]
- Kahram, A.; Khodarahmi, M.; Mohammadi, A.; Bihamta, M.; Ahmadi, G.H.; Ghandi, A.; Jafarby, J.A.; Taherian, M.; Abdi, H. Genotype × environment interaction analysis for grain yield of durum wheat new genotypes in the moderate region of Iran using AMMI model. World J. Agric. Sci. 2013, 9, 298–304. [Google Scholar]
- Laidig, F.; Piepho, H.P.; Rentel, D.; Drobek, T.; Uwe Meyer, U.; Huesken, A. Breeding progress, variation, and correlation of grain and quality traits in winter rye hybrid and population varieties and national on–farm progress in Germany over 26 years. Appl. Genet. 2017, 130, 981–998. [Google Scholar] [CrossRef] [Green Version]
- Losert, D.; Mauren, H.P.; Marulanda, J.J.; Wurschum, T. Phenotypic and genotypic analyses of diversity and breeding progress in European triticale (xTriticosecale Witmark). Plant Breed. 2017, 136, 18–27. [Google Scholar] [CrossRef]
- Milgate, A.; Ovenden, B.; Adorada, D.; Lisle, C.; Lacy, J.; Coombes, N. Genetic improvement of triticale for irrigated systems in south–eastern Australia: A study of genotype and genotype × environment interactions. Crop Pasture Sci. 2015, 66, 782–792. [Google Scholar] [CrossRef]
- Central Statistical Office of Poland. Statistical Yearbook of Agriculture and Rural Areas; Central Statistical Office of Poland: Warsaw, Poland, 2008.
- Möhring, J.; Piepho, H.P. Comparison of weighting in two–stage analyses of series of experiments. Crop Sci. 2009, 49, 1977–1988. [Google Scholar] [CrossRef]
- Kelly, A.M.; Smith, A.B.; Eccleston, J.A.; Cullis, B. The accuracy of varietal selection using factor analytic models for multi–environment plant breeding trials. Crop Sci. 2007, 47, 1063–1070. [Google Scholar] [CrossRef]
- Welham, S.; Cullis, B.; Gogel, B.; Gilmour, A.; Thompson, R. Prediction in linear mixed models. Aust. N. Z. J. Stat. 2004, 46, 325–347. [Google Scholar] [CrossRef]
- Li, C.S.; Binns, M.R. A superiority measure of cultivar performance for cultivar × location data. Can. J. Plant Sci. 1987, 68, 193–198. [Google Scholar]
- Mądry, W.; Iwańska, M. Usefulness of Statistical Methods and Measures for Assessing the Stability and Adaptation of Varieties: Literature Review; Bulletin of the Institute of Plant Breeding and Acclimatization: Warsaw, Poland, 2011; pp. 260–261. [Google Scholar]
- Barraclough, P.B.; Howarth, J.R.; Jones, J.; Lopez–Bellido, R.; Parmar, S.; Shepherd, C.E.; Hawkesford, M.J. Nitrogen efficiency of wheat: Genotypic and environmental variation and prospects for improvement. Eur. J. Agron. 2010, 33, 1–11. [Google Scholar] [CrossRef]
- Rossini, F.; Provenzano, M.E.; Sestili, F.; Ruggeri, R. Synergistic Effect of Sulfur and Nitrogen in the Organic and Mineral Fertilization of Durum Wheat: Grain Yield and Quality Traits in the Mediterranean Environment. Agronomy 2018, 8, 189. [Google Scholar] [CrossRef] [Green Version]
- Martinez, F.; Arelovich, H.M.; Wehrhahne, L.N. Grain yield, nutrient content and lipid profile of oat genotypes grown in a semiarid environment. Field Crops Res. 2010, 116, 92–100. [Google Scholar] [CrossRef]
- Mortazavian, S.M.M.; Nikkhah, H.R.; Hassani, F.A.; Sharif–al–Hosseini, M.; Taheri, M.; Mahlooji, M. GGE biplot and AMMI of yield performance of barley genotypes across different environments in Iran. J. Agric. Sci. Technol. 2014, 16, 609–622. [Google Scholar]
- Derejko, A.; Studnicki, M.; Mądry, W.; Gacek, E. A Comparison of Winter Wheat Cultivar Rankings in Groups of Polish Locations. Cereal Res. Communications 2016, 44, 628–638. [Google Scholar]
- Atlin, G.N.; Baker, R.J.; McRae, K.B.; Lu, X. Selection response in subdivided target regions. Crop Sci. 2000, 40, 7–13. [Google Scholar] [CrossRef]
- Derejko, A.; Studnicki, M. Effect of cultivar, crop management, location and growing season on the grain yield of triticale. Biom. Lett. 2019. [CrossRef] [Green Version]
- Mohammadi, R.; Farsadfar, E.; Amri, A. Interpreting genotype x environments interactions for grain yield of rainfed durum wheat in Iran. Crop J. 2015, 3, 526–535. [Google Scholar] [CrossRef] [Green Version]
- Yan, W.; Hunt, L.A.; Sheng, Q.; Szlavnics, Z. Cultivar Evaluation and Mega–Environment Investigation Based on GGE Biplot. Crop Sci. 2000, 40, 597–605. [Google Scholar] [CrossRef]
- Kaya, Y.; Akçura, M.; Taner, S. GGE–biplot analysis of multi–environment yield trials in bread wheat. Turk. J. Agric. For. 2006, 30, 325–337. [Google Scholar]
- Khazratkulova, S.; Sharma, R.C.; Amanov, A.; Ziyadullaev, Z.; Amanov, O.; Alikulov, S.; Ziyaev, Z.; Muzafarova, D. Genotype × environment interaction and stability of grain yield and selected quality traits in winter wheat in Central Asia. Turk. J. Agric. For. 2015, 39, 920–929. [Google Scholar] [CrossRef]
Figure 1.
The six regions of Poland together with 58 trial locations.

Figure 2.
Spearman’s rank correlation coefficients of triticale cultivars’ rankings between all regions in Poland for each crop management (moderate-input crop management (MIM)—upper triangle, high-input crop management (HIM)—lower triangle).
Figure 2.
Spearman’s rank correlation coefficients of triticale cultivars’ rankings between all regions in Poland for each crop management (moderate-input crop management (MIM)—upper triangle, high-input crop management (HIM)—lower triangle).

Figure 3.
Spearman’s rank correlation coefficients of triticale cultivars’ rankings across trial locations in each region for each crop management (moderate-input crop management (MIM)—upper triangle, high-input crop management (HIM)— lower triangle).
Figure 3.
Spearman’s rank correlation coefficients of triticale cultivars’ rankings across trial locations in each region for each crop management (moderate-input crop management (MIM)—upper triangle, high-input crop management (HIM)— lower triangle).

Figure 4.
Adaptive response of cultivars to environmental conditions across 6 regions for the moderate-input crop management MIM (a), and for the high-input management HIM (b).
Figure 4.
Adaptive response of cultivars to environmental conditions across 6 regions for the moderate-input crop management MIM (a), and for the high-input management HIM (b).

Figure 5.
GGE biplots based on adjusted means of cultivar × region combination for the moderate-input crop management MIM (a), and for the high-input crop management HIM (b). PC, principal component; TSS, total sum of squares.
Figure 5.
GGE biplots based on adjusted means of cultivar × region combination for the moderate-input crop management MIM (a), and for the high-input crop management HIM (b). PC, principal component; TSS, total sum of squares.


Table 1.
Characteristics of the regions in Poland. The average temperatures and amount of rainfall were presented as ranges based on long-term data from meteorological stations in a region.
Table 1.
Characteristics of the regions in Poland. The average temperatures and amount of rainfall were presented as ranges based on long-term data from meteorological stations in a region.
| Region 1 | Region 2 | Region 3 | Region 4 | Region 5 | Region 6 | |
|---|---|---|---|---|---|---|
| Average winter temperatures (°C) | −1–−2.5 | −3.5–−6 | −1–−2.5 | −2.5–−5 | −1.5–−3 | −4–−6.5 |
| Average summer temperatures (°C) | 16–17 | 15–16 | 18–19 | 18–19 | 12–14 | 12–14 |
| Average annual temperatures (°C) | 6–8 | 5–7 | 7.5–8.5 | 7–8.5 | 6–8 | 6–8 |
| Average amount of winter rainfall (mm) | 200–250 | 175–225 | 175–250 | 175–250 | 250–300 | 300–350 |
| Average amount of summer rainfall (mm) | 500–600 | 300–400 | 250–350 | 350–400 | 600–700 | 700–800 |
| Average amount of annual rainfall (mm) | 600–850 | 550–650 | 500–650 | 500–650 | 900–1200 | 900–1400 |
| Mean yield on MIM 1 ± SE 2(t×ha−1) | 9.96 ± 0.45 | 11.96 ± 0.46 | 9.18 ± 0.45 | 9.76 ± 0.46 | 10.25 ± 0.45 | 9.13 ± 0.47 |
| Mean yield on HIM 3 ± SE(t×ha−1) | 12.25 ± 0.56 | 13.05 ± 0.57 | 11.51 ± 0.60 | 11.70 ± 0.60 | 13.28 ± 0.56 | 11.48 ± 0.61 |
| Number of trial locations | 8 | 5 | 15 | 11 | 13 | 6 |
1 MIM—moderate-input crop management; 2 SE—standard error; 3 HIM—high-input crop management.
Table 2.
Share of soil quality group in the total arable land in studied regions.
| Soil Quality Groups (%) | ||||||
|---|---|---|---|---|---|---|
| I a | II | III | IV | V | VI | |
| Region 1 | 0.11 | 2.79 | 22.51 | 44.28 | 20.31 | 10 |
| Region 2 | 0 | 0.22 | 14.61 | 48.79 | 24.19 | 12.19 |
| Region 3 | 0.06 | 1.21 | 23.18 | 39.1 | 23 | 13.45 |
| Region 4 | 0.31 | 2.88 | 22.27 | 36.44 | 25.08 | 13.02 |
| Region 5 | 0.7 | 5.14 | 28.68 | 39.05 | 19.25 | 7.18 |
| Region 6 | 1.48 | 6.07 | 23.9 | 37.25 | 21.3 | 10 |
a Polish system of evaluation for soil quality—from I (best) to VI (worst).
Table 3.
The variance components of triticale grain yield for studied random effects.
| Random Effect | Moderate-Input Crop Management (MIM) | High-Input Crop Management (HIM) | ||||
|---|---|---|---|---|---|---|
| Variance Components | P Value | Percent of Total Variance | Variance Components | P Value | Percent of Total Variance | |
| year | 0.231 | 0.005 | 11.2 | 1.030 | 0.000 | 37.9 |
| region | 0.630 | 0.001 | 30.5 | 0.082 | 0.054 | 3.0 |
| cultivar | 0.170 | 0.042 | 8.2 | 0.149 | 0.045 | 5.5 |
| year:region | 0.648 | 0.000 | 31.4 | 1.057 | 0.000 | 38.9 |
| year:cultivar | 0.118 | 0.075 | 5.7 | 0.087 | 0.071 | 3.2 |
| cultivar:region | 0.060 | 0.143 | 2.9 | 0.050 | 0.145 | 1.8 |
| year:cultivar:region | 0.210 | 0.035 | 10.2 | 0.261 | 0.003 | 9.6 |
Table 4.
The results of the superiority measure of yielding (Pi) for 12 triticale cultivars, separately for two crop managements through six regions. There is a ranking of cultivars in brackets.
Table 4.
The results of the superiority measure of yielding (Pi) for 12 triticale cultivars, separately for two crop managements through six regions. There is a ranking of cultivars in brackets.
| Cultivars | Moderate-INPUT CROP MANAGEMENT (MIM) | High-Input Crop Management (HIM) |
|---|---|---|
| AGOSTINO | 1.05 (12) | 1.19 (12) |
| ALEKTO | 0.46 (8) | 0.55 (10) |
| ALGOSO | 0.17 (4) | 0.01 (1) |
| ALIKO | 0.28 (6) | 0.19 (5) |
| BALTIKO | 0.98 (10) | 0.47 (8) |
| GRENADO | 0.59 (9) | 0.59 (11) |
| LEONTINO | 1.02 (11) | 0.48 (9) |
| PIGMEJ | 0.23 (5) | 0.39 (7) |
| PIZARRO | 0.10 (2) | 0.18 (4) |
| SORENTO | 0.10 (1) | 0.04 (2) |
| TODAN | 0.49 (7) | 0.27 (6) |
| TRISMART | 0.15 (3) | 0.06 (3) |
© 2020 by the authors. Licensee MDPI, Basel, Switzerland. This article is an open access article distributed under the terms and conditions of the Creative Commons Attribution (CC BY) license (http://creativecommons.org/licenses/by/4.0/).
Share and Cite
MDPI and ACS Style
Derejko, A.; Studnicki, M.; Wójcik-Gront, E.; Gacek, E. Adaptive Grain Yield Patterns of Triticale (×Triticosecale Wittmack) Cultivars in Six Regions of Poland. Agronomy 2020, 10, 415. https://doi.org/10.3390/agronomy10030415
AMA Style
Derejko A, Studnicki M, Wójcik-Gront E, Gacek E. Adaptive Grain Yield Patterns of Triticale (×Triticosecale Wittmack) Cultivars in Six Regions of Poland. Agronomy. 2020; 10(3):415. https://doi.org/10.3390/agronomy10030415
Chicago/Turabian StyleDerejko, Adriana, Marcin Studnicki, Elżbieta Wójcik-Gront, and Edward Gacek. 2020. "Adaptive Grain Yield Patterns of Triticale (×Triticosecale Wittmack) Cultivars in Six Regions of Poland" Agronomy 10, no. 3: 415. https://doi.org/10.3390/agronomy10030415
Note that from the first issue of 2016, this journal uses article numbers instead of page numbers. See further details here.