Defining features of diverse and productive agricultural systems: An archetype analysis of U.S. agricultural counties
 Katherine S. Nelson
 Emily K. Burchfield
- 1Department of Geography and Geospatial Sciences, Kansas State University, Manhattan, KS, United States
- 2Department of Environmental Sciences, Emory University, Atlanta, GA, United States
Prior research suggests that greater spatial diversity in crops and land use is associated with higher crop yields and improved ecosystem function. However, what leads to the emergence of agricultural systems that meet both productivity and ecological health goals remains an open question. Understanding the factors that differentiate these places from other agricultural systems is key to understanding the mechanisms, pathways, consequences, and constraints to employing diversification as a tool for increasing agricultural sustainability. In this study, we employ archetype analysis to examine the factors uniquely associated with the conjoint existence of high crop diversity and high crop productivity. We identify five agricultural system classes that represent a range of diversity and productivity combinations using k-means cluster analysis then use random forests analysis to identify factors that strongly explain the differences between the classes—describing different agricultural production regimes. Our exploratory analysis of the difference in agricultural system factors across classes suggests (1) crop diversity and its preconditions are associated with the highest yields, (2) biophysical conditions bound diversity-productivity realities, (3) productivity comes at a petrochemical cost, and that (4) crop rotations are a key diversification strategy. Overall, our results suggest that despite clear biophysical constraints on transitions to high diversity—high productivity systems the role of actionable factors on crop production regimes is stronger, providing reason to be hopeful about transitions to agricultural production regimes fit for new climate realities.
1. Introduction
Agricultural expansion and specialization have led to dramatically simplified landscapes over the last 200 years (Aguilar et al., 2015; Khoury et al., 2016; Landis, 2017). This is particularly true in the United States (U.S.), where agriculture now accounts for over 50% of land area, and where more than 60% of this agricultural land is cultivated with one of three crops: corn, soy, or wheat (Bigelow and Borchers, 2017; Spangler et al., 2020; Crossley et al., 2021). While average crop diversity across the US has been relatively stable since 2000, the number of crops grown remains dramatically lower than what was observed in the late 1800s and early 1900s despite much higher area of extent under cultivation (Aguilar et al., 2015; Crossley et al., 2021). This simplification of agricultural landscapes—in terms of the loss of natural and semi-natural habitat or a reduction in the number of crops grown—has been shown to adversely affect ecosystem services that support crop production including pollination, pest management, water retention, nutrient supply and soil health, thereby threatening the long-term productivity of agricultural systems (Swift et al., 2004; Zhang et al., 2007; Smith et al., 2008; Grab et al., 2018; Karp et al., 2018; Dainese et al., 2019; Garland et al., 2021; Hemberger et al., 2021). For example, Hemberger et al. (2021) find that richness and occurrence of a key pollinator in the U.S., bumblebees, has declined with reductions in regional crop diversity. Similarly, in a global meta-analysis, Dainese et al. (2019) report that reductions in natural and seminatural area around crop fields are associated with declines in natural predator and pollinator richness and abundance.
A growing body of research suggests that in addition to boosting ecological health, agricultural diversification is associated with multiple agricultural benefits. First, field-scale research suggests that increased crop diversity may reduce the need for chemical inputs (Redlich et al., 2018; Thomine et al., 2022), supporting ecosystem health while also reducing on-farm expenses. Relatedly, agricultural experiments and landscape-scale studies suggest that increasing crop diversity and natural habitat near crop fields are associated with higher crop yields (Smith et al., 2008; Grab et al., 2018; Burchfield et al., 2019; Dainese et al., 2019; Galpern et al., 2020; Garland et al., 2021) and increased yield stability (Redhead et al., 2020; Nelson et al., 2022). More diverse agricultural landscapes are also associated with higher financial returns (Sánchez et al., 2022), reduced farm economic volatility (Abson et al., 2013), and more stable national food supplies (Renard and Tilman, 2019).
Prior research has examined determinants of crop productivity (Lobell and Gourdji, 2012; Elliott et al., 2014; Zhao et al., 2017; Mourtzinis et al., 2020; Burchfield and Nelson, 2021), described trends in crop diversity (Aguilar et al., 2015; Goslee, 2020; Crossley et al., 2021; Spangler et al., 2022b), and evaluated the relationship between these two agricultural system attributes (Burchfield et al., 2019; Nelson and Burchfield, 2021; Spangler et al., 2022b). However, there is little research exploring the emergence of systems that are both diverse and productive, crucially meeting both agricultural and ecological goals. For example, Pardey and Alston (2021) describe trends in US farm productivity and suggest that new technologies (including machinery and chemical inputs), farm consolidation, and regulations led to the emergence of high productivity agricultural systems between the early to mid-1900s. On the other hand, in a study of a US region with relatively high crop diversity, Spangler et al. (2022a) find that diversity in the region is strongly driven by crop rotations associated with established crop markets and that further diversification is disincentivized by the current regulatory environment. While treated separately, the factors associated with productive and diverse agricultural systems are likely interrelated. For example, Mourtzinis et al. (2020) find that up to 67% of average yield in the US Midwest can be explained by regional soil and climate characteristics; however, in many contexts, these same biophysical conditions may also constrain crop diversity by limiting cultivation choices for farmers. Similarly, access to specific equipment or inputs can support production outcomes while constraining on-farm cultivation possibilities (Vanloqueren and Baret, 2009; Rissing, 2016; Clapp, 2021).
Relatedly, there is a need to understand the potential consequences for farmers (both benefits and costs) of productive and diverse agricultural realities. Historically, industry advocacy and government programs have strongly incentivized the cultivation of a small subset of intensively managed commodity crops (McGranahan et al., 2013). This has encouraged crop specialization and farm consolidation (Lowder et al., 2016; Key, 2019; Pardey and Alston, 2021), creating increasingly simplified agricultural landscapes in which large areas are cultivated with a single crop (Spangler et al., 2022b). These systems are highly efficient and productive (Drache, 1976; Raup, 1978; Duffy, 2009; Spangler et al., 2020); however, many of these systems are also heavily dependent on government support (Burchfield and Nelson, 2021; Spangler et al., 2022b), are often not associated with positive livelihood outcomes (Dürr, 2016; Burchfield et al., 2022), and can be less resilient to environmental stressors (Annan and Schlenker, 2015).
The conditions that enable or support the emergence of agricultural systems that can support a diversity of cultivation realities and better ecosystem health, while also meeting crop productivity goals remains under examined. Identifying these conditions is key to understanding pathways toward employing crop diversification as a tool for increasing agricultural sustainability. This is particularly important in the context of climate change—where transitions in agricultural production regimes are not just advisable but will ultimately be a necessity—as biophysical suitability for crop production shifts across regions and the globe (Zhao et al., 2017; Burchfield, 2022) and productivity growth from technological advances and chemical inputs continues to decline (Burchfield and Nelson, 2021; Pardey and Alston, 2021). In this study, we employ archetype analysis to examine the factors uniquely associated with the conjoint existence of high crop diversity and high crop productivity agricultural systems and contrast these systems with counties with alternate crop production regimes. Our analyses provide information about constraints, benefits and tradeoffs, and opportunities for diversification of crop production systems. In addition to identifying enabling conditions and potential drivers that lead to diverse and productive systems, and potential positive outcomes associated with such systems, we identify pathways for transitioning toward more diverse and productive systems.
2. Methods
We applied k-means clustering to county-level indicators of land use and yields of major commodity crops (corn, soy, winter wheat, hay, and alfalfa) to produce a diversity-productivity typology. This typology distills five commonly found intersections of crop diversity and crop productivity across the US: high diversity and productivity (HD-HP), low diversity and productivity (LD-LP), high diversity and low productivity (HD-LP), low diversity and high productivity (LD-HP), and average diversity and productivity (AVE). We then employed random forests analysis to detect the biophysical, agricultural, and socioeconomic attributes that most strongly predict a county's diversity-productivity class within this typology. We also conducted national descriptive analyses to compare these attributes across each of the five diversity-productivity classes.
2.1. Crop productivity
To operationalize crop productivity, we constructed panel datasets merging United States Department of Agriculture (USDA) National Agricultural Statistics Service (NASS) Survey yield estimates with local indicators of weather and soil characteristics for all U.S. counties cultivating alfalfa, corn, hay, soy, or (winter) wheat from 2008 to 2018. We excluded any counties with fewer than three yield observations over this period. We constructed two seasonal weather indicators—growing degree days (GDDs) and total precipitation (TP)—from daily gridded four-kilometer temperature and precipitation data provided by the PRISM Climate Group (2014). Season duration was defined using the spatially explicit, crop-specific planting and harvesting dates provided by Sacks et al. (2010). GDDs—an indicator of cumulative temperature exposure—is the sum of mean daily temperatures above a crop-specific threshold over the crop's growing season,1 while TP is the sum of precipitation (in millimeters) throughout the growing season. To control for the effects of irrigation on agricultural production, we also collected county-level data describing the percent of agricultural land irrigated (USDA NASS, 2020). In counties reporting percent agricultural land irrigated, we replaced missing values through time with linearly interpolated estimates from the MiRAD project (Pervez and Brown, 2010), which we standardized by agricultural extent estimates from the USDA's Cropland Data Layer. We constructed county-level indicators of soil characteristics using four variables from the Harmonized World Soil Database (Nachtergaele et al., 2009): topsoil pH, topsoil organic carbon, topsoil cation exchange capacity, and topsoil exchangeable sodium percentage.
As described by Burchfield and Nelson (2021), we quantified crop productivity as the extent to which—given biophysical conditions, regional norms, and national yield trends—a county's yields have diverged from national averages over the last decade. Specifically, we used Bayesian hierarchical models that control for biophysical conditions, regional norms, and national temporal trends to isolate the extent to which a county's yields differed from national averages over the last decade (see Burchfield and Nelson, 2021 for more detail). Lower values indicate that yields of corn, soy, winter wheat, hay, and alfalfa are lower than expected given local climate, soil conditions, water access, national yield trends, and regional yield norms, while higher values indicate yields that are surprisingly high given the same constraints. This approach allows us to isolate spatial variability in yields unexplained by the biophysical, isolating the influence of human activities on yield (Burchfield and Nelson, 2021). These yield residuals capture actionable determinants of productivity that can be altered by farmer decisions and government interventions.
2.2. Crop diversity
To operationalize crop diversity, we constructed an indicator of crop diversity (Shannon Diversity Index) from the USDA Cropland Data Layer—a 30 m annual land use dataset based on satellite imagery and extensive ground truth data—for all counties in the coterminous U.S. and all years from 2008 to 2018 (USDA CropScrape, 2018). The Shannon Diversity Index measures the proportional abundance of each land use category in a given region (in this case counties) in terms of the abundance and evenness of land-cover categories (McGarigal, 1995). To create our diversity-productivity typology, crop diversity was operationalized as the average of the Shannon Diversity Index in each county across all years.
2.3. Building a diversity-productivity typology
Our typology was built using k-means cluster analysis on our county-scale crop diversity and crop productivity metrics. The metrics were standardized using z-scores before running a five-cluster k-means model in R (R Core Team, 2017). To eliminate productivity and diversity value overlap across classes, we identified the subset of counties with diversity and productivity values that do not overlap with values observed in other classes. To do this, we selected counties with crop productivity and crop diversity values either within 1/3 standard deviation of the class mean or more extreme than the class mean (Supplementary Table S1). For example, to belong to the high diversity and high productivity subset, a county had to have values of both crop diversity and crop productivity that were greater than or equal to the class mean minus the class standard deviation divided by three (see the Supplementary material for more information). We refer to these counties as archetypal counties (n = 520), or the counties that represent the most characteristically high diversity and high productivity (HD-HP), low diversity and high productivity (LD-HP), low diversity and low productivity (LD-LP), high diversity and low productivity (HD-LP), or average (AVE) cropping systems in the U.S.
2.4. Agricultural system attributes
To detect the attributes that most strongly predict a county's diversity-productivity class, we collected additional county-level data describing biophysical conditions, farm management decisions, land use change, regional socioeconomic conditions, farmer characteristics, and farmer livelihood from several sources (Supplementary Table 2). Indicators of farm management decisions, farmer characteristics, regional socioeconomic conditions, land use change, and farmer livelihoods were collected from the USDA's quinquennial Census of Agriculture (USDA NASS, 2020). For this data source, we included only variables with <10% missing data for the period of interest (Supplementary Table 2). We standardized predictors (where applicable) to facilitate comparison across counties using “total operated acres” which includes agricultural land used for crops, pasture, or grazing, as well as woodlands, farm roads, and farm buildings.
Measures of crop processing and grain storage infrastructure density were constructed using data on the number of relevant business records (according to SIC industry codes) in each county from DataAxle Reference Solutions© (Supplementary Table 3) to reflect regional socioeconomic conditions. In addition, a farm management decision measure of EQIP conservation program participation was constructed for each county using individual practice level records from 2009 to 2018 made available by Basche et al. (2020). Practices that focus on improvement of land and soil conditions were selected (Supplementary Table 4) and the average total acres in a program for each county, between 2009 and 2018, was computed. This acreage value was normalized using total operated acres in each county. Economic data was obtained from the U.S. Bureau of Economic Analysis (BEA) (2021) and used to compute regional socioeconomic condition and farm management decision measures of county population, percent of jobs that are on farms, percent of county GDP from agriculture, and percent of agricultural receipts from livestock in each county-year. Biophysical condition measures2 were obtained from the sources described above and from the 3D Elevation Program (US Geological Survey, 2019). Land use change measures were obtained from Census of Agriculture or calculated from the Cropland Data Layer using the landscapemetrics R package (Hesselbarth et al., 2019). Finally, farm management decisions about crop rotations were represented using a metric of rotational diversity calculated from the Cropland Data Layer as the county average of the count of unique crops planted on a pixel between 2008 and 2018. This estimate of rotational richness gives an approximation of the relative use of crop rotations in counties in our sample. Annual and quinquennial measures were averaged to produce an average value for each county between 2008 and 2018.
2.5. Diversity-productivity class attributes
We employed random forests classification analysis on our full set of 2,238 counties without any missing agricultural system attribute information to detect the attributes that most strongly predict a county's diversity-productivity class using the randomForest package in R (Liaw and Wiener, 2002). We first used all 56 variables in Supplementary Table 2 to predict county classes; however, because many of these variables are highly correlated, within categories of agricultural system attributes, we iteratively removed collinear variables (based on a bivariate correlation of 0.6 or higher) with lower variable importance until a reduced set of 34 variables with low multicollinearity remained. We then predicted the diversity-productivity class for the subset of archetypal counties using the final set of reduced variables (Throughout we refer to analyses in which data for all counties was used as “full” and analyses that are conducted on the subset of 520 archetypal counties as “archetypal”). Performance of the random forests models was evaluated using OOB error rate, class-specific error rates, as well as overall error rate and class-specific balanced accuracy from cross-validation on a held-out sample (70% of data used for training, 30% for testing). Note that tests using standard random forests with balanced class sizes (equally sized random samples from each class) and conditional permutation-based random forests modeling produced similar results (Strobl et al., 2008). For both the random forest analysis with the full dataset and with the subset of archetypal counties, we also examined the predictive accuracy of the random forests model across counties to determine if there were spatial patterns in classification accuracy. The predictive accuracy for each county was calculated as the proportion of random forest trees (from 500 iterations) in which the assigned k-means class was correctly predicted using the agricultural system attribute variables. Spatial patterning in classification accuracy may be partially a factor of imbalance in the sample size for each class and the locations of each class but may also be related to limits in the ability of our data to represent all agricultural systems in the U.S. equally well.
Random forests classification does not establish causal relationships, but instead identifies strong associations county attributes and diversity-productivity class. The association between the diversity-productivity typology we constructed and agricultural system attributes could reflect forces driving diversity or productivity outcomes, consequences of diversity or productivity regimes, or secondary effects correlated with productivity and diversity norms. For example, largest patch index is a measure of landscape configuration complexity, which is distinct from, but related to, crop diversity. Landscape complexity itself is a function of land cover and is therefore driven by land use change, much as crop diversity is driven by agricultural land use change. Therefore, landscape complexity is not necessarily a driver of county diversity-productivity class or a consequence of county diversity-productivity class but is instead an associated factor that describes the structure of the landscape—the arrangement of land uses—in counties of different types. To determine specific agricultural system factors that differentiate classes, we used descriptive data analysis to explore the distinguishing features of diversity-productivity classes. This analysis provides additional insights into potential drivers, consequences, and secondary effects of the type of agricultural production practices in these counties.
3. Results
The existence of agricultural systems with both high agricultural diversity and productivity may be the result of biophysical conditions that enable both high yields and high diversity in the same location or the result of driving forces such as land use change, agricultural management, and other socioeconomic and structural factors. We consider places with both high levels of diversity and high levels of crop productivity to be “bright spots” that meet productivity goals and (to a certain extent) tend closer to ecological goals. Understanding the factors that differentiate these places from other agricultural systems is key to understanding the mechanisms, pathways, consequences, and constraints to employing diversification as a tool for increasing agricultural sustainability.
In what follows we describe our typology based on overall productivity across five major commodity crops (corn, soy, wheat, hay, alfalfa) and compositional diversity of agricultural land cover using the Shannon Diversity Index. We then report the results of random forests analyses that identify factors that strongly explain the differences between classes in the typology when examining all counties and when examining only strongly archetypal counties. Lastly, we use exploratory data analysis to identify factors that might explain productivity differences in places with shared high levels of diversity and factors that may explain differences in diversity in places with shared high levels of productivity.
3.1. K-means
The k-means analysis on the full dataset of US agricultural counties produced five classes of counties based on their diversity and productivity levels. The class means for diversity and productivity (Table 1) suggest that counties in each class can be generally identified as either high diversity—high productivity (HD-HP), high diversity—low productivity (HD-LP), low diversity—high productivity (LD-HP), low diversity—low productivity (LD-LP), or average (AVE). These classes tend to be regionally consistent—occurring in spatially contiguous clusters in space and reflecting regional differences in agricultural norms (Figure 1). The LD-HP class is primarily located in the Midwestern U.S. in the Heartland Farm Resource Region (Supplementary Figure 1), an area known for its monoculture production of corn and soy. Counties belonging to the HD-HP class are primarily located within USDA's designated Fruitful Rim and Southern Seaboard Farm Resource Regions in the Southeast and Northwest of the U.S. Meanwhile counties classified as HD-LP are found primarily in the Northern Great Plains while counties in the LD-LP are mostly located in the Prairie Gateway (around the Ogallala aquifer) and Basin and Range regions. Interestingly, AVE counties are located primarily between LD-HP counties and other types, suggesting possible spatial autocorrelation in regional production norms.
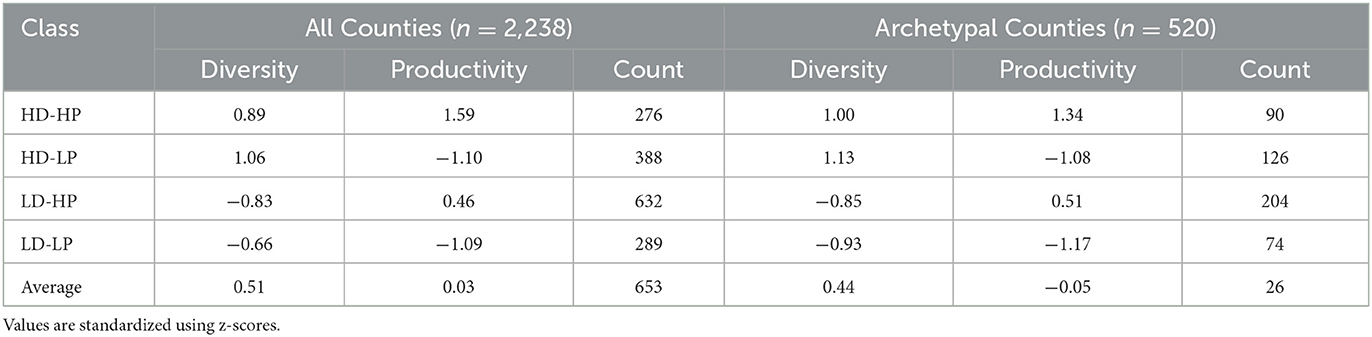
Table 1. Class means for diversity and productivity and count of counties with complete agricultural system attribute information in each class for all counties and for the subset of archetypal counties.
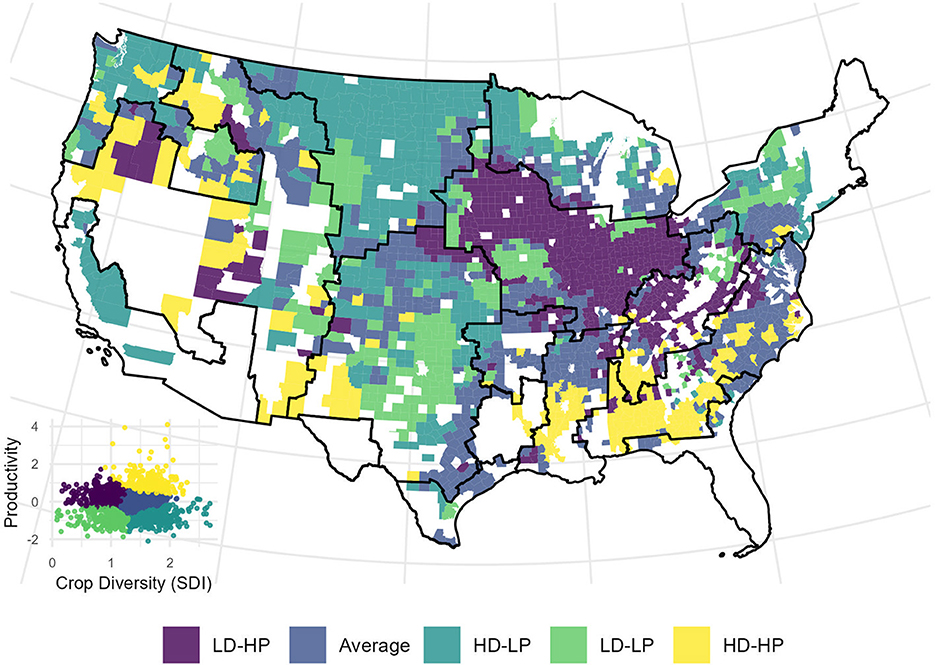
Figure 1. Spatial distribution of county types specified using k-means cluster analysis and scatter plot (inset) of diversity and productivity for each class. Black borders indicate boundaries for USDA Farm Resource Regions (FRRs).
When examining the scatter plot of diversity-productivity values for each county and their assigned class from the k-mean analysis (Figure 1) it is apparent that even though the class means align with contrasting diversity-productivity profiles it is not uncommon for counties in each of these classes to have a characteristic that does not conform with our generalized naming convention. For example, some counties in the class we have named HD-HP have lower diversity values than some counties in the LD-HP class. In short, while the k-means classification system identifies counties that are most alike in terms of diversity and productivity, it provides an imperfect representation of the profiles of interest.
To examine counties that are the most strongly associated with each diversity-productivity class—i.e., those that are archetypal of each class—we removed counties with values of diversity or productivity that overlap with values observed in other classes. For example, HD-HP classified counties with diversity levels lower than those in the LD-HP, LD-LP, or AVE class were dropped from subsequent analyses. The removal of these counties resulted in a pattern of distinct, isolated, spatial clusters of different diversity-productivity classes (Figure 2). Because the k-means process used to develop this classification is agnostic with respect to location, this again suggests that the conjoint occurrence of diversity-productivity outcomes is spatially auto correlated.
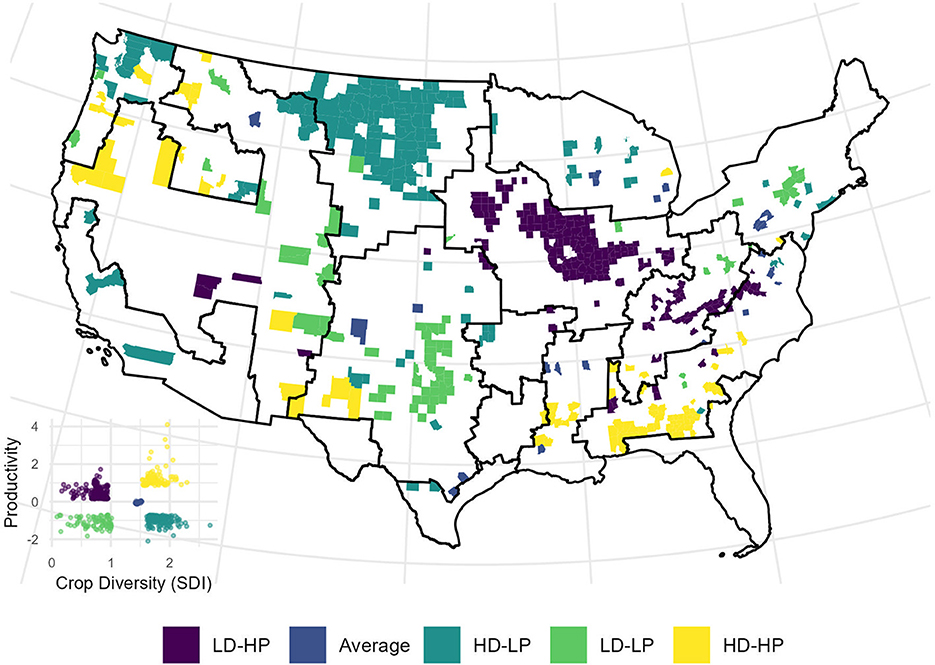
Figure 2. Spatial distribution of the subset of archetypal counties and scatter plot (inset) of diversity and productivity for each class. Black borders indicate boundaries for USDA Farm Resource Regions (FRRs).
3.2. Random forests
We used random forests classification to identify the agricultural system attributes most strongly associated with the diversity-productivity typology both for the full set of agricultural counties and the subset of archetypal counties. The random forests analyses suggest that attributes most predictive of a county's diversity-productivity class are related to local biophysical conditions (e.g., growing degree days, total precipitation, elevation, and soil cation exchange capacity) and on-farm management decisions (e.g., herbicide application, rotational diversity, machinery expenses) (Figures 3, 4). The overwhelming importance of biophysical conditions in shaping agricultural realities persists despite controlling for biophysical conditions in our measure of crop productivity. Some land use attributes (e.g., percent natural cover and percent of county area devoted to agriculture) are moderately associated with county class while regional socioeconomic characteristics, farmer characteristics, and on-farm livelihood indicators are weakly associated with county class. These findings generally hold true for models with all county locations and for models with only archetypal counties. One notable difference is that the archetypal results suggest that rotation diversity (an on-farm management decision factor) and not seasonal growing degree days is the strongest predictor of archetype class (Figure 4). In addition, herbicide use has higher variable importance than any biophysical factor in the analysis of archetypal counties, as compared to biophysical factors (growing degree days and total precipitation) in the full set of counties. These differences in variable importance exist despite similar distributions for these factors in both the full and archetypal datasets.
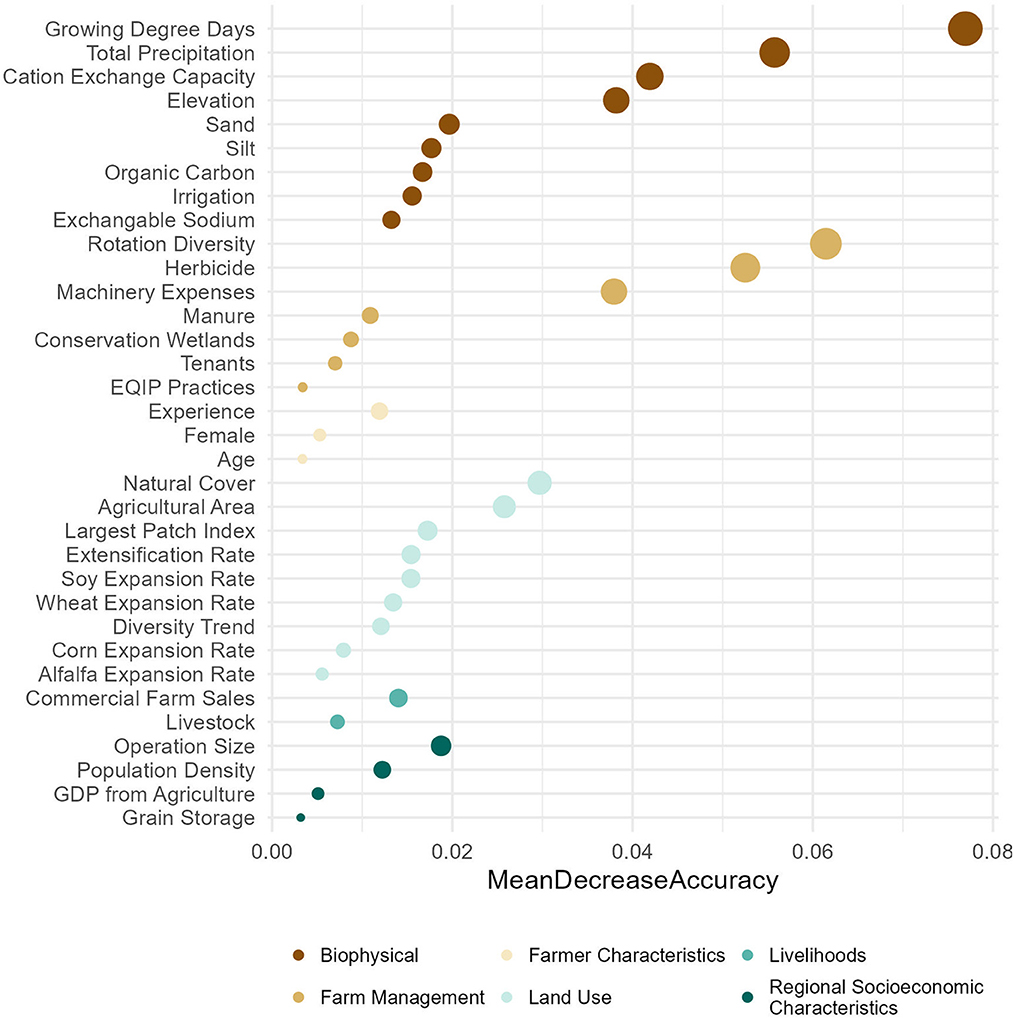
Figure 3. Variable importance for random forests classification analysis using a 70% random sample of all counties (n = 1,567).
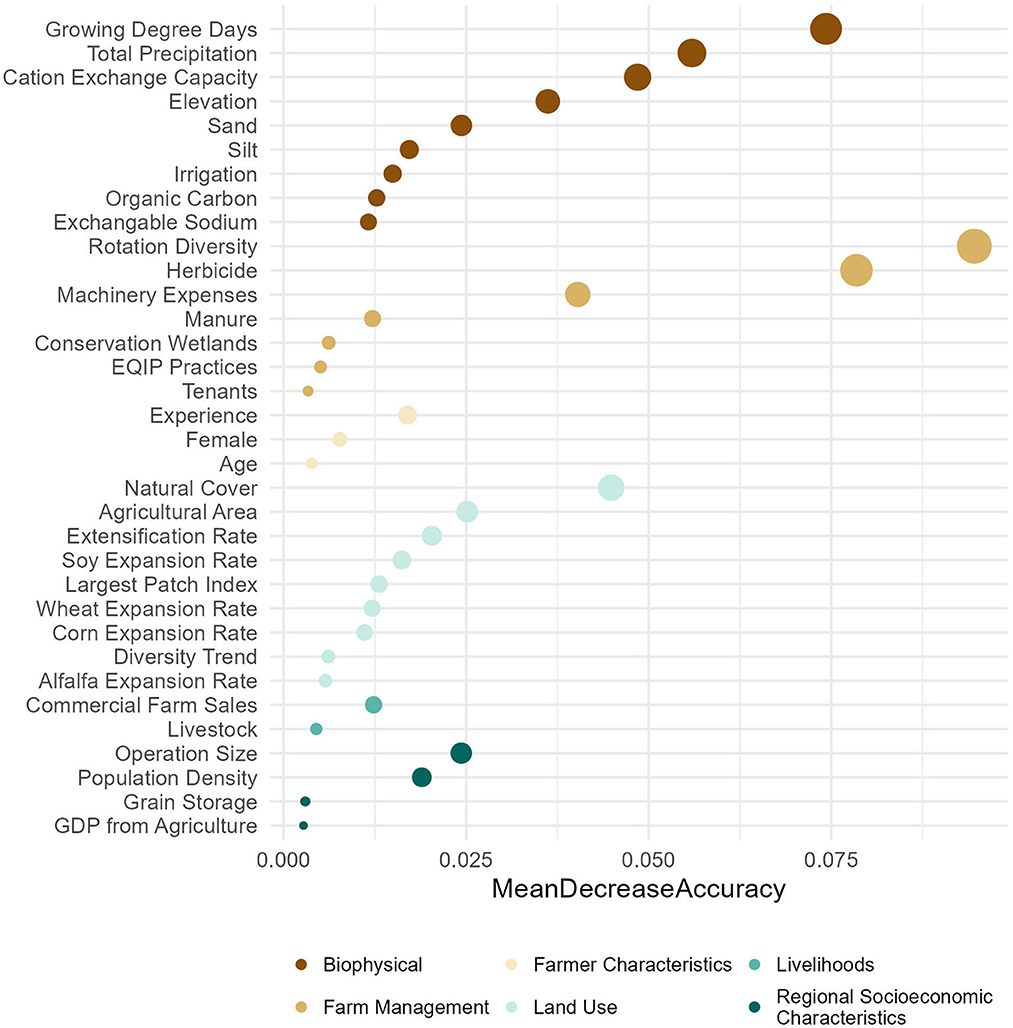
Figure 4. Variable importance for random forests on a 70% random sample of the subset of archetypal counties (n = 364).
The random forests analyses performed reasonably well at classifying counties using the agricultural system attributes. The classification accuracy for the full set of agricultural counties is ~75%; however, the class-specific accuracy is much higher for the more numerous LD-HP counties than other counties at ~91% (Table 2). Classification accuracy also varies across space, displaying clear spatial autocorrelation where classification accuracy tends to decline with increasing distance from the center of a cluster of a single class (Supplementary Figure 2). While the classification accuracy is fairly low, it is significantly better than a 20% accuracy which would be expected for random assignment of five classes. The classification accuracy of the random forests model using only archetypal counties is substantially better than that observed for the model with all counties. The overall accuracy rate for archetypal county classification is ~88% with more balanced class-specific classification accuracy where the balanced accuracy is 97% for LD-HP counties and 86% for HD-HP counties. Despite the removal of counties with overlapping diversity or productivity characteristics in the archetypal county analyses, clear spatial patterns in classification accuracy are still observed (Supplementary Figure 3). Overall, the random forests analysis suggest that some agricultural system attributes are strongly associated with, and predictive of, diversity-productivity classes. The consistency of these attributes at predicting diversity-productivity class is suggestive of the presence of different agricultural production regimes—consistent configurations of biophysical, social, economic, and regulatory factors that define the organization of the system. However, the non-random spatial variation in classification accuracy suggests that the standard set of factors examined in the random forest analyses does not describe the agricultural system equally well in all counties.
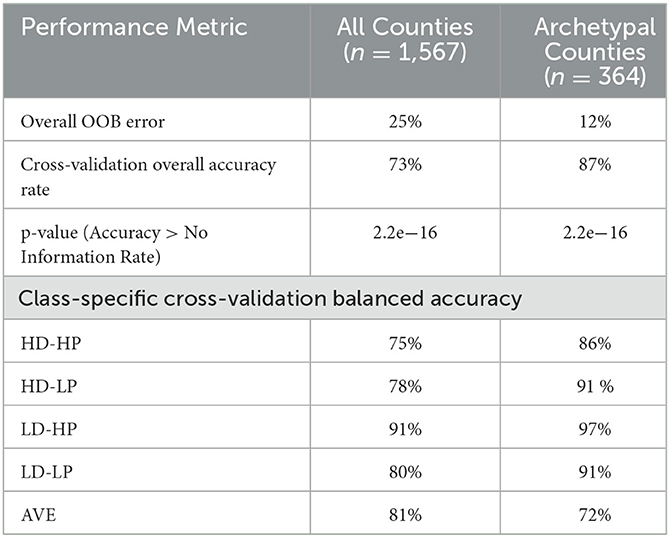
Table 2. Random forests analysis performance metrics.
3.3. Descriptive class attribute comparison
While random forests can identify the agricultural system attributes most predictive of a county's diversity-productivity class, additional analyses are needed to determine which specific factors differentiate the five classes. We employed exploratory data analysis to identify the distinguishing features of classes. This analysis provides additional insights into factors that drive or enable the development of diverse and productive (or vice versa) agricultural landscapes. This analysis also provides insight into possible consequences, for farmers or ecosystems, of different agricultural production paradigms. As we are most interested in identifying the enabling factors that support the emergence of diverse and productive counties as well as the levers that may be used to transform LD-HP and HD-LP counties into HD-HP counties, we focus our descriptive analysis on factors that show notable differences across archetypal HD-HP, LD-HP, and HD-LP counties (comparisons across all classes and variables are provided in the Supplementary material).
3.3.1. Biophysical
We find that soil conditions, temperatures, and precipitation distributions vary across classes (Figure 5A and Supplementary Figure 4). Specifically, HD-HP counties tend to have better growing conditions for many crops: warmer growing season temperatures (higher GDD values), lower silt levels, lower cation exchange capacity, higher average (though highly variable) sand levels, more irrigated land, and higher total precipitation when compared to the other four county types. This suggests that HD-HP cropping systems are made possible in part by the presence of biophysical conditions that are highly favorable for crop production and that offer greater flexibility in crop choice. Biophysically, LD-HP counties and HD-HP are fairly similar—the most striking differences between these two groups are in growing degree days and irrigation access, with HD-HP counties having higher average levels of both. This suggests that key target crops for diversification should be able to tolerate the lower GDDs in LD-HP areas and have reduced irrigations needs. In contrast, HD-LP counties tend to have higher levels of cation exchange capacity and amount of topsoil silt, higher elevations, and lower levels of total precipitation and GDD, suggesting crop production in these areas may be constrained by water availability, soil quality, and topography.
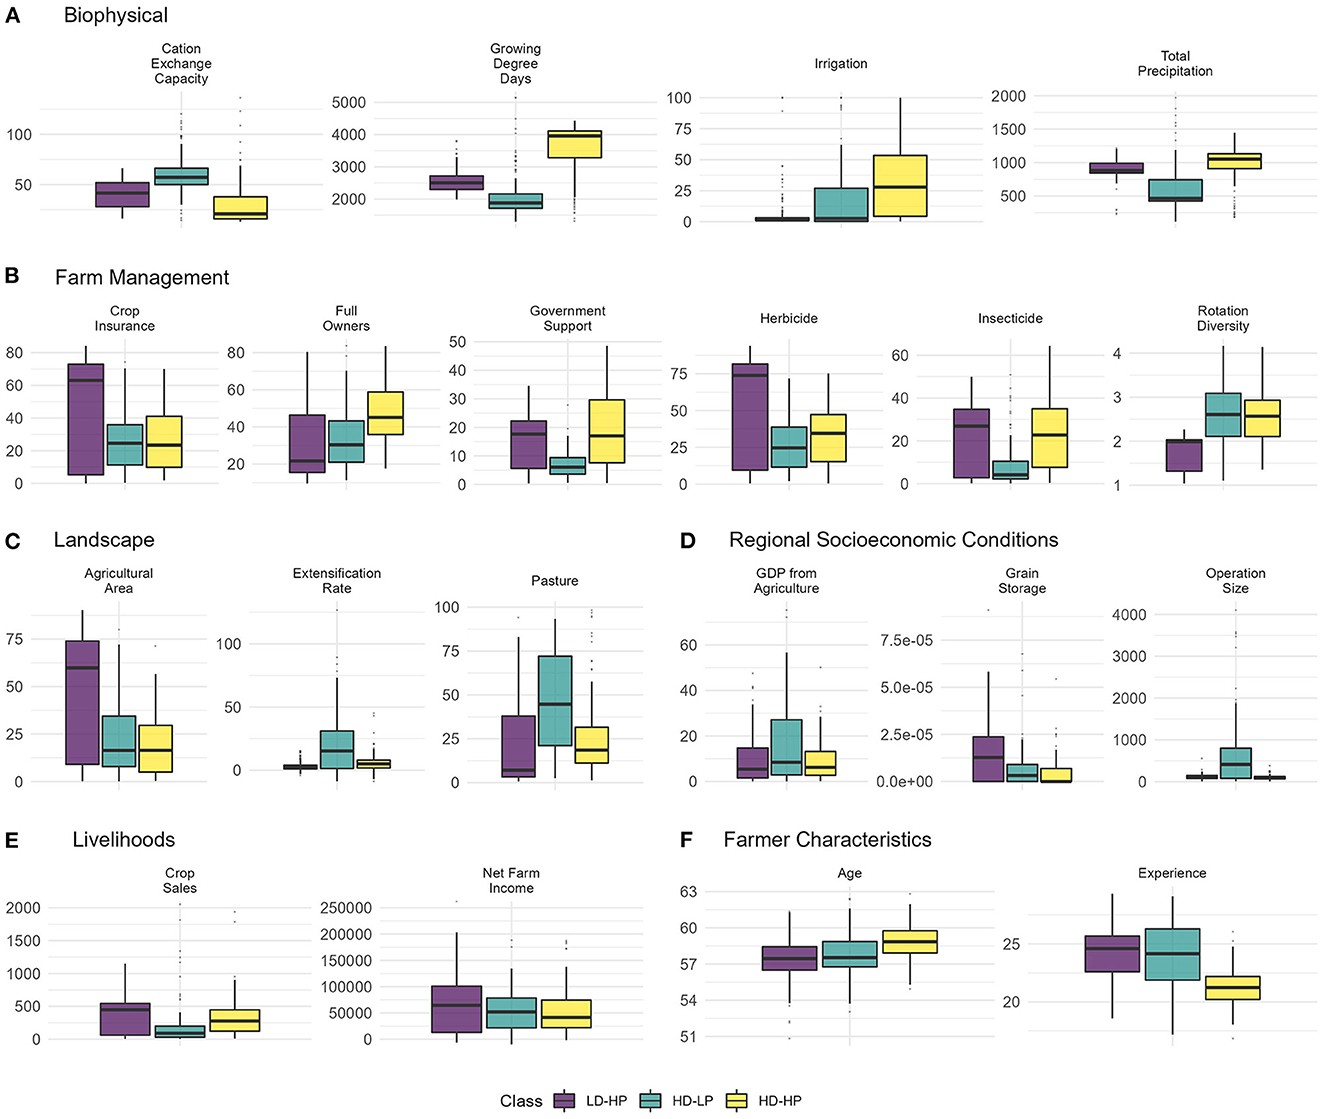
Figure 5. (A–F) Select box and whiskers plots comparing agricultural system attributes across LD-HP, HD-LP, and HD-HP for archetypal counties.
3.3.2. Farm management
Unsurprisingly, counties classified as LD-HP are associated with higher application rates of herbicides and fertilizer, higher rates of crop insurance coverage, higher expenditures on machinery, lower rotational diversity, and lower rates of participation in EQIP conservation programs relative to other classes (Figure 5B and Supplementary Figure 5). Conversely, HD-LP counties are associated with lower machinery and labor expenditures, lower chemical inputs, and higher rates of tenancy and part ownership of operated land. HD-HP counties report higher rates of EQIP and conservation acreage than LD-HP counties but show similar distributions as the LD-HP counties for government funding (other than crop insurance) and acres to which insecticide is applied. They also exhibit high levels of labor expenses and higher rates of full ownership of operated acres.
3.3.3. Land use and landscape characteristics
Landscapes in counties classified as LD-HP are dominated by large-scale crop production as reflected in larger agricultural patch sizes, higher rates of agricultural land cover, less land devoted to pasture, and less natural cover (Figure 5C and Supplementary Figure 6). Many of these counties are located in the Midwestern US and are dominated by corn and soy production (Supplementary Figure 6). The low productivity HD-LP class has a relatively high percent of county area dedicated to pasture. Diverse counties (HD-HP and HD-LP) tend to have experienced recent expansion in agricultural area and have high edge distance, which indicates a high degree of complexity in the arrangement of land uses that may be created by irregular field shapes and linear features such as riparian buffers, prairie strips, or hedgerows. However, agricultural expansion is more pronounced in HD-LP areas, which have also experienced large growth in alfalfa, corn, and hay acreage. This expansion of agricultural areas in HD-LP counties has been accompanied by a strong increase in landscape diversity. The HD-HP class on the other hand, shows a slight reduction in landscape diversity over the last decade.
3.3.4. Regional socioeconomic conditions
In terms of regional socioeconomic conditions, we find that counties classified as LD-HP tend to have a high grain storage facility density relative to other counties. This reflects the dominance of big commodity crops in these counties and the importance of storage infrastructure for large-scale grain production (Figure 5D). Counties classified as HD-LP tend to have the largest farm operations, perhaps suggesting that crop production in these lower producing areas has been more economically feasible via economies of scale. Both high diversity and high productivity counties (HD-HP, HD-LP, and LD-HP) tend to have a high percent of county GDP from agriculture relative to the other classes. Put another way, the percent of a county's GDP that comes from agriculture, and hence the importance of agriculture to the local economy, is low in the average and LD-LP counties, relative to other county types (Supplementary Figure 7).
3.3.5. Livelihoods
Unsurprisingly, productive places (the HD-HP and LD-HP counties) tend to be associated with the highest crop sales per acre (Figure 5E). However, both productive places and diverse places (HD-HP, HD-LP, and LD-HP), show relatively high total commercial sales and incomes (Supplementary Figure 8). The HD-HP counties have a very small proportion of farm receipts from livestock sales relative to other counties reflecting a strong emphasis on crop production (Supplementary Figure 8). Relatedly, slightly higher farm incomes in HD-LP and LD-HP counties than in HD-HP counties may be the result of increased livestock/animal production in the HD-LP and LD-HP counties that provides some economic diversification. Overall, these trends suggest that outcomes related to farmer wellbeing are not significantly different across counties with high production or high diversity. In other words, the challenges of managing diversified cropping systems do not necessarily result in reduced net farmer income.
3.3.6. Farmer characteristics
While differences in farmer characteristics across classes are generally not significant, farmer age appears to be higher in HD-HP counties, while farmer experience tends to be higher in counties classified as LD-HP and HD-LP (Figure 5F). Notably, the difference in experience between the LD-HP and HD-HP classes is significant, indicating that farmers in HD-HP counties usually have less experience than farmers in LD-HP counties. Again, while the trends are not statistically significant, the LD-HP class shows the lowest average level of female farmers (Supplementary Figure 9).
4. Discussion
In the ongoing debate on the role of diversification in promoting sustainable agricultural systems, an unanswered question is what distinguishes counties that have successfully maintained high crop diversity and high crop productivity from those that are not diverse or productive. Our analyses suggest that actionable agricultural system attributes including on-farm management, federal support, and agricultural infrastructure as well as non-actionable biophysical conditions are strongly predictive of productivity-diversity outcomes. Moreover, archetypal counties are more strongly predicted by human, on-farm, decision-making than by biophysical conditions. This suggests that, given climate and soil conditions, farmers are making additional choices that render their county unusually diverse or productive. That actionable factors play the strongest role in distinguishing major agricultural production regimes across the US is promising as it suggests significant agricultural production regime transitions fit for new climate realities are feasible.
Notably, we find that commodity crop production regimes are strongly spatially autocorrelated across counties, highlighting centers of activity that have a regional “zone of influence” (Supplementary Figure 10) and reflecting well-established regional economic geographies of agriculture. While there are certainly differences, our typology clearly concords with the USDA's Farm Resource Regions (Supplementary Figure 1) that were delineated using cluster analysis of farm characteristics, farm production regions, land resource regions, and crop reporting districts [Economic Research Service (ERS), 2000]. The autocorrelation observed corroborates prior work finding that cultivation regimes are strongly shaped by meso-scale spatially-autocorrelated realities (Spangler et al., 2022b) and highlights the importance of landscape or regional coordination and planning for agricultural production regime transitions. In addition, our findings suggest that many counties in the US are either in a transitory state (e.g., a high diversity—high productivity county that has recently experienced strong declines in diversity) or belong to a production regime that is not well represented by the national data and public statistics used in our analyses (e.g., counties with a heavy focus on fruit and vegetable crops). The results of our descriptive analyses examining how agricultural system attributes vary across classes point to several characteristics that may constrain agricultural diversification and its benefits, but also highlight paths toward more diversified and beneficial agricultural futures. In what follows, we discuss four major insights from this analysis that can inform pathways toward productive and diverse agricultural futures in the US.
4.1. Finding 1: Crop diversity (and its preconditions) is associated with the highest yields
Yields are higher for counties in the HD-HP class than for any other class, including the LD-HP class. Though crop diversity is not always associated with higher production, much higher levels of production seem to be possible in areas with high crop diversity than in more simplified landscapes. What is most surprising is that these productivity gains are associated with lower rates of petrochemical inputs, lower rates of federal support, and comparable net farm incomes. This suggests that farmers in these HD-HP regions are reporting higher yields and revenues with fewer inputs to production.
Understanding the specific mechanisms linking crop diversity to high productivity is paramount for the agricultural research community moving forward. While this relationship is explained in part by favorable biophysical conditions, these results suggest that other ecosystem services linked to landscape diversity may be driving the relationship. These results also highlight how areas with optimal soil and climate conditions for major crops (e.g., the Midwest) that are currently devoted to the production of a few crops could be prime targets for future crop diversification efforts. Indeed, as climate change alters the biophysical suitability of production for many crops (Burchfield, 2022), these systems could serve as an important reservoir for future biodiversity. Concerningly, much like Spangler et al. (2022b) we find that HD-HP counties have experienced recent declines in landscape diversity, pointing to the strong influence of the market pressures of the dominant productivist paradigm that led to development of the LD-HP class. This highlights the importance of creating incentives that enable the emergence of new cropping alternatives rather than creating lock-in resulting in brittle, maladaptive cropping regimes (Petersen-Rockney et al., 2021). Increasing the diversity of LD-HP regimes and stopping the slide in diversity in HD-HP regimes will require shifts from federal programs that incentivize commodity lock-in toward programs that support experimentation and diversification (Chapman et al., 2022; Wardropper et al., 2022).
4.2. Finding 2: Biophysical conditions bound diversity-productivity realities
Biophysical conditions tightly constrain conjoint diversity and productivity patterns. Specifically, HD-HP counties have more advantageous access to sun (seasonal growing degree days), soil conditions, and water (higher precipitation and access to irrigation). These ideal biophysical conditions are harnessed through the cultivation of highly productive commodity crops as well as more diversified cropping regimes—as reflected in the dominance of crop production over livestock, higher rates of crop diversity, and high commodity crop yields. That biophysical conditions bound agricultural realities is unsurprising. What is important however, is the implication that transitions toward HD-HP agricultural futures may have strong geographical limitations. Given that many of these HD-HP counties will experience significant shifts in climate conditions over the next century (Burchfield, 2022), opening up possibilities for diversification in landscapes with particularly favorable cultivation conditions could support climate-smart transitions and boost agricultural resilience (Hertel et al., 2021). Higher levels of diversity in cropping systems have the potential to improve crop yields and mitigate the effects of extreme weather conditions leading to greater yield stability (Redhead et al., 2020; Nelson et al., 2022). Moreover, crop diversity provides greater stability of total food and nutrition supply (Renard and Tilman, 2019) and economic value (Birthal and Hazrana, 2019; Sánchez et al., 2022) as crops responses to extreme weather conditions and changes in climate vary (Elmqvist et al., 2003).
In addition, the importance of these biophysical constraints suggest that greater focus needs to be placed on building markets for non-commodity crops that are well suited to the biophysical realities of major agricultural regions (Weisberger et al., 2021). The HD-LP counties examined in this study suggest that despite relatively low productivity for commodity crops, economic diversification via livestock production and increased crop diversity have enabled farmers to maintain similar net income levels as their counterparts in systems with high productivity of commodity crops. Similar to Roesch-McNally et al. (2018) these findings provide evidence that low productivity conditions may enable the emergence of diversity by weaking the grip of a productivist paradigm and reducing disincentives to experimentation.
4.3. Finding 3: Productivity comes at a (petrochemical) cost
Another major finding is that federal support (crop insurance, other government receipts) and chemical inputs (herbicide, insecticide, fertilizer) are key to supporting highly productive agricultural landscapes (both LD-HP and HD-HP). While herbicide and fertilizer applications tend to be lower in HD-HP counties than in the LD-HP counties, insecticide applications are comparable in both classes. This may suggest that higher crop diversity is not necessarily associated with reduced crop pest impacts (Karp et al., 2018; Haan et al., 2020; Zhang et al., 2020) or that despite fairly wide-spread adoption of integrated pest management strategies (Peshin et al., 2009), insecticides are still routinely applied to commodity crops as a preventative regardless of observed pest population abundance (Nault and Huseth, 2016). If pest populations are lower in high diversity systems, changes to farmer pest management strategies, to treat only as-needed, could potentially lead to reduced insecticide applications in high diversity systems. However, in the absence of such changes to pest management crop diversification should not be seen as a stand-alone solution to chemical intensive production practices that can have a negative impact on ecosystem health.
4.4. Finding 4: Crop rotations as a key diversification strategy
Our analyses also highlight the importance of crop rotations in boosting productivity and spatial crop diversity. Counties with the highest crop productivity (HD-HP) also have the highest rotational diversity; conversely, counties with the lowest crop productivity (LD-LP) also have the lowest levels of rotational diversity. This suggests that crop rotations, long accepted as a method for improving soil quality and field-scale crop production (Tiemann et al., 2015; Marini et al., 2020; St. Luce et al., 2020) are likely a significant source of the ecosystem services that support high aggregate levels of crop production in high spatial diversity cropping systems. Though we focus on spatial diversity, our findings suggest that temporal diversification of cropping systems could be a major win for agricultural and ecological goals.
We note, however, that the lack of autonomy and flexibility that many tenant farmers experience may hinder efforts to increase crop rotation diversity, particularly in LD-HP systems where full-ownership rates are relatively low. Recent changes to crop insurance that now allow farmers to insure crops other than just the staple grains that have been covered for several decades should provide farmers with greater flexibility in crop choice (Goeringer and Leathers, 2015; Zulauf, 2020). However, in order to counter current global market forces federal tools are needed that place more direct pressure on large commercial agricultural operations to adopt more ecologically-aware cultivation practices and that build markets for alternative crops and incentivize cultivation of new and different crops (Weisberger et al., 2021; Chapman et al., 2022).
4.5. Limitations
Our analyses are not without limitations. First, due to data availability constraints, our measure of crop productivity only accounts for the five major commodity crops that constitute about 80% of cultivated acreage in the US: corn, soy, wheat, hay, and alfalfa. This limitation makes our findings most relevant to counties dominated by commodity production. Indeed, our analyses examining the accuracy of the random forest classification model suggests that some areas that are well known for production of crops other than the five selected (e.g., almonds in central California) have low classification accuracy. This may indicate that these counties are not well described by the agricultural system attributes examined. For example, counties with an assigned initial classification of HD-LP in central California may have high production levels for high-value specialty crops like almonds and wine grapes, and due to the focus on these specialty crops, have relatively low yields for commodity crops. In this case, the county agricultural system may more closely resemble other HD-HP counties than other HD-LP counties.
Our metric of crop diversity (SDI) also presents limitations. First, SDI is slightly sensitive to area, though less sensitive than other metrics such as Richness. Larger counties are more likely to have higher SDI by virtue of their larger area that has more physical space for different crop types. Second, higher SDI does not necessarily correspond to improved ecosystem health. For example, an increase in SDI at the expense of the removal of natural cover, such as that observed in HD-LP counties, may not reflect an ecological “win” (Lark et al., 2020; Garibaldi et al., 2021). Lastly, while this work provides a step toward addressing the resilience of agroecosystems by providing insight into possible drivers of regime change, additional work is necessary to test whether and which of the variables examined drive transformation over time. Recent work by Chapman et al. (2022) suggests that temporal mismatch between ecological dynamics and human decision-making timelines resulting from government programs and incentives may drive the creation of multiple stable agricultural regimes. While our work does not focus on temporal dynamics, it is clear that participation in federal incentive programs is strongly associated with the emergence of distinct agricultural production regimes with striking implications for commodity crop production and ecosystem health.
5. Conclusions
By classifying US counties according to a diversity-productivity typology and identifying distinguishing features associated with this typology, this paper provides insights into the enabling conditions and drivers of diverse and productive agricultural outcomes, the impact of these agricultural realities on farmer livelihoods, and levers to create pathways toward diverse and productive agricultural futures. Notably we find that biophysical conditions have largely constrained the development of different agricultural production regimes. Beyond pointing to potential geographical limitations of agricultural diversification, this highlights the vital importance of new research examining how future changes in climate will constrict or alter viable cultivation portfolios across the US. We also find that incentivizing more diverse crop rotations, and to a lesser extent, agricultural conservation programs, may be viable strategies for enabling transitions from LD-HP to HD-HP agricultural systems. In addition, while we find that HD-HP systems are capable of much higher commodity crop yields than LD-HP systems and use less fertilizer and herbicide, on average, they remain comparably dependent on insecticides.
Our results suggest that the most dominant regime is that of low diversity—high productivity systems. These systems are characterized by large-scale, chemical input driven and crop insurance supported grain production—often by tenant farmers with reduced autonomy. This regime may be resilient in that it persists; however, it is also brittle—dependent on a constant stream of subsidization and chemical inputs to meet regular production goals and manage shocks to the system (Wang et al., 2021). Moreover, this regime is firmly locked into a productivist paradigm that emphasizes high production rates at the expense of ecosystem health and farmer livelihood goals (Meynard et al., 2018).
The analyses presented show that alternatives to the LD-HP production regime that may better support ecological health, rates of productivity, and farmer livelihoods do exist. These production regimes align more closely with the USDA's stated goals for sustainable agriculture that can “provide more profitable farm income, promote environmental stewardship, and enhance quality of life for farm families and communities” (USDA, 2022), but are less common and more heterogeneous than LD-HP systems. The alternate production regimes identified appear to be more resilient to external shocks, as they are less reliant on government funding and chemical inputs yet maintain similar levels of net income via crop diversification or economic diversification. However, they are vulnerable to cooption by the dominant LD-HP paradigm. Transitions toward alternative diverse production regimes that meet multiple goals related to productivity, ecosystem health, and farmer livelihoods will require careful attention to biophysical constraints—not all places can or should grow staple commodity crops at high yields—and aggressive investment in agricultural programs that encourage experimentation with new crops and crop rotations and develop markets and infrastructure for less well-known crops.
Data availability statement
The raw data supporting the conclusions of this article will be made available by the authors, without undue reservation.
Author contributions
KN and EB contributed to conception, design of the study, and data organization. KN led modeling, data analysis, and drafted the manuscript. Both authors contributed to interpretation of the results and writing.
Funding
This work was supported in part by US Department of Agriculture National Institute of Food and Agriculture grant number 2020-67019-31157.
Conflict of interest
The authors declare that the research was conducted in the absence of any commercial or financial relationships that could be construed as a potential conflict of interest.
Publisher's note
All claims expressed in this article are solely those of the authors and do not necessarily represent those of their affiliated organizations, or those of the publisher, the editors and the reviewers. Any product that may be evaluated in this article, or claim that may be made by its manufacturer, is not guaranteed or endorsed by the publisher.
Author disclaimer
Any opinions, findings, conclusions or recommendations expressed in this publication are those of the authors and do not necessarily reflect the view of the US Department of Agriculture.
Supplementary material
The Supplementary Material for this article can be found online at: https://www.frontiersin.org/articles/10.3389/fsufs.2023.1081079/full#supplementary-material
Footnotes
1. ^GDD baseline temperature of 0°C for winter wheat and hay, 10°C for corn and soy and 15°C for alfalfa (Agweather Connection, n.d.; Corn Growing Degree Days, n.d.).
2. ^Note that because our measure of crop productivity accounts for biophysical conditions we do not expect biophysical conditions to be strongly associated with the crop productivity component of our typology. However, we retain these biophysical factors to determine if biophysical conditions are strongly associated with the crop diversity component of the typology.
References
Abson, D. J., Fraser, E. D., and Benton, T. G. (2013). Landscape diversity and the resilience of agricultural returns: a portfolio analysis of land-use patterns and economic returns from lowland agriculture. Agricult. Food Secur. 2, 1–15. doi: 10.1186/2048-7010-2-2
Aguilar, J., Gramig, G. G., Hendrickson, J. R., Archer, D. W., Forcella, F., and Liebig, M. A. (2015). Crop species diversity changes in the United States: 1978–2012. PLoS ONE. 10, e0136580. doi: 10.1371/journal.pone.0136580
Annan, F., and Schlenker, W. (2015). Federal crop insurance and the disincentive to adapt to extreme heat. Am. Econ. Rev. 105, 262–266. doi: 10.1257/aer.p20151031
Basche, A., Tully, K., Álvarez-Berríos, N. L., Reyes, J., Lengnick, L., Brown, T., et al. (2020) Environ. Quality Incentives Program (EQIP) U.S. data at state, county and individual practice level for soil Environ. health, 2009-2018. Fort Collins, CO: Forest Service Research Data Archive.
Bigelow, D., and Borchers, A. (2017). Major Uses of Land in the United States, 2012. Economic Information Bulletin No. (EIB-178). p. 69.
Birthal, P. S., and Hazrana, J. (2019). Crop diversification and resilience of agriculture to climatic shocks: Evidence from India. Agri. Syst. 173, 345–354. doi: 10.1016/j.agsy.2019.03.005
Burchfield, E. K. (2022). Shifting cultivation geographies in the Central and Eastern US. Environ. Res. Lett. 17, 054049. doi: 10.1088/1748-9326/ac6c3d
Burchfield, E. K., and Nelson, K. S. (2021). Agricultural yield geographies in the United States. Environ. Res. Lett. 16, 054051.
Burchfield, E. K., Nelson, K. S., and Spangler, K. (2019). The impact of agricultural landscape diversification on US crop production. Agricult. Ecosyst. Environ. 285, 106615. doi: 10.1016/j.agee.2019.106615
Burchfield, E. K., Schumacher, B. L., Spangler, K., and Rissing, A. (2022). The state of US farm operator livelihoods. Front. Sustain. Food Syst. 566. doi: 10.3389/fsufs.2021.795901
Chapman, M., Wiltshire, S., Baur, P., Bowles, T., Carlisle, L., Castillo, F., et al. (2022). Social-ecological feedbacks drive tipping points in farming system diversification. One Earth 5, 283–292. doi: 10.1016/j.oneear.2022.02.007
Clapp, J. (2021). The problem with growing corporate concentration and power in the global food system. Nat. Food 2, 404–408. doi: 10.1038/s43016-021-00297-7
Crossley, M. S., Burke, K. D., Schoville, S. D., and Radeloff, V. C. (2021). Recent collapse of crop belts and declining diversity of US agriculture since 1840. Global Change Biol. 27, 151–164. doi: 10.1111/gcb.15396
Dainese, M., Martin, E. A., Aizen, M. A., Albrecht, M., Bartomeus, I., Bommarco, R., et al. (2019). A global synthesis reveals biodiversity-mediated benefits for crop production. Sci. Adv. 5, eaax0121. doi: 10.1126/sciadv.aax0121
Duffy, M. (2009). Economies of size in production agriculture. J. Hunger Environ. Nutr. 4, 375–392. doi: 10.1080/19320240903321292
Dürr, J. (2016). The political economy of agriculture for development today: the “small versus large” scale debate revisited. Agricult. Econ. 47, 671–681. doi: 10.1111/agec.12264
Economic Research Service (ERS) (2000). Farm Resource Regions. USDA Agricultural Information Bulletin No. 760. Available online at: https://www.ers.usda.gov/publications/pub-details/?pubid=42299 (accessed August 12, 2022).
Elliott, J., Deryng, D., Müller, C., Frieler, K., Konzmann, M., Gerten, D., et al. (2014). Constraints and potentials of future irrigation water availability on agricultural production under climate change. Proc. Natl. Acad. Sci. 111, 3239–3244. doi: 10.1073/pnas.1222474110
Elmqvist, T., Folke, C., Nyström, M., Peterson, G., Bengtsson, J., Walker, B., et al. (2003). Response diversity, ecosystem change, and resilience. Front. Ecol. Environ. 1, 488–494. doi: 10.1890/1540-9295(2003)001(0488:RDECAR)2.0.CO;2
Galpern, P., Vickruck, J., Devries, J. H., and Gavin, M. P. (2020). Landscape complexity is associated with crop yields across a large temperate grassland region. Agricult. EcoSyst. Environ. 290, 106724. doi: 10.1016/j.agee.2019.106724
Garibaldi, L. A., Oddi, F. J., Miguez, F. E., Bartomeus, I., Orr, M. C., Jobbágy, E. G., et al. (2021). Working landscapes need at least 20% native habitat. Conserv. Lett. 14, e12773. doi: 10.1111/conl.12773
Garland, G., Edlinger, A., Banerjee, S., Degrune, F., García-Palacios, P., Pescador, D. S., et al. (2021). Crop cover is more important than rotational diversity for soil multifunctionality and cereal yields in European cropping systems. Nat. Food 2, 28–37. doi: 10.1038/s43016-020-00210-8
Goeringer, P., and Leathers, H. (2015). New Crop Insurance Option for Diversified Operations: Whole Farm Revenue Protection. College Park, Maryland: University of Maryland College of Agriculture and Natural Resources Department of Agricultral and Resource Economics. Fact Sheet.
Goslee, S. C. (2020). Drivers of agricultural diversity in the contiguous United States. Front. Sustain. Food Syst. 4, 75. doi: 10.3389/fsufs.2020.00075
Grab, H., Danforth, B., Poveda, K., and Loeb, G. (2018). Landscape simplification reduces classical biological control and crop yield. Ecol. Appl. 28, 348–355. doi: 10.1002/eap.1651
Haan, N. L., Zhang, Y., and Landis, D. A. (2020). Predicting landscape configuration effects on agricultural pest suppression. Trends Ecol. Evol. 35, 175–186. doi: 10.1016/j.tree.2019.10.003
Hemberger, J., Crossley, M. S., and Gratton, C. (2021). Historical decrease in agricultural landscape diversity is associated with shifts in bumble bee species occurrence. Ecol. Lett. 24, 1800–1813. doi: 10.1111/ele.13786
Hertel, T. W., Elouafi, I., Ewert, F., and Tanticharoen, M. (2021). Building Resilience to Vulnerabilities, Shocks and Stresses. A paper on Action Track 5. Bonn: Center for Development Research (ZEF) in cooperation with the Scientific Group for the UN Food System Summit 2021. doi: 10.48565/scfss2021-cz84
Hesselbarth, M. H. K., Sciaini, M., With, K. A., Wiegand, K., and Nowosad, J. (2019). landscapemetrics: an open-source R tool to calculate landscape metrics. Ecography 42, 1648–1657. doi: 10.1111/ecog.04617
Karp, D. S., Chaplin-Kramer, R., Meehan, T. D., Martin, E. A., DeClerck, F., Grab, H., et al. (2018). Crop pests and predators exhibit inconsistent responses to surrounding landscape composition. Proc. Natl. Acad. Sci. 115, E7863–E7870. doi: 10.1073/pnas.1800042115
Key, N. (2019). Farm size and productivity growth in the United States Corn Belt. Food Pol. 84, 186–195. doi: 10.1016/j.foodpol.2018.03.017
Khoury, C. K., Achicanoy, H. A., Bjorkman, A. D., Navarro-Racines, C., Guarino, L., Flores-Palacios, X., et al. (2016). Origins of food crops connect countries worldwide. Proc. Royal. Soc. B:. Biol. Sci. 283, 20160792. doi: 10.1098/rspb.2016.0792
Landis, D. A. (2017). Designing agricultural landscapes for biodiversity-based ecosystem services. Basic Appl. Ecol. 18, 1–12. doi: 10.1016/j.baae.2016.07.005
Lark, T. J., Spawn, S. A., Bougie, M., and Gibbs, H. K. (2020). Cropland expansion in the United States produces marginal yields at high costs to wildlife. Nat. Commun. 11, 1–11. doi: 10.1038/s41467-020-18045-z
Lobell, D. B., and Gourdji, S. M. (2012). The influence of climate change on global crop productivity. Plant Physiol. 160, 1686–1697. doi: 10.1104/pp.112.208298
Lowder, S. K., Skoet, J., and Raney, T. (2016). The number, size, and distribution of farms, smallholder farms, and family farms worldwide. World Develop. 87, 16–29. doi: 10.1016/j.worlddev.2015.10.041
Marini, L., St-Martin, A., Vico, G., Baldoni, G., Berti, A., Blecharczyk, A., et al. (2020). Crop rotations sustain cereal yields under a changing climate. Environ. Res. Lett. 15, 124011. doi: 10.1088/1748-9326/abc651
McGarigal, K. (1995). FRAGSTATS: Spatial Pattern Analysis Program for Quantifying Landscape Structure vol 351. Corvallis, Oregon: US Department of Agriculture, Forest Service, Pacific Northwest Research Station.
McGranahan, D. A., Brown, P. W., Schulte, L. A., and Tyndall, J. C. (2013). A historical primer on the US farm bill: Supply management and conservation policy. J. Soil Water Conserv. 68, 67A−73A. doi: 10.2489/jswc.68.3.67A
Meynard, J. M., Charrier, F., Le Bail, M., Magrini, M. B., Charlier, A., Messéan, A., et al. (2018). Socio-technical lock-in hinders crop diversification in France. Agron. Sustain. Dev. 38, 1–13. doi: 10.1007/s13593-018-0535-1
Mourtzinis, S., Grassini, P., Edreira, J. I. R., Andrade, J. F., Kyveryga, P. M., Conley, S. P., et al. (2020). Assessing approaches for stratifying producer fields based on biophysical attributes for regional yield-gap analysis. Field Crops Res. 254, 107825. doi: 10.1016/j.fcr.2020.107825
Nachtergaele, F., Velthuizen, H. V., Verelst, L., and Wiberg, D. (2009). Harmonized World Soil Database (hwsd). Rome: Food and Agriculture Organization of the United Nations.
Nault, B. A., and Huseth, A. S. (2016). Evaluating an action threshold-based insecticide program on onion cultivars varying in resistance to onion thrips (Thysanoptera: Thripidae). J. Econ. Entomol. 109, 1772–1778. doi: 10.1093/jee/tow112
Nelson, K. S., and Burchfield, E. K. (2021). Landscape complexity and US crop production. Nat. Food 2, 330–338. doi: 10.1038/s43016-021-00281-1
Nelson, K. S., Patalee, B., and Yao, B. (2022). Higher landscape diversity associated with improved crop production resilience in Kansas-USA. Environ. Res. Lett. 17, 084011. doi: 10.1088/1748-9326/ac7e5f
Pardey, P. G., and Alston, J. M. (2021). Unpacking the Agricultural Black Box: The Rise and Fall of American Farm Productivity Growth. J. Econ. Hist. 81, 114–155. doi: 10.1017/S0022050720000649
Pervez, M. S., and Brown, J. F. (2010). Mapping irrigated lands at 250 m scale by merging MODIS data and national agricultural statistics Remote Sens. 2, 2388–2412. doi: 10.3390/rs2102388
Peshin, R., Bandral, R. S., Zhang, W., Wilson, L., and Dhawan, A. K. (2009). Integrated pest management: a global overview of history, programs and adoption. Integr. Pest Manage. Innov. Dev. Process 1, 1–49. doi: 10.1007/978-1-4020-8992-3_1
Petersen-Rockney, M., Baur, P., Guzman, A., Bender, S. F., Calo, A., Castillo, F., et al. (2021). Narrow and brittle or broad and nimble? Comparing adaptive capacity in simplifying and diversifying farming systems. Front. Sustain. Food Syst. 5, 564900. doi: 10.3389/fsufs.2021.564900
PRISM Climate Group (2014). Oregon State University. Available online at: https://prism.oregonstate.edu, data created 4 Feb 2014 (accessed on August 01, 2020).
R Core Team (2017). R: A Language and Environ. for Statistical Computing (R Foundation for Statistical Computing. Available online at: https://www.R-project.org/
Raup, P. M. (1978). Some questions of value and scale in American agriculture. Am. J. Agricult. Econ. 60, 303–308. doi: 10.2307/1240065
Redhead, J. W., Oliver, T. H., Woodcock, B. A., and Pywell, R. F. (2020). The influence of landscape composition and configuration on crop yield resilience. J. Appl. Ecol. 57, 2180–2190. doi: 10.1111/1365-2664.13722
Redlich, S., Martin, E. A., and Steffan-Dewenter, I. (2018). Landscape-level crop diversity benefits biological pest control. J. Appl. Ecol. 55, 2419–2428. doi: 10.1111/1365-2664.13126
Renard, D., and Tilman, D. (2019). National food production stabilized by crop diversity. Nature. 571, 7764. doi: 10.1038/s41586-019-1316-y
Rissing, A. (2016). Alternative economic strategies and the technology treadmill: Beginning vegetable farmers in Iowa. Econ. Anthropol. 3, 304–314. doi: 10.1002/sea2.12061
Roesch-McNally, G. E., Arbuckle, J. G., and Tyndall, J. C. (2018). Barriers to implementing climate resilient agricultural strategies: The case of crop diversification in the US Corn Belt. Global Environ. change 48, 206–215. doi: 10.1016/j.gloenvcha.2017.12.002
Sacks, W. J., Deryng, D., Foley, J. A., and Ramankutty, N. (2010). Crop planting dates: an analysis of global patterns. Glob. Ecol. Biogeograph. 19, 607–620. doi: 10.1111/j.1466-8238.2010.00551.x
Sánchez, A. C., Kamau, H. N., Grazioli, F., and Jones, S. K. (2022). Financial profitability of diversified farming systems: A global meta-analysis. Ecol. Econ. 201, 107595. doi: 10.1016/j.ecolecon.2022.107595
Smith, R. G., Gross, K. L., and Robertson, G. P. (2008). Effects of crop diversity on agroecosystem function: Crop yield response. Ecosystems. 11, 355–366. doi: 10.1007/s10021-008-9124-5
Spangler, K., Burchfield, E. K., Radel, C., Jackson-Smith, D., and Johnson, R. (2022a). Crop diversification in Idaho's Magic Valley: the present and the imaginary. Agron. Sustain. Dev. 42, 1–16. doi: 10.1007/s13593-022-00833-0
Spangler, K., Burchfield, E. K., and Schumacher, B. (2020). Past and Current Dynamics of U.S. Agriculture Land Use and Policy Front. Sustain. Food Syst. 4, 98. doi: 10.3389/fsufs.2020.00098
Spangler, K., Schumacher, B. L., Bean, B., and Burchfield, E. K. (2022b). Path dependencies in US agriculture: Regional factors of diversification. Agricult. EcoSyst. Environ. 333, 107957. doi: 10.1016/j.agee.2022.107957
St. Luce, M., Lemke, R., Gan, Y., McConkey, B., May, W., Campbell, C., et al. (2020). Diversifying cropping systems enhances productivity, stability, and nitrogen use efficiency. Agron. J. 112, 1517–1536. doi: 10.1002/agj2.20162
Strobl, C., Boulesteix, A. L., Kneib, T., Augustin, T., and Zeileis, A. (2008). Conditional variable importance for random forests. BMC Bioinform. 9, 1–11. doi: 10.1186/1471-2105-9-307
Swift, M. J., Izac, A. -M. N., and van Noordwijk, M. (2004). Biodiversity and ecosystem services in agricultural landscapes-are we asking the right questions? Agric. Ecosyst. Environ. 104, 113–134. doi: 10.1016/j.agee.2004.01.013
Thomine, E., Mumford, J., Rusch, A., and Desneux, N. (2022). Using crop diversity to lower pesticide use: Socio-ecological approaches. Sci. Total Environ. 804, 150156. doi: 10.1016/j.scitotenv.2021.150156
Tiemann, L. K., Grandy, A. S., Atkinson, E. E., Marin-Spiotta, E., and McDaniel, M. D. (2015). Crop rotational diversity enhances belowground communities and functions in an agroecosystem. Ecol. Lett. 18, 761–771. doi: 10.1111/ele.12453
U.S. Bureau of Economic Analysis (BEA) (2021). “CAINC45: Farm Income and Expenses” and “CAGDP2: GDP in Current Dollars by County and MSA”. Available online at: https://apps.bea.gov/regional/downloadzip.cfm (accessed May 1, 2022).
US Geological Survey (2019). 3D Elevation Program 1-Meter Resolution Digital Elevation Model (published 20200606). Available online at: https://www.usgs.gov/the-national-map-data-delivery (accessed October 23, 2019).
USDA (2022). National Institute of Food and Agriculture. United States Department of Agriculture. Sustainable Agriculture Programs. Available online at: https://www.nifa.usda.gov/grants/programs/sustainable-agriculture-programs (accessed September 18, 2022).
USDA CropScrape (2018). Cropland Data Layer. USDA National Agricultural Statistics Service, 2018. Available online at: https://nassgeodata.gmu.edu/CropScape/ (accessed June 10, 2019).
USDA NASS (2020). USDA National Agricult. Statistics Service Quick Stats. Available online at: https://quickstats.nass.usda.gov/ (accessed May 20, 2021).
Vanloqueren, G., and Baret, P. V. (2009). How agricultural research systems shape a technological regime that develops genetic engineering but locks out agroecological innovations. Res. Policy 38, 971–983. doi: 10.1016/j.respol.2009.02.008
Wang, R., Rejesus, R. M., and Aglasan, S. (2021). Warming temperatures, yield risk and crop insurance participation. European Rev. Agricult. Econ. 48, 1109–1131. doi: 10.1093/erae/jbab034
Wardropper, C. B., Esman, L. A., Harden, S. C., Masuda, Y. J., Ranjan, P., Weigel, C., et al. (2022). Applying a “fail-fast” approach to conservation in US agriculture. Conserv. Sci. Pract. 4, e619. doi: 10.1111/csp2.619
Weisberger, D. A., McDaniel, M. D., Arbuckle, J. G., and Liebman, M. (2021). Farmer perspectives on benefits of and barriers to extended crop rotations in Iowa, USA. Agricult. Environ. Lett. 6, e20049. doi: 10.1002/ael2.20049
Zhang, W., Ricketts, T. H., Kremen, C., Carney, K., and Swinton, S. M. (2007). Ecosystem services and dis-services to agriculture. Ecol. Econom. 64, 253–260. doi: 10.1016/j.ecolecon.2007.02.024
Zhang, Y., Haan, N. L., and Landis, D. A. (2020). Landscape composition and configuration have scale-dependent effects on agricultural pest suppression. Agricult. EcoSyst. and nviron. 302, 107085. doi: 10.1016/j.agee.2020.107085
Zhao, C., Liu, B., Piao, S., Wang, X., Lobell, D. B., Huang, Y., et al. (2017). Temperature increase reduces global yields of major crops in four independent estimates. Proc. Natl. Acad. Sci. 114. doi: 10.1073/pnas.1701762114
Keywords: crop diversity, crop productivity, archetype, sustainable agriculture, regime transition
Citation: Nelson KS and Burchfield EK (2023) Defining features of diverse and productive agricultural systems: An archetype analysis of U.S. agricultural counties. Front. Sustain. Food Syst. 7:1081079. doi: 10.3389/fsufs.2023.1081079
Received: 26 October 2022; Accepted: 06 February 2023;
Published: 01 March 2023.
Edited by:
Kailash Chand Kumawat, Sam Higginbottom University of Agriculture, Technology and Sciences, IndiaReviewed by:
Barkha Sharma, G. B. Pant University of Agriculture and Technology, IndiaSharon Nagpal, Punjab Agricultural University, India
Copyright © 2023 Nelson and Burchfield. This is an open-access article distributed under the terms of the Creative Commons Attribution License (CC BY). The use, distribution or reproduction in other forums is permitted, provided the original author(s) and the copyright owner(s) are credited and that the original publication in this journal is cited, in accordance with accepted academic practice. No use, distribution or reproduction is permitted which does not comply with these terms.
*Correspondence: Katherine S. Nelson, ksnelson@ksu.edu