Toward Operational Mapping of Woody Canopy Cover in Tropical Savannas Using Google Earth Engine
 Julius Y. Anchang1*
  Lara Prihodko2
  Wenjie Ji1 Sanath S. Kumar1 C. Wade Ross1
  Qiuyan Yu1
  Brianna Lind1 Mamadou A. Sarr3 Abdoul A. Diouf3
  Niall P. Hanan1
- 1Plant and Environmental Sciences, New Mexico State University, Las Cruces, NM, United States
- 2Animal and Range Sciences, New Mexico State University, Las Cruces, NM, United States
- 3Centre de Suivi Ecologique, Dakar, Senegal
Savanna woody plants can store significant amounts of carbon while also providing numerous other ecological and socio-economic benefits. However, they are significantly under-represented in widely used tree cover datasets, due to mapping challenges presented by their complex landscapes, and the underestimation of woody plants by methods that exclude short stature trees and shrubs. In this study, we describe a Google Earth Engine (GEE) application and present test case results for mapping percent woody canopy cover (%WCC) over a large savanna area. Relevant predictors of %WCC include information derived from radar backscatter (Sentinel-1) and optical reflectance (Sentinel-2), which are used in conjunction with plot level %WCC measurements to train and evaluate random forest models. We can predict %WCC at 40 m pixel resolution for the full extent of Senegal with a root mean square error of ∼8% (based on independent sample evaluation). Further examination of model results provides insights into method stability and potential generalizability. Annual median radar backscatter intensity is determined to be the most important satellite-based predictor of %WCC in savannas, likely due to its relatively strong response to non-leaf structural components of small woody plants which remain mostly constant across the wet and dry season. However, the best performing model combines radar backscatter metrics with optical reflectance indices that serve as proxies for greenness, dry biomass, burn incidence, plant water content, chlorophyll content, and seasonality. The primary use of GEE in the methodology makes it scalable and replicable by end-users with limited infrastructure for processing large remote sensing data.
Introduction
The Ecological and Socio-Economic Importance of Woody Vegetation in Savannas
Woody plants are an important component of terrestrial ecosystems; they play a major role in carbon, nutrient and hydrological cycles (Vitousek, 1982; Jackson et al., 2002; Huxman et al., 2005) and provide habitat for other species (Ratter et al., 1997). Savannas occur across tropical, sub-tropical and temperate latitudes, and feature the co-dominance of woody and herbaceous plant forms (Werner, 2009). While they may exhibit on average lower woody densities relative to closed canopy forests, their vast spatial extent (up to 40% of the Earth’s terrestrial surface, depending on definition; see Scholes and Archer, 1997; Bond and Midgley, 2000; Sankaran et al., 2005; Ratnam et al., 2011, and references therein) indicates an important role in global and regional carbon storage. As such, a lack of detailed information on woody vegetation cover in savannas contributes uncertainties in current carbon stock estimates and constrains scientific understanding of the role they may play in long-term climate change. In socio-economic terms, trees and shrubs are key to the basic livelihoods of millions living in regions such as the West African Sahel. The predominantly agro-pastoralist societies rely on woody biomass for energy (fuelwood and charcoal) and food (including livestock browse) (Wessels et al., 2013; Hanan, 2018). An accurate quantitative and spatially explicit assessment of woody vegetation cover in such regions is thus crucial to local, regional and global efforts aimed at understanding and combating the effects of climate change through carbon sequestration, reducing food insecurity through extensive livestock systems, and promoting sustainable land use practices.
Challenges to Large Area Mapping of Woody Vegetation in Savannas
Savannas have complex landscapes; a picture of individual shrubs and trees or discontinuous tree canopies against a background of grassland and/or cultivated surfaces comes to mind. This picture is often the result of millennia of climate and human induced changes that continuously alter landscapes on short- and long-term basis (Behling and Hooghiemstra, 1999; Werner, 2009). Medium and coarse resolution land cover maps that categorize individual pixels into unique land cover/land use types cannot adequately separate different vegetation types in such areas. At the same time, using commercial very high resolution (VHR) imagery (e.g., <1 m) for detailed mapping remains impractical beyond the local scale, due to the insufficient coverage of currently archived data, high cost of new large area acquisitions, and steep computation and storage requirements for processing.
In lieu of categorical land cover maps, Vegetation Continuous Fields (VCF) land cover products have been developed to fill the need for more detailed vegetation mapping over large areas; by providing sub-pixel/fractional estimates of specific canopy properties (e.g., percent tree cover) (Defries et al., 2000b; Hansen et al., 2002). VCF methodology generally involves using satellite-derived metrics as discriminants in an empirical model that is calibrated with continuous-scale measurements obtained from the field (or from higher resolution imagery) (Foody and Cox, 1994; Hansen et al., 1996; Defries et al., 2000a; Gessner et al., 2013; Baumann et al., 2018). Existing global VCF products are however not ideal for estimating canopy properties in drylands and savannas. For example, the annual MODerate Resolution Imaging Spectrometer (MODIS) VCF product (MOD44B) (Hansen et al., 2002), and the Landsat equivalent (Sexton et al., 2013), are designed to only represent tree canopies with certain characteristics based on the definition of forests provided by the Food and Agricultural Organization (e.g., canopy height > 5 m) (FAO, 2000). Consequently, these datasets are known to significantly underestimate woody plant cover in dry savannas, where trees and shrubs tend to be of considerably lower stature (Figure 1, as well as Gessner et al., 2013; Brandt et al., 2016a).
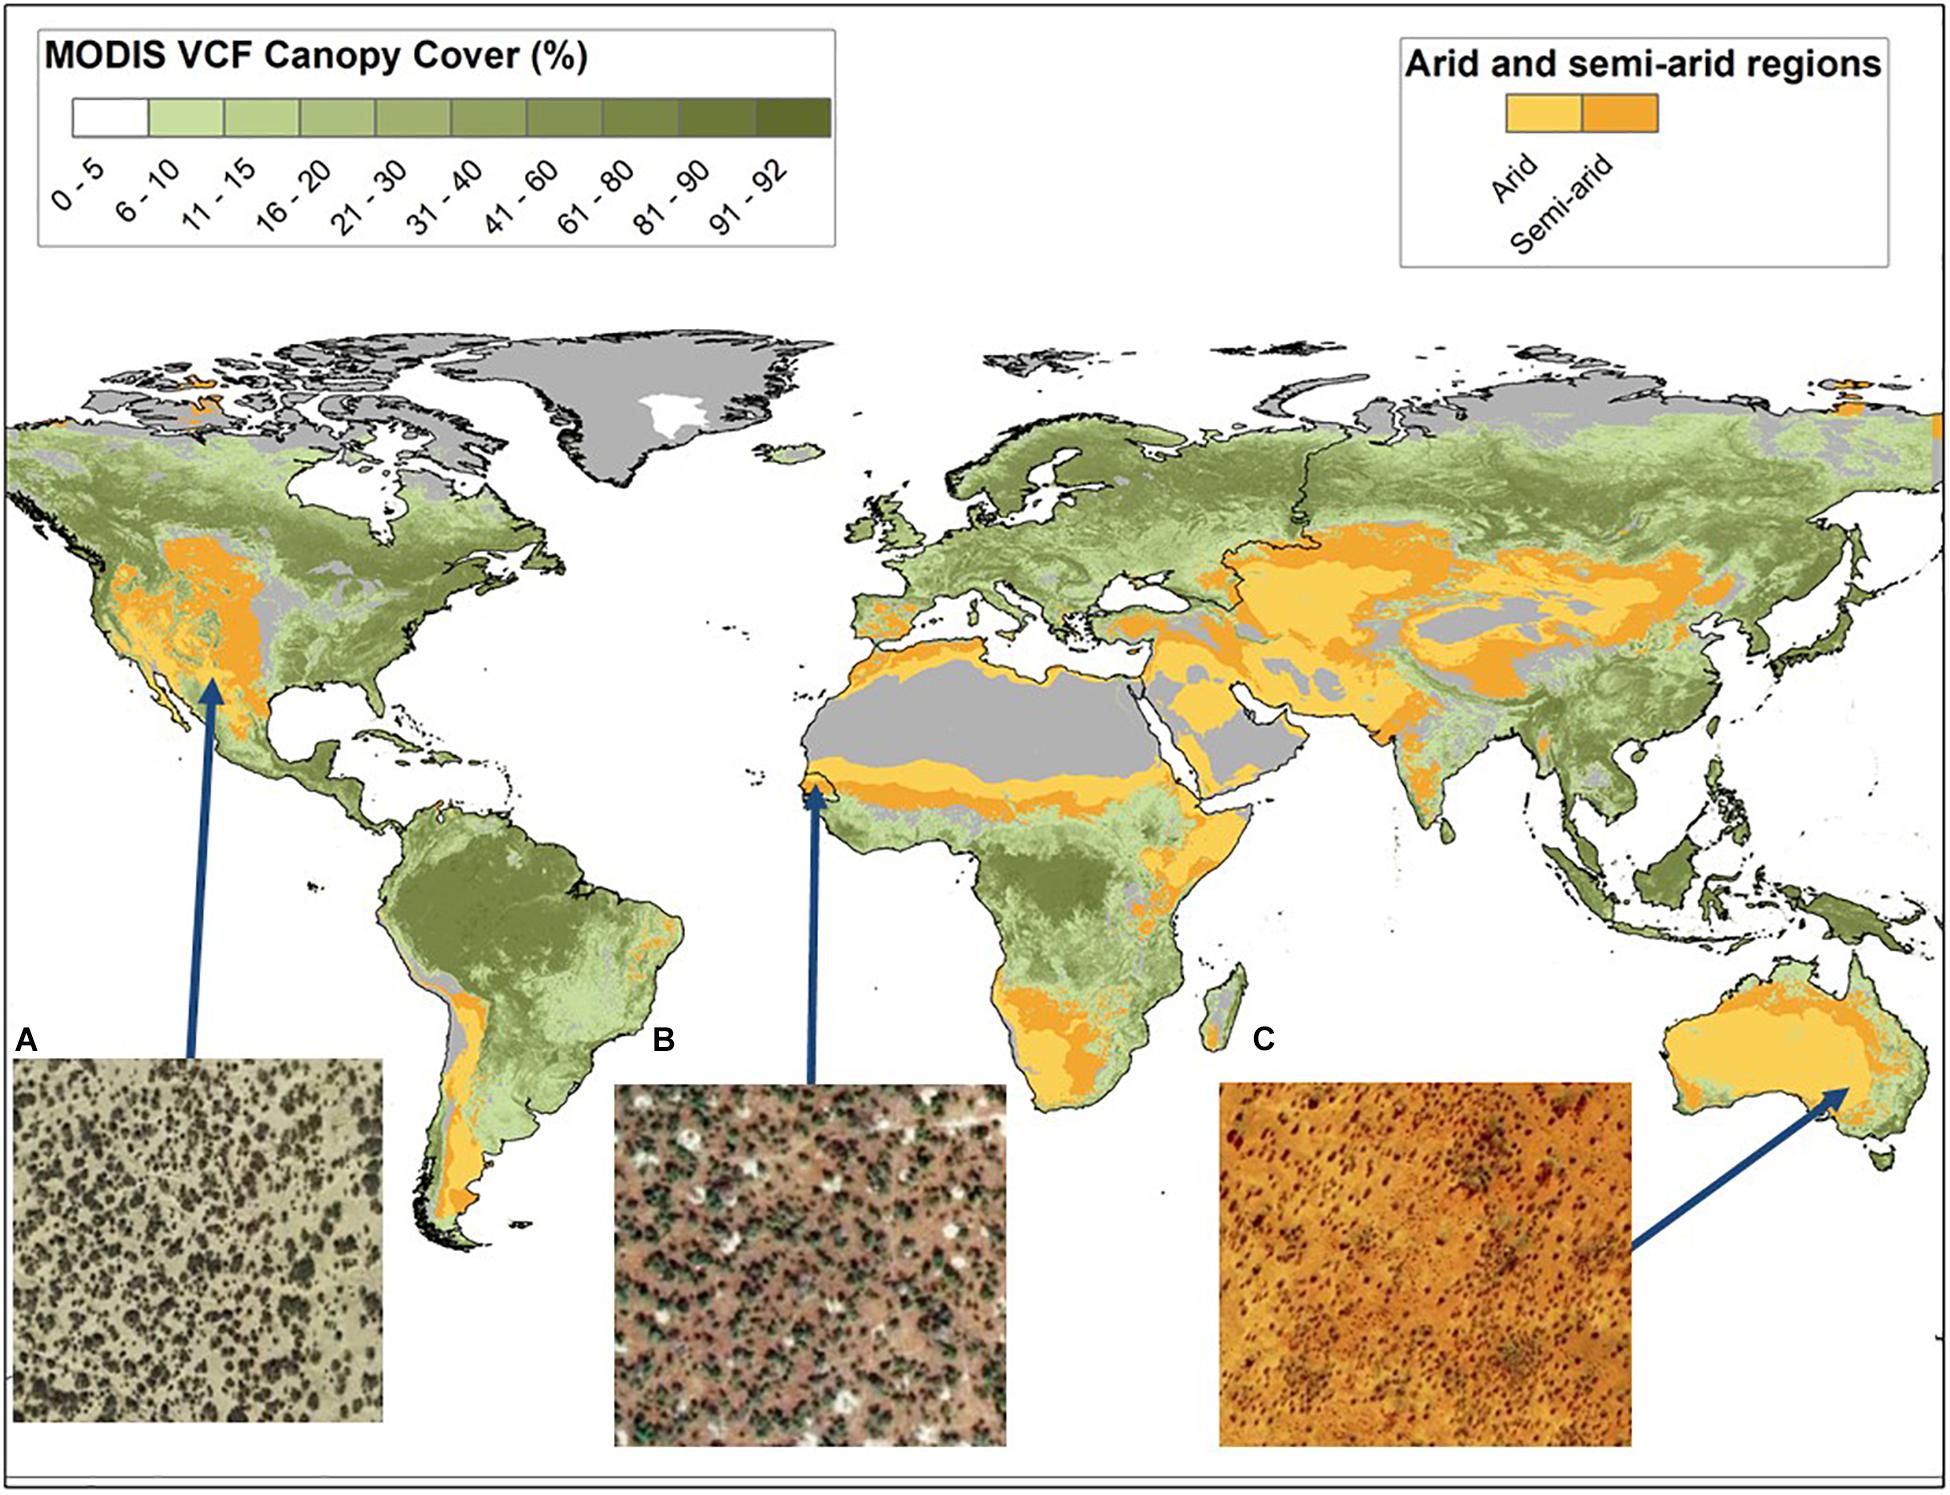
Figure 1. An illustration of how the MODIS Vegetation Continuous Fields Tree Cover data (MOD44B) effectively excludes global dryland regions (yellow and orange) where VCF generally indicates canopy cover is 0–5%. Closer examination (inset images A, B, and C) suggests these areas can contain significant amounts of woody cover in the form of (smaller) trees and shrubs. Imagery Source: ESRI Basemaps, DigitalGlobe.
The Use of Satellite Remote Sensing in Mapping Woody Cover in Savannas
Satellite-obtained optical reflectance data have been used for decades to map and monitor vegetated surfaces over large extents (Matthews, 1983; DeFries et al., 1995; Hansen et al., 2002). This is largely due to their ability to provide scalable spectral information relevant to plant canopies such as greenness, leaf area index and phenology (Zhang et al., 2003; Xie et al., 2008). The extensive spatiotemporal coverage and free availability of data from sensors such as MODIS and Landsat, and more recently Copernicus Sentinel instruments, has also contributed to making remote sensing data a far less costly and laborious option to derive global and regional vegetation maps. However, particularly in tropical and subtropical regions, these benefits are counteracted by problems associated with cloud coverage, atmospheric scattering, background reflectance, and saturation of optical indices in more densely vegetated landscapes (Huete et al., 1997).
In the context of open savannas and woodlands, phenology and seasonality metrics derived from optical reflectance data have been used to discriminate woody and non-woody plant forms. Brandt et al. (2016a) demonstrated this using dry-season integrated Fraction of Absorbed Photosynthetically Active Radiation (FAPAR), derived from MODIS and SPOT-VEGETATION (SPOT-VGT), to estimate woody plant cover at 1km resolution scale for the West African Sahel. In this region, annual vegetation productivity is strongly controlled by precipitation which typically falls within a short window (3–5 months) (Nicholson and Webster, 2007). Herbaceous vegetation would typically green-up and senesce during this brief period, while trees and shrubs can flush leaves before the rains and often retain leaves for some months into the dry season (Hiernaux et al., 1994). In theory, this means woody vegetation may be distinguished from herbaceous vegetation using time series optical reflectance data to detect differences in phenophases between woody and non-woody plants. However, such precise phenology information is harder to obtain using remote sensing data at finer (sub-100 m) scales, where operational instruments have lower revisit times; and also, where the differences in phenophases among woody species (see Brandt et al., 2016a, b) becomes more visible, making it harder to collectively separate them from herbaceous vegetation.
Unlike optical reflectance, microwave (radar) backscatter is largely insensitive to atmospheric/cloud conditions and, depending on wavelength, can be sensitive to the seasonally invariant structural components of trees and shrubs. For example, the leaves of small trees and shrubs would be largely transparent to Sentinel-1 C-band radar backscatter (∼5 cm wavelength) but these wavelengths are sensitive to the stems and branches (Flores-Anderson et al., 2019). Thus, the addition of radar backscatter should improve our ability to discriminate woody vegetation in savannas with or without the benefit of knowledge on tree-grass phenological differences. This was demonstrated in a recent study that used ALOS PALSAR L-band backscatter to map woody vegetation in a Southern African savanna (Urbazaev et al., 2015), and another study that showed that fusion of Sentinel-1 (C-band) radar backscatter with Landsat 8 optical reflectance data significantly improved the accuracy of mapping tree and shrub cover in South America (Baumann et al., 2018).
Objectives
Against this background, our main objective is to describe the methodology and present prototype results for mapping %WCC over a large, predominantly savanna region in West Africa. Our approach combines relevant metrics, derived from both radar backscatter and optical reflectance data, as empirical correlates of %WCC at medium resolution (40 m) in an ensemble decision tree (random forest) model. Furthermore, we interpret our test case results to answer the following questions: (1) Which earth observation metrics contribute most to accurate predictions of %WCC in tropical savannas? (2) Given the ‘black box’ nature of machine learning models used for prediction, can we discern meaningful (statistical or mechanistic) relationships between important predictors and %WCC? (3) How does our derived %WCC compare with other similarly published datasets for the region? Answers to these questions should indicate how our approach contributes a new and useful tool for reliably mapping savanna tree and shrub cover at relatively fine scales using remote sensing data, and its transferability to other regions.
Local, national and regional institutions in developing regions such as West Africa face tremendous difficulties in the operational use of remote sensing data for environmental and natural resource monitoring. These difficulties mostly arise from the technical requirements (e.g., internet bandwidth, computer processing power, and storage capacity) required for handling large volumes of satellite data. In anticipation of these difficulties, and to make our approach accessible for implementation in other regions, our methodology relies on the use of geospatial cloud computing resources provided by Google Earth Engine (GEE; Gorelick et al., 2017), with automated and documented workflows that facilitate local adaptation by relevant stakeholder communities. This framework is scalable and repeatable and aims to support mapping in arid and semiarid regions around the world with woody plant canopy/height varying from open/short (<5 m) to closed/tall (>5 m).
Materials and Methods
Study Area
Our study area is the full geographic extent of Senegal in West Africa (Figure 2). Senegal has a bio-climatic gradient ranging from the arid Sahel in the north (mean annual precipitation or MAP < 300 mm, with low %WCC and shrubs and trees generally 1–2 m tall), through the semi-arid Sudano-Sahelian zone (300 mm < MAP < 900 m, a blend of woodland and grassland savannas, with shrubs and trees 2–6 m tall), to the humid Guinean savanna/forest mosaic south of The Gambia (MAP > 900 mm, trees up to ∼10 m tall) (Kumar et al., 2019). Geomorphologically, Senegal is a mostly flat country with a maximum elevation less than 200 m above sea-level (Diouf et al., 2015; Anchang et al., 2019). The northern, central and eastern parts of Senegal are the main zones of pastoral activity and have been divided into 4 ecological zones reflecting soil and land use characteristics: Sandy Ferlo (north), Ferruginous Ferlo (north east), mixed agro-pastoral zone (central) and savanna-woodland transition zone (East) (see Figure 2, as well as Diouf et al., 2015). Senegal has an estimated population of 16 million people, with a rural populace that is principally engaged in rain-fed agriculture and pastoral (livestock grazing) activities, both of which directly impact woody resource availability and sustainability. Urban populations also exert notable influence on woody resources through a high household demand for fuelwood and charcoal (2002 Census data from Minnesota Population Center, 2018).
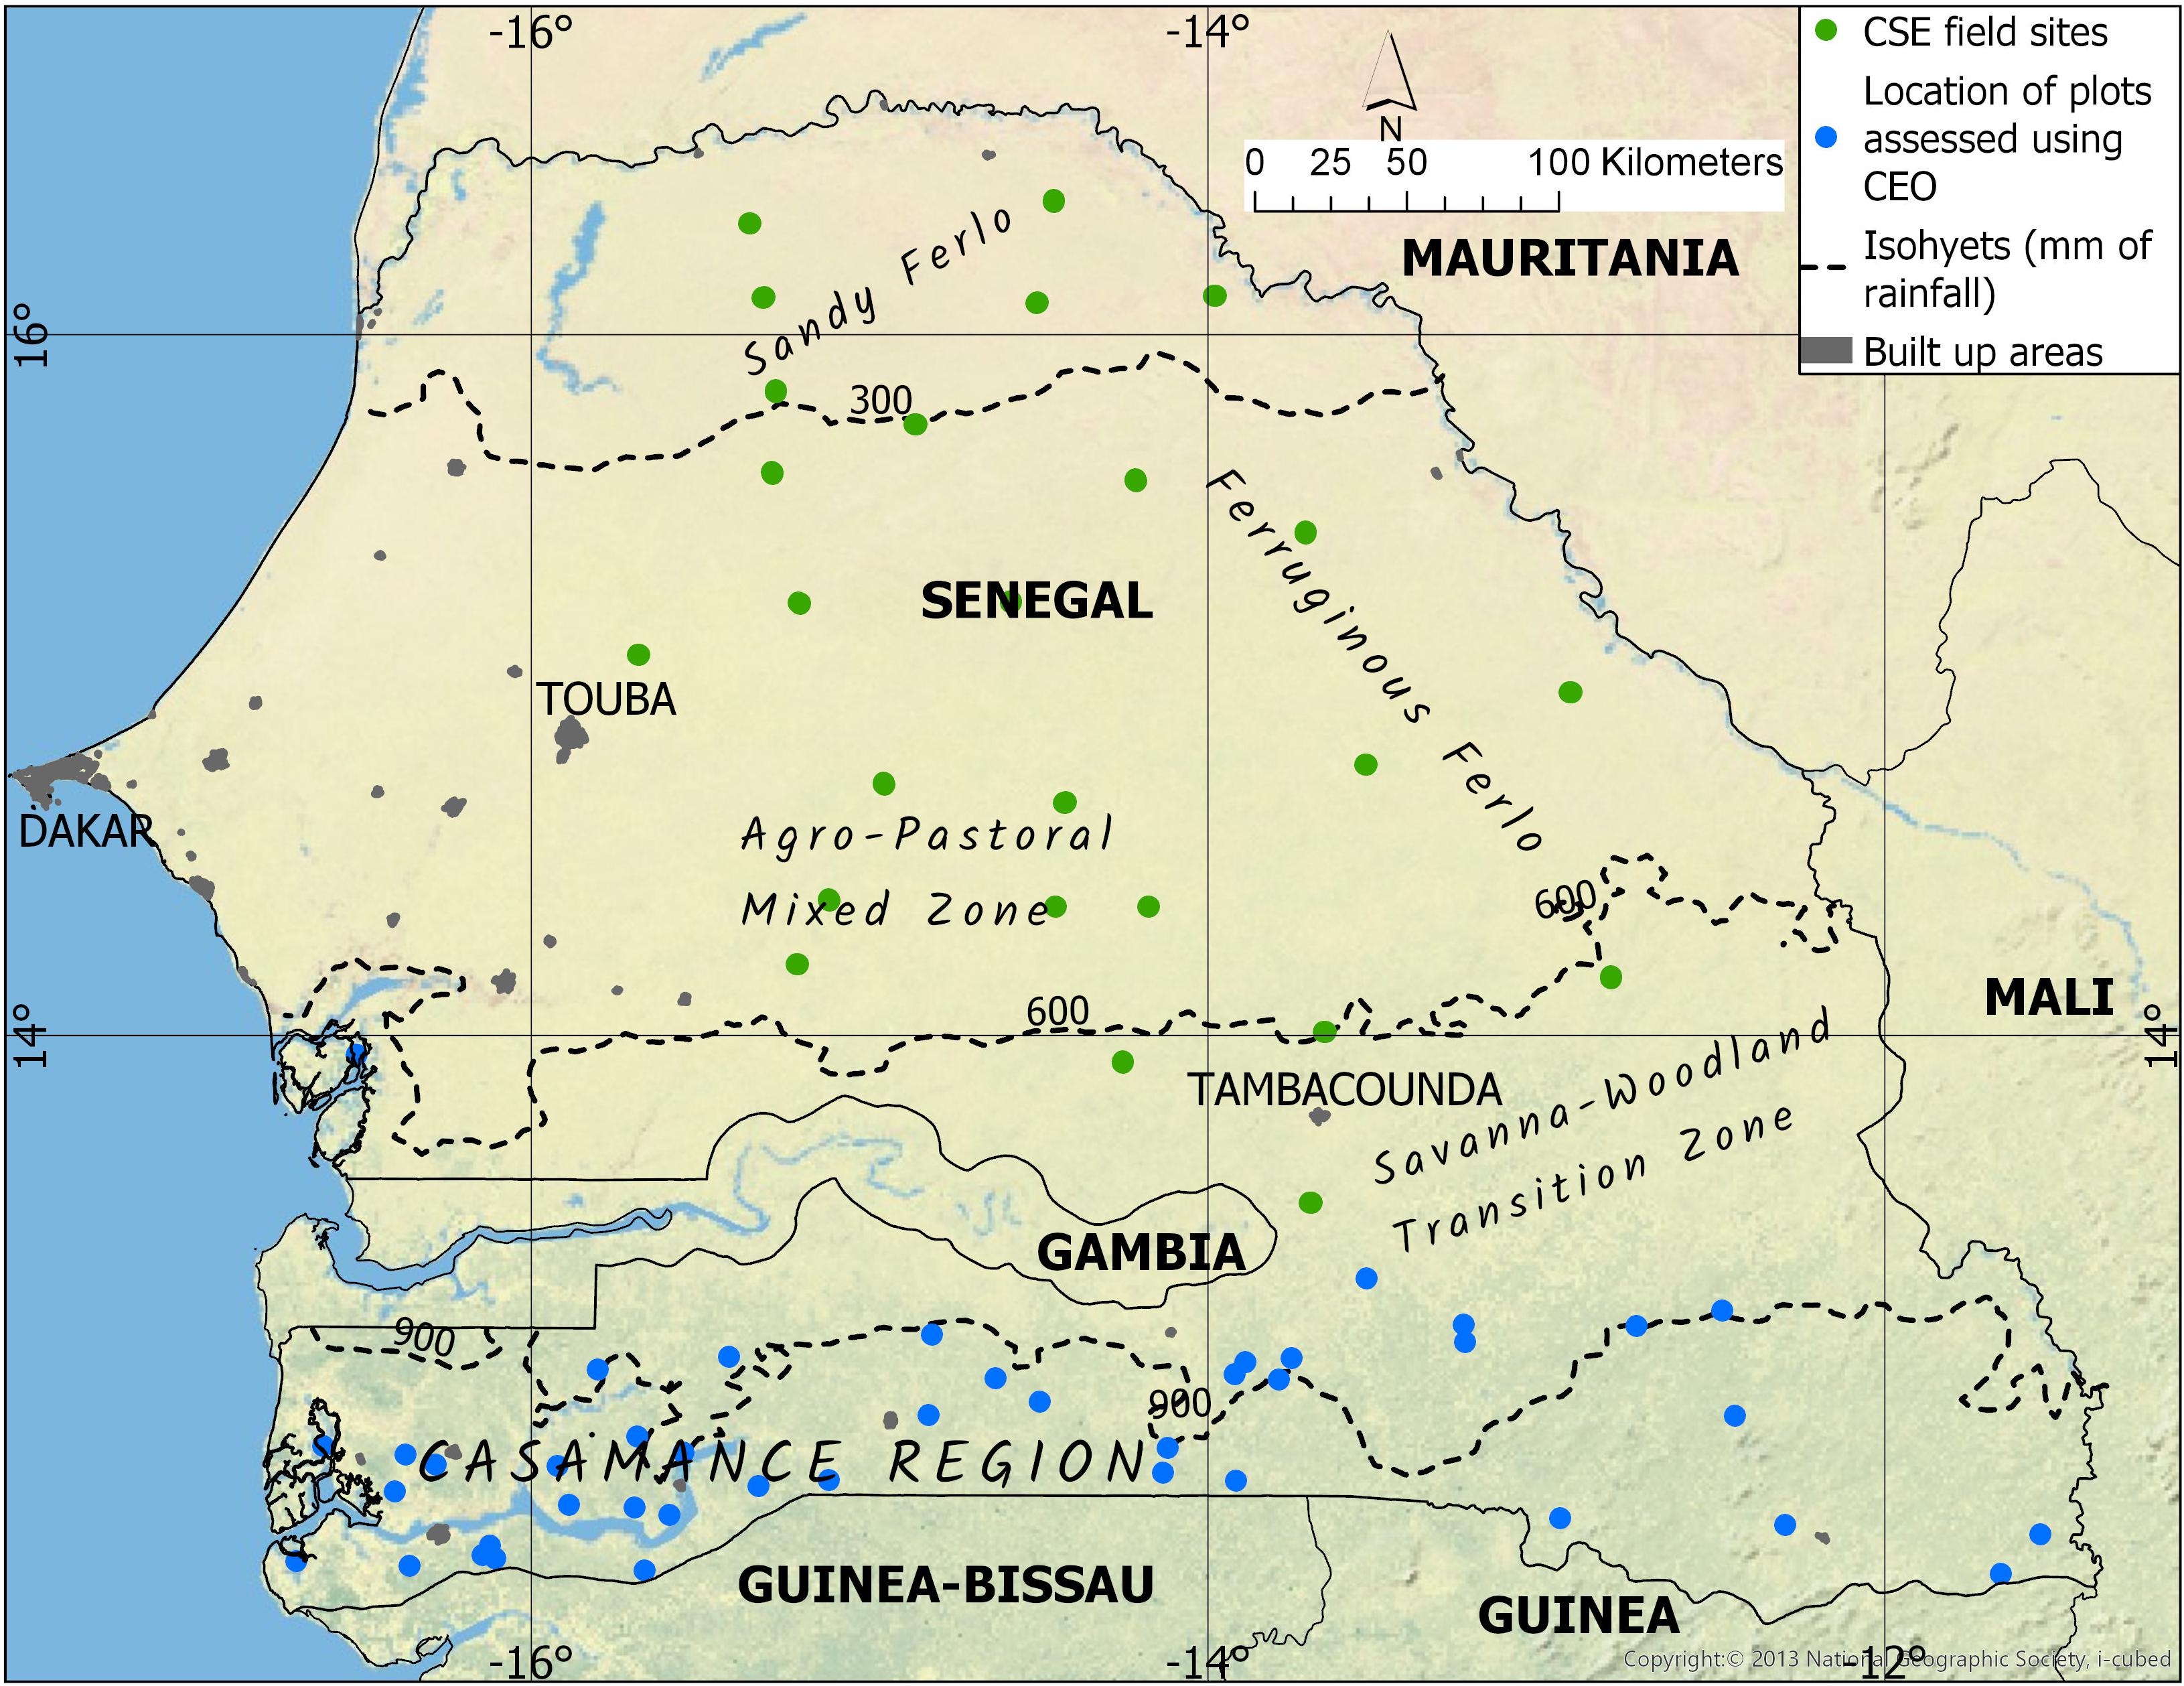
Figure 2. Map of Study Area (Senegal). Centre de Suivi Ecologique (CSE) field sites indicated in green. Locations of plots analyzed using very high resolution (VHR) imagery within Collect Earth Online (CEO) indicated in blue. Isohyets (mean annual precipitation in mm for the years 1981–2018) were derived using Climate Hazards Infra-Red Precipitation with Stations (CHIRPS) rainfall data (Funk et al., 2015).
Software Tools
The methodology described in this paper was designed and implemented mostly using Google Earth Engine (GEE; Gorelick et al., 2017), a cloud-based computing platform that allows for planetary scale geospatial data retrieval, processing and analyses. It can be accessed programmatically using a Java code editor browser interface or a Python application programing interface. GEE significantly lowers the technical and infrastructural requirements for geospatial analysis of large areas, as the ‘heavy lifting’ is carried out by server-side functions. It currently boasts an impressive and constantly improving library of free earth observation/geospatial datasets and open source analytic tools. We used GEE for all satellite data retrieval and preprocessing, model training and validation, and deriving final %WCC maps (see Supplementary Material for details on how to access project code materials and an online demo).
Collect Earth Online (CEO)1 is another free online tool featured in our methods. It is a browser-based adaptation of the Collect Earth desktop tool (Bey et al., 2016). CEO allows for augmented visual analysis of VHR imagery to derive land cover data at the field/plot scale. We used CEO to acquire supplementary measurements for model training and validation.
The use of offline (i.e., desktop) tools was intentionally limited. ArcGIS Pro (ESRI, 2017) was used to prepare GIS point shapefiles of field/CEO data for upload to GEE environment (any open source GIS software, e.g., QGIS, could also be used for this). Python machine learning libraries were also used to reproduce model results on the desktop environment and to access advanced model utilities not currently available in GEE.
Methodology
Workflow Description
Figure 3 illustrates the steps (preprocessing, compositing, and modeling) employed in mapping %WCC from combined optical-radar remote sensing data.
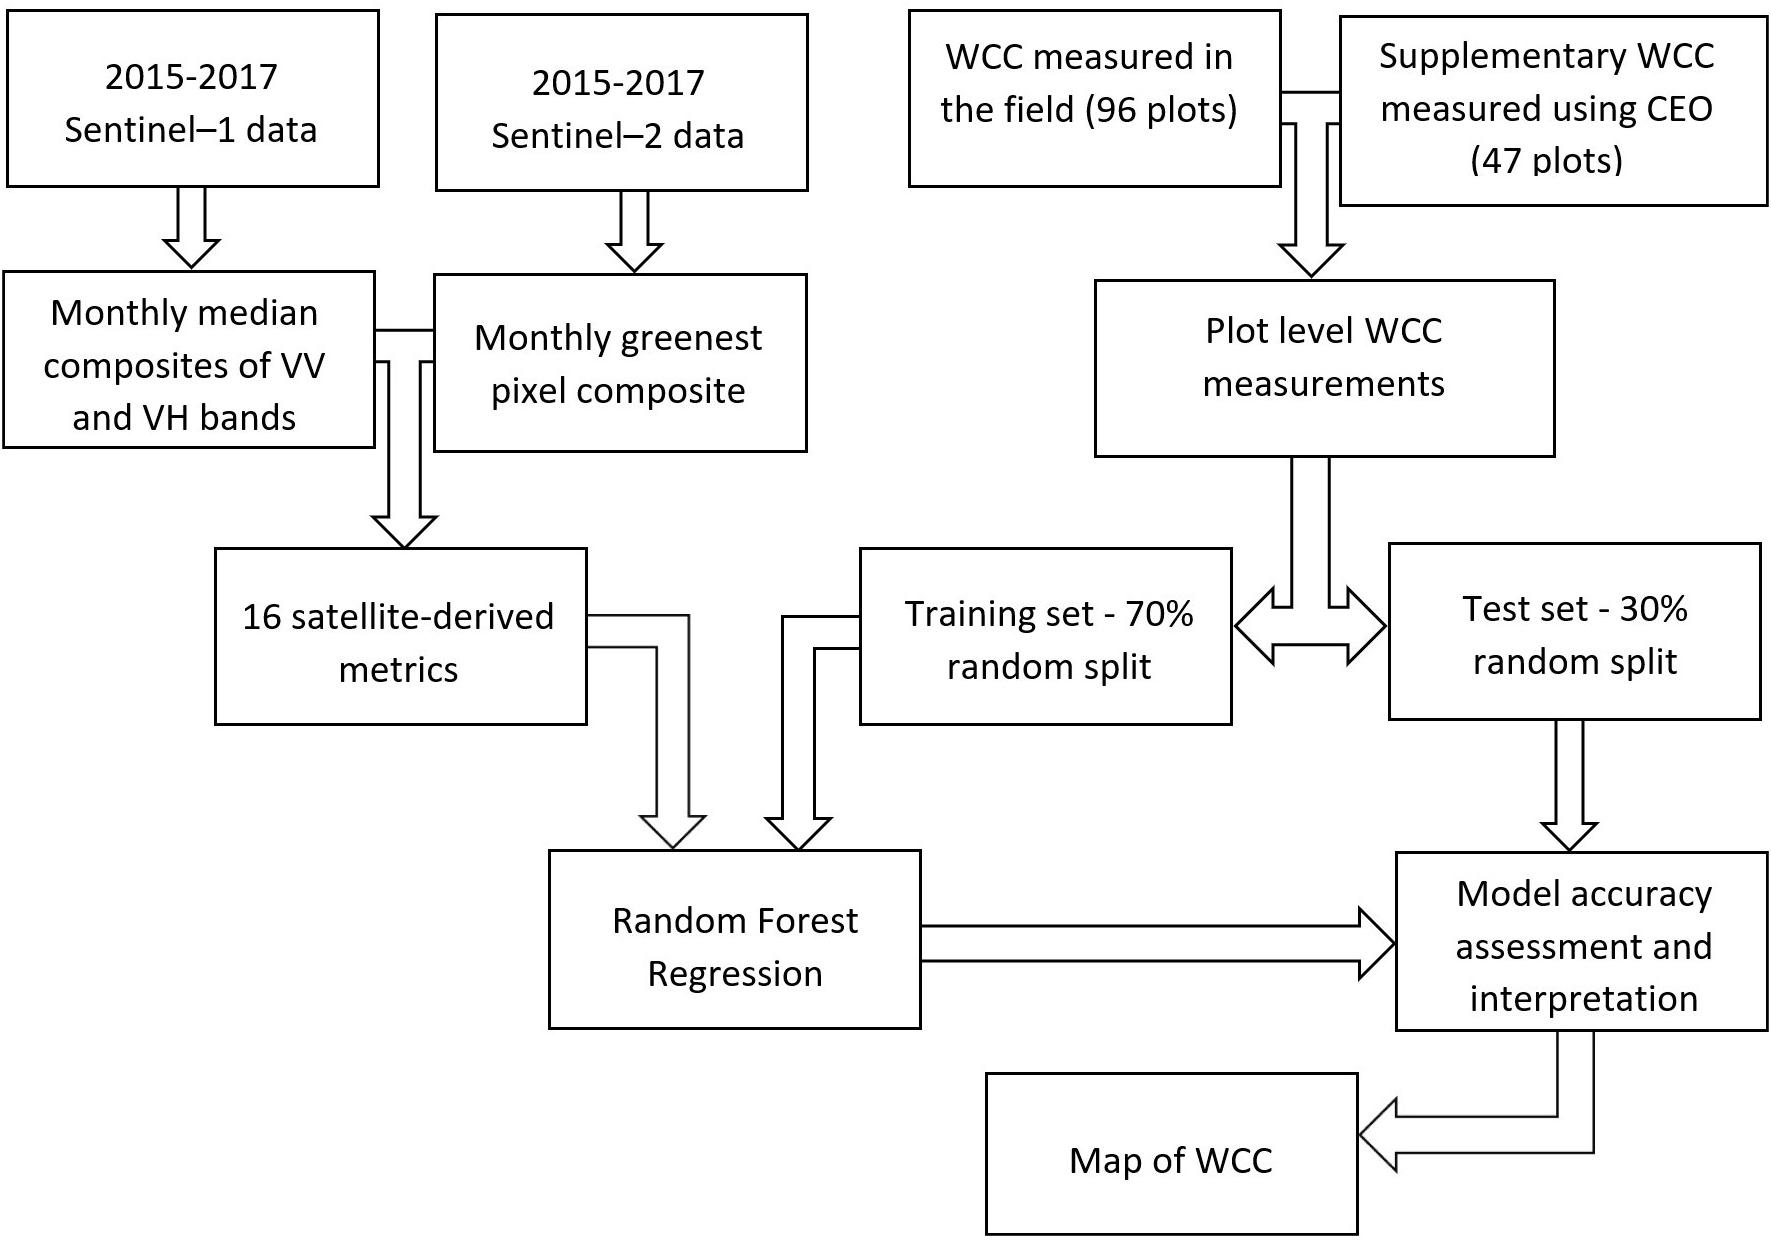
Figure 3. Methodology used to model woody canopy cover (%WCC) from remote sensing data. CEO, Collect Earth Online; VV, vertical-vertical polarization; VH, vertical-horizontal polarization.
Data Preparation
Plot level woody canopy cover
We combined plot level measurements obtained from the field and from VHR imagery to train and validate empirical models for predicting %WCC. Field data were collected in 2015 from 24 field sites located in relatively homogenous landscapes in the Northern, Central and Eastern regions of Senegal (Figure 2; green dots). These sites are part of a long-term in situ biomass monitoring effort by the Ecological Monitoring Center (Centre de Suivi Ecologique or CSE) located in Dakar, Senegal. Each site is a 1km transect along which four (4) circular plots with radius varying from ∼19 m (totaling 0.5 hectare per site) to ∼28 m (totaling 1 hectare per site) are placed at regular intervals (200, 400, 600, and 800 m), giving a total of 96 plots with data available for our analysis. %WCC is assessed within each plot at the end of the growing season (i.e., peak canopy greenness) every 2 years, through an exhaustive inventory process that includes, amongst other things, measuring the diameter along two axes of the visible crown surface area of every woody plant (Diouf and Lambin, 2001). Normally, the plot data are aggregated for each site to provide estimates of %WCC at the hectare (ha) scale. For our purposes, however, the circular plots are at a scale well-matched to that of medium resolution (<100 m) remote sensing data. Thus, for this study we utilized the non-aggregated (i.e., plot level) measurements obtained during the 2015 field campaign.
Given that the field sites are largely restricted to the drier parts of Senegal (the Ferlo regions, Figure 2), field measured %WCC was mostly in the 0 – 60% range. We thus additionally sampled the southern more humid/forested portion of the country (i.e., southeast Senegal and the Casamance region located south of The Gambia). This was done to acquire additional %WCC measurements at the field plot scale, using VHR image data, for reliable predictions in the 60 – 100% range (Figure 2; blue dots). In total 200 random locations were chosen within this region to be assessed using the CEO tool. To be consistent as possible with both the CSE field data and satellite data (described hereafter), we set up a 40 by 40-m rectangular plot at each random point location and filtered the DigitalGlobe imagery to the years 2015–2017. Each plot was populated with gridded sample points spaced 5 m apart inclusive of plot edges (i.e., 9 × 9 = 81 sample points per plot) (Figure 4). The %WCC fraction within a plot was determined by labeling each sample point as either covered by a tree/shrub or not and obtaining a tally for the entire plot (1 labeled point = 1/81 or ∼1.23% of cover). To ensure accurate results in the CEO analysis, we only assessed plots with the highest visual quality in the DigitalGlobe imagery available for the given years, leading to a very low retention rate (47/200 or ∼25% of plot data retained). Added to the 96 CSE field plots, this gave us a total of 143 plot level measurements to be used in calibrating our %WCC prediction models.
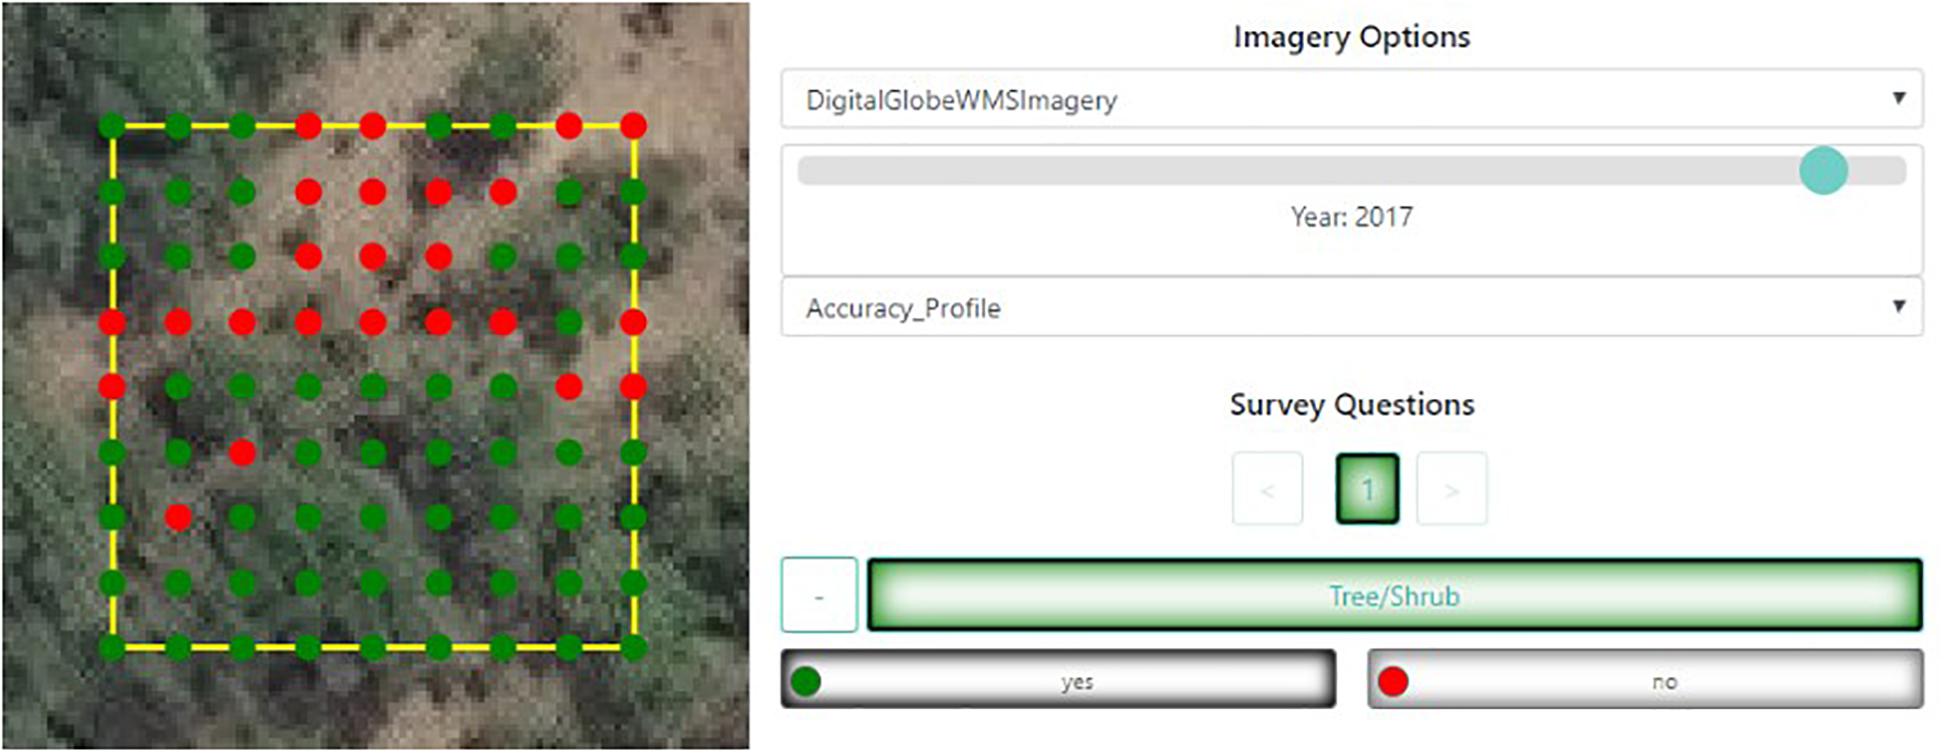
Figure 4. Example of plot level assessment of %WCC using Collect Earth Online (https://collect.earth/). Plot dimensions are 40 m by 40 m with 9 × 9 (81) sample points spaced 5 m apart. In this illustration, the proportion of ‘green’ dots provides an estimate of percent %WCC within the plot. Base VHR image shown is a 2017 acquisition (Courtesy of DigitalGlobe).
Satellite data
Using the code editor (Java) interface of GEE, we retrieved all Sentinel-1 (C-band synthetic aperture radar) and Sentinel-2 (optical reflectance) data, acquired at 12- and 5-day intervals respectively within a 3-year period (01 January 2015 – 31 December 2017), and covering the entirety of Senegal (Copernicus Sentinel Data, 2015). We used these data to create gap-free annual composite metrics, aggregated to 40 m spatial scale, that would serve as empirical correlates of per-pixel %WCC. Tree cover mapping studies have shown that using multi-year imagery leads to more accurate and stable predictions than using single date imagery (Karlson et al., 2015; Urbazaev et al., 2015; Brandt et al., 2016a). Longer-term composites are less susceptible to variations in image acquisition conditions that would otherwise influence backscatter/reflectance from single-date imagery or very short-term composites.
For Sentinel-1 (S1), we specifically used the Interferometric Wide (IW) Ground Ranged Detected (GRD) high resolution (10m) product, with both vertical-vertical (VV) and vertical-horizontal (VH) polarization, acquired in the ascending orbit. S1-GRD data in GEE is already pre-processed as follows: orbital file application, thermal noise removal, radiometric calibration, and terrain correction. Our workflows additionally applied a spectral noise filtering function using the Enhanced Lee Speckle Filter (Lopes et al., 1990) and an incidence angle correction function to minimize inter-scene variation.
For Sentinel-2 (S2), we used the Level 1C (non-atmospherically corrected) product, retrieving spectral bands in the visible (10 m), near infra-red (NIR) (10 m), red-edge (RE) (20 m), and short-wave infrared (SWIR) (20 m) electromagnetic region. We note that GEE has already ingesting atmospherically corrected (Level 2A) S2 products as of early 2019. However, these do not yet offer enough temporal coverage for our current analysis and are reserved for future iterations. For the present analysis, however, we performed the following steps to minimize atmospheric effects and improve the overall quality of composite metrics: (i) cloud and cloud shadow masking, (ii) bi-directional reflectance distribution function (BRDF) correction (Roy et al., 2017a, b), (iii) geometric and topographic correction, (iv) monthly ‘greenest’ (i.e., maximum NDVI) compositing, (v) use of ‘median’ instead of ‘mean’ when averaging to minimize effects of temporal outliers.
Satellite-Derived Metrics as Empirical Determinants of %WCC
A total of 16 remote sensing metrics were generated as a single multiband composite image, at a 40 m resolution scale, and used to provide independent variables for predicting %WCC. These metrics were chosen to be relevant in sensing diverse vegetation properties, including those that are useful in discriminating woody from non-woody plants (Table 1). Most importantly, they could be derived directly from S1 and S2 data. The pixel values of each band were then extracted for the 143 plot locations to produce a single data table for modeling.
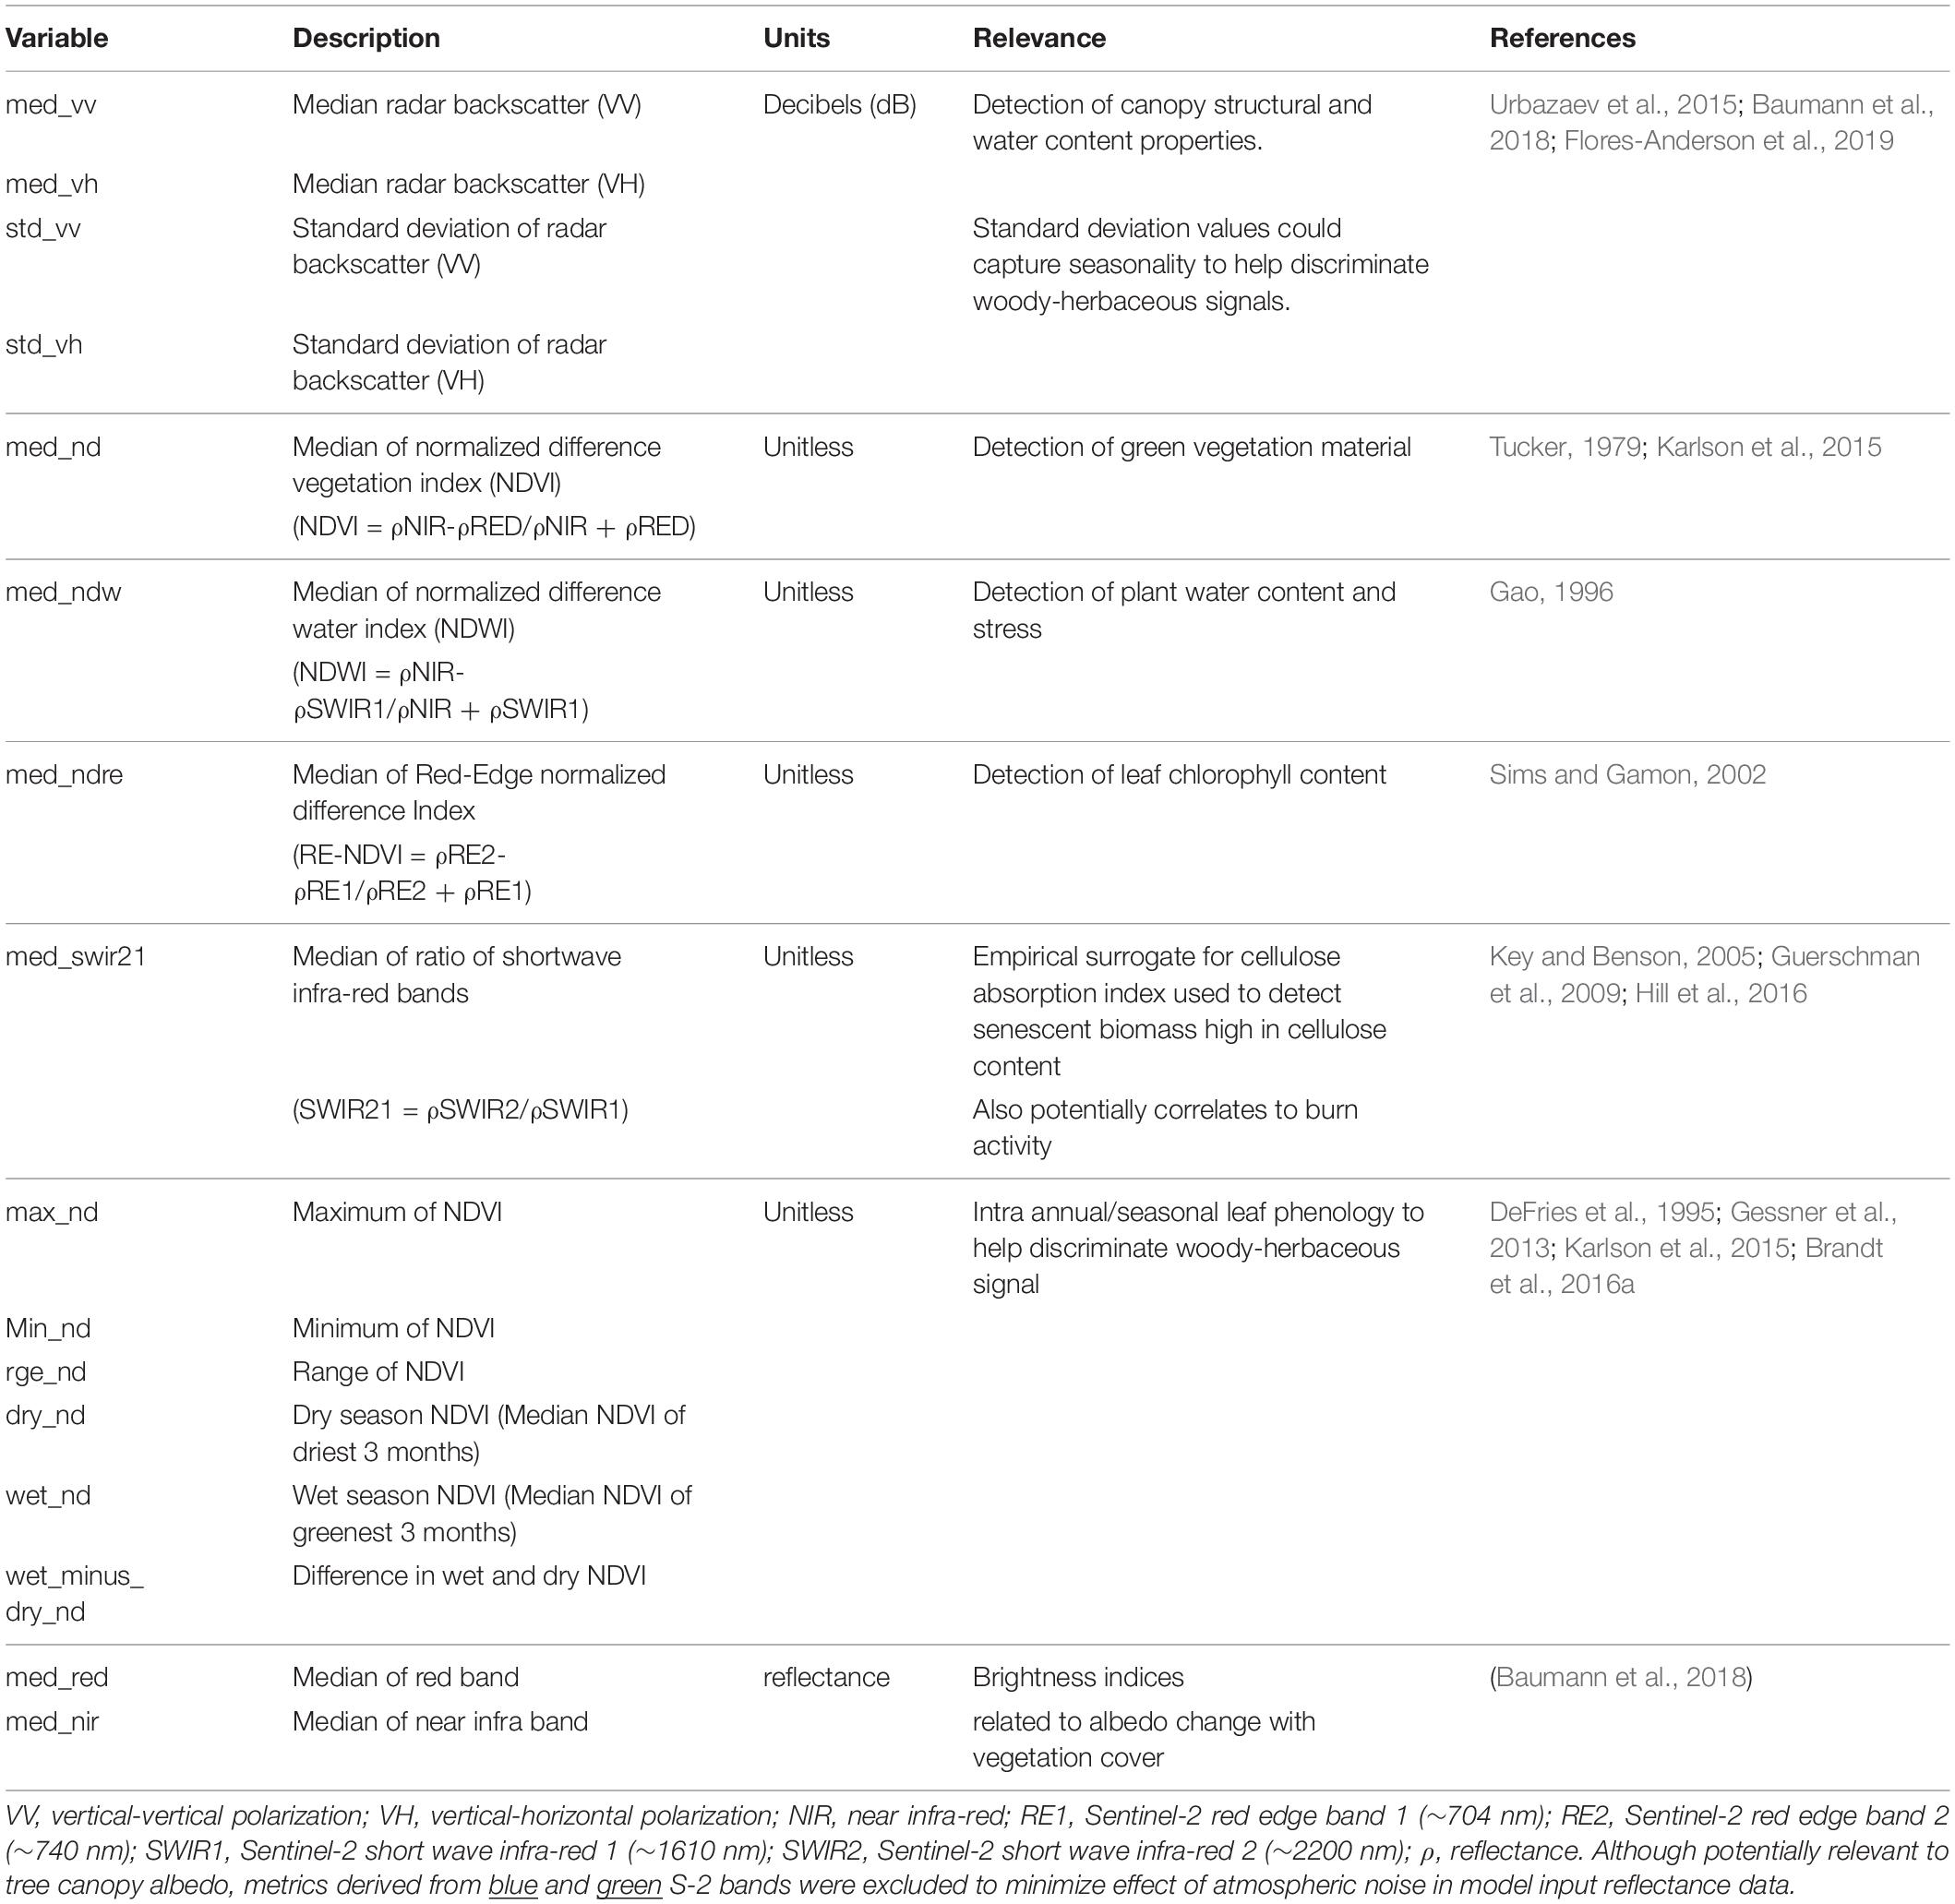
Table 1. Satellite-derived metrics evaluated for predicting %WCC.
Random Forest Model Training and Validation
We used random forest regression (Breiman, 2001) within GEE to predict percent %WCC (response variable) from our selected satellite-derived metrics (independent variables, Table 1). The random forest technique belongs to the family of ensemble decision tree models where final predictions are obtained by averaging the predictions of multiple individual regression trees. Generalization error in random forests is minimized by increasing diversity among the tree population through the random subsampling of observations and variables (features). Current implementation of the machine learning algorithms in GEE is relatively ‘barebones,’ with missing utilities such as the ability to visualize variable importance and partial dependence on the fly. As such we also replicated the modeling exercise in a desktop environment using the random forest regressor function provided in the Python machine learning library (Scikit-learn) (Pedregosa et al., 2011). To allow use of python tools to evaluate and fine-tune GEE based models, we established reproducibility of results between GEE and Python for the same data and basic model parameters.
A 70%/30% random split was used to create independent training and test samples, respectively, for the random forest model. Hyper-parameter tuning of the model was done by trial and error: sequentially altering individual parameters (e.g., number of trees) and observing the effect on training root mean square error. We eventually settled on the following model settings for our case of Senegal: 150 trees, minimum leaf prediction size of 4, 1/3 of variables randomly selected per tree, and a bag fraction of 0.9 (i.e., fraction of training sample randomly chosen with replacement for each tree model). The choice of a high bag fraction was necessary due to the relatively small size of our training sample (i.e., 70% of only 143 plot level measurements) ensuring enough data for model learning while allowing for some cross validation within the model. Eventually, independent model validation was done by calculating the root mean square error (RMSE) of predictions on the test sample (plot observations not exposed to model fitting and tuning).
Model Interpretation
In addition to our main objective of accurate %WCC mapping, we also sought to identify the most important satellite-derived determinants of savanna %WCC and the possible causal (statistical or mechanistic) relationships driving the model. We used two model-agnostic interpretation tools (i.e., tools that are not specific to any given model), namely variable permutation importance (Breiman, 2001) and the Accumulated Local Effects (ALE) (Apley, 2016; Molnar, 2019). Permutation importance measures the mean decrease in model accuracy (mean increase in prediction error) when a specific variable is excluded, by shuffling its original values to create noise drawn from the same distribution (Breiman, 2001). We calculated permutation importance using only the test sample data, in order to place it in the context of model generalization (Molnar, 2019). By contrast, the ALE plot shows the locally averaged marginal effect of a specific independent variable on predictions of the dependent variable and is an improvement over the more commonly used partial dependence plot (Friedman, 2001). For each observation of a specific predictor (i.e., x-value), the ALE plot calculates the average change in the target prediction within a local multidimensional window around x-value. This alleviates the requirement for model covariates to be uncorrelated and provides an unbiased visualization of the shape (e.g., linear, monotonic) of the individual predictor-response space. We used ALE plots to infer underlying statistical and/or biophysical drivers of the model, using our knowledge of savannas and radar/optical remote sensing principles.
Finally, we used several sub-models to examine the value of the optical-radar data fusion approach. A separate model was developed for each of the following sets of independent variables: (1) only radar-based metrics, (2) only optical-based metrics, (3) only radar-based median metrics, (4) only optical-based median metrics, (5) only radar-based inter-annual variability metrics, (6) only NDVI seasonality metrics. We compared the performance (RMSE) between sub-models and with the full model to determine which combinations of metrics were most optimal for accurately predicting %WCC.
Results and Discussion
%WCC in Senegal
Using all available predictor variables, our random forest model was able to predict %WCC for Senegal at 40 m spatial resolution (Figure 5) with a high degree of accuracy (training sample RMSE of ∼5%, independent test sample RMSE of ∼8%, Figure 6). A visual examination of the final map showed the distribution of predicted %WCC in Senegal to be consistent with what we expect of woody resource distributions across climatic, biogeographic and anthropogenic gradients in Senegal. With the exception of riparian vegetation and irrigated agriculture along the Senegal River in the northern border with Mauritania, predicted %WCC in Senegal generally followed a latitudinal (southward increasing) gradient, supporting the ecological postulation that maximum %WCC in African savannas is constrained by precipitation levels (Sankaran et al., 2005).
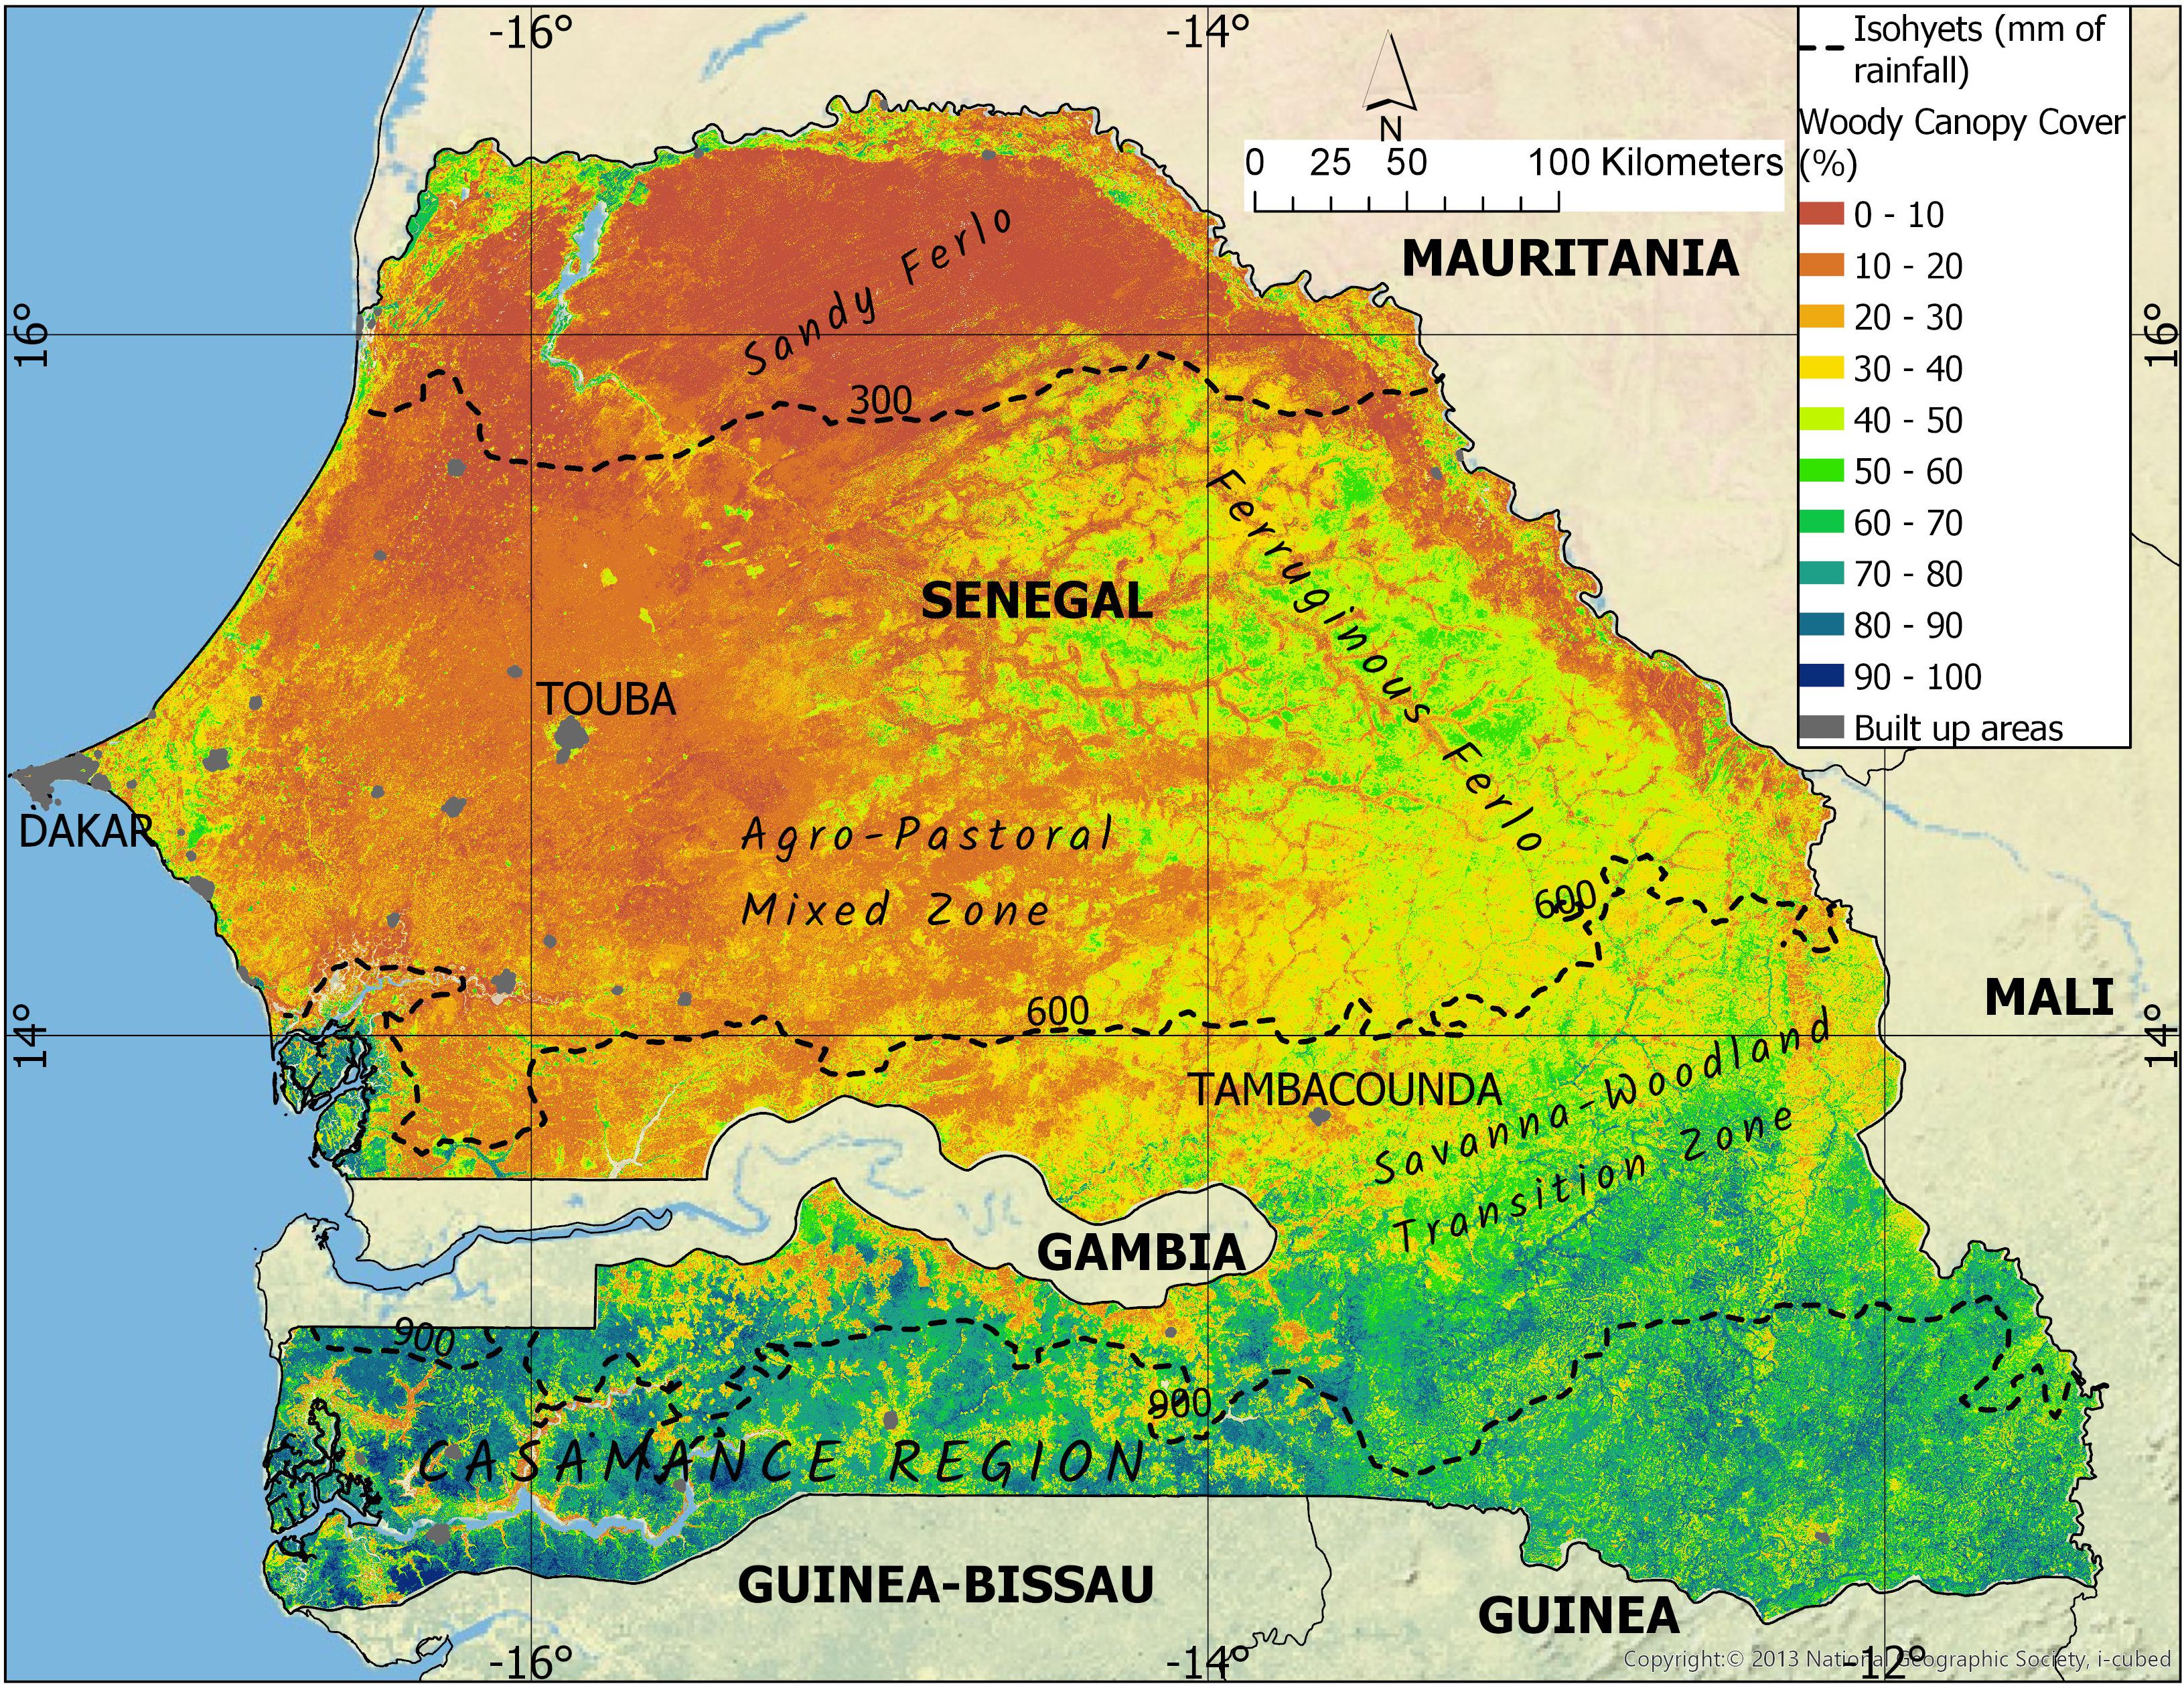
Figure 5. Map of percent %WCC in Senegal, predicted from combined radar and optical remote sensing metrics using a random forest model trained and evaluated using field and VHR imagery data (Figure 1).
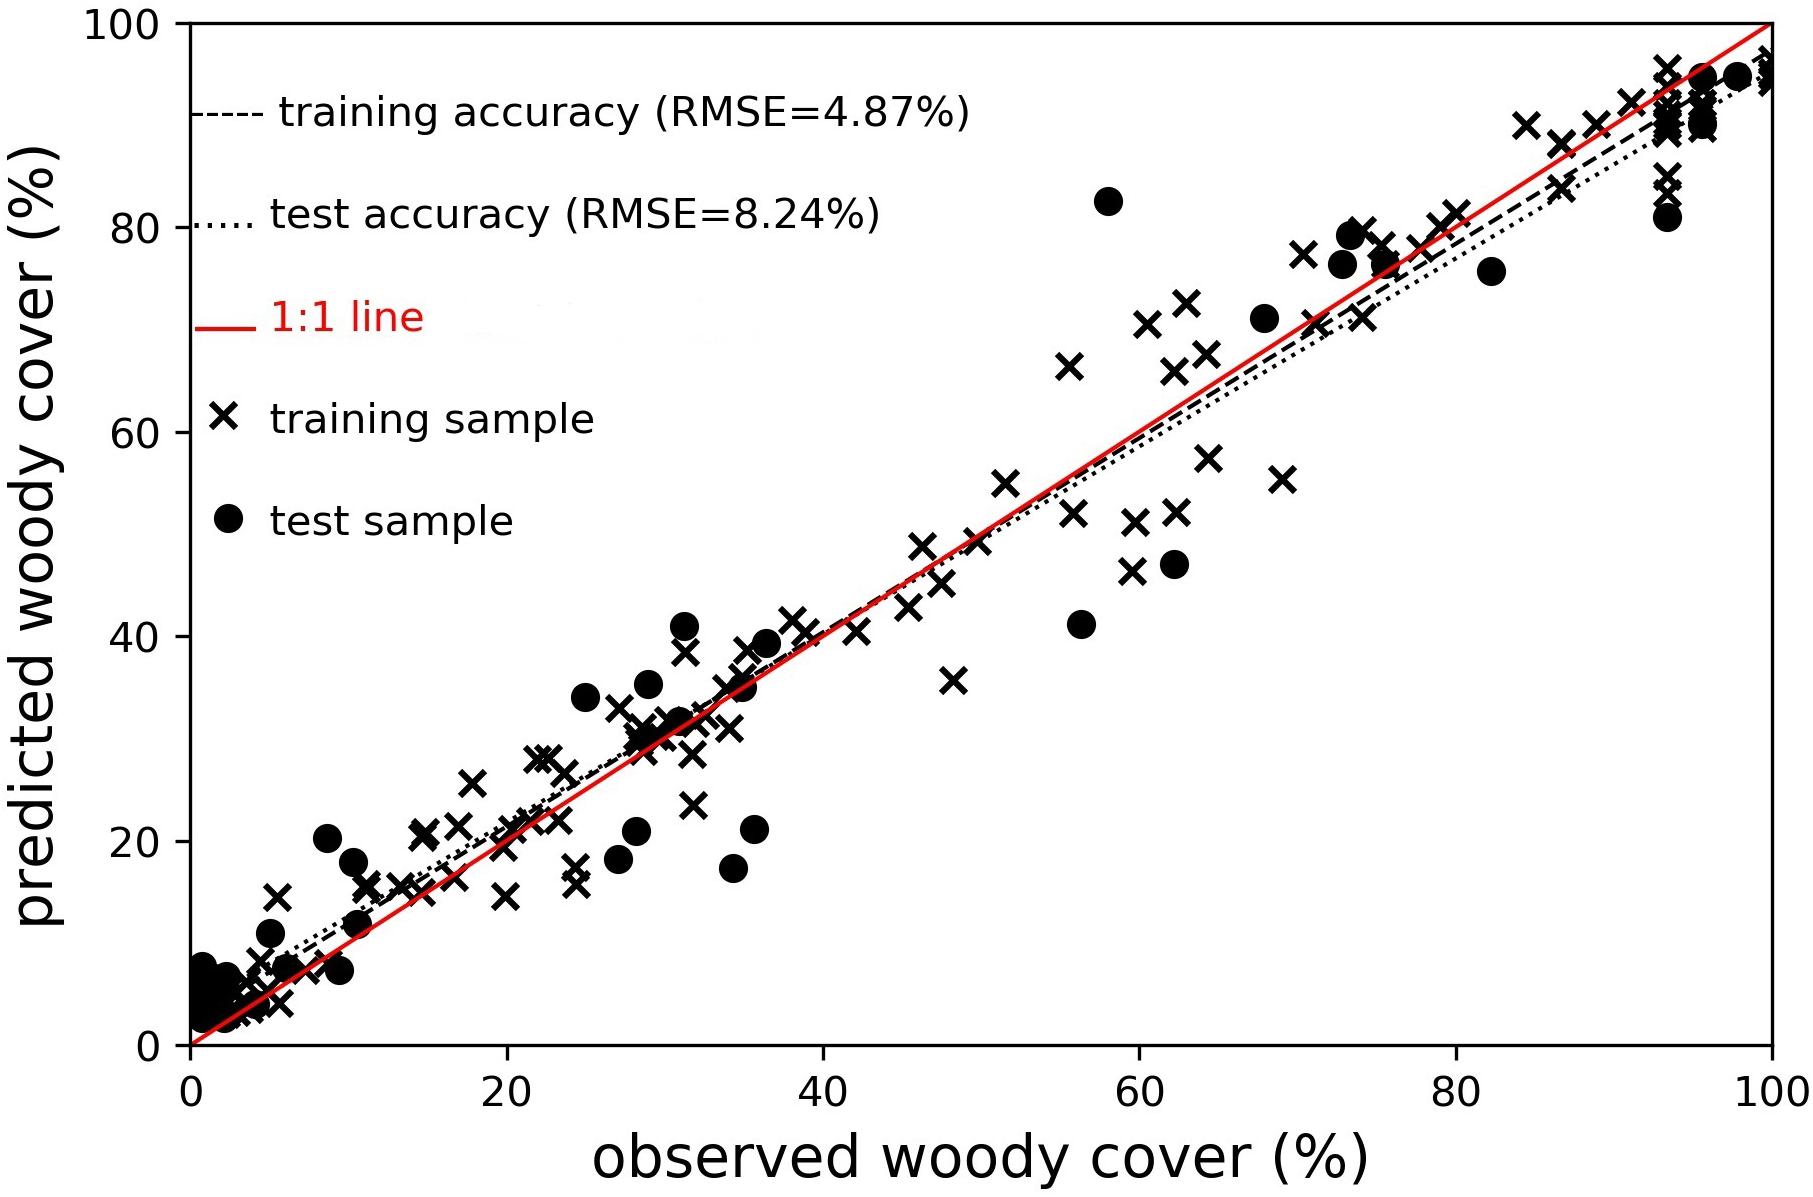
Figure 6. Random forest model training (N = 104) and validation (N = 39) accuracy for %WCC estimates in Senegal.
In northern Senegal (the region known as the Sandy Ferlo), low %WCC cover was predicted by our model (mostly < 10%, Figure 5), consistent with the expectation that low rainfall (MAP ∼300 mm or less) limits the establishment and maintenance of woodland systems. However, despite the low cover, other time-series studies have inferred long-term gains in woody vegetation in this area, mostly as recovery from 1970s/80s drought events (Kaptué et al., 2015; Anchang et al., 2019), but also due to relatively low human influence in areas that are largely not suitable for agriculture (Brandt et al., 2017). Our ability to detect low cover of trees and shrubs in this region can play a key role in supporting such conclusions in future studies.
In the Sudano-Sahel savanna ecoregion, predicted %WCC was noticeably lower on the western side (mostly < 30%, Figure 5), a likely result of the greater population density and prevalence of agricultural activities in this area. Western Senegal is home to large urban population centers like Dakar and Touba, as well numerous other built-up settlements (Figure 4, gray colored areas) which exert more pressure on local woody resources due to the greater demand for wood products such as fuelwood and charcoal. By contrast, in the eastern Ferruginous Ferlo and savanna-woodland transition zones (Figure 5), predicted %WCC increased to intermediate levels (30 – 60%). In this area, where the urban footprint is considerably less, %WCC is more strongly influenced by herbivory (grazing) and fire activity (Kahiu and Hanan, 2018b).
In the regions of Senegal south of The Gambia (i.e., Casamance region), and furthest to the southeast of Senegal, where MAP > 900 mm, mapping results showed highest levels of %WCC, with pockets of >80% cover predicted in some areas. These high levels of %WCC are evident in the southwestern corner, particularly in the Saloum delta area and along the Casamance River, where riparian/mangrove systems abound. Results also showed, however, instances of fragmentation (breaks in high %WCC) in the southern forested landscape, notably in the southcentral zone (Figure 5), a likely outcome of forest clearance for cultivation.
Interpreting Model Predictions of %WCC From Satellite-Derived Metrics
Variable Importance
We used variable importance (permutation importance) scores obtained from the fitted random forest model to examine the importance of individual metrics in accurately predicting %WCC in the validation sample (Figure 7). Results indicate that the median of VV and VH backscatter (med_vv and med_vh), the median of SWIR21 (med_swir21), and the median of NDVI (med_nd), were the most important predictors. Meanwhile, the standard deviation of backscatter (std_vv and std_vh), the minimum of NDVI (min_nd), and the median NDVI of the driest quarter of the year (dry_nd) were the least important.
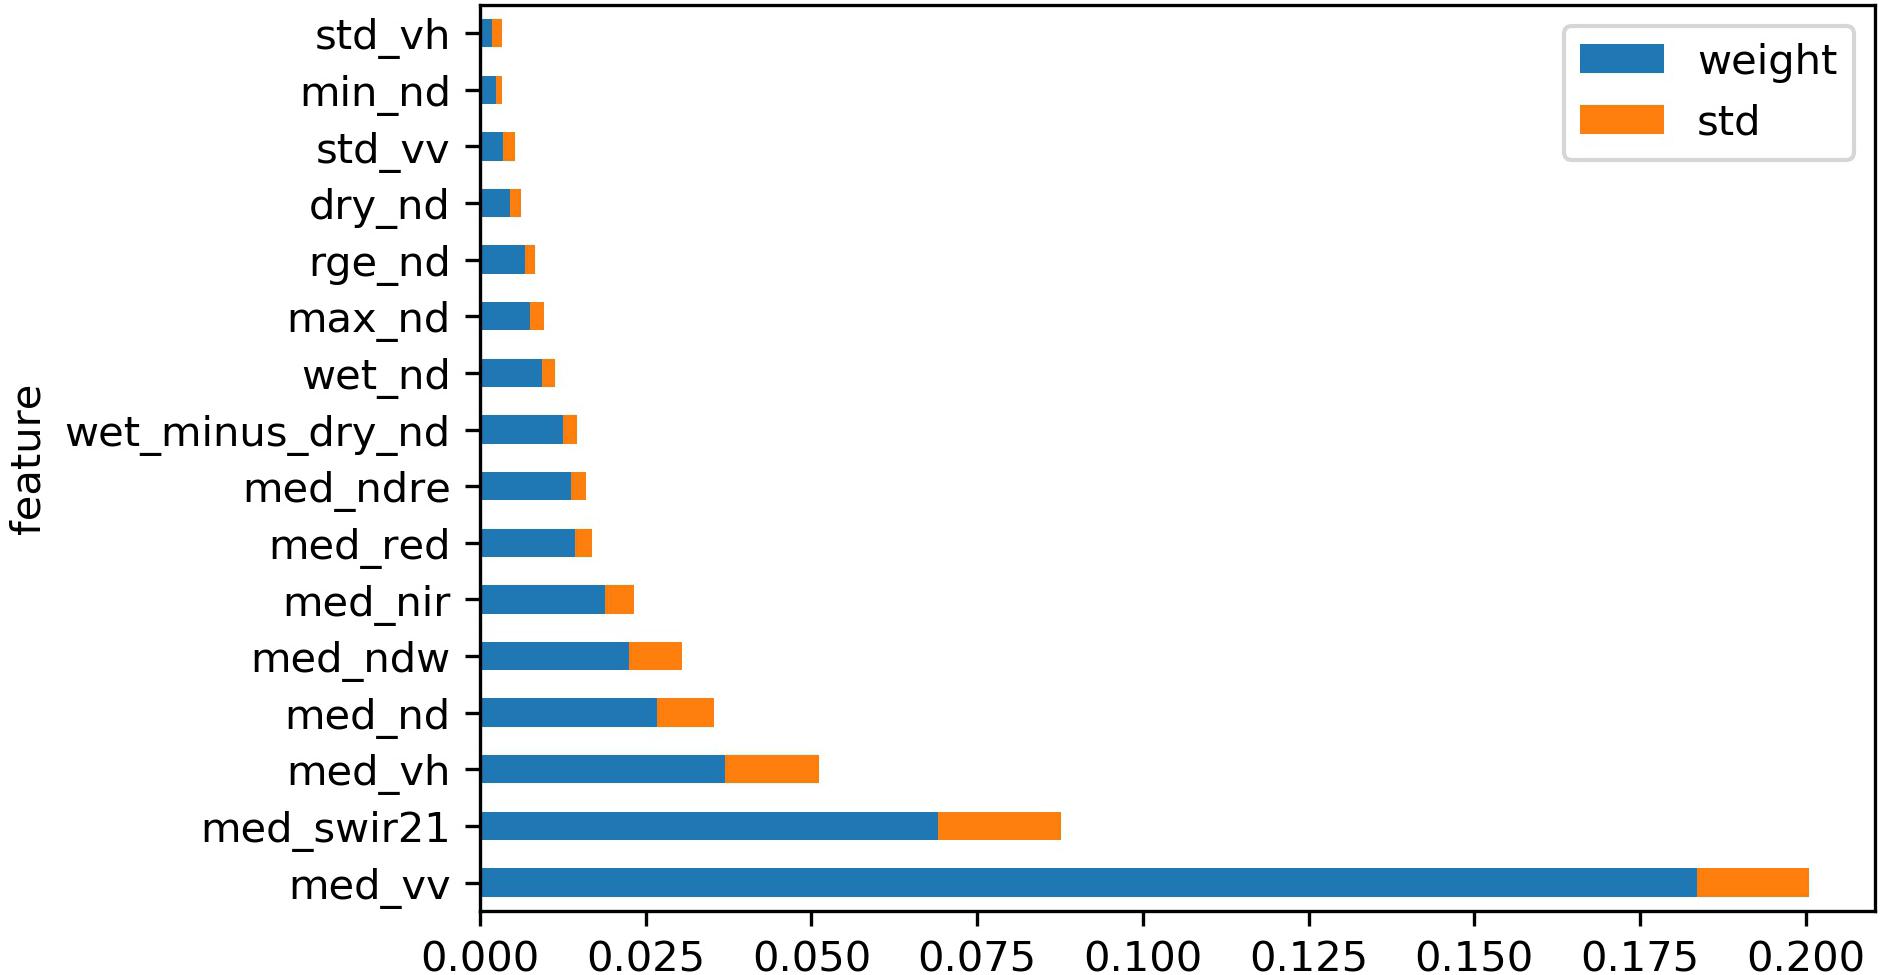
Figure 7. Variable importance in predicting %WCC (refer to Table 1 for full description of abbreviated variable names). Importance weights (x-axis; blue color) reflect the mean increase in test sample prediction error (with associated standard deviation indicated in orange) arising from iterative permutations of each predictor variable (y-axis).
The importance of VV backscatter in predicting woody cover in our model (more than twice as important as the runner-up, med_swir21, Figure 7) is supported by previous savanna mapping studies. Co-polarized radar (i.e., HH and VV polarization) is known to be sensitive to non-leaf canopy components (such as branches and stems) compared to cross-polarized radar (HV and VH polarization), and hence should be more effective in sensing woody vegetation in the dry regions like the Sahel where most trees are absent leaves at some point during the prolonged dry season (Urbazaev et al., 2015). The second most influential variable was the median of SWIR21, the ratio SWIR band 2/SWIR band 1 (see Table 1). Sentinel 2-derived SWIR21 is analogous to the MODIS-derived SWIR32 (ratio of MODIS SWIR bands 3 and 2), which has been found to be correlated with cellulose absorption index (CAI), derived from hyperspectral data and used primarily in remote sensing of dry/senescent biomass (Guerschman et al., 2009; Hill et al., 2016, 2017). We therefore postulate that SWIR21 in our model correlates to the abundance and persistence of (dry) herbaceous biomass, and that its relatively high importance for predicting %WCC arises indirectly from the competitive interactions between trees and grasses in mesic savannas (Scholes and Archer, 1997; Dohn et al., 2013; Kahiu and Hanan, 2018a).
An interesting perspective gleaned from the variable importance plot is that metrics measuring annual central tendency (i.e., ‘median’) in remote sensing data appeared to be more useful than metrics measuring intra-annual variability (seasonality) (e.g., standard deviation of radar backscatter and the maximum, minimum, range of NDVI). In an attempt to explain this, we consider that the most seasonally variant component of savanna trees and shrubs are the leaves, which are mostly transparent to C-band radar (l∼5 cm) (Flores-Anderson et al., 2019) and depending on phenology (i.e., level of deciduousness), would mostly senesce and fall off during the long dry season. The intra-annual variability of radar backscatter thus offers little in the way of discriminating woody canopies due to the (mostly) unchanging nature of non-leaf components. At the same time, the prevalence of deciduous woody species with varying phenologies (Brandt et al., 2016a, b) combined with long dry periods weakens the model’s ability to discriminate woody plants collectively from herbaceous vegetation based on inter-seasonal variations in ‘greenness’ (NDVI). We anticipate however that precise phenology metrics that capture the onset/length of the greening and leafing (e.g., the MODIS Land Surface Phenology product or MCD12Q2.006; Ganguly et al., 2010; Friedl et al., 2019) may be more useful for mapping %WCC in savannas. However, for our application, these metrics would need to be derived at a spatial scale similar to Sentinel data.
Relationship Between Predicted %WCC and Important Satellite-Derived Variables
We used ALE plots to examine the relationship between individual independent metrics and %WCC predictions (Figure 8). ALE plots measure the sensitivity of the dependent variable to a specific predictor, by averaging the change in prediction derived using all values of other variables found within a local window. The ALE plot for Median VV backscatter showed a strong monotonic association with %WCC prediction. The average change in predicted %WCC generally increased with the value of median VV backscatter, most strongly between the values of ∼−16 dB (below which we expect sample plots observations to be mostly void of trees and shrubs) and ∼−10 dB (above which we expect woody canopy saturation) (Figure 8A). A similar relationship was observed between change in predicted %WCC and the median of VH backscatter (Figure 8C), although the latter’s effect on increasing %WCC predictions begins to saturate at much lower values. This supports our findings (from variable importance analysis) of the greater effectiveness of VV polarized radar to sensing woody canopies.
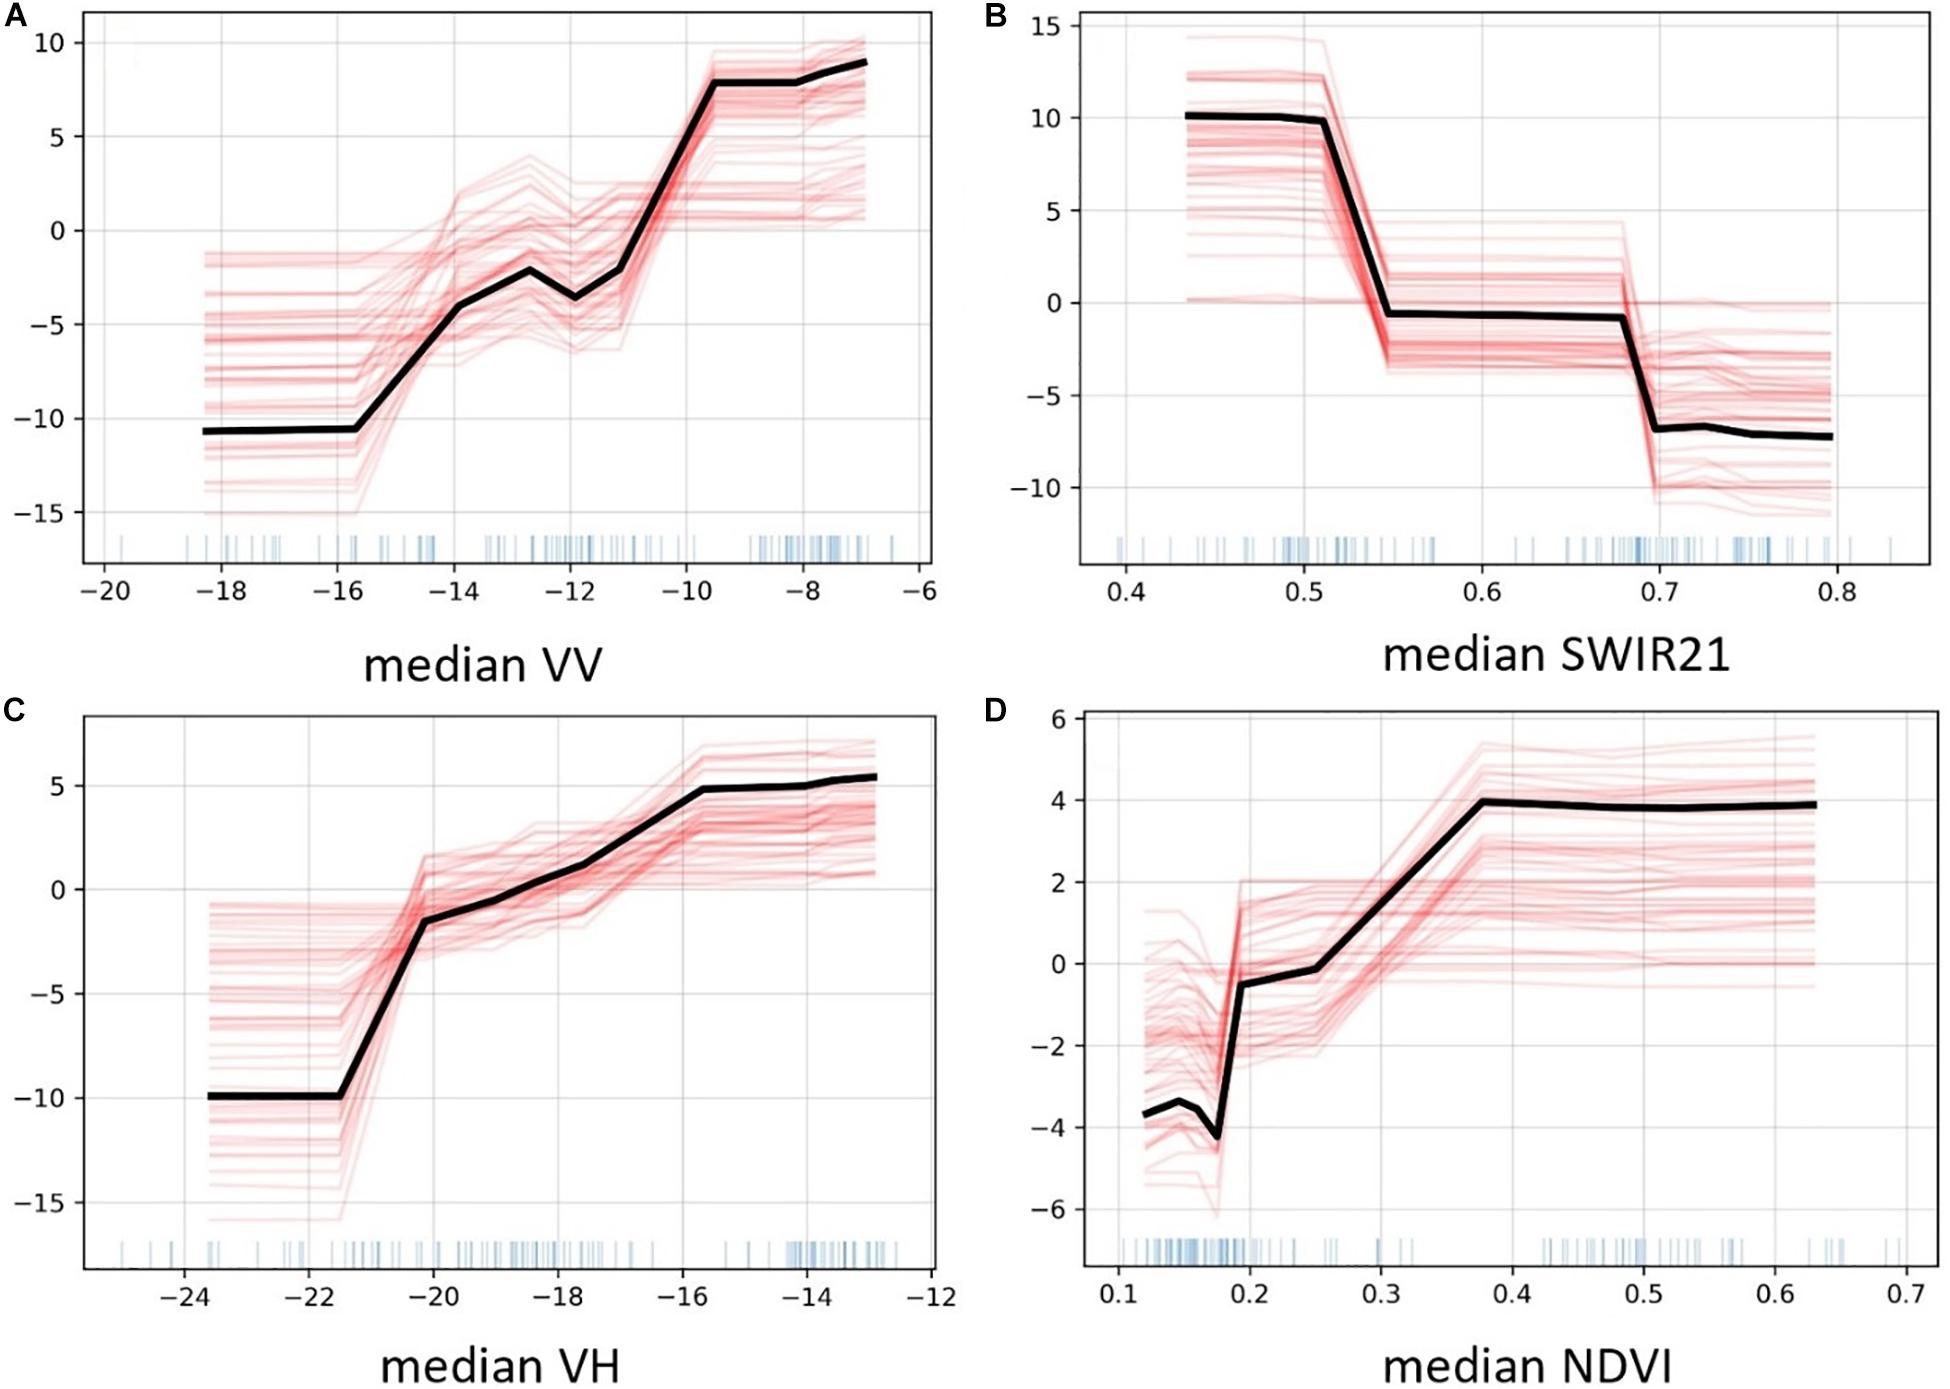
Figure 8. Plots showing Accumulated Local Effects (ALE) plots of percent woody canopy cover (%WCC) prediction sensitivity to the 4 most important independent variables: (A) median of VV backscatter in dB, (B) median of SWIR2/SWIR1 band ratio, (C) median of VH backscatter in dB, (D) median of NDVI. Y-axis indicates average change in %WCC prediction. Red lines are plots for 50 different Monte Carlo samples drawn from the model training data, with black lines showing response without Monte Carlo sampling. Blue markings on x-axis show the distribution of each independent variable.
The ALE plot of med_swir21 (median of SWIR2/SWIR1 band ratio) revealed a strong negative effect on %WCC predictions (Figure 8B), also supporting its relatively high position (second) in variable importance ranking. As we have previously explained, SWIR21 is used in this case a proxy for detecting dry herbaceous biomass, and so its annual median value should positively correlate with grass cover and production in a given location, and hence may negatively correlate with %WCC due to the dynamics of tree-grass competition (Dohn et al., 2013). Incidentally, the numerator of the SWIR21 ratio (i.e., SWIR band 2, ∼2200 nm wavelength) is also used to calculate normalized burn ratio (NIR-SWIR/NIR + SWIR) in which low values are used detect large area burn scars (Key and Benson, 2005). By extension, this means the model could be picking up the likely correlation between SWIR21 and persistent burning activity, which also negatively impacts woody cover (Scholes and Archer, 1997). The ability of tree-based models to incorporate such latent information and handle interactions is what makes them powerful (though not always transparent) tools for predictions.
As would be expected, median NDVI was positively correlated with %WCC prediction, though with a noticeable saturation at NDVI > ∼0.35 (Figure 8D). This is a reminder of the important, but limited, role of spectral indices that respond to only green material in vegetation; they become less effective if used without other data sources in the prediction of the abundance of woody components of the landscape.
Differences in the Performance of Sub-Categories of Satellite-Derived Metrics
The best overall model in terms of accuracy was the full model with all variables present (lowest test sample RMSE of 8.2%, Figure 9A), supporting the assertion that combining radar and optical data sources allows for a more accurate mapping of trees and shrubs (Baumann et al., 2018). It also means less important variables were still useful in minimizing the model generalization error and need not be excluded. Although the median backscatter metrics individually ranked high in predictive importance, models using only radar-based metrics did not achieve the highest model accuracy (test sample RMSE of ∼12%, Figures 9B,D). In fact, models using optical reflectance metrics, with or without NDVI-based seasonality metrics, collectively outperformed the radar-only models (test sample RMSE of ∼9% and ∼10%, Figures 9C,E, respectively). A possible explanation is that the optical reflectance metrics collectively provide more diverse information that is always useful in an ensemble tree-based model. The overall weakness of metrics only capturing intra-annual variability or seasonality in both backscatter and greenness is once again evident (Figures 9F,G). As we have explained previously, variability in radar backscatter (particularly the VV band) will not produce a strong signal for discriminating woody canopies as the most seasonally variable component (i.e., small leaves than senesce and fall off during the dry season) are mostly transparent to C-band radar. However, the usefulness of variables that capture annual variability of NDVI for woody-grass differentiation depends on the relative abundance of woody species with long versus short leaf production periods.
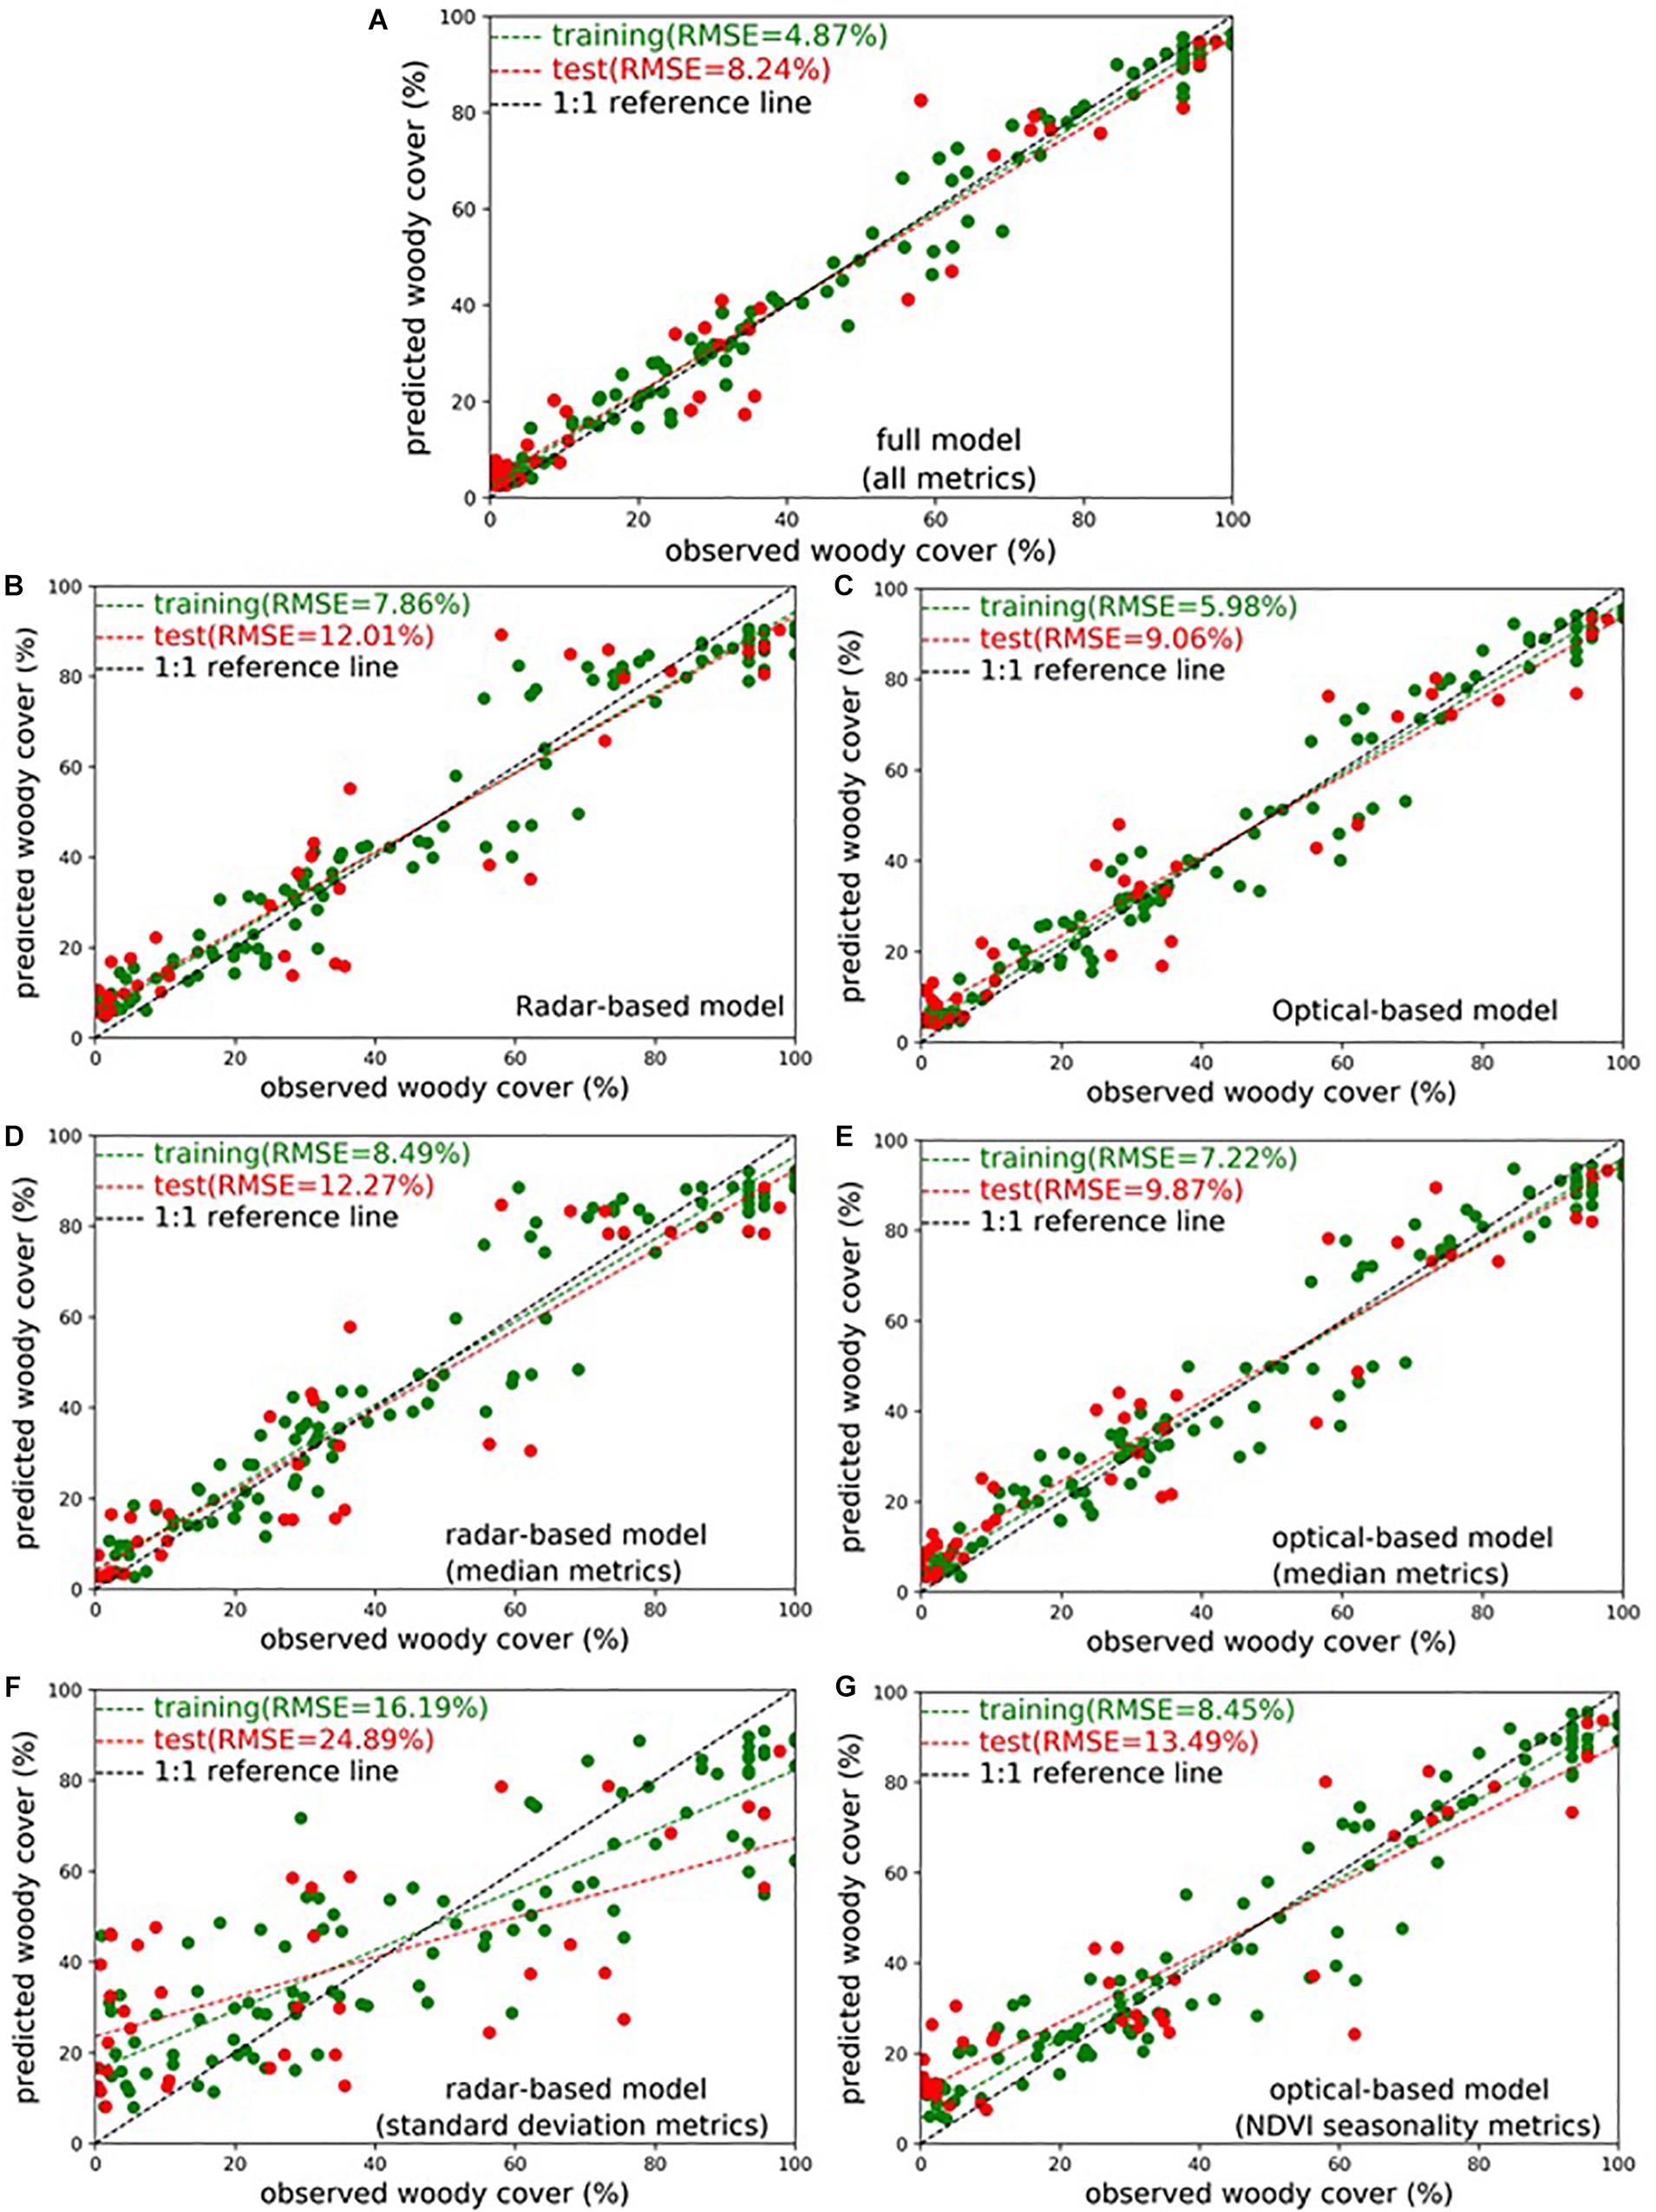
Figure 9. Woody canopy cover (%WCC) prediction accuracy (training = green, validation = red) for models fitted using different groupings of satellite-derived variables: (A) Full model with all metrics, (B) all radar-based metrics, (C) all optical-based metrics, (D) radar-based median metrics, (E) optical-based median metrics, (F) radar-based standard deviation metrics, (G) optical-based (NDVI) seasonality metrics.
Comparisons With Other Existing Woody Canopy Cover Datasets
Our derived %WCC map for Senegal reveals minor similarities and very strong differences when compared to other currently available datasets. Just like its MODIS counterpart, Landsat VCF tree cover data is based on methodology that only considers woody plants greater than 5 m tall, and as such underestimates canopy cover in the savannas by significant margins (in this case indicating < 10% for most of Senegal, and <20% for even the southern densely forested mangrove region in the Saloum delta, Figure 10C).
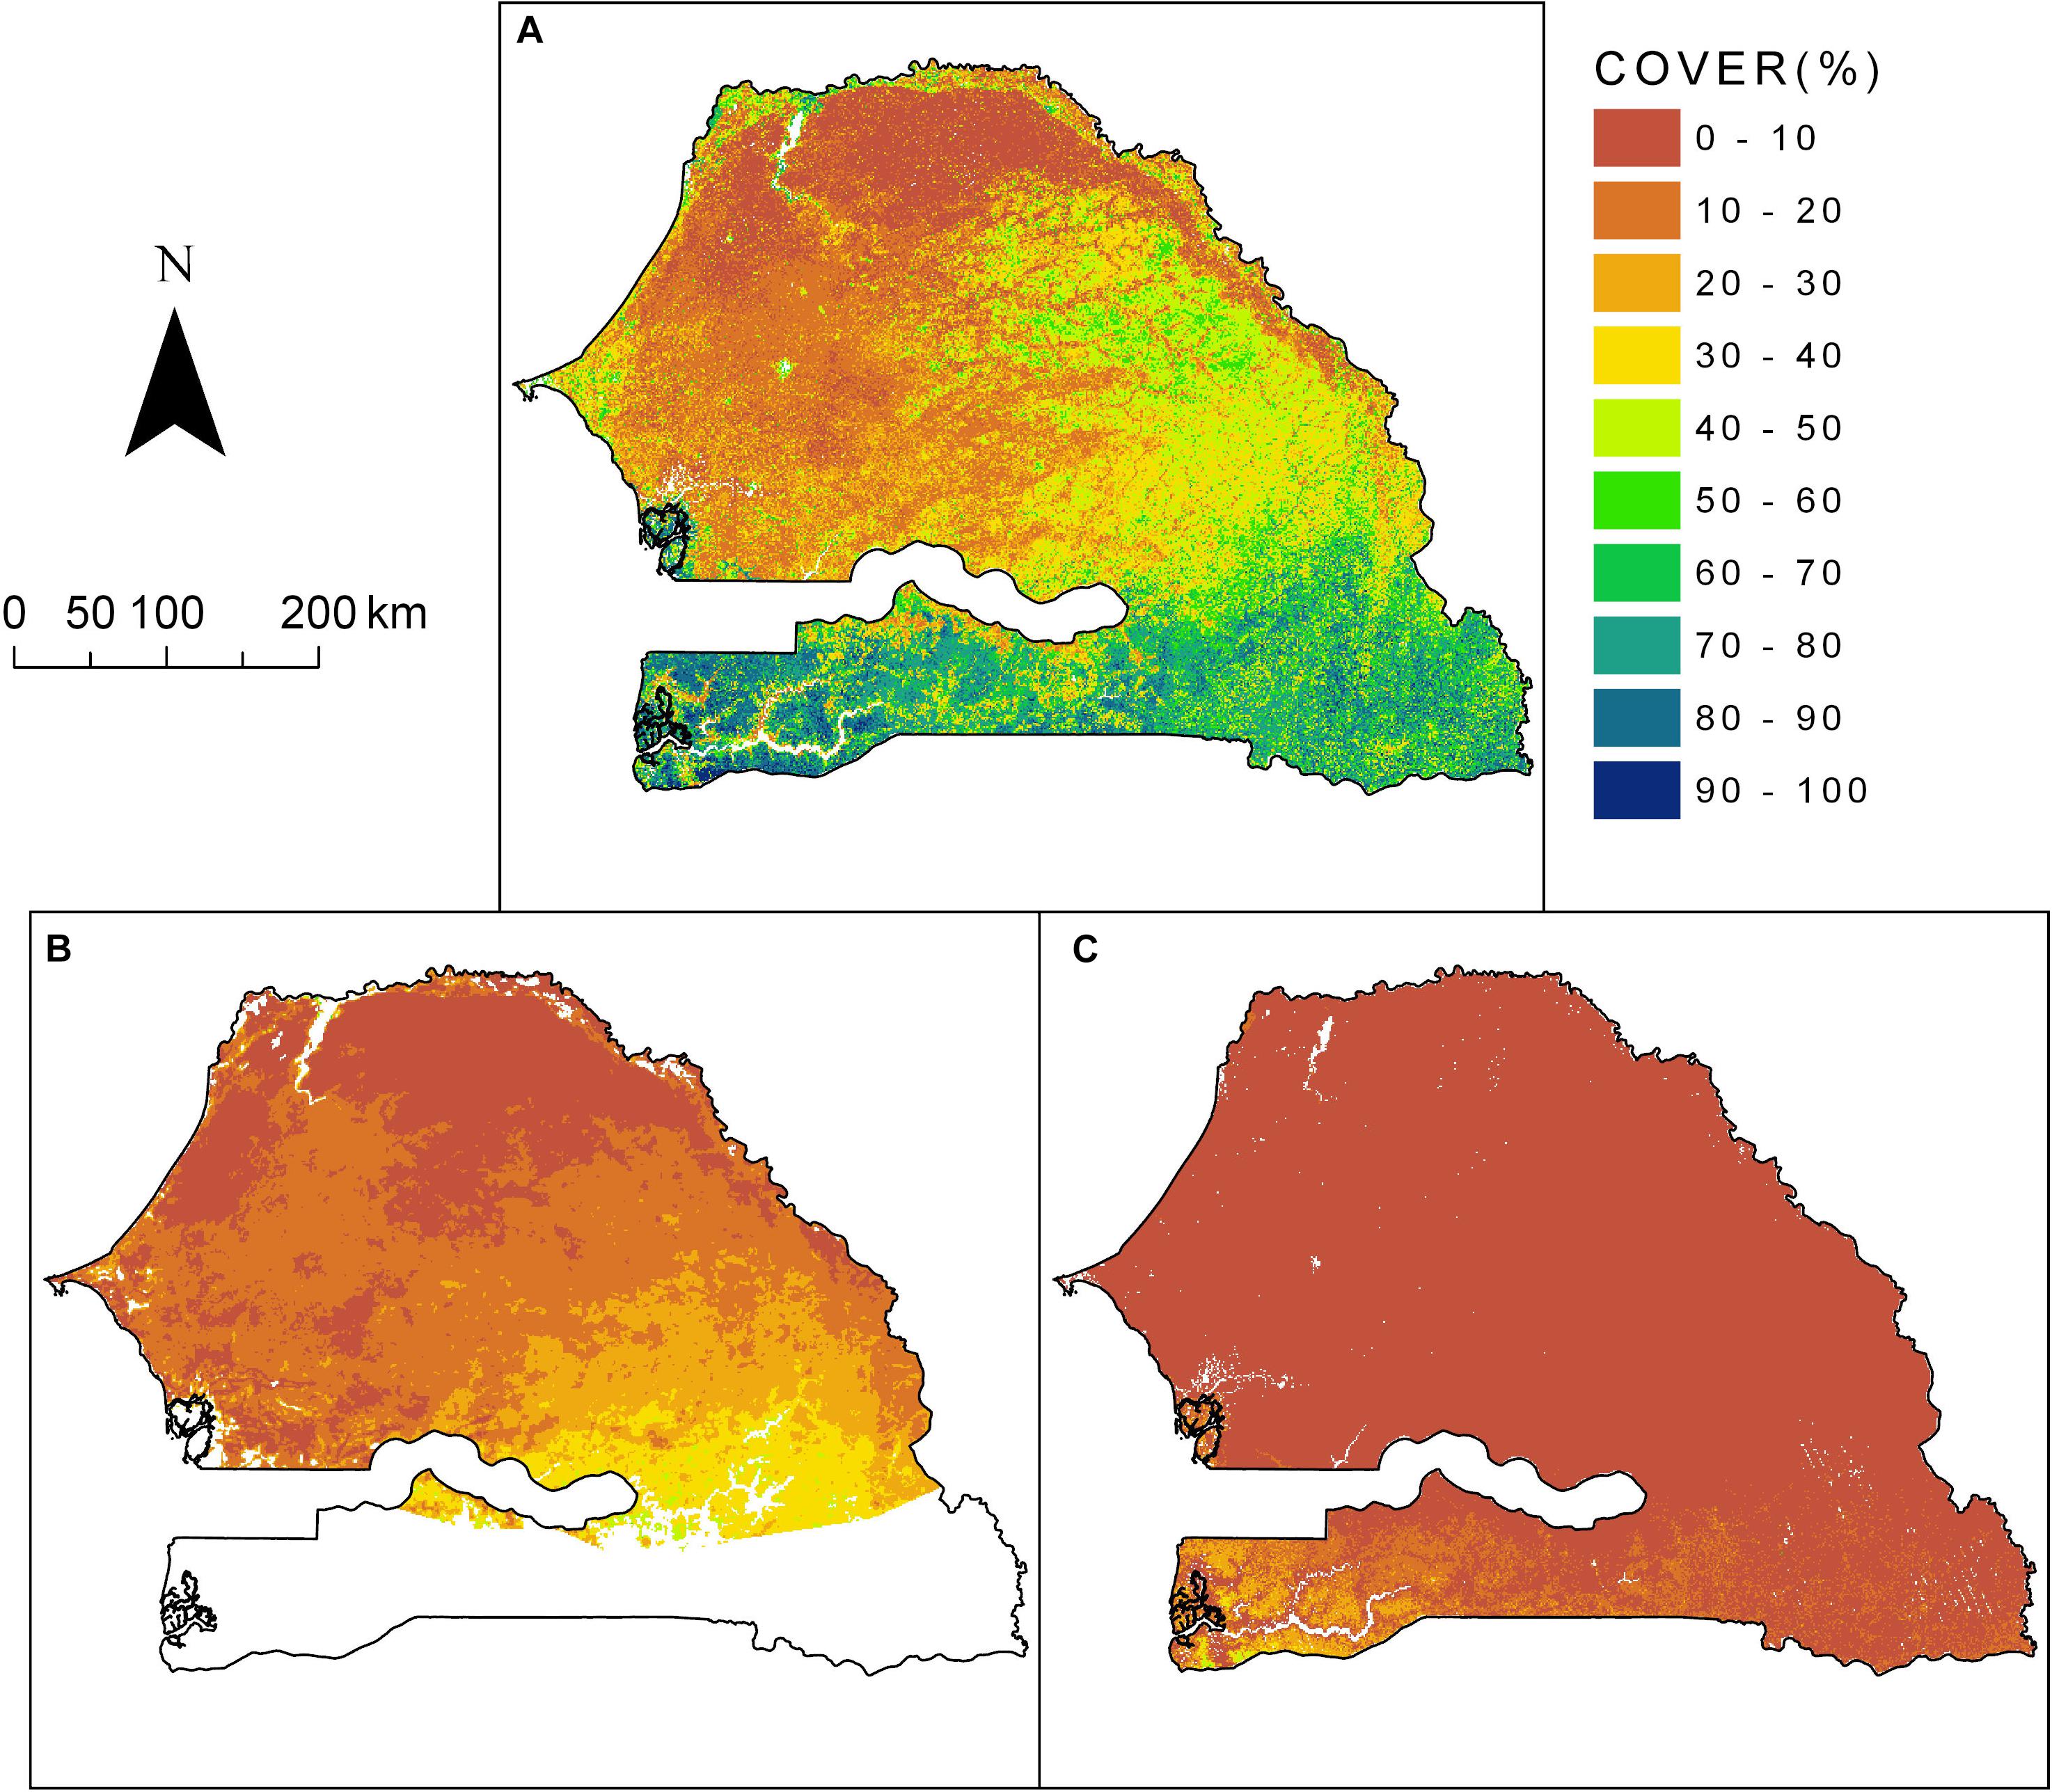
Figure 10. Comparison of different woody cover datasets currently available for Senegal: (A) ∼2016 %WCC derived in this study, (B) 2009 – 2013 mean %WCC estimated by Brandt et al. (2016a) for the West African Sahel using FAPAR phenology metrics, (C) 2015 Landsat VCF tree cover by Sexton et al. (2013). All raster data shown above are resampled to 1 km cell size for direct comparisons and classified using the same color legend.
Much closer to the estimates in this study are those by Brandt et al. (2016a), who used FAPAR phenology metrics and regression models to predict mean 2009-2013%WCC at 1km resolution for the entire West African Sahel (Senegal subset shown in Figure 10B). It is worth noting that both studies share commonality in the field datasets used for modeling, with differences in acquisition years and spatial aggregation scale (individual plot versus site scale, see description of field data in section “Data preparation”). Agreements can be seen to a certain extent in the northern and western parts of Senegal, where both products report mostly < 20% of %WCC (compare Figures 10A,B). However, although both maps show a steady southward increase in woody cover, a divergence in the values is noticeable in the Ferruginous Ferlo to the east, and the woodlands to the southeast, with differences of up to 20% or more for the same locations. This likely stems from the significant difference in the spatial scale of the models used to derive both maps (40 m vs. 1 km). Our 40 m scale allows us to detect fine but clearly visible patterns of woody occurrence in otherwise open landscapes. For example, for a small area in the eastern Ferlo (Figure 11), we correctly detected high canopy cover (50–70%) for a subset of 40 m pixels, leading to a higher (and potentially more accurate) average %WCC estimate when scaled to a larger (e.g., 1 km) area (Figure 11B).
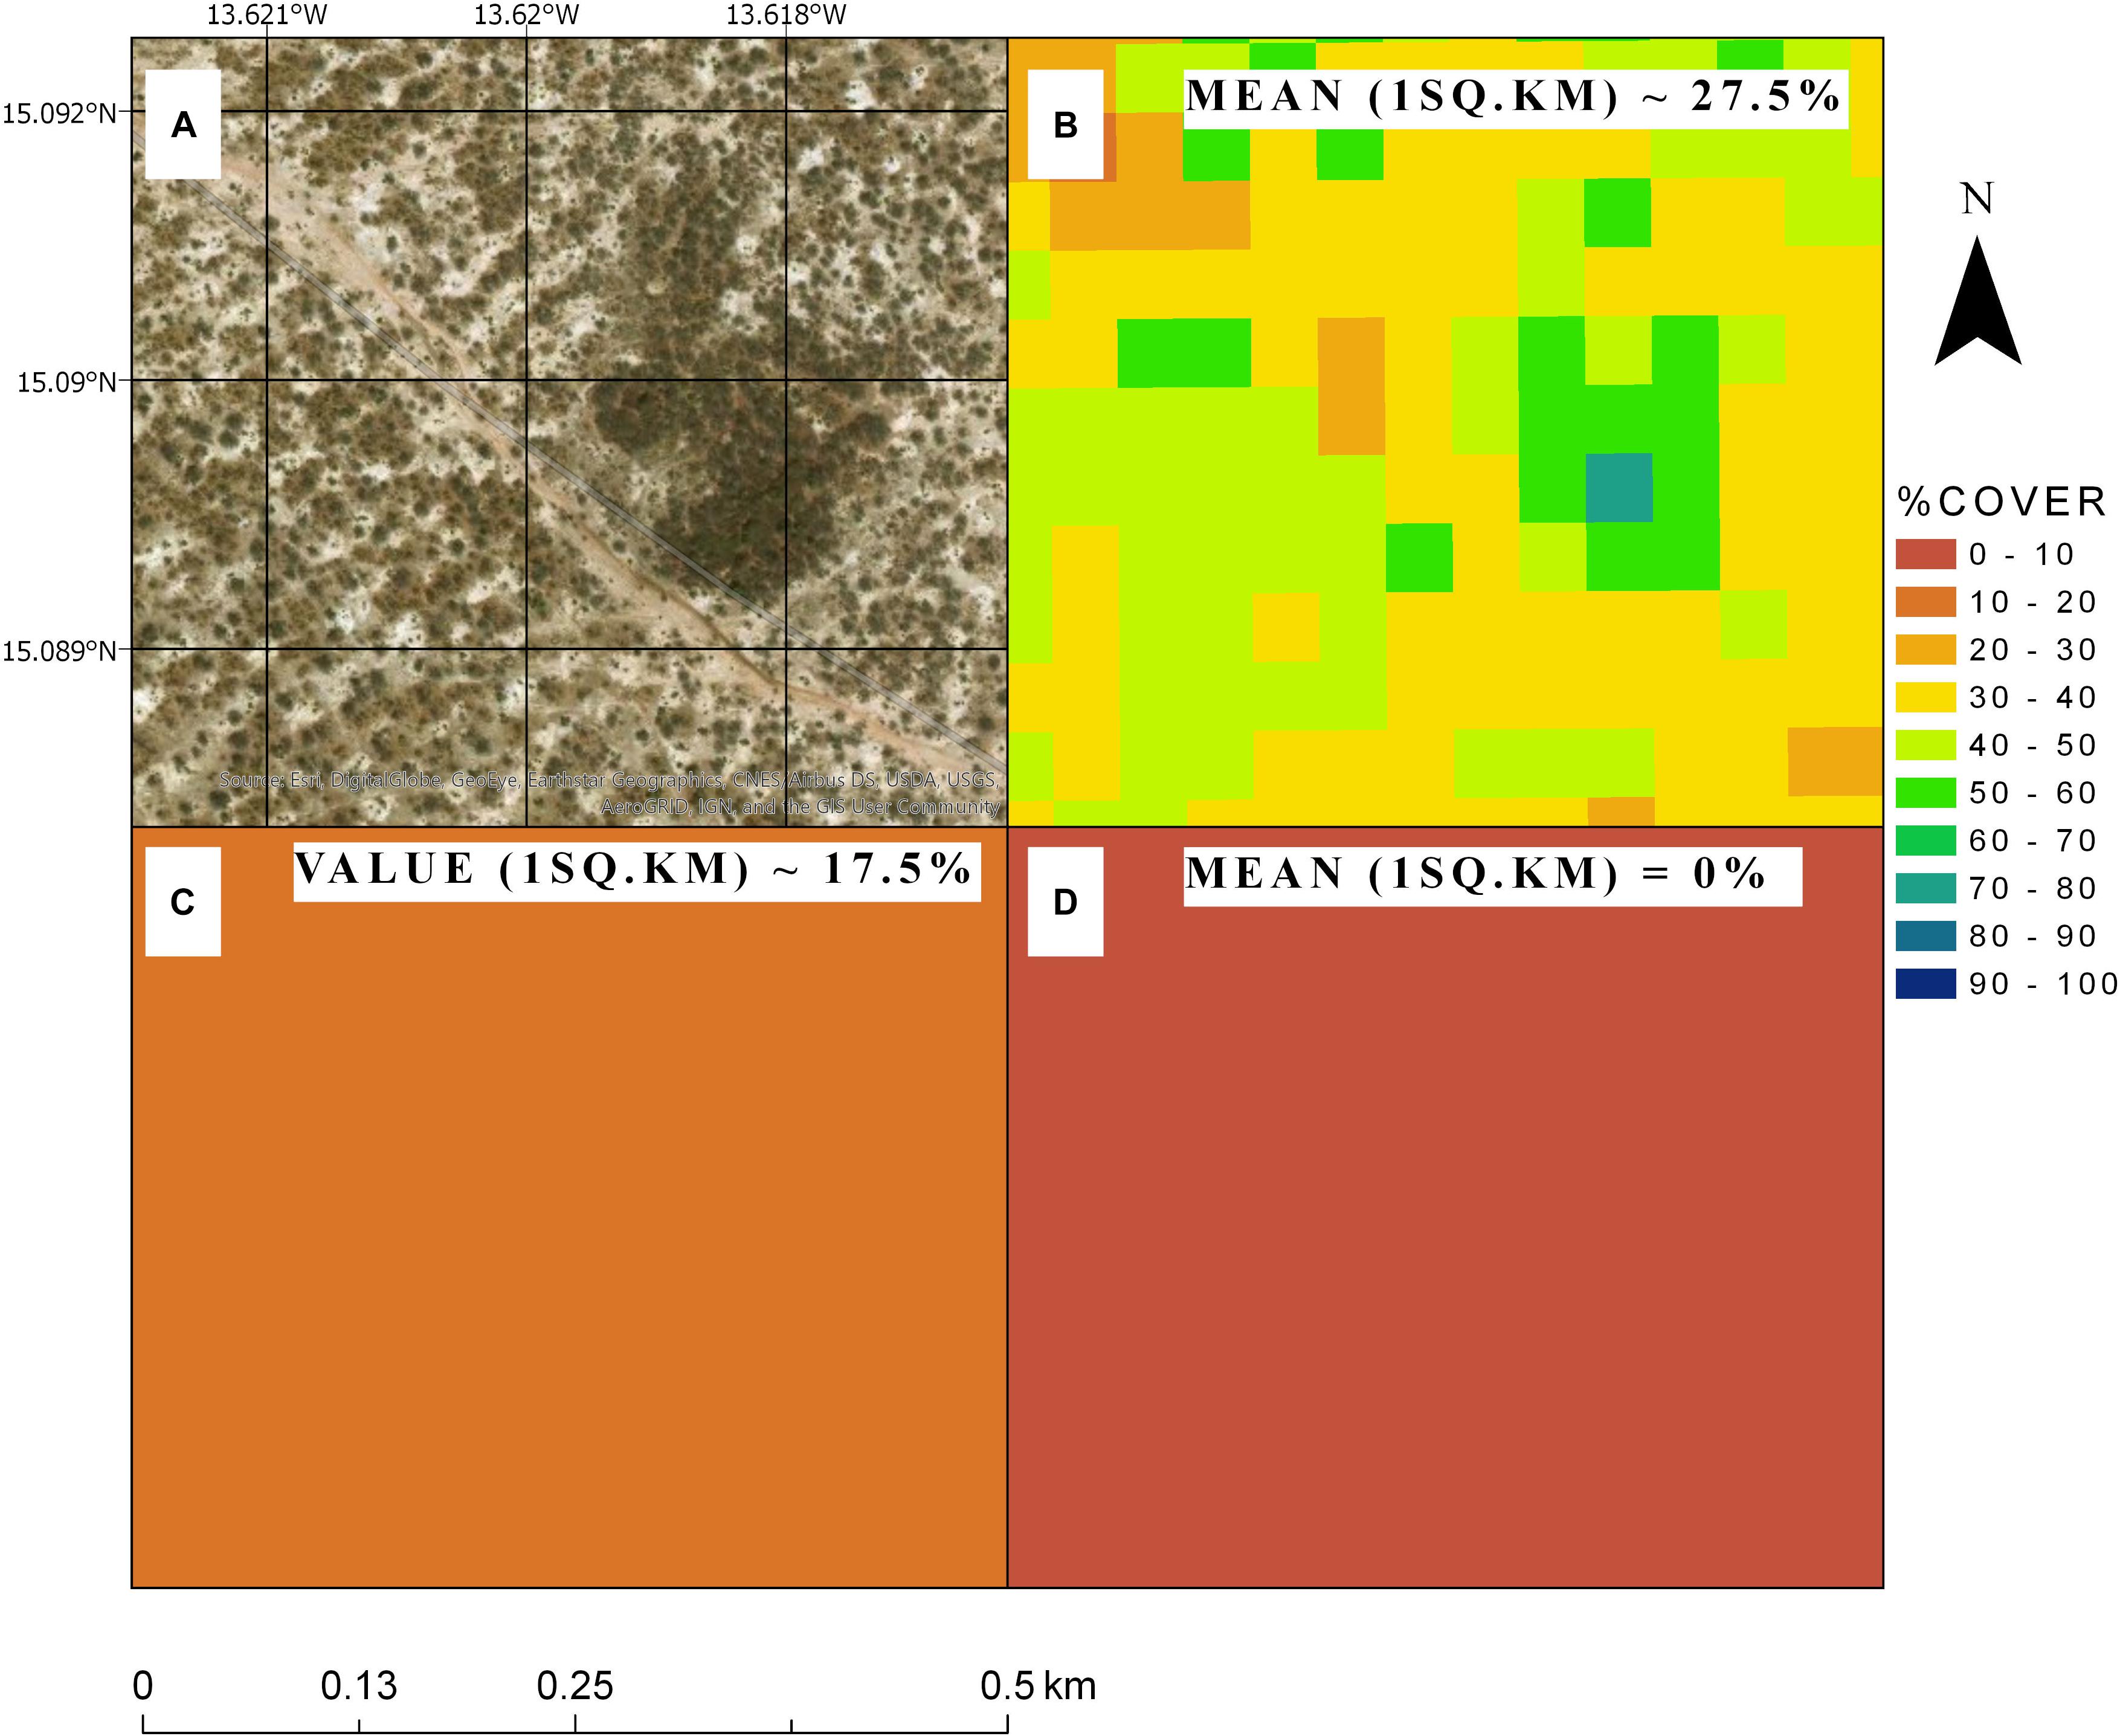
Figure 11. A zoomed-in (approximately Lat. 15.09°, Long. −13.62°) comparison of woody cover data in the eastern Ferlo region of Senegal. (A) VHR imagery, (B) ∼2016 %WCC derived in this study at 40 m resolution, with an average of 27.5% over a 1 km × 1 km area, (C) %WCC by Brandt et al. (2016a) at 1 km resolution with a single pixel value of 17.5% woody cover, (D) Landsat VCF Tree cover at 30 m with an average of 0% woody cover. Imagery source: ESRI Basemaps, DigitalGlobe.
Mapping at a coarse spatial resolution may also weaken the ability of phenological metrics, as used by Brandt et al. (2016a), to discriminate woody canopies in principally deciduous landscapes. At 1 km scale, it would be challenging to capture variability in leaf production patterns among woody species. The relative dominance of a specific phenological type (e.g., an Acacia sp. with short duration in annual leaf production) would influence model predictions of canopy cover for the area. Meanwhile, the lack of precise phenology metrics in our Sentinel-based model is offset by the higher spatial resolution and the inclusion of radar backscatter metrics which is less sensitive to seasonal leaf dynamics.
Conclusion
In this paper we described an approach to efficiently and accurately map percent %WCC over large savanna areas. We relied on the use of radar backscatter and optical reflectance metrics as empirical predictors of %WCC in a random forest model. The workflow was implemented almost entirely in Google Earth Engine to leverage the computational power and ease of data-access made possible in geospatial cloud computing applications. The intent being to facilitate adoption by potential users in other countries and regions where low internet bandwidth and limited access to compute facilities might otherwise prevent similar analysis.
Using the full extent of Senegal as a test area, we were able to predict percent %WCC at 40 m resolution with a high degree of accuracy (RMSE of 8.2% with test plot predictions). Exploring the inner workings of the model revealed that median radar backscatter with ‘vertical-vertical’ (VV) polarization was the most important metric in predicting %WCC, while metrics measuring intra-annual or inter-seasonal variation in satellite-derived information were the weakest; a likely result of the phenological variability within local savanna woody species in West Africa, which complicates their collective separation from herbaceous cover at fine scales solely based on seasonal leaf dynamics. However, our results confirm the findings of other studies that fusion of backscatter and optical reflectance data allows for the most effective mapping of tree and shrub canopies in savannas.
Earth observation data is increasingly important to developing countries seeking more cost-effective tools for monitoring and evaluation in the context of reducing emissions from deforestation and degradation (REDD+), monitoring resource use, and assessing progress toward sustainable development goals and targets. However, countries in regions such as West Africa continue to face challenges in large-scale operational use remote sensing data. In the case of vegetation mapping, the advent of improved and freely available satellite imagery such as the European Space Agency’s Copernicus Sentinel data, and cloud computing technologies such as Google Earth Engine, can significantly impact the accessibility of larger datasets and more complex analysis approaches. This will increase capacity of local and regional stakeholders for environmental and natural resource management.
The approach described in this study is designed to fill the need for woody resource mapping tools tailored for tropical savanna regions, where current datasets tend to underperform. Our methodology can be applied across multiple geographic scales, from local to national and regional levels, and is transferable to other areas, ideally using local data and expertise to calibrate and validate predictive models. The remote sensing and cloud-computing approach advocated here makes for a highly automated, scalable and repeatable tool that can allow management agencies and scientists to implement activities for carbon and woody resource monitoring, adapted to regional conditions and local stakeholder needs.
Data Availability Statement
The datasets generated and analyzed in this study are available in the following shared Google Earth Engine asset folder: https://code.earthengine.google.com/?asset=users/savannalabnm su/treecover_data, and also upon request to the corresponding author (anchang@nmsu.edu).
Author Contributions
JA wrote the manuscript, conducted data processing and analysis, and developed all scripts and assets. LP and NH acquired funding, conceived the study, and contributed to the manuscript editing. MS and AD helped prepare field data used for modeling and contributed to the manuscript editing. WJ, SK, CR, QY, and BL contributed to the manuscript editing.
Funding
This research was funded by the National Aeronautics and Space Administration SERVIR Applied Science Team grant number NNX16AN30G, and the National Aeronautics and Space Administration NASA Carbon Cycle Science program grant number NNX17AI49G.
Conflict of Interest
The authors declare that the research was conducted in the absence of any commercial or financial relationships that could be construed as a potential conflict of interest.
Acknowledgments
We acknowledge the field/technical staff of the Centre de Suivi Ecologique (CSE) in Dakar, Senegal, for the acquisition and provision of in situ woody canopy cover data used in this study.
Supplementary Material
The Supplementary Material for this article can be found online at: https://www.frontiersin.org/articles/10.3389/fenvs.2020.00004/full#supplementary-material
Footnotes
References
Anchang, J. Y., Prihodko, L., Kaptué, A. T., Ross, C. W., Ji, W., Kumar, S. S., et al. (2019). Trends in woody and herbaceous vegetation in the Savannas of West Africa. Remote Sens. 11:576. doi: 10.3390/rs11050576
Apley, D. W. (2016). Visualizing the effects of predictor variables in black box supervised learning models. arXiv:1612.08468 [Preprint] Available at: http://arxiv.org/abs/1612.08468 (accessed May 29, 2019).
Baumann, M., Levers, C., Macchi, L., Bluhm, H., Waske, B., Gasparri, N. I., et al. (2018). Mapping continuous fields of tree and shrub cover across the Gran Chaco using Landsat 8 and Sentinel-1 data. Remote Sens. Environ. 216, 201–211. doi: 10.1016/j.rse.2018.06.044
Behling, H., and Hooghiemstra, H. (1999). Environmental history of the Colombian savannas of the Llanos Orientales since the last glacial maximum from lake records El Pinal and Carimagua. J. Paleolimnol. 21, 461–476.
Bey, A., Sánchez-Paus Díaz, A., Maniatis, D., Marchi, G., Mollicone, D., Ricci, S., et al. (2016). Collect earth: land use and land cover assessment through augmented visual interpretation. Remote Sens. 8:807. doi: 10.3390/rs8100807
Bond, W. J., and Midgley, G. F. (2000). A proposed CO2-controlled mechanism of woody plant invasion in grasslands and savannas. Glob. Change Biol. 6, 865–869. doi: 10.1046/j.1365-2486.2000.00365.x
Brandt, M., Hiernaux, P., Rasmussen, K., Mbow, C., Kergoat, L., Tagesson, T., et al. (2016a). Assessing woody vegetation trends in Sahelian drylands using MODIS based seasonal metrics. Remote Sens. Environ. 183, 215–225. doi: 10.1016/j.rse.2016.05.027
Brandt, M., Hiernaux, P., Tagesson, T., Verger, A., Rasmussen, K., Diouf, A. A., et al. (2016b). Woody plant cover estimation in drylands from Earth Observation based seasonal metrics. Remote Sens. Environ. 172, 28–38. doi: 10.1016/j.rse.2015.10.036
Brandt, M., Rasmussen, K., Peñuelas, J., Tian, F., Schurgers, G., Verger, A., et al. (2017). Human population growth offsets climate-driven increase in woody vegetation in sub-Saharan Africa. Nat. Ecol. Evol. 1:0081. doi: 10.1038/s41559-017-0081
DeFries, R., Hansen, M., and Townshend, J. (1995). Global discrimination of land cover types from metrics derived from AVHRR pathfinder data. Remote Sens. Environ. 54, 209–222. doi: 10.1016/0034-4257(95)00142-5
Defries, R. S., Hansen, M. C., and Townshend, J. R. G. (2000a). Global continuous fields of vegetation characteristics: a linear mixture model applied to multi-year 8 km AVHRR data. Int. J. Remote Sens. 21, 1389–1414. doi: 10.1080/014311600210236
Defries, R. S., Hansen, M. C., Townshend, J. R. G., Janetos, A. C., and Loveland, T. R. (2000b). A new global 1-km dataset of percentage tree cover derived from remote sensing. Glob. Change Biol. 6, 247–254. doi: 10.1046/j.1365-2486.2000.00296.x
Diouf, A., and Lambin, E. F. (2001). Monitoring land-cover changes in semi-arid regions: remote sensing data and field observations in the Ferlo, Senegal. J. Arid Environ. 48, 129–148. doi: 10.1006/jare.2000.0744
Diouf, A. A., Brandt, M., Verger, A., Jarroudi, M. E., Djaby, B., Fensholt, R., et al. (2015). Fodder biomass monitoring in Sahelian Rangelands using phenological metrics from FAPAR time series. Remote Sens. 7, 9122–9148. doi: 10.3390/rs70709122
Dohn, J., Dembélé, F., Karembé, M., Moustakas, A., Amévor, K. A., and Hanan, N. P. (2013). Tree effects on grass growth in savannas: competition, facilitation and the stress-gradient hypothesis. J. Ecol. 101, 202–209. doi: 10.1111/1365-2745.12010
FAO (2000). FRA 2000: On Definitions of Forest and Forest Change. Forest Resource Assessment Programe Working Paper No. # 33. Rome: Food and Agriculture Organization.
Flores-Anderson, A. I., Herndon, K. E., Thapa, R. B., and Cherrington, E. (2019). The SAR Handbook: Comprehensive Methodologies for Forest Monitoring and Biomass Estimation, 1st Edn. Huntsville, AL: NASA Marshall Space Flight Center.
Foody, G. M., and Cox, D. P. (1994). Sub-pixel land cover composition estimation using a linear mixture model and fuzzy membership functions. Int. J. Remote Sens. 15, 619–631. doi: 10.1080/01431169408954100
Friedl, M., Gray, J., and Sulla-Menashe, D. (2019). MCD12Q2 MODIS/Terra+Aqua Land Cover Dynamics Yearly L3 Global 500m SIN Grid V006 [Data set]. NASA EOSDIS Land Processes DAAC. Sioux Falls, SD: USGS Earth Resources Observation and Science (EROS) Center. doi: 10.5067/modis/mcd12q2.006
Friedman, J. H. (2001). Greedy function approximation: a gradient boosting machine. Ann. Statistics 29, 1189–1232.
Funk, C., Peterson, P., Landsfeld, M., Pedreros, D., Verdin, J., Shukla, S., et al. (2015). The climate hazards infrared precipitation with stations—a new environmental record for monitoring extremes. Sci. Data 2:150066. doi: 10.1038/sdata.2015.66
Ganguly, S., Friedl, M. A., Tan, B., Zhang, X., and Verma, M. (2010). Land surface phenology from MODIS: characterization of the collection 5 global land cover dynamics product. Remote Sens. Environ. 114, 1805–1816. doi: 10.1016/j.rse.2010.04.005
Gao, B. (1996). NDWI—A normalized difference water index for remote sensing of vegetation liquid water from space. Remote Sens. Environ. 58, 257–266. doi: 10.1016/S0034-4257(96)00067-3
Gessner, U., Machwitz, M., Conrad, C., and Dech, S. (2013). Estimating the fractional cover of growth forms and bare surface in savannas. a multi-resolution approach based on regression tree ensembles. Remote Sens. Environ. 129, 90–102. doi: 10.1016/j.rse.2012.10.026
Gorelick, N., Hancher, M., Dixon, M., Ilyushchenko, S., Thau, D., and Moore, R. (2017). Google earth engine: planetary-scale geospatial analysis for everyone. Remote Sens. Environ. 202, 18–27. doi: 10.1016/j.rse.2017.06.031
Guerschman, J. P., Hill, M. J., Renzullo, L. J., Barrett, D. J., Marks, A. S., and Botha, E. J. (2009). Estimating fractional cover of photosynthetic vegetation, non-photosynthetic vegetation and bare soil in the Australian tropical savanna region upscaling the EO-1 Hyperion and MODIS sensors. Remote Sens. Environ. 113, 928–945. doi: 10.1016/j.rse.2009.01.006
Hanan, N. P. (2018). Agroforestry in the Sahel. Nat. Geosci. 11, 296–297. doi: 10.1038/s41561-018-0112-x
Hansen, M., Dubayah, R., and DeFries, R. (1996). Classification trees: an alternative to traditional land cover classifiers. Int. J. Remote Sens. 17, 1075–1081. doi: 10.1080/01431169608949069
Hansen, M. C., DeFries, R. S., Townshend, J. R. G., Sohlberg, R., Dimiceli, C., and Carroll, M. (2002). Towards an operational MODIS continuous field of percent tree cover algorithm: examples using AVHRR and MODIS data. Remote Sens. Environ. 83, 303–319. doi: 10.1016/S0034-4257(02)00079-2
Hiernaux, P. H., Cisse, M. I., Diarra, L., and De Leeuw, P. N. (1994). Seasonal fluctuations in the leafing of Sahelian trees and shrubs. consequences for the quantification of forage resources. J. Livest. Vet. Med. Trop. 47, 117–125.
Hill, M. J., Zhou, Q., Sun, Q., Schaaf, C. B., and Palace, M. (2017). Relationships between vegetation indices, fractional cover retrievals and the structure and composition of Brazilian Cerrado natural vegetation. Int. J. Remote Sens. 38, 874–905. doi: 10.1080/01431161.2016.1271959
Hill, M. J., Zhou, Q., Sun, Q., Schaaf, C. B., Southworth, J., Mishra, N. B., et al. (2016). Dynamics of the relationship between NDVI and SWIR32 vegetation indices in southern Africa: implications for retrieval of fractional cover from MODIS data. Int. J. Remote Sens. 37, 1476–1503. doi: 10.1080/01431161.2016.1154225
Huete, A. R., Liu, H., and van Leeuwen, W. J. D. (1997). “The use of vegetation indices in forested regions: issues of linearity and saturation,” in Proceedings of the IGARSS’97. 1997 IEEE International Geoscience and Remote Sensing Symposium Proceedings. Remote Sensing – A Scientific Vision for Sustainable Development, Vol. 4 (Singapore: Institute of Electrical and Electronics Engineers), 1966–1968. doi: 10.1109/IGARSS.1997.609169
Huxman, T. E., Wilcox, B. P., Breshears, D. D., Scott, R. L., Snyder, K. A., Small, E. E., et al. (2005). Ecohydrological implications of woody plant encroachment. Ecology 86, 308–319. doi: 10.1890/03-0583
Jackson, R. B., Banner, J. L., Jobbágy, E. G., Pockman, W. T., and Wall, D. H. (2002). Ecosystem carbon loss with woody plant invasion of grasslands. Nature 418, 623–626. doi: 10.1038/nature00910
Kahiu, M. N., and Hanan, N. P. (2018a). Estimation of woody and herbaceous leaf area index in sub−Saharan Africa using MODIS data. J. Geophys. Res. Biogeosci. 123, 3–17. doi: 10.1002/2017jg004105
Kahiu, M. N., and Hanan, N. P. (2018b). Fire in sub−Saharan Africa: the fuel, cure and connectivity hypothesis. Glob. Ecol. Biogeogr. 27, 946–957. doi: 10.1111/geb.12753
Kaptué, A. T., Prihodko, L., and Hanan, N. P. (2015). On regreening and degradation in Sahelian watersheds. Proc. Natl. Acad. Sci. U.S.A. 112, 12133–12138. doi: 10.1073/pnas.1509645112
Karlson, M., Ostwald, M., Reese, H., Sanou, J., Tankoano, B., and Mattsson, E. (2015). Mapping tree canopy cover and aboveground biomass in Sudano-Sahelian woodlands using Landsat 8 and random forest. Remote Sens. 7, 10017–10041. doi: 10.3390/rs70810017
Key, C. H., and Benson, N. C. (2005). Landscape Assessment: Ground Measure of Severity, the COMPOSITE BURN Index; and Remote Sensing of Severity, the Normalized Burn Ratio. FIREMON: Fire Effects Monitoring and Inventory System, 2004. Ogden, UT: USDA Forest Service, Rocky Mountain Research Station.
Kumar, S. S., Hanan, N. P., Prihodko, L., Anchang, J., Ross, C. W., Ji, W., et al. (2019). Alternative vegetation states in tropical forests and savannas: the search for consistent signals in diverse remote sensing data. Remote Sens. 11:815. doi: 10.3390/rs11070815
Lopes, A., Touzi, R., and Nezry, E. (1990). Adaptive speckle filters and scene heterogeneity. IEEE Trans. Geosci. Remote Sens. 28, 992–1000. doi: 10.1109/36.62623
Matthews, E. (1983). Global vegetation and land use: new high-resolution data bases for climate studies. J. Clim. Appl. Meteorol. 22, 474–487. doi: 10.1175/1520-0450(1983)022<0474:gvalun>2.0.co;2
Minnesota Population Center (2018). Integrated Public Use Microdata Series, International: Version 7.1. Minneapolis, MN: IPUMS. doi: 10.18128/d020.v7.1
Molnar, C. (2019). Interpretable Machine Learning. Available at: https://christophm.github.io/interpretable-ml-book/ (accessed May 28, 2019).
Nicholson, S. E., and Webster, P. J. (2007). A physical basis for the interannual variability of rainfall in the Sahel. Q. J. R. Meteorol. Soc. 133, 2065–2084. doi: 10.1002/qj.104
Pedregosa, F., Varoquaux, G., Gramfort, A., Michel, V., Thirion, B., Grisel, O., et al. (2011). Scikit-learn: machine learning in Python. J. Mach. Learn. Res. 12, 2825–2830.
Ratnam, J., Bond, W. J., Fensham, R. J., Hoffmann, W. A., Archibald, S., Lehmann, C. E. R., et al. (2011). When is a ‘forest’ a savanna, and why does it matter? Glob. Ecol. Biogeogr. 20, 653–660. doi: 10.1111/j.1466-8238.2010.00634.x
Ratter, J. A., Ribeiro, J. F., and Bridgewater, S. (1997). The Brazilian cerrado vegetation and threats to its biodiversity. Ann. Bot. 80, 223–230. doi: 10.1006/anbo.1997.0469
Roy, D. P., Li, J., Zhang, H. K., Yan, L., Huang, H., and Li, Z. (2017a). Examination of Sentinel-2A multi-spectral instrument (MSI) reflectance anisotropy and the suitability of a general method to normalize MSI reflectance to nadir BRDF adjusted reflectance. Remote Sens. Environ. 199, 25–38. doi: 10.1016/j.rse.2017.06.019
Roy, D. P., Li, Z., and Zhang, H. K. (2017b). Adjustment of Sentinel-2 multi-spectral instrument (MSI) red-edge band reflectance to nadir BRDF adjusted reflectance (NBAR) and quantification of red-edge band BRDF effects. Remote Sens. 9:1325. doi: 10.3390/rs9121325
Sankaran, M., Hanan, N. P., Scholes, R. J., Ratnam, J., Augustine, D. J., Cade, B. S., et al. (2005). Determinants of woody cover in African savannas. Nature 438, 846–849. doi: 10.1038/nature04070
Scholes, R. J., and Archer, S. R. (1997). Tree-grass interactions in savannas. Annu. Rev. Ecol. Syst. 28, 517–544. doi: 10.1146/annurev.ecolsys.28.1.517
Sexton, J. O., Song, X.-P., Feng, M., Noojipady, P., Anand, A., Huang, C., et al. (2013). Global, 30-m resolution continuous fields of tree cover: landsat-based rescaling of MODIS vegetation continuous fields with lidar-based estimates of error. Int. J. Digit. Earth 6, 427–448. doi: 10.1080/17538947.2013.786146
Sims, D. A., and Gamon, J. A. (2002). Relationships between leaf pigment content and optical reflectance across a wide range of species, leaf structures and developmental stages. Remote Sens. Environ. 81, 337–354. doi: 10.1016/S0034-4257(02)00010-X
Tucker, C. J. (1979). Red and photographic infrared linear combinations for monitoring vegetation. Remote Sens. Environ. 8, 127–150. doi: 10.1016/0034-4257(79)90013-0
Urbazaev, M., Thiel, C., Mathieu, R., Naidoo, L., Levick, S. R., Smit, I. P. J., et al. (2015). Assessment of the mapping of fractional woody cover in southern African savannas using multi-temporal and polarimetric ALOS PALSAR L-band images. Remote Sens. Environ. 166, 138–153. doi: 10.1016/j.rse.2015.06.013
Vitousek, P. (1982). Nutrient cycling and nutrient use efficiency. Am. Nat. 119, 553–572. doi: 10.1086/283931
Werner, P. A. ed. (2009). Savanna Ecology and Management: Australian Perspectives and Intercontinental Comparisons. Hoboken, NJ: John Wiley & Sons.
Wessels, K. J., Colgan, M. S., Erasmus, B. F. N., Asner, G. P., Twine, W. C., Mathieu, R., et al. (2013). Unsustainable fuelwood extraction from South African savannas. Environ. Res. Lett. 8:014007. doi: 10.1088/1748-9326/8/1/014007
Xie, Y., Sha, Z., and Yu, M. (2008). Remote sensing imagery in vegetation mapping: a review. J. Plant Ecol. 1, 9–23.
Keywords: earth observation, vegetation structure, Copernicus Sentinel data, cloud-computing, machine learning
Citation: Anchang JY, Prihodko L, Ji W, Kumar SS, Ross CW, Yu Q, Lind B, Sarr MA, Diouf AA and Hanan NP (2020) Toward Operational Mapping of Woody Canopy Cover in Tropical Savannas Using Google Earth Engine. Front. Environ. Sci. 8:4. doi: 10.3389/fenvs.2020.00004
Received: 01 June 2019; Accepted: 09 January 2020;
Published: 30 January 2020.
Edited by:
Mark A. Drummond, United States Geological Survey (USGS), United StatesReviewed by:
Perrine Hamel, Stanford University, United StatesSónia Maria Carvalho Ribeiro, Federal University of Minas Gerais, Brazil
Copyright © 2020 Anchang, Prihodko, Ji, Kumar, Ross, Yu, Lind, Sarr, Diouf and Hanan. This is an open-access article distributed under the terms of the Creative Commons Attribution License (CC BY). The use, distribution or reproduction in other forums is permitted, provided the original author(s) and the copyright owner(s) are credited and that the original publication in this journal is cited, in accordance with accepted academic practice. No use, distribution or reproduction is permitted which does not comply with these terms.
*Correspondence: Julius Y. Anchang, anchang@nmsu.edu