

Abstract
Sun-induced chlorophyll fluorescence (SIF) measurements have shown unique potential for quantifying plant physiological stress. However, recent investigations found canopy structure and radiation largely control SIF, and physiological relevance of SIF remains yet to be fully understood. This study aims to evaluate whether the SIF-derived physiological signal improves quantification of crop responses to environmental stresses, by analyzing data at three different spatial scales within the U.S. Corn Belt, i.e. experiment plot, field, and regional scales, where ground-based portable, stationary and space-borne hyperspectral sensing systems are used, respectively. We found that, when controlling for variations in incoming radiation and canopy structure, crop SIF signals can be decomposed into non-physiological (i.e. canopy structure and radiation, 60% ∼ 82%) and physiological information (i.e. physiological SIF yield, ΦF, 17% ∼ 31%), which confirms the contribution of physiological variation to SIF. We further evaluated whether ΦF indicated plant responses under high-temperature and high vapor pressure deficit (VPD) stresses. The plot-scale data showed that ΦF responded to the proxy for physiological stress (partial correlation coefficient, rp= 0.40, p< 0.001) while non-physiological signals of SIF did not respond (p> 0.1). The field-scale ΦF data showed water deficit stress from the comparison between irrigated and rainfed fields, and ΦF was positively correlated with canopy-scale stomatal conductance, a reliable indicator of plant physiological condition (correlation coefficient r= 0.60 and 0.56 for an irrigated and rainfed sites, respectively). The regional-scale data showed ΦF was more strongly correlated spatially with air temperature and VPD (r= 0.23 and 0.39) than SIF (r= 0.11 and 0.34) for the U.S. Corn Belt. The lines of evidence suggested that ΦF reflects crop physiological responses to environmental stresses with greater sensitivity to stress factors than SIF, and the stress quantification capability of ΦF is spatially scalable. Utilizing ΦF for physiological investigations will contribute to improve our understanding of vegetation responses to high-temperature and high-VPD stresses.
Export citation and abstract BibTeX RIS
1. Introduction
Crop remote sensing needs to quantify environmental stress impacts on both canopy structure and plant physiology to fully understand environmental impacts on crop productivity and yield (Hatfield et al 2008, Guan et al 2017). Although remote sensing-based monitoring has been effective in quantifying crop responses to various environmental stresses, it has been primarily focused on the structural variability of crops and insufficient in quantifying physiological stress impacts. Commonly used remote sensing-based approaches are the estimation of leaf area index (LAI) or canopy chlorophyll content, both of which are an effective predictor of crop growth and crop yield, and vegetation indices are developed and tested to better estimate those variables (Viña et al 2011, Lobell et al 2015, Cai et al 2019, Kimm et al 2020b). However, existing approaches are unable to quantify immediate non-structural stress impacts, i.e. physiological down-regulation such as depressions in instantaneous photosynthetic rate, reproductive, and carbon-allocation processes (Erdle et al 2013, Hatfield and Prueger 2015, Fleta-Soriano and Munné-Bosch 2016, Guan et al 2016, 2017). To understand environmental impacts on crops better, it is necessary to make a distinction between structural and physiological impacts and to quantify them separately.
Remote sensing-based quantification of plant physiology has been relatively limited, but new opportunities became available with the advances of sun-induced chlorophyll fluorescence (SIF) measurements. SIF has shown its potential for quantifying plant physiological variability through higher accuracy and sensitivity in quantifying crop productivity or crop stress when compared to existing remote sensing approaches (Sun et al 2015, Song et al 2018, Li et al 2020a). A SIF signal includes information on both plant physiological variation and canopy structural variation. Structural information of SIF has been relatively well understood. Initially, plant canopy-absorbed radiation (absorbed photosynthetically active radiation, APAR) was used to explain SIF signals related to the canopy structural variability and incoming radiation (Miao et al 2020, Yang et al 2018a). More recently, near-infrared reflectance of vegetation (Badgley et al 2017, 2019) and near-infrared radiance of vegetation (NIRvR) (Wu et al 2019, Baldocchi et al 2020) were found to better account for structural- and radiation information, and were used to address the dominance of such non-physiological information in far-red SIF.
A physiological signal of SIF, however, has not been fully recognized so far because of the dominant contribution of canopy structural variation, a lack of physiological stress, and a relatively large magnitude of uncertainty in previous SIF datasets (Dechant et al 2020, 2022, Miao et al 2020). Following a recently introduced framework of understanding SIF signal (Dechant et al 2020), physiological information can be better derived through normalization of SIF by other components, i.e. incoming PAR, the fraction of chlorophyll-absorbed PAR (fAPAR), and escaping ratio (fesc) that describes the measured fraction of SIF photons that escape a plant canopy (Zeng et al 2019). Estimated physiological information of SIF, denoted as ΦF, has been found to be relatively constant from continuous datasets (Dechant et al 2020, Liu et al 2020), but only few studies focused on such a physiological aspect of SIF. Considering the mechanistic link between SIF and photochemistry (Porcar-Castell et al 2014, van der Tol et al 2014), ΦF may include useful physiological information, which is yet to be found.
Recently, there are more opportunities available for studying SIF-derived physiological information at different scales and under different circumstances as SIF data become available at various spatial scales through different platforms. Commonly used SIF platforms are ground-based (portable and stationary), air-borne, and space-borne sensing systems. Datasets from different platforms are complementary in observing spatiotemporal variation of SIF and underscore different aspects of SIF in estimating plant productivity or plant stress. A ground-based portable system usually collects data from experimental plots with specific environmental controls and evaluates the capability of SIF in quantifying plant stress responses (Helm et al 2020, Kimm et al 2021). A ground-based stationary measurement collects continuous data that are often paired with other measurements such as CO2, water, and energy fluxes from an Eddy Covariance-based flux tower. The data usually include a long-term record for biological and meteorological variables, which allow for in-depth evaluation of the observed SIF (Liu et al 2017, Miao et al 2018, 2020, Yang et al 2018a, Li et al 2020b). Airborne and space-borne measurements most efficiently collect data from large areas. These datasets quantify spatial variation over large areas, and findings from such data are spatially representative (Sun et al 2015, Guan et al 2016, Song et al 2018, Li et al 2020a). Given the complementing characteristics of different SIF datasets, to include multi-scale and multi-platform data is critical for achieving a thorough understanding of SIF.
This study focused on the U.S. Corn Belt where one-third of the global corn and soybean supply is produced, and we investigated non-physiological and physiological information contained in far-red SIF (SIF indicates far-red SIF throughout the manuscript) responding to the major crop stress factors, high temperature and high vapor pressure deficit (VPD). Specifically, we derived non-physiological and physiological information of SIF from three different spectral datasets based on different platforms at different scales and analyzed the derived physiological SIF yield (ΦF) to evaluate relative advantages of ΦF signals in understanding crop response to environmental stresses. To obtain a comprehensive understanding, we used three datasets that include different sources of physiological variability, heating treatment effect, controlled water management, and a large natural gradient of temperature and VPD. The overarching question of this study is: Whether SIF-derived physiological signals help us understand and quantify the physiological impacts of high-temperature and high-VPD stresses in the U.S. Corn Belt. Specific questions are: (a) what is the relative importance of the non-physiological signal vs. plant physiological signal in SIF variability under different environmental variabilities? (b) Do the SIF-derived physiological signals indicate plant responses to high-temperature and high-VPD stress and contribute to quantifying physiological stress impacts? If so, to what extent? This study will address the potential improvement of crop monitoring by disaggregating SIF signals into non-physiological and physiological signals and by evaluating the derived physiological signals. Explicit consideration of physiological responses of crops will allow for comprehensive assessment and understanding of crop growth and its interaction with the surrounding environment.
2. Materials and methods
2.1. Data
Data was collected from three platforms at different temporal and spatial scales (table 1). The plot-scale dataset was collected by a ground-based portable system in a warming experiment for soybean (Kimm et al 2021). The field-scale dataset was collected by ground-based stationary systems at adjacent irrigated and rainfed corn-soybean rotation fields. The regional-scale dataset was collected by MODIS and TROPOMI space-borne platforms covering the U.S. Corn Belt.
Table 1. Description of the datasets used in this study.
| Platform | Target | Stress | Spatial scale (footprint) | Temporal scale | Reference | |
|---|---|---|---|---|---|---|

| Ground-based portable system | Warming experiment plots | Temperature | <1 m radius | Daily (discrete) | Kimm et al (2021) |

| Ground-based stationary systems | Irrigated vs rainfed crop fields | VPD | <5 m radius | Half-hourly (continuous) | Miao et al (2020) |

| Space-borne system | U.S. Corn Belt | Temperature and VPD | 0.05° × 0.05° | Daily (continuous) | Köhler et al (2018) |
2.1.1. Plot-scale data
The warming experiment was conducted in 2019 at the SoyFACE facility located in Champaign, Illinois (40°02'30.5'' N 88°13'58.8'' W). The experiment included an ambient level and four treatment levels of canopy temperature (+1.5 °C, +3.0 °C, +4.5 °C, and +6.0 °C) with two replicates. Infrared heaters were used to warm the canopy temperature to a set point and to achieve specific increments compared to the ambient plot. Real-time canopy temperature measurements were made using a thermal infrared radiometer in each plot. Further details can be found in (Kimm et al 2021). Spectral measurements were made using a portable system prepared for rapid data collection over the 12 plots (an ambient plot per two treatment plots where the total 8 treatment plots were designed with 4 levels of treatment and 2 replicates). The system included a low spectral resolution, wide spectral range spectrometer and a high spectral resolution (0.15 nm full width at half maximum, i.e., full width at half maximum (FWHM), and spectral range from 630 to 800 nm), narrow spectral range spectrometer (1.10 nm FWHM and spectral range from 350 to 1100 nm) to collect spectral reflectance for visible and near-infrared waveband and SIF retrieval.
2.1.2. Field-scale data
The stationary observation sites of this study are two corn-soybean rotation fields in Saunders, NE (41°10'46.8'' N 96°26'22.7'' W and 41°09'53.5'' N 96°28'12.4'' W). A combined spectral measurement system, the Fluospec2 system, was deployed at the two sites on a 5 m height scaffold (Miao et al 2018, Yang et al 2018b). Similar to plot-scale data collection, Fluospec2 included two spectrometers with different specifications, and collected spectral data at two different spectral range and resolution (See Miao et al (2018) for the instrumentation details, and see Miao et al (2020) for the data collection details). The data were collected in 2017 and 2018, but 2018 was an abnormally wet year (no water deficit stress) and thus was out of the scope of this study. The spectral measurements were collected next to eddy covariance flux towers registered at AmeriFlux network (site IDs are US-Ne2 and US-Ne3, https://ameriflux.lbl.gov/), and we also used water flux and meteorology data from these flux towers for part of our analysis.
2.1.3. Regional-scale data
We used SIF retrieval from TROPOMI data (Köhler et al 2018), surface reflectance for red and near-infrared waveband of MODIS, and incident photosynthetically active radiation (PAR) derived by applying machine learning methods to MODIS land and atmospheric products (Jiang et al 2020a). Additionally, we used daily maximum temperature and daily maximum VPD of PRISM climate data (https://prism.oregonstate.edu/) to analyze a relationship between climatic variables and SIF signals, crop data layer (CDL) from National Agricultural Statistics Service of United States Department of Agriculture (USDA) to focus on croplands, and irrigation map data to confirm the scope to the rainfed areas.
Daily frequency TROPOMI SIF data were collected with a footprint scale of 3.5 km by 7 km at nadir view (Köhler et al 2018) and were resampled at 0.05° resolution for comparisons with gridded datasets, and cloudy pixels were excluded from the analysis. TROPOMI SIF retrieval algorithm was thoroughly tested in an earlier study (Köhler et al 2018), and the quantified retrieval model error was <1% of measured radiance (∼200 mW m−2 sr−1 nm−1) but could be more than 20% for the retrieved SIF due to its small magnitude (∼3 mW m−2 sr−1 nm−1). To minimize the uncertainty for SIF as well as ΦF calculation (see section 2.2 for ΦF derivation), the data at 0.05° were aggregated at 0.25° of spatial resolution. For consistency with the SIF data, daily 250 m-resolution MODIS surface reflectance and 1 km-resolution PAR data were prepared in the same way. These MODIS data were first aggregated within each footprint of SIF data and then resampled at 0.05° grid. In this study, we only assessed corn and soybean that are the most common commodities in the U.S. Corn Belt by selecting only the pixels with greater than 60% of the combined fraction of corn and soybean based on CDL land cover type data. The land cover data were also similarly prepared as SIF data by calculating the fraction of corn and soybean at each pixel of the aggregated 0.05° grid. To minimize the potential impact of irrigation in evaluating climatic impacts on crops, irrigated areas were excluded from the analysis (the fraction of irrigated area >10%) based on the irrigation map data from Xie et al (2019).
2.2. SIF disaggregation
We applied an advanced framework for interpreting a SIF signal (Dechant et al 2020, Zeng et al 2020), which disaggregates it into non-physiological and physiological signals. Following thorough testing based on simulations, we used either NIRvP or soil-adjusted NIRvP (SANIRvP) as a proxy for non-physiological (i.e. canopy structure and radiation) signals included in SIF, and they are obtained as follows:


where NIRv is an approximation of near-infrared reflectance of vegetation, PAR is incident photosynthetically active radiation, and NIRvmax and NIRvmin are long-term maximum and minimum of NIRv. SANIRvP accounts for soil impact through normalizing NIRv as shown in equation (4), but as it requires long-term records for the reliable consideration of soil impact, it was only used for satellite datasets. Proximal remote sensing-derived NIRvP and satellite-based SANIRvP used different PAR units. NIRvP used instantaneous photon flux density (μmol photon m−2 s−1) whereas SANIRvP used daily radiation energy flux (MJ m−2 d−1) (Jiang et al 2020a). We then derived ΦF using (SA)NIRvP following the below calculations:


The derivation of ΦF is based on the consideration of non-physiological impacts on the canopy-scale observation of SIF that involves multiple factors, i.e. incident radiation, leaf-to-canopy scaling parameters such as LAI and leaf angle distribution. As (SA)NIRvP accounts for the photosystem-to-canopy scaling, the ratio of SIF to (SA)NIRvP allows for estimating photosystem-scale fluorescence yield, which is linked to photochemical yield and stomatal conductance (equations (3), (5)–(7)) (Zeng et al 2020).
2.3. Data analysis
2.3.1. Data preprocessing
We preprocessed the data for our analyses to reduce variations of incoming radiation and canopy structure, which are non-physiological and directly associated with SIF, and to focus on the impacts of high temperature and high VPD on crop physiology. For the two ground-based sensing datasets, time of day and time of year are restricted to peak radiation hours and peak growth season. Particularly for the field-scale data, time of day was set corresponding to the overpass time of TROPOMI data, and the spectral data were aggregated at the daily timescale (table 2). For the TROPOMI data, we only selected the data from a three week period of the highest NIRv on a pixel basis in each year to minimize the pixel-to-pixel difference caused by different phenological stages and to focus on crop responses in their peak growth period. We obtained the three week period mean values and analyzed spatial patterns.
Table 2. Description of data preprocessing.
| Target | Spatial scale | Temporal scale | Time of day | Time of year | |
|---|---|---|---|---|---|

| Warming experiment plots | <1 m radius | Daily (discrete) | 10 AM–3 PM | 20 July–15 September → 20 July–4 September |

| Irrigated vs rainfed crop fields | <5 m radius | Half-hourly (continuous) → Daily | 9 AM–6 PM → 10 AM–2 PM | May–October → July–August |

| U.S. Corn Belt | 0.25° × 0.25° | Daily (continuous) | 10 AM–2 PM | January–December → Peak three week period |
2.3.2. Relative importance analysis
To quantify relative importance, we calculated the relative sum of squares from analysis of variance (ANOVA), i.e. a sum of square for each term ( ,
,  or
or  ) divided by the total sum of square (
 ). The ANOVA was conducted to the below regression model:

where  ,
,  , and
, and  are regression coefficients. To keep the consistency of our analysis across different datasets, we focused on temporal variability rather than spatial variability. ANOVA was conducted for each plot, each site, and each pixel, respectively, and then we averaged the quantified relative importance across different plots, sites, and pixels and obtained a 95% confidence interval from their variability (figures 2(a) and (c)).
2.3.3. Plot-scale data
We used simple linear regression and partial correlation analysis to evaluate to what extent NIRvP and ΦF were associated with non-physiological and physiological stress. We used green chlorophyll vegetation index (GCVI), which is developed for estimating leaf- and canopy-scale chlorophyll content (Gitelson et al 2005), as a proxy for canopy structure. Since the plot-scale data included a manipulated gradient of canopy temperature, we approximated physiological stress by using canopy temperature. Considering the continuity of the warming treatments, structural and physiological impacts were presumed to be collinear. To account for the collinearity between variables, we used partial correlation analysis including GCVI and canopy temperature as an explanatory variable. For correlation analysis and partial correlation analysis, we reported Pearson's correlation coefficient (r and rp, respectively).
2.3.4. Field-scale data
We first compared SIF, NIRvP, and ΦF between the irrigated and rainfed fields and used t-test for significance test. Then further investigated whether the observed ΦF difference indicates plant physiological difference by testing its relation with canopy stomatal conductance (Gs). Gs is regarded as a proxy for plant physiological responses, especially under water-deficit stress (Kimm et al 2020a, Zhang et al 2021) and was obtained by applying the inverted Penman-Monteith equation to the estimated evapotranspiration from Ameriflux tower data (US-Ne1 and US-Ne2, Ameriflux network), which includes minimal surface evaporation impact by removing data possibly affected by precipitation or leaf-surface dew formation. Further details can be found in Kimm et al (2020a).
2.3.5. Regional-scale data
We evaluated whether ΦF potentially contributed to improving our capability of quantifying plant response to high-temperature and high-VPD stresses by analyzing the satellite data along with PRISM climate data. Here we used mean values of the selected three week period, which was the peak season, i.e. the highest mean SANIRv on a pixel basis, to minimize the phenological variability across pixels. We used the Pearson correlation analysis to evaluate how crops in the U.S. Corn Belt responded to the variability of air temperature and VPD through the three variables, SIF, SANIRvP, and ΦF.
3. Results
3.1. Relative importance of the disaggregated signals of SIF
We first evaluated the importance of the non-physiological information for the spatiotemporal variation of all the available SIF data in each dataset. The determination coefficient (R2) of the relationship between SIF and (SA)NIRvP was >0.82 in the three datasets (figure 1). Less than 20% of the SIF variation was potentially attributable to plant physiological information. Considering the uncertainty of the measurements and SIF retrieval, this value maybe even less than 10%. To quantify and evaluate clearer physiological signals from SIF, we controlled temporal variations in radiation and seasonality of canopy development. Before and after the preprocessing, we disaggregated SIF into (SA)NIRv and ΦF that represent a non-physiological and physiological signal, respectively, and quantified the relative importance of each component from the three datasets (figure 2). Although (SA)NIRvP explained the majority of SIF variability in both cases, our relative importance results showed that a physiological signal of SIF occupied a significant portion of SIF variability after the preprocessing and indicated potential applications of SIF-derived physiological signals. With all data included, the relative importance of (SA)NIRvP explained 64%–91% of SIF variability, and ΦF explained 0%–20% (5%, 20%, and 0% for the plot-scale, field-scale, and regional-scale datasets, respectively, figure 2). After preprocessing the data, (SA)NIRvP explained less (60%–82%) and ΦF explained more of SIF variation (28%, 31%, and 17%, respectively for the plot-scale, field-scale, and regional-scale dataset). In both cases, the plot-scale and field-scale datasets showed greater importance of ΦF than the satellite dataset.
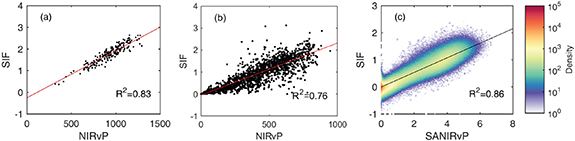
Figure 1. Comparisons between SIF and NIRvP (or SANIRvP) for all the available data in each of the three datasets (i.e. the entire spatiotemporal variation). (a) Plot-scale data, (b) field-scale data, and (c) regional-scale data. The magnitude of NIRvP and SANIRvP differed because NIRvP used instantaneous photon flux density (μmol photon m−2 s−1) whereas SANIRvP used daily radiation energy flux (MJ m−2 d−1) for PAR. A density plot was used for (c) because of the extensive number of data points.
Download figure:
Standard image High-resolution image
Figure 2. The relative importance of NIRvP (or SANIRvP) and ΦF in explaining the spatiotemporal variation of SIF from the plot-scale data (a), field-scale data (b), and regional-scale data (c) before and after the data preprocessing. SSfactor and SStotal are sum of square values from ANOVA.
Download figure:
Standard image High-resolution image3.2. SIF-derived physiological signals for understanding plant responses to high-VPD and high-temperature stresses
For each of the three different datasets, we tested whether (if so, to what extent) the SIF-derived physiological signals indicate physiological stress to high-temperature and water deficit stress. First, linear regression analysis of the plot-scale dataset showed that both NIRvP and ΦF were significantly correlated with GCVI and canopy temperature (Tc), and NIRvP-GCVI and ΦF-Tc showed the greatest association suggesting that NIRvP and ΦF contained information on non-physiological variation and physiological stress, respectively (correlation coefficient for NIRvP-GCVI: 0.47, NIRvP-Tc: −0.28, ΦF-GCVI: 0.35, and ΦF-Tc: −0.50, p< 0.001 for all cases) (figures 3(a)–(d)). In partial correlation analysis, including GCVI and canopy temperature as an explanatory variable, collinearity between the two variables was accounted for, and we evaluated more strictly whether ΦF were indicative of physiological stress. We found from the partial correlation results that the SIF-GCVI correlation was largely attributed to NIRvP (partial correlation rp for NIRvP-GCVI: 0.4, p< 0.001, and for ΦF-GCVI: 0.16, p> 0.01), while the SIF-canopy temperature correlation was entirely attributed to ΦF (rp for ΦF-Tc: −0.4, p< 0.001, and for NIRvP-Tc: not significant, p> 0.1), which showed even greater sensitivity to canopy temperature than SIF (rp = −0.28, p < 0.001) (figure 3(e)).

Figure 3. Left side plots show a scatter plot with a linear regression line for one-to-one relationships for ΦF and GCVI (a), ΦF and Tc (b), NIRvP and GCVI (c), and NIRvP and Tc (d). The right-hand side plot shows partial correlation analysis result for SIF, NIRvP, and ΦF explained by GCVI and canopy temperature (Tc) with the consideration of collinearity (e).
Download figure:
Standard image High-resolution imageSecond, the field-scale data included different water-deficit levels by different management practices (i.e. irrigation or rainfed). We first compared SIF, NIRvP, and ΦF between the two fields and found a statistically significant difference only in ΦF (p < 0.001), which showed an 18% relative difference (two sites' difference normalized by the value of the irrigated site) (figure 4(a)). The smaller ΦF in the rainfed site suggested water deficit stress of the crops, and the lack of SIF difference indicates that ΦF could have a better ability to detect stress than SIF. Further, both Gs and ΦF showed smaller values in the rainfed site, which supported stronger stomatal regulation and photosynthetic depression caused by water deficit. The comparison between Gs and ΦF showed a positive linear relationship only in the rainfed site (figure 4(b)). The discovered positive linear relationship between Gs and ΦF indicated that the observed ΦF difference resulted from the physiological stress by water deficit in the rainfed site.
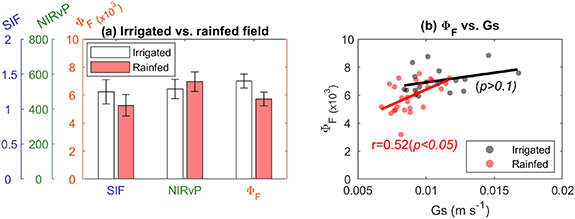
Figure 4. (a) Difference of SIF, NIRvP, and ΦF between the irrigated and rainfed sites. ΦF was compared to canopy scale stomatal conductance (Gs) to evaluate its link to plant physiology in both irrigated and rainfed sites (b).
Download figure:
Standard image High-resolution imageThird, we analyzed the regional-scale data, i.e. TROPOMI SIF, MODIS-based SANIRvP, and SIF-derived ΦF. All three variables negatively responded to VPD, and ΦF showed a greater response to VPD than SANIRvP and SIF (figure 5(d)). For air temperature, the three variables showed a similar pattern with weaker responses than to VPD (figure 5(d)). Only SIF and ΦF showed a negative response to air temperature, and again, ΦF showed greater sensitivity than SIF. Considering the findings of the two ground-based sensing datasets, the relationship of satellite-derived ΦF with air temperature and VPD suggested that ΦF variation could be indicative of plant physiological responses. The correlation between SIF and environmental variables showed that SIF may capture plant responses in terms of both canopy structure and plant physiology, but ΦF separately quantified physiological signals and showed its strength for stress detection through greater sensitivity than SIF.

Figure 5. (a) Maps of SIF, (b) SANIRvP, (c) ΦF in 2018, (d) VPD, and (e) air temperature. (f) Relationship of SIF, SANIRvP, and ΦF with air temperature and VPD during the peak growth period in 2018 (correlations are significant at p < 0.05).
Download figure:
Standard image High-resolution image
4. Discussion
4.1. Plant physiological signals, ΦF, explained a significant portion of SIF variability under different environmental conditions
We first showed a high correlation between SIF and (SA)NIRvP (figure 1), which is consistent with the dominant role of structural information in explaining SIF from previous studies, e.g. SIF was highly correlated with APAR (Miao et al 2018, 2020, Yang et al, 2018a) and NIRvP (Baldocchi et al 2020, Dechant et al 2020). The agreement between SIF and NIRvP was predictable considering the pronounced importance of diurnal and seasonal variation of radiation and seasonality of canopy development in SIF. The relative importance of (SA)NIRvP and ΦF in this study, however, further showed that data preprocessing that controlled temporal variation in radiation and canopy structure amplified ΦF signals and allowed for investigating ΦF and plant physiological responses. With all data included, the relative importance of ΦF was no greater than 20% (5%, 20%, and 0% for the plot-scale, field-scale, and regional-scale datasets, respectively). The highest importance found in the field-scale dataset could be due to the water deficit-induced physiological variability. Meanwhile, the plot-scale dataset showed smaller importance of ΦF although it also included a large physiological variability due to the warming treatments. The different results of the plot-scale and field-scale datasets might be the coupling of NIRvP and ΦF. In the plot-scale dataset, the continuity of the warming treatments affected both canopy structure and plant physiology whereas the field-scale dataset showed decoupling of NIRvP and ΦF (figure 4(a)). After the data preprocessing, the importance of ΦF increased to 17%–31% in the three datasets (figure 2). Specifically, the importance of ΦF was greater in the plot-scale and the field-scale datasets than the regional-scale dataset (28%, 31%, and 17%, respectively for the plot-scale, field-scale, and regional-scale dataset). A probable reason is stress factors included in the two ground-based datasets (i.e. high-temperature stress and water deficit stress in the plot-scale and field-scale data, respectively).
4.2. SIF-derived physiological signals indicate and quantify plant physiological impacts of high-temperature and high-VPD stress
We found from the three datasets that the quantified ΦF contribution to the SIF variation after the data preprocessing was relevant to plant physiological responses. Chlorophyll fluorescence measurements including SIF have long been used to test high-temperature and water stress impacts at the canopy scale (Ač et al 2015). However, SIF-derived ΦF has been only recently evaluated, and in the majority of the previous canopy-scale studies, a lack of explicit consideration of canopy structural impact might have influenced the interpretations of SIF or SIF yield (i.e. SIF divided by APAR). The data of this study showed that SIF-derived ΦF allowed for quantifying plant physiological variation and contributed to quantifying plant physiological responses under stress conditions.
Our plot-scale data from the canopy warming experiment revealed that NIRvP indicated a non-physiological impact, and SIF-derived ΦF was indicative of physiological stress with even greater sensitivity than SIF (figure 5(a)), which is consistent with our expectations based on the theory behind the ΦF derivation. Meanwhile, the field-scale data showed a positive linear relationship between Gs and ΦF, which is consistent with a leaf-level finding (Flexas et al 2002). Even the irrigated site also showed positive linearity between Gs and ΦF, which suggests not only soil moisture but also VPD regulated crop physiology (Kimm et al 2020a). A recent study, on the other hand, reported asymmetry between ΦF and Gs (and photochemical quantum yield, ΦP) responses, which disagrees with our finding (Magney et al 2020, Marrs et al 2020). However, the asymmetry was found under artificial treatments, i.e. abscisic acid application and pressure cuff-induced xylem embolism, while our result was based on less artificial abiotic stress impacts, and target plants' stress coping mechanism might have differed under artificial treatments.
The relationship between Gs and ΦF of our analysis suggests that ΦF is indicative of plant physiological responses because, under the water deficit conditions of our measurements, Gs behavior suggests physiological stress and further, Gs could be mechanistically connected and synchronized with ΦP. The relation between ΦP and Gs might be partially explained by mechanisms related to photosynthetic processes. First, there have been investigations on the direct connection between stomatal behavior and photosynthetic electron transfer chain (Sharkey and Raschke 1981, Messinger et al 2006, Busch 2014, Głowacka et al 2018). The connection between the two components has not been fully understood, but changes in light, i.e. different spectral intensity or modulations in photosystem II, were found to induce stomatal behavioral changes suggesting a direct connection. Second, optimality theory may explain the link between stomatal behavior and light reaction. Stomatal behavior was often understood from a perspective of optimization between carbon gain and water loss (Katul et al 2012), and photosynthetic processes were also seen from an optimality perspective utilizing the balance between rubisco carbon fixation and photosynthetic electron transfer rate (Jiang et al 2020b). A rate of photosynthesis involves multiple processes including stomatal behavior, and to optimize resource and energy use, plants are expected to balance between the processes resulting in the linearity between Gs and ΦP.
The SIF-derived ΦF application also showed the potential with the satellite data analysis and supported the large-scale applicability of ΦF for SIF-based physiological investigations. Existing studies of satellite-based SIF have found that SIF showed stronger and earlier plant responses to droughts and heat stress than conventional vegetation indices (Sun et al 2015, Song et al 2018, Li et al 2020a). However, what the SIF responses actually suggested remained unclear, e.g. how much of SIF responses were due to the physiological responses or non-physiological variability. Our analysis showed that SIF responses to temperature and VPD were attributed more to ΦF than SANIRvP, indicating physiological stress than canopy structural depressions. Especially, temperature impact on SIF was largely attributed to ΦF while almost no response was found in SANIRvP (figure 5(f)), and we found greater sensitivity of ΦF to climate variables than SIF. The aforementioned relationship of ΦF with temperature and VPD showed that, despite the large uncertainty, the derived ΦF suggested plant physiological responses. Its sensitivity to climate variables indicates ΦF could be more useful than SIF in detecting physiological stresses possibly because ΦF is unassociated with canopy structural variation, unlike SIF.
4.3. Implications of using ΦF for ecosystem stress detection
In this study, we quantified SIF-derived ΦF and demonstrated its capability for physiological investigations in crops. Our results addressed the unique contribution of SIF to remote sensing of crops and showed the potential of SIF for large-scale crop stress quantification. Previous crop SIF studies, however, reported that physiological signals may have a marginal contribution to SIF variations (Miao et al 2018, Yang et al 2018a, Dechant et al 2020), and particularly, studies that investigated SIF-derived ΦF found the physiological signal relatively constant throughout their datasets (Dechant et al 2020, Liu et al 2020). We speculate that the different findings about ΦF were due to two major aspects, i.e. if physiological stresses existed and how tightly physiological stress was coupled with canopy structural variation. First, crop physiological stress tends to be well managed through agricultural management practices such as irrigation and fertilization application (Peng et al 2020), and previous crop SIF studies observed crops without stress, and therefore, observed no clear signals of physiological variation. This study, on the other hand, included data of crops with and without high-temperature or high-VPD conditions, and by comparing their difference, we captured strong physiological down-regulation of crop productivity. Second, crop physiological status is largely coupled with canopy structure, and crop productivity largely depends on canopy structure (Wu et al 2019, Liu et al 2020). The opposite case, for example, is evergreen ecosystems where canopy structural variation and physiological status are largely decoupled and SIF can quantify physiological variations better than in other ecosystems (Walther et al 2016, Magney et al 2019, Kim et al 2021). In this study, we processed the data constraining variations in radiation and canopy structure to decouple structure and physiology, which allowed the extraction of signals that are related to physiological variations.
5. Conclusion
In this study, we quantified the SIF-derived physiological signal, ΦF, and investigated whether ΦF signal quantifies crop physiological responses and contributes to understanding crop responses to environmental stresses. We analyzed three SIF datasets at different spatial scales and platforms, and disaggregation of SIF showed that ∼31% of SIF variation was attributable to ΦF, which was theoretically relevant to plant physiological responses. We further analyzed and demonstrated that ΦF signals suggested crop physiological responses to high-temperature and water deficit stresses with greater sensitivity to plant responses compared to SIF. The findings were from plot-scale, field-scale, and regional-scale datasets and showed the scalability of ΦF application for physiological investigations. This study highlights the unique contribution of SIF to remote sensing of vegetation physiology by utilizing ΦF and emphasizes the potential of ΦF in understanding plant physiology responses to different environmental conditions as well as the stress-coping mechanisms of plants.
Acknowledgments
Guan, Kimm, Ainsworth, and Bernacchi acknowledge financial support from the U.S. Department of Agriculture National Institute of Food and Agriculture Project (20176701326253) titled 'Parsing Multiple Mechanisms of High Temperature Impacts on Soybean Yield Combining Infrared Heating Experiments and Process Based Modeling'. Guan and Kimm acknowledge funding from the National Aeronautics and Space Administration (NASA), Carbon Monitoring System Award (80NSSC18K0170) and Carbon Cycle Science (NNX17AE14G). Guan and Kimm also acknowledge fellowship support from the Illinois Water Resources Center (IWRC) affiliated to the U.S. Geological Survey (USGS) and Block Grant fellowship support from the department of Natural Resources and Environmental Sciences at the University of Illinois Urbana-Champaign. Suyker acknowledges the AmeriFlux Management Project funding of this core site provided by the U.S. Department of Energy's Office of Science under Contract No. DE-AC02-05CH11231 and partially supported by the Nebraska Agricultural Experiment Station with funding from the Hatch Act (Accession Number 1020768) through the USDA National Institute of Food and Agriculture.
Data availability statement
The data that support the findings of this study are available upon reasonable request from the authors.