
Abstract
We analyse the optical properties of InAs1−xSbx/Aly In1−y As quantum wells (QWs) grown by molecular beam epitaxy on relaxed Aly In1−y As metamorphic buffer layers (MBLs) using GaAs substrates. The use of Aly In1−y As MBLs allows for the growth of QWs having large type-I band offsets, and emission wavelengths >3  m. Photoluminescence (PL) measurements for QWs having Sb compositions up to x = 10% demonstrate strong room temperature PL up to 3.4
  m, as well as enhancement of the PL intensity with increasing wavelength. To quantify the trends in the measured PL we calculate the QW spontaneous emission (SE), using a theoretical model based on an eight-band
  Hamiltonian. The theoretical calculations, which are in good agreement with experiment, identify that the observed enhancement in PL intensity with increasing wavelength is associated with the impact of compressive strain on the QW valence band structure, which reduces the band edge density of states making more carriers available to undergo radiative recombination at fixed carrier density. Our results highlight the potential of type-I InAs1−xSbx/Aly In1−y As metamorphic QWs to address several limitations associated with existing heterostructures operating in the mid-infrared, establishing these novel heterostructures as a suitable platform for the development of light-emitting diodes and diode lasers.
Export citation and abstract BibTeX RIS

Original content from this work may be used under the terms of the Creative Commons Attribution 3.0 licence. Any further distribution of this work must maintain attribution to the author(s) and the title of the work, journal citation and DOI.
1. Introduction
There is increasing interest in the development of compact and inexpensive semiconductor light sources operating at mid-infrared wavelengths between 2–5  m, due to their potential for a wide variety of sensing applications, including monitoring of atmospheric pollutants, chemical process control, and detection of biological markers in non-invasive medical diagnostics, in addition to potential applications in free-space optical communications. [1–4] Due to the presence of strong absorption features in the vibrational-rotational spectra of the important greenhouse gases methane (CH4) and carbon dioxide (CO2) at respective wavelengths close to 3.3 and 4.2
  m, devices operating at these wavelengths are of particular interest for environmental monitoring [3].
Over the past decade, significant advances have been made in the development of GaSb-based diode lasers and light-emitting diodes (LEDs) [5–7]. In the 2–3  m spectral range type-I GaInAsSb/AlGa(In)AsSb QWs have demonstrated impressive characteristics, but their performance at and above room temperature degrades significantly for wavelengths
 m due to a combination of Auger recombination and thermal leakage of holes [8–11]. Further limitations to achieving
 m in GaSb-based heterostructures relate to the presence of (i) a miscibility gap in In- and As-rich GaInAsSb alloys, leading to a reduction in material quality, and (ii) a band structure in which the valence band (VB) spin-orbit splitting energy is close in magnitude to the band gap, leading to increased hot-hole producing (CHSH) Auger recombination and inter-VB absorption.
While inter- and intra-band cascade devices have become well established at wavelengths above 3  m, [12–17] these are complicated structures requiring careful design and optimisation: a typical cascade active region consists of up to 100 layers with tight tolerances on thickness and composition, with the requirement for reproducibility then placing strong demands on epitaxial growth. Furthermore, due to the relative expense and technological immaturity of the GaSb and InAs platforms compared to the GaAs or InP platforms commonly employed in near-infrared optical communications, it is preferable to develop mid-infrared devices on either GaAs or InP substrates. Doing so has the potential to reduce fabrication costs, as well as to allow to take advantage of the existing array of high-performance GaAs- and InP-based passive photonic components and integrated circuitry.
Here, we present and analyse InAs1−xSbx/Aly In1−y As quantum wells (QWs) grown on GaAs substrates, where growth of these lattice-mismatched heterostructures is facilitated via relaxed Aly In1−y As metamorphic buffer layers (MBLs). These QWs offer deep type-I band offsets, providing good confinement of both electrons and holes, and hence respectively maximising and minimising the electron-hole spatial overlap and thermal carrier leakage. The prototypical structures we investigate demonstrate (i) strong room temperature photoluminescence (PL) up to 
 m, and (ii) a steady increase in peak and integrated PL intensity with increasing emission wavelength. Using theoretical calculations we identify and quantify the origin of this behaviour, highlighting the key role played by compressive strain in the QW layers. Moreover, we describe general trends in the electronic and optical properties of these novel heterostructures, and on this basis evaluate their potential for applications in mid-infrared LEDs. Our analysis demonstrates that the characteristics of these metamorphic QWs are promising for the development of LEDs or diode lasers operating in the 3–4
  m wavelength range, and in particular for sensing applications at wavelengths close to 3.3
  m.
m.
The remainder of this paper is organised as follows. In section 2 we describe the growth and characterisation of the structures investigated, and the experimental measurements of the optical properties. In section 3 we describe the theoretical model used to analyse the electronic and optical properties. We then present our experimental and theoretical results in section 4, beginning with an analysis of general properties of metamorphic InAs1−xSbx/Aly In1−y As QWs, before analysing the grown structures. Finally, in section 5, we summarise and conclude.
2. Growth, characterisation and experimental measurements
The structures investigated were grown on (0 0 1)-oriented n-type GaAs substrates, using a Veeco GENxplor molecular beam epitaxy (MBE) system. Valved cracker cells were used to provide the As2 and Sb2 fluxes, while thermal effusion K-cells were used to provide the In and Al fluxes. In situ reflection high-energy electron diffraction was used to monitor surface reconstruction. A schematic illustration of the MBE-grown structures is shown in figure 1(a). Each structure consists of a 0.4  m thick GaAs buffer, grown at 570 °C, atop which a 2
  m thick relaxed Al0.125In0.875As MBL was grown at 510 °C. The structures were cooled to 450 °C for the growth of the five-period InAs1−xSbx/Al0.125In0.875As multi-QW (active) layers. The respective thicknesses of the InAs1−xSbx QW and Al0.125In0.875As barrier layers were 10.5 and 20 nm. Finally, a 110 nm thick Al0.125In0.875As cap layer was deposited at a temperature of 450 °C.
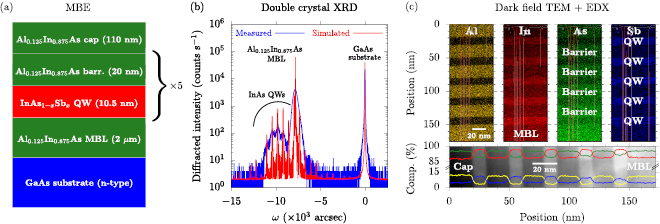
Figure 1. (a) Schematic illustration of the metamorphic multi-QW structures investigated in this work: the structures consist of compressively strained InAs1−xSbx QWs grown between unstrained Al0.125In0.875As barriers, with growth on GaAs facilitated via the use of an Al0.125In0.875As MBL. (b) DC-XRD spectrum for MQW1, measured (solid blue line) and simulated (solid red line) about the GaAs (0 0 4) reflection. (c) Upper panels: false-colour dark-field TEM images for MQW4, where the intensity of the yellow, red, green and blue colouration respectively describes the Al, In, As and Sb compositions in the QW and barrier layers. Lower panel: solid yellow, red, green and blue lines respectively denote the variation of the Al, In, As and Sb compositions along the (0 0 1) growth direction for MQW4, as inferred from EDX measurements. For illustrative purposes, the EDX data have been superimposed onto a dark-field TEM image of the structure.
Download figure:
Standard image High-resolution imageThe structures were characterised by a combination of double-crystal x-ray diffraction (DC-XRD), atomic force microscopy and transmission electron microscopy (TEM). The solid blue line in figure 1(b) shows the DC-XRD spectrum for structure MQW1, measured about the GaAs (0 0 4) reflection. The solid red line shows the corresponding simulated DC-XRD spectrum, obtained using the Bede RADs software. We observe good overall correspondence between the measured and simulated DC-XRD spectra, confirming in particular that the Al0.125In0.875As MBL and InAs1−xSbx QWs are respectively fully relaxed and pseudomorphically strained. The full-width at half-maximum of the measured peak in the DC-XRD spectrum corresponding to the relaxed Al0.125In0.875As MBL is 759 arcsec, in good agreement with previous reports [18–20]. Several satellite peaks associated with the compressively strained InAs1−xSbx QWs are observed in the measured and simulated DC-XRD spectra, from which the QW strain, and hence Sb composition x, can be estimated (see table 1). For the four structures MQW1–MQW4 grown, we estimate respective QW Sb compositions x = 0%, 3%, 6% and 10%.
Table 1. Details of the MBE-grown InAs1−xSbx/Aly In1−y As multi-QW structures studied, including the nominal QW Sb composition x, measured PL peak energies at T = 4 and 300 K, calculated in-plane strain  , and calculated CB, HH and LH type-I band offsets
  ,
,  and
and  at T = 300 K. Each structure contains five InAs1−xSbx QWs, of nominal thickness 10.5 nm. Sb compositions in parentheses are those determined using the theoretical model to fit to the shift in the measured PL peak energy relative to that of MQW1 at T = 300 K. The PL peak energies in parentheses are the corresponding calculated SE peak energies at T = 4 and 300 K using the theoretical best-fit Sb compositions.
| Structure | x (%) | PL peak, 4 K (eV) | PL peak, 300 K (eV) |  (%) (%) |
 (meV) (meV) |
 (meV) (meV) |
 (meV) (meV) |
|---|---|---|---|---|---|---|---|
| MQW1 | 0.0 (0.0) | 0.495 (0.480) | 0.437 (0.426) | −0.82 | 151 | 89 | 33 |
| MQW2 | 3.0 (4.2) | 0.448 (0.438) | 0.395 (0.384) | −1.03 | 133 | 149 | 79 |
| MQW3 | 6.0 (5.5) | 0.457 (0.427) | 0.383 (0.372) | −1.23 | 120 | 170 | 89 |
| MQW4 | 10.0 (7.0) | 0.420 (0.414) | 0.370 (0.359) | −1.51 | 104 | 197 | 100 |
TEM experiments were performed to evaluate the quality of MQW4, since the QWs in this structure—which have the highest QW Sb composition x—are most prone to Sb segregation. We focus here on the TEM analysis of the active (multi-QW) region. For reference, low magnification scanning TEM images of the entire structure of MQW4 are provided as supplementary material (stacks.iop.org/JPhysD/52/465102/mmedia), where we note high crystalline and structural quality of the Aly In1−y As MBL, as well as the overall multi-QW structure. The TEM measurements were carried out in scanning (STEM) mode, using a ChemiSTEM microscope operated at 200 kV, equipped with a probe corrector leading to sub-angstrom lateral resolution and a ChemiSTEM x-ray detection system, consisting of four embedded SDD detectors. The energy resolution is <136 eV (at the Mn-K edge, with a measured output of 10 000 counts per second). The energy dispersive x-ray spectroscopy (EDX) data were processed by means of Brukers' ESPRIT software.
The upper panel of figure 1(c) shows the spatial distribution of the chemical constituents Al, In, As and Sb, within the active region of structure MQW4, with the compositions mapped via EDX measurements are displayed in yellow, red, green and blue respectively. The bottom panel of figure 1(c) shows the alloy composition along the growth direction extracted from the EDX measurements, with the line colours for Al, In, As and Sb corresponding to those in the upper panels. The EDX profiles shown in the bottom panel of figure 1(c) were extracted as the average of the measured composition profile along the growth direction, from EDX mapping of the QW region acquired in STEM mode. Typical recorded EDX maps have a resolution of 10 px nm−1 and cover an area ∼1  m2 around the QWs (9600 nm2 for the data shown in figure 1(c)). These EDX data enabled extraction of the alloy composition throughout the structure. The associated error values for the extracted Al, As, In and Sb compositions are 0.6%, 0.5%, 0.7% and 0.4%, respectively.
The TEM results evidence the formation of pristine InAs1−xSbx QWs having sharp interfaces with the Al0.125In0.875As barriers, with only minor variations in QW thickness. The EDX data for the active region indicate average Sb compositions x between 10.0% and 11.5% (solid blue line) in the QW layers. We note that the Sb composition tends to increase in each QW along the growth direction—i.e. the bottom QW has an average Sb composition  %, while the average Sb composition of the QW closest to the surface is approximately 11.5%. For group-III elements, the barrier Al composition y (solid yellow line) tends also to be slightly higher in the Aly In1−y As layers of the structure closest to the surface, with a measured average value close to
  % in the barrier on the underside of the first QW being within 2% of the average value
  % in the barrier on the topside of the fifth QW (i.e. in the capping layer). The TEM and EDX analyses then demonstrate that high crystalline quality is achieved for both the InAs1−xSbx QW and Aly In1−y As barrier layers of the structure (see figure 1(a)), displaying coherent and abrupt interfaces. Overall, these chemical analyses reveal a slight modulation of the QW Sb composition, which tends to increase towards the surface of the structure (see figure 1(c)), representing the most significant non-uniformity present in these MBE-grown structures.
To analyse the optical properties of the structures described in table 1 we have performed temperature-dependent PL measurements. The PL measurements were carried out using a 785 nm diode-pumped solid state laser as the optical (excitation) source, with a continuous-wave output power of 200 mW. The laser spot size was 1 mm2, corresponding to a power density of 20 W m−2 at the sample surface. The radiation emitted from the structures upon excitation was collected using CaF2 lenses and focused onto a Bruker Vertex 70 Fourier transform mid-infrared spectrometer having a resolution of 0.4 cm−1. The sample temperature was varied between T = 4 and 300 K by means of a closed-cycle He cryostat.
3. Theoretical model
Our theoretical calculations of the electronic and optical properties of these structures were based on an eight-band  Hamiltonian [21], implemented for QW heterostructures via a numerically efficient reciprocal space (plane wave) method [22–24]. The temperature dependence of the InAs1−xSbx and Aly In1−y As band gaps is described via a conventional Varshni parametrisation [25, 26]. The band structure and eigenstates obtained via the multi-band
  calculation for a given QW structure are used directly to compute SE spectra, under the assumption of quasi-equilibrium (thermal) carrier distributions. To facilitate comparison to experiment we perform SE calculations at a fixed carrier density n = 1015 cm−3 per QW, a low value selected to replicate a typical carrier density associated with optical excitation in the PL measurements for the structures under investigation. Full details of the theoretical model—which is based upon that we have previously developed to analyse the properties of 1.3
  m metamorphic QW lasers, as well as near- and mid-infrared dilute bismide QW lasers [27–30]—will be presented in [31]. We assume ideal, compressively strained InAs1−xSbx QWs of thickness 10.5 nm, surrounded by unstrained Al0.125In0.875As barriers. For the Sb-free (x = 0) structure MQW1 we note good agreement between theory and experiment, with only an 11 meV difference between the measured PL and calculated SE peak energies at room temperature. For MQW2–MQW4 the QW lattice constants inferred from the XRD measurements are used directly to compute the strain in the QW layers. Since our focus here is on the evolution of the optical properties with room temperature emission wavelength, for the theoretical calculations the QW Sb composition x is varied to reproduce—in the calculated SE spectrum for each structure—the shift in the measured room temperature PL peak energy relative to MQW1. The Sb compositions obtained in this manner are given in parentheses in table 1. The best-fit value of x is close to the nominal Sb composition indicated by experimental characterisation for MQW3, but is higher (lower) than the nominal value in MQW2 (MQW4). A number of factors may contribute to discrepancies in these theoretical best-fit Sb compositions, including fluctations in QW alloy composition and thickness (see figure 1(c)). For simplicity we refer throughout the text to the nominal, rather than theoretical best-fit, Sb compositions.
The material parameters used in our calculations are as recommended by Vurgaftman et al [26], with the exception that for InAs1−xSbx we (i) choose a band gap bowing of 0.938 eV following Webster et al [32], and (ii) set the bowing of the VB spin-orbit splitting energy to zero. This choice of material parameters has been benchmarked against experimental measurements, where we find that it quantitatively describes the dependence on Sb composition and temperature of the measured PL emission peak energy in a range of type-II InAs1−xSbx/InAs QWs and superlattices (see, e.g. [33] and references therein). The band offsets in the InAs1−xSbx/Aly In1−y As QWs are calculated using the model solid theory [34], where (i) the average VB energies have been chosen to reproduce a natural (unstrained) VB offset of 0.59 eV between InAs and InSb [26], and (ii) the approach of Krijn [35] is used to compute the bowing of the alloy average VB energy.
4. Results
We begin our analysis by considering the calculated band structure of bulk-like InAs1−xSbx epitaxial layers grown on Aly In1−y As MBLs. The solid blue (dashed red) lines in figure 2(a) denote compositions for which the bulk band gap Eg (in-plane strain  ) is constant. The lattice constant of the Aly In1−y As MBL varies between that of InAs and AlAs, equalling that of InP for y = 47.7%. Figure 2(a) suggests that (i) Eg = 0.376 eV (
 m) can be achieved, e.g. in bulk for
  % but with large MBL Al compositions
  %, corresponding to large compressive strains
  %, and (ii) Eg = 0.248 eV (
 m) can be achieved, e.g. at
  % (
% ( %) via growth on an Al0.1In0.9As MBL.
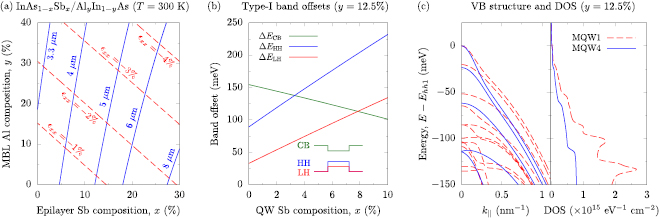
Figure 2. (a) Composition space map describing the ranges of in-plane strain ( ) and room temperature band gap (emission wavelength) accessible using bulk-like InAs1−xSbx epitaxial layers grown on an Aly In1−y As MBL. Dashed red and solid blue lines respectively denote paths in the composition space along which
  and the band gap are constant. (b) Calculated variation of the CB, HH and LH type-I band offsets (solid green, blue and red lines, respectively) with Sb composition x, for compressively strained InAs1−xSbx QWs grown on an Al0.125In0.875As MBL. (c) Calculated VB structure (left panel) and DOS (right panel) for structures MQW1 (dashed red lines) and MQW4 (solid blue lines) of table 1. For each structure the zero of energy has been set at the QW VB edge—i.e. at the energy of the highest energy valence subband hh1, which is purely HH-like at
  .
.
Download figure:
Standard image High-resolution imageThese results suggest that compressively strained InAs1−xSbx epitaxial layers grown on relaxed Aly In1−y As MBLs offer access to a broad range of mid-infrared emission wavelengths 
 m. We note however that the calculations presented in figure 2(a) are for bulk-like epitaxial layers. When considering QWs the confinement energy—totalling approximately 50 meV for the lowest energy bound CB (e1) and highest energy bound hole (h1) states in full numerical calculations—must be accounted for. Achieving a desired QW e1 − h1 band gap then requires growth of InAs1−xSbx QWs having a bulk band gap which is lower by approximately 50 meV, requiring a significant increase in x and hence
  and thereby limiting the accessible wavelength range. Using the expression due to Voisin [36, 37], we estimate a strain-thickness limit
  nm % for InAs1−xSbx/Al0.125In0.875As. This suggests a maximum permissible strain
  % for a 10 nm thick QW in the structures grown and analysed here, corresponding to
  %. For such an InAs0.78Sb0.22/Al0.125In0.875As QW we calculate an e1 − h1 transition energy of 0.221 eV at T = 300 K, suggesting that the room temperature emission wavelength is restricted to
 m by strain-thickness limitations. Further analysis (below) suggests that this estimated upper limit on the emission wavelength is likely reduced in practice.
Turning our attention now to the InAs1−xSbx/Al0.125In0.875As QWs of interest here, the solid green, blue and red lines in figure 2(b) respectively show the calculated type-I conduction band (CB), heavy-hole (HH) and light-hole (LH) QW band offsets  ,
,  and
and  , as a function of the Sb composition x in the QW. At x = 0 (MQW1) we calculate large type-I CB and HH band offsets,
  meV and
  meV (see table 1). As x increases we calculate a strong increase in
  , to 232 meV at x = 10%, as a result of the associated increases in (i) the VB offset, and (ii) the magnitude
  of the compressive strain. Conversely,
  is calculated to decrease strongly with increasing x—to 97 meV at x = 10%—due to the upward shift of the InAs1−xSbx CB edge energy with increasing
  . As such, the ionisation energy for a bound e1 electron decreases strongly with increasing x, from 110 meV at x = 0 to 64 meV at x = 10%. This ionisation energy is calculated as the difference between the barrier CB edge and the energy of the bound e1 eigenstate at
  , which is the maximum possible energy required to extract a bound electron from the QW, and at x = 10% is only slightly larger than twice the average thermal energy
  at room temperature. This analysis suggests that electron confinement is significantly degraded for
  %, corresponding in a full numerical calculation to
 m. We therefore conclude that favourable type-I band offsets—providing high electron-hole spatial overlap and minimising thermal carrier leakage— can be achieved for
 m in InAs1−xSbx/Al0.125In0.875As QWs having
  %. Extending the emission wavelength beyond 4
  m would then require careful QW design and optimisation. For example, via incorporation of nitrogen (N) to form dilute nitride InNz(As1−xSbx)1−z QWs, where the band anti-crossing interaction associated with N impurity states brings about a simultaneous reduction of the band gap and lattice constant [38, 39], allowing increased flexibility via strain engineering and allowing for the design of metamorphic type-I QWs having large CB offsets and emission wavelengths
  4
4  m [31, 40].
The left- and right-hand panels of figure 2(c) respectively show the calculated VB structure and density of states (DOS) for structures MQW1 (dashed red lines) and MQW4 (solid blue lines) of table 1. The larger compressive strain in MQW4 leads to reduced in-plane hole effective masses, and hence to an overall reduction in the VB edge DOS. On the basis of the calculated electronic properties we note that (i) achieving longer emission wavelengths requires higher Sb compositions x, but comes at the expense of degrading the electron confinement (see figure 2(b)), and (ii) for fixed MBL Al composition y larger Sb compositions x are associated with larger  , which can be expected to reduce the VB edge DOS and enhance the radiative efficiency [41, 42]. Our analysis therefore identifies an important trade-off for the design of optimised structures to target specific emission wavelengths: sufficiently high Sb compositions x should be sought to generate appreciable compressive strain in the QW(s), while ensuring that x is not sufficiently large that thermal leakage of electrons degrades the overall efficiency of a QW-LED or laser device at and above room temperature [31].
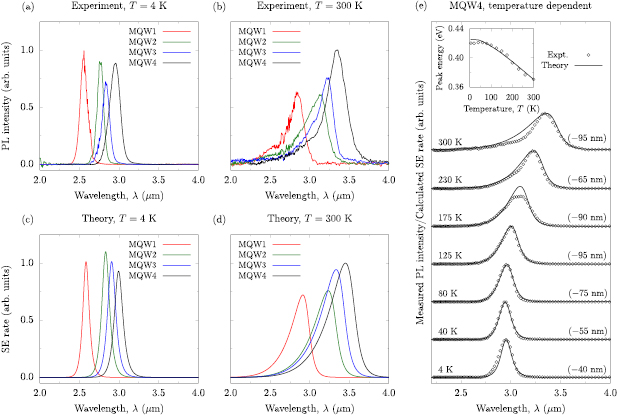
Having described general trends in the calculated electronic properties of these structures, we turn our attention now to the optical properties. Figures 3(a) and (b) show the measured PL spectra for the structures of table 1, at respective temperatures T = 4 and 300 K. In each case the measured PL spectrum for MQW1–MQW4 is shown using solid red, green, blue and black lines, respectively. At each temperature the PL spectra have been normalised to the intensity of the structure having the highest measured peak PL intensity (MQW1 at T = 4 K, and MQW4 at T = 300 K). Examining first the PL spectra measured at T = 4 K in figure 3(a), we note that incorporating Sb leads to a significant redshift of the emission wavelength. For the Sb-free structure MQW1 we measure a PL peak wavelength of 2.51  m (0.495 eV), which shifts to 2.95
  m (0.420 eV) in MQW4 which contains 10% Sb. At T = 300 K the temperature-induced band gap reduction redshifts these PL peak wavelengths to 2.84 and 3.35
  m (0.437 and 0.370 eV) respectively (see table 1). For MQW1 we calculate respective peak PL wavelengths of 2.58 and 2.91
  m at T = 4 and 300 K, corresponding to respective PL peak energies of 0.480 and 0.426 eV. The theoretical calculations then underestimate the measured PL peak energy by only 15 meV (11 meV) at T = 4 K (300 K), suggesting good quantitative agreement between theory and experiment. We note that these small deviations between the measured and calculated values for the Sb-free structure are likely attibutable to inhomogeneities in the structure due, e.g. to fluctuations in QW thickness, alloy intermixing between the barrier and adjacent QW layers during growth (see figure 1(c)), or uncertainties in the material parameters employed in the theoretical calculations.
Figure 3. Measured PL spectra for structures MQW1–MQW4 (solid red, green, blue and black lines, respectively) at temperatures (a) T = 4 K, and (b) T = 300 K. The corresponding calculated SE spectra for structures MQW1–MQW4 at T = 4 and 300 K are shown respectively in (c) and (d). At each temperature the values of the measured PL and calculated SE have been normalised to that of the structure having the highest measured peak PL intensity (MQW1 at 4 K, and MQW4 at 300 K). The full temperature-dependent set of measured PL and calculated SE spectra for MQW4 are shown in (e) using, respectively, open circles and solid black lines. The calculated SE spectra in (e) have, at each temperature, been normalised in intensity (except at T = 175 K; see text) and shifted in wavelength (by the amount specified in parentheses) to match the experimental data at the PL peak. The open circles (solid black line) in the inset to (e) show the measured (calculated) variation of the PL (SE) peak energy with temperature in MQW4, where a rigid 11 meV redshift has been applied to the calculated SE peak energies to match the measured and calculated energy at T = 300 K.
Download figure:
Standard image High-resolution image
At T = 4 and 300 K we observe that the measured PL spectra for the structures of table 1 have similar overall character. Firstly, all spectra possess a single emission peak, which the theoretical calculations confirm as resulting from recombination involving electrons occupying states in the lowest energy (e1) QW conduction subband. This is consistent with the low carrier densities generated by optical excitation, upon which basis we expect that excited electrons thermalise rapidly into the e1 subband. While theoretical calculations at T = 4 K suggest that injected holes solely occupy states in the highest energy (hh1) valence subband, at T = 300 K a substantial fraction ( %) occupy states in the second valence subband (hh2). However, the matrix elements for optical transitions between e1 and hh2 subband states vanish at the centre of the QW Brillouin zone (
 ), and remain small compared to those associated with e1 − hh1 transitions at non-zero in-plane wave vector
  , indicating that recombination of e1 electrons with hh2 holes does not contribute appreciably to the optical emission. Secondly, while the measured PL spectra at T = 4 K are largely symmetric about the emission peak, at T = 300 K we note the presence of a pronounced high energy tail. This is consistent with the presence of thermalised carrier distributions, describable by separate electron and hole quasi-Fermi distribution functions, whereby carriers at higher temperature occupy subband states over larger ranges of energies than at low temperature.
Turning our attention to the intensity of the measured PL spectra, at T = 4 K we note that the measured peak PL intensity remains approximately constant for all structures—with the exception of MQW3, where a lower peak PL intensity is observed—reducing by approximately 10% in going from the Sb-free MQW1, to MQW4 in which x = 10%. Conversely, at T = 300 K we note that the measured peak PL intensity increases strongly with increasing Sb composition x—or, equivalently, increasing emission wavelength—with the measured peak PL intensity for MQW4 at T = 300 K being larger by approximately two-thirds than that measured for MQW1 at the same temperature. We note that the measured enhancement at room temperature of the peak PL intensity under illumination at fixed excitation power density is promising from the perspective of device applications at wavelengths  3
3  m, since theoretical analysis (below) indicates that the requirement to incorporate Sb to reach these wavelengths is associated with an intrinsic enhancement of the radiative efficiency of a multi-QW structure.
Figures 3(c) and (d) show the calculated SE spectra for the structures of table 1, at respective temperatures T = 4 and 300 K. The line colours and normalisation of the peak SE rate are as for the measured PL spectra in figures 3(a) and (b). We note good overall qualitative agreement between these calculated SE spectra and the measured PL spectra of figures 3(a) and (b). At T = 4 K the measured peak PL intensity and calculated peak SE rate reduce by  10% as x increases from 0 (MQW1) to 10% (MQW4), while at T = 300 K the peak measured PL intensity and calculated SE rate increases by
  40% between x = 0 and 10%. On this basis we conclude that the theoretical model correctly captures the key observed trends in the experimental measurements: at low temperature the emission intensity at fixed injection is approximately independent of x (or, equivalently,
  ), while at room temperature the emission intensity increases strongly with increasing
  . We note that at T = 4 K the calculated peak SE rate for MQW3 is intermediate between those calculated for MQW2 and MQW4. This is in contrast to the trend observed in the PL measurements, suggesting that the lower measured peak PL intensity for MQW3 could be associated with deviations from the ideal structures treated in the theoretical calculations, e.g. by the presence of crystalline defects and/or pronounced short-range alloy disorder in the sample, giving rise to (weak) carrier localisation at low temperature.
Figure 3(e) shows the measured PL (open circles) and calculated SE (solid lines) spectra for MQW4 (x = 10%), for a range of temperatures from T = 4 to 300 K. To facilitate comparison of the overall character of the measured and calculated spectra, the calculated SE spectra at each temperature have been (i) shifted in wavelength (by the amount denoted in parentheses in figure 3(e)) to match the peak of the corresponding measured PL spectrum, and (ii) normalised to the measured peak PL intensity. This normalisation has not been carried out at T = 175 K due to the presence of what appears to be an absorption feature at 
 m, evident in the experimental data for
  K and lying close to the PL peak at T = 175 K. We attribute this anomalous absorption, which is present at this wavelength in all of the samples studied, to the presence of atmospheric water (H2O) vapour. Despite this, we again note good overall agreement between theory and experiment. The calculated SE spectra—in which the spectral broadening is described theoretically by a hyperbolic secant lineshape [29] of width 6.6 meV—describe that the spectral broadening of the measured PL spectra is typical of that of a conventional III–V semiconductor alloy [43], suggesting high material quality in the metamorphic QWs, in agreement with the results of the TEM measurements described above. The inset to figure 3(e) shows the variation with temperature of the measured PL (open circles) and calculated SE (solid line) peak energy, where a rigid 11 meV redshift has been applied to the calculated data to account for the discrepancy between the measured PL and calculated SE peak energies at room temperature (see table 1). The close agreement between theory and experiment here verifies that the temperature dependence of the measured PL peak energy is well described via the conventional Varshni parametrisation [25, 26]. We note the presence of a weak 's-shape' temperature dependence of the measured PL peak energy for
  K, which may be indicative of carrier localisation [44]. Weak carrier localisation—the estimated localisation energy, based on comparison of the measured and parametrised Varshni temperature dependence of the PL peak energy, is only 4 meV—of this nature would be compatible with, e.g. the observed minor, short-range fluctuations in the QW Sb composition and thickness observed via TEM imaging (see figure 1(c)), and is not sufficiently pronounced to be expected to impact device performance.
To identify and quantify the origin of the measured increase in room temperature PL intensity with increasing  we have analysed the distinct contributions—the band gap (emission wavelength), inter-band optical matrix elements, and electron and hole quasi-Fermi levels [43, 45, 46]—to the calculated SE spectra for each structure. For a QW of fixed thickness the SE rate at fixed carrier density n is directly proportional to the photon energy, so that the decrease in band gap with increasing x acts to decrease the peak SE rate. For MQW1 we calculate an inter-band optical transition strength 19.42 eV—where the relevant scale [47] is the Kane parameter EP—for the TE-polarised e1 − hh1 transition at
  , which decreases to 18.37 eV in MQW4. The changes of both the band gap and inter-band optical matrix elements with increasing x then act to reduce the peak SE rate at fixed n, suggesting that the filling of the QW energy bands—described by the quasi-Fermi levels, and determined primarily by the VB edge DOS—is responsible for the calculated increase in the peak SE rate with increasing
  .
.
The calculated room temperature carrier (quasi-Fermi) distributions at n = 1015 cm−3 for MQW1–MQW4 demonstrate a reduction in energy of the hole quasi-Fermi level (relative to the QW VB edge) with increasing Sb composition—i.e. with increasing compressive strain in the QW. This is in line with the expected impact of compressive strain on the VB structure: compressive strain in the QW leads to a reduction of the VB edge hole effective mass in the plane perpendicular to the growth direction, corresponding to a reduction in the DOS close in energy to the VB edge [37, 41, 42, 48]. Since the effective masses of VB holes are generally significantly larger than the effective masses of CB electrons, at fixed temperature and carrier density VB holes tend to occupy states over a smaller range of energy E and a larger range of in-plane wave vector  than those occupied by CB electrons. The k-selection associated with optical transitions—assumed strict in our theoretical calculations, although likely slightly relaxed in the structures considered here due to the presence of short-range alloy disorder—then renders holes occupying states at larger
  unavailable to undergo radiative recombination, due to a lack of electrons occupying states at equal
  [42, 49]. It is well established that this reduction of the VB edge DOS brought about by compressive strain enhances both SE and optical gain, by more closely matching the VB dispersion to that of the CB, leading to increased quasi-Fermi level separation at fixed carrier density [42, 48]. As such, with increasing Sb composition we calculate that holes occupy states over a larger range of E and smaller range of
  than in equivalent unstrained structures, better matching the dispersion at the VB edge to that at the CB edge, thus making more electron-hole pairs available to undergo optical recombination and hence increasing the peak SE rate at fixed n. This behaviour is less pronounced at low temperature, where the quasi-Fermi distributions are step-like about the quasi-Fermi levels. As a result, the calculated peak SE rate at T = 4 K depends only weakly on x (see figure 3(c)). Conversely, at T = 300 K the hole quasi-Fermi distribution possesses a pronounced tail at energies below the hole quasi-Fermi level, describing that, on average, holes occupy states over larger ranges of E and
  than at low temperatures. As such, the impact of the strain-induced reduction in the VB edge DOS with increasing x becomes pronounced, leading to the calculated 38% increase in the peak SE rate between structures MQW1 and MQW4 at T = 300 K (see figure 3(d)).
To obtain a quantitative measure of the impact of Sb incorporation on the SE rate we have computed the radiative recombination coefficient B at T = 300 K for each structure by (i) calculating the radiative current density  via integration of the calculated SE spectrum of figure 3(d), and (ii) assuming
  (i.e. the Boltzmann approximation). Given the expected [50] weak dependence of B on n up to
  cm−3 (a carrier density typical of electrical pumping of the structures investigated here from the perspective of LED operation, assuming a carrier lifetime ∼1 ns and a drive current of 0.1 A injected into an area ∼
 m2), we anticipate that the values of B computed here at a low carrier density—n = 1015 cm−3, corresponding to optical excitation—describe trends which should remain largely valid for practical LED devices [31]. We calculate B = 5.88 and
  cm3 s−1 for MQW1 and MQW4 respectively, describing the predicted increase of approximately 38% in the radiative emission rate between x = 0% and 10%. More detailed theoretical analysis [31, 40] suggests that the radiative emission rate can be further enhanced in metamorphic InAs1−xSbx/Aly In1−y As QWs emitting at 3.3
  m, via the design and optimisation of strain-balanced structures incorporating tensile strained Aly In1−y As barriers.
While the theoretical calculations above—which consider only radiative recombination of carriers—describe accurately the dependence of the measured peak PL energy on temperature, they do not quantitatively account for the observed decrease in the measured peak PL intensity with increasing temperature. For an ideal QW the radiative recombination coefficient B varies inversely with temperature, so that an approximately 75-fold decrease in integrated emission intensity would be expected as the temperature is increased from 4 to 300 K. However, for the structures of table 1 the measured peak PL intensity at T = 300 K is reduced by a factor of approximately 300 compared to that measured at T = 4 K. Analysis of the measured temperature-dependent PL data—in the form of an Arrhenius plot for each structure (not shown)—suggests the presence of a single temperature dependent loss mechanism having activation energy  meV at x = 0 (MQW1), which increases to
  meV at x = 10% (MQW4). While the value of Ea extracted for MQW4 is close to the calculated ionisation energy of 64 meV for an e1 electron in that structure, we note that the value for MQW1 is approximately one half of the 110 meV e1 electron ionisation energy calculated for MQW1. Were thermal leakage of electrons from the QWs the mechanism responsible for the observed temperature-dependent losses, it would be expected that the activation energy would decrease with increasing Sb composition due to the accompanying decrease in CB offset (see figure 2(b)). We therefore conclude that non-radiative carrier recombination mechanisms—most likely Auger recombination, given the relevant wavelength range—play an important role in determining the properties and performance of these structures.
We note that the extracted activation energy for MQW4 is  25% larger than that associated with MQW1, suggesting that Sb incorporation acts to reduce the importance of the observed temperature dependent loss mechanism, again emphasising the observed enhancement in optical properties with increasing Sb composition. While detailed investigation of non-radiative recombination in these structures is beyond the scope of the current work, we note on the basis of detailed analysis of the calculated electronic properties [31] (i) that both the hot electron- and hole-producing CHCC and CHSH Auger recombination mechanisms are likely to play a role in limiting the overall radiative efficiency, and (ii) while it may be possible to engineer the QW VB structure to reduce the CHSH recombination rate [38], the mixing of LH- and SO-like eigenstates brought about by strain and quantum confinement effects likely render the CHSH process thresholdless [31].
While the theoretical aspects of our analysis have focused on the properties of metamorphic InAs1−xSbx/Aly In1−y As QWs from the perspective of applications in LEDs, we note that the properties underpinning the calculated increase in B with increasing  can also be expected to lead to favourable gain characteristics in diode lasers. Specifically, the presence of compressive strain in the QW will, in the usual way [42, 48], act to improve performance by leading to a reduction (increase) in carrier density (differential gain) at threshold. Combined with the presence of large type-I band offsets this will generate favourable gain characteristics in the 3–4
  m wavelength range, which we expect to be at least as good as those we have recently quantified for InP-based dilute bismide InxGa1−xAs1−y Biy QWs [30] (due to the absence here of the band anti-crossing interaction associated with bismuth incorporation, which acts to reduce optical gain at fixed injection [28]). However, since electrically pumped lasing requires significantly higher carrier densities than those associated with typical LED drive currents, issues related to Auger recombination will play a more pronounced role. As such, while the expected gain characteristics of this class of metamorphic QWs suggest strong potential to develop diode lasers in the challenging 3–4
  m wavelength range, further work is required to identify and quantify the potential loss mechanisms in these structures, as a precursor to the development of optimised structures for practical applications.
5. Conclusions
In summary, we have presented a combined experimental and theoretical analysis of the properties of metamorphic InAs1−xSbx/Al0.125In0.875As QWs grown on GaAs substrates by MBE. Characterisation of a series of prototypical multi-QW structures via XRD and TEM demonstrated high material and structural quality. Using theoretical calculations we have quantified the potential offered by this new class of metamorphic heterostructures, highlighting that the ability to engineer compressively strained QWs possessing deep type-I band offsets makes these structures particularly attractive for applications in mid-infrared light-emitters. Experimental measurements for QWs having Sb compositions up to x = 10% revealed (i) strong PL up to a wavelength of 3.4  m at room temperature, beyond the maximum emission wavelengths demonstrated using related metamorphic structures grown on InP, and (ii) an increase in the measured peak PL intensity with increasing emission wavelength. Via detailed theoretical analysis of the SE from these structures we identified that this favourable behaviour is associated with the impact of compressive strain on the QW electronic properties, which can be expected in general to enhance radiative efficiency.
Overall, we conclude that InAs1−xSbx/Aly In1−y As metamorphic QWs grown on GaAs substrates offer a promising route to realising LEDs or diode lasers displaying good performance in the application-rich but technologically challenging 3–4  m spectral range, with particular promise for sensing applications at wavelengths close to 3.3
  m. Further studies are now required both to quantify the loss mechanisms present in these structures, and to design optimised structures [31, 40] for practical applications.
Acknowledgments
This work was supported by the European Commission via the Marie Skłodowska–Curie Innovative Training Network PROMIS (project no. 641899), Science Foundation Ireland (SFI; project no. 15/IA/3082), the Engineering and Physical Sciences Research Council, UK (EPSRC; project no. EP/N018605/1), the National University of Ireland (NUI; via the Post-Doctoral Fellowship in the Sciences, held by CAB), the Royal Academy of Engineering (RAE; via Research Fellowship no. 10216/114, held by PJC), the Spanish Ministry of Economy and Competitiveness (MINECO; project no. TEC2017-86102-C2-2-R), and the Andalusian Research Council (PAI; research group TEP-946 INNANOMAT). UCA authors acknowledge co-financing from the European Union via the European Structural Funds. The authors thank Dr James A Keen (Lancaster University, UK) for useful discussions.
Data access statement
The data associated with this work are openly accessible via the Lancaster University research and data repository (PURE), at https://doi.org/10.17635/lancaster/researchdata/309.