


It is necessary to create healthy eating habits in pre-school children, as this is a period of intensive physical, psychological and social development. Appropriate nutritional behaviour ensures consumption of a proper diet, which is a condition for the development of a healthy child and a preventive measure against numerous diseases in adult life. Research results suggest that the diets of pre-school children in Poland do not comply with nutrition guidelines( Reference Jarosz 1 ). Many children’s diets are high in sugar, fat and refined carbohydrates, and they may be a contributing factor in many chronic diseases, for example obesity( Reference Harton, Florczak and Myszkowska-Ryciak 2 – Reference Frary, Johnson and Wang 4 ). During nationwide research, based on the analysis of 7d dietary records, it was found that 4-year-old children had insufficient dietary intakes of Ca (51 % of children) and vitamin D (99 % of children), which could have resulted from inadequate consumption of dairy products( Reference Charzewska and Weker 5 ). Polish children do not eat enough fruits and vegetables as 90 % of all children did not meet the daily vegetable intake recommendations. However, children under the age of 3 years, compared with older ones, consumed more vegetables. Fruits were eaten more often: 33 % of children ate fruits two or three times daily( Reference Harton, Florczak and Myszkowska-Ryciak 2 ). Inadequate intakes of vegetables and fruits by pre-school in Polish children were also indicated by Gacek( Reference Gacek 3 ).
Some studies state that low intakes of fruits and vegetables, and the consequent insufficient ingestion of antioxidant vitamins, produce an increased risk of non-communicable diseases like obesity, hypertension and type 2 diabetes( Reference Salvin and LIoyd 6 ). Therefore, it is desirable to identify factors that may have some influence on children’s food choices to apply countermeasures as early as possible. While the most prominent determinants of children’s food choices are gender, age and family socio-economic status, food neophobia is indicated as an important factor creating food preferences in children and thus directly influencing their food choices( Reference Rasmussen, Krølner and Klepp 7 – Reference Fletcher, Wright and Jones 9 ). Food neophobia is defined as a tendency to reject novel or unknown foods, also classified as one of the behavioural feeding disorders( Reference Pliner 10 – Reference Bryant-Waugh, Markham and Kreipe 12 ). Neophobia is not a permanent dislike for new foods; acceptance can be created through repeated exposure to or modelling the consumption of the rejected food( Reference Mennella, Jagnow and Beauchamp 13 ). Food neophobia has both genetic and environmental origins because it occurs in connection not only with such factors as personality (particularly apprehensive and shy) but also with parents’ eating habits, since the attitude may be learned( Reference Dovey, Staples and Gibson 11 , Reference Fisher, Mitchell and Smiciklas-Wright 14 – Reference Lafraire, Rioux and Giboreau 16 ). Neophobia is minimal at infancy and peaks at some time between the age of 2 and 6 years( Reference Pliner 10 , Reference Galloway, Fiorito and Francis 15 ). Children with food neophobia consume fewer vegetables and fruits than non-neophobic children, but they do not eat fewer starchy and sweet products( Reference Guzek, Głąbska and Lange 17 – Reference Galloway, Lee and Birch 20 ). Thus, food neophobia puts children at risk of obesity and development of lifelong unhealthy eating habits. In Poland, the issue concerning food neophobia in pre-school children has not been studied.
The objective of the current paper is to present the prevalence of food neophobia in pre-school children from southern Poland for the first time and to examine how it is associated with children’s diet and anthropometric parameters.
Methods
Study design
The research is a descriptive cross-sectional study including kindergarten children from southern Poland. Kindergartens were randomly selected from the list placed on a website (http://www.przedszkola.malopolska.pl). Eventually, the study involved ten kindergartens with a total of 760 children aged 2·5–7 years. In Poland, pre-school education is intended for children aged 3 to 7 years but in particularly justified cases, it may also include a child aged 2·5 years. The Term of Consent was obtained from parents of 365 children and these children were selected for the study. The exclusion criterion was a surveyed parent’s declaration that their child had diabetes, coeliac disease or other diseases requiring a special diet, which could be a distraction factor as in such situations some food products are eliminated and the results would not be objective. After applying the exclusion criterion and removing incomplete questionnaires, finally 325 children were involved in the examinations. The study was approved by the Ethics and Research Committee of the Jagiellonian University Medical College (register number KBET/27/B).
Measures
Eating habits and dietary intake
The research comprised three stages. Initially performed stages 1 and 2 included parents’ surveys and the data assessment, and then, within 3 weeks after receiving parents’ consent, stage 3 was realised which involved anthropometric measurements. At stage 1, parents filled in a questionnaire eliciting information about their child’s eating habits (number of meals per day, consumption of snacks, supplement use, watching television during eating, etc.), the Child Food Neophobia Scale (CFNS), as well as sociodemographic details of the studied families (such as parents’ education level, family income, number of people in the household and number of children in the family). An FFQ was used to assess eating habits. The FFQ contained a list of products and their frequency of consumption, and was similar to a validated Polish questionnaire prepared by the Section of Behavioural Conditions of Nutrition of the Committee of Human Nutrition Sciences at the Polish Academy of Sciences( Reference Sochacka-Tatara and Pac 21 ). The products commonly consumed by children were chosen from the list mentioned above; thus the term ‘chosen product’ is used in the following analyses. Frequency of consumption was assessed in relation to a day, week or month. The survey did not include open-ended questions. A six-grade scale was applied to assess the consumption frequency of chosen foods and beverages (‘never’, ‘1–2 times a month’, ‘1–2 times a week’, ‘3–4 times a week’, ‘once a day’, ‘more than once a day’). Eventually, for coding purposes, the responses were assigned integer values using selected scales (e.g. a two-point scale: 1=no, 2=yes). At stage 2, a quantitative assessment was performed of nutrient intake of the preceding 3d (two weekdays and one weekend days) using data obtained from the dietary records provided by the parents, including time in day care. Parents were asked to fill in the dietary diary based on the kindergarten’s menu and information about portion eaten from the children’s supervisors. Incomplete records were not analysed. The Dieta 2 software was used to calculate the nutrients and energy consumed by the children.
Food neophobia
The CFNS adapted by Wardle, Carnell and Cooke measures willingness to eat novel foods and is viewed as reliable and valid( Reference Pliner and Hobden 22 – Reference Cooke, Wardle and Gibson 25 ). The scale consists of six statements: ‘My child does not trust new food’, ‘If my child does not know what is in their food, they will not try it’, ‘My child is afraid to eat things they have never had before’, ‘My child is very particular about the foods they will eat’, ‘My child will eat almost everything’ and ‘My child is constantly sampling new and different foods’ (reverse scored). The responses are on the 4-point bipolar Likert scale from ‘strongly agree’ (=4) to ‘strongly disagree’ (=1), with overall scores ranging from 6 to 24 and with a higher score indicating a higher level of food neophobia. The cut-off points were determined based on the study of Falciglia et al., where neophobia was defined as CFNS score greater than 1 sd above the mean of the study( Reference Falciglia, Couch and Gribble 26 ). For comparative purposes three groups were defined. The group displaying a low (L) level of neophobia included children who obtained a score between 6 and 9 points, the group showing a medium (M) level of neophobia comprised children who obtained a score of 10 to 18 points, while children who obtained 19 points or more qualified as showing a high (H) level of neophobia (i.e. neophobic group).
Anthropometric measurements
At stage 3, anthropometric measurements (height, body mass and percentage of fat tissue determined by biological impedance testing) of 325 children whose parents agreed to participate in the study were taken by trained researchers from the scientific team. The children’s height was measured with an anthropometer, and their weight was taken with a portable TANITA digital scale. Based on the obtained results of measured height and weight, each child had his/her BMI computed according to the Polish growth chart norms( Reference Palczewska and Niedźwiedzka 27 ). Children with a BMI exceeding the 97th percentile were classified as obese and those with a BMI between the 90th and 97th percentiles were classified as overweight.
Statistical analysis
The data collected were statistically analysed with the use of the Statistica 10 statistical software package. The applied descriptive statistical measurements included mean, sd, frequency and percentage values. Normality of the quantitative distribution of qualitative variables was verified with the Shapiro–Wilk test. The variables that met the normality criterion were tested with the Student t test. The adopted significance level was α=0·05. To check for differences, the non-parametric Wilcoxon test was used, with significance level at P<0·05. The Pearson rank-correlation coefficient (r Pr) was used to compare the level of food neophobia and frequency of consumption of chosen food products and nutrient intakes. The energy and nutrient intakes of the children were compared with the Polish norms( Reference Jarosz 1 ).
Results
Sample characteristics
After exclusion of incomplete surveys and incomplete anthropometric measurements, the study population finally amounted to 325 children comprising 51·4 % (n 167) boys and 48·6 % (n 158) girls. The mean age of the children was 5·23 (sd 1·30) years. The studied families represented a standard Polish family of four members including two children. Higher academic education was most often declared by the mothers, while the fathers usually had secondary education (Table 1). The parents defined the financial status of their family on average as good. The age of the mothers when giving birth to the subjects was most often around 26–30 years. The children spent an average of 7 h daily in kindergarten. Among the studied children, 90·2 % ate their kindergarten meals in groups, and their parents most often declared they were quite familiar with the menu. In the study population, the food neophobia groups did not differ according to the demographic and family variables stated above.
Table 1 Characteristics of the studied group of pre-school children aged 2·5–7 years and their parents (n 325) from ten kindergartens located in or near Cracow, southern Poland, 2012–2013
P value for difference between food neophobia groups (Wilcoxon’s test); significant results (P<0·05) shown in bold.
* Parents’ own perception of their financial status.
Prevalence of food neophobia
Almost every eleventh child in the present population displayed a high level of food neophobia (10·8 %). Medium level of neophobia was found in 76·9 % of the children. Low level of neophobia was observed in 12·3 %, and that group was defined as neophilic. No statistically significant differences were observed between boys and girls regarding the number of points obtained on the CFNS scale (Fig. 1). However, when looking at the trends, it was seen that a larger proportion of boys than girls obtained 6–9 points (low level of neophobia), and none of the boys obtained the highest number of points (Fig. 1). The distribution of food neophobia levels was close to normal in both boys and girls.
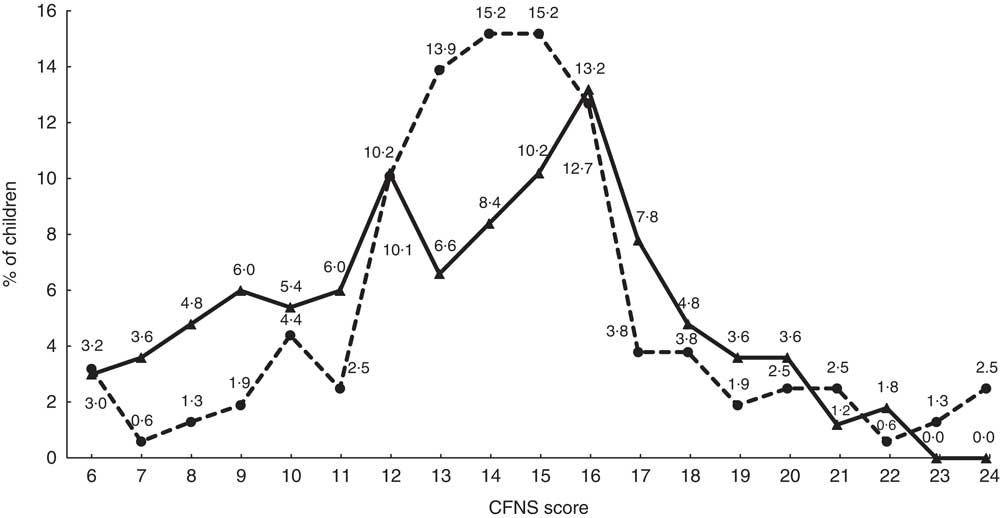
Fig. 1 Distribution of scores on the Child Food Neophobia Scale (CFNS), by gender (![]() , boys;
, boys; ![]() , girls), among pre-school children aged 2·5–7 years (n 325) from ten kindergartens located in or near Cracow, southern Poland, 2012–2013. Low, medium and high level of neophobia is defined as CFNS score of 6–9, 10–18 and ≥19 points, respectively
, girls), among pre-school children aged 2·5–7 years (n 325) from ten kindergartens located in or near Cracow, southern Poland, 2012–2013. Low, medium and high level of neophobia is defined as CFNS score of 6–9, 10–18 and ≥19 points, respectively
Eating habits and dietary intake
Some statistically significant differences were observed among the study children in the case of eating habits by level of food neophobia (L, M, H). Neophobic children ate fewer meals during the day (P L-H=0·008) but often had snacks between meals (P L-H=0·005) and used supplements (P L-H=0·022). The higher the level of neophobia, the more frequently parents declared administration of dietary supplements. In the group of neophobic children, more than half took vitamin–mineral supplements and the percentage lowered with decreasing neophobia level.
No statistically significant differences were observed by level of neophobia in terms of regularity of meals, watching television during meals or eating fast foods (Table 2). A greater proportion of neophobic children ate chocolate sweets (P L-H=0·027) and salty snacks (P L-H=0·027) and fewer fruits (P L-H=0·005) between meals (Table 3).
Table 2 Chosen eating habits, by level of food neophobia, among pre-school children aged 2·5–7 years (n 325) from ten kindergartens located in or near Cracow, southern Poland, 2012–2013
P value for difference between food neophobia groups, (Wilcoxon’s test); significant results (P<0·05) shown in bold.
Table 3 Products chosen to eat between meals, by level of food neophobia, among pre-school children aged 2·5–7 years (n 325) from ten kindergartens located in or near Cracow, southern Poland, 2012–2013
P value for difference between food neophobia groups (Wilcoxon’s test); significant results (P<0·05) shown in bold.
The children differed in how often they ate some product groups according to their level of food neophobia (Table 4). One of these differences concerned the mean frequency of eating eggs, which was different in the children with low level of neophobia and the neophobic ones (P L-H=0·030). In every group, children did not consume eggs more than once or twice per week; yet, as many as 20 % of the neophobic children did not eat eggs at all, while in the remaining groups that was 6·5 % and 5·1 %, respectively.
Table 4 Frequency of consumption of chosen food products, by level of food neophobia, among pre-school children aged 2·5–7 years (n 325) from ten kindergartens located in or near Cracow, southern Poland, 2012–2013
P value for difference between food neophobia groups (Wilcoxon’s test); significant results (P<0·05) shown in bold.
Scale of food intake frequency: 1=never; 2=1–2 times a month; 3=1–2 times a week; 4=3–4 times a week; 5=once a day; 6=more than once a day.
Significant differences were observed in the frequencies of eating raw and cooked vegetables among the groups of children with different levels of neophobia. Children with low level of neophobia ate raw vegetables (P L-H=0·008) and cooked vegetables (P L-H=0·035) three to four times weekly on average, while neophobic children ate vegetables in all forms once or twice per week on average. Nearly 40 % of the neophobic children did not eat raw vegetables at all. As the level of neophobia grew, the frequency of eating raw vegetables (r Pr=−0·24, P<0·001) and cooked vegetables (r Pr=−0·16, P=0·005) decreased. According to the parents’ declarations, 78 % of children with high level of neophobia did not like eating vegetables. No statistically significant differences were observed in terms of eating fruits. Children ate fruits at an average frequency of once daily.
Moreover, it was observed that the higher level of neophobia corresponded to a higher frequency of eating sweets. It was noticed that an increase in the neophobia level was accompanied by an increase in sweets intake frequency (P L-H=0·0802). In the group of neophilic children, no child ate sweets more than once daily; while in the groups with medium and high levels of neophobia, 15·5 and 22·9 % of the children, respectively, ate sweets more than once daily.
Neophobic children ate legumes significantly less often (P L-H=0·001) compared with their peers with low or medium level of neophobia. In the group of children with high neophobia level, 60 % did not eat legumes at all. No significant differences were observed in the frequency of eating such product groups as groats, pasta, rice, white and brown bread, milk and milk products, fish and fish products, poultry, red meat, vegetable oils, butter, raw fruits, fruit juices and unsalted nuts. There was also no difference in the amounts of beverages consumed.
Quantitative assessment of diet
The percentage of achievement of the standards (RDA) for energy and selected nutrients can be found in Fig. 2. In the group of neophobic children, the consumption of energy was the highest, and they had also significantly higher intake of carbohydrate (P L-H=0·046) and lower intake of vitamin C (P L-H=0·034). In the overall population of children, regardless of the level of food neophobia, very low intakes of Ca, Fe and vitamin D were observed.
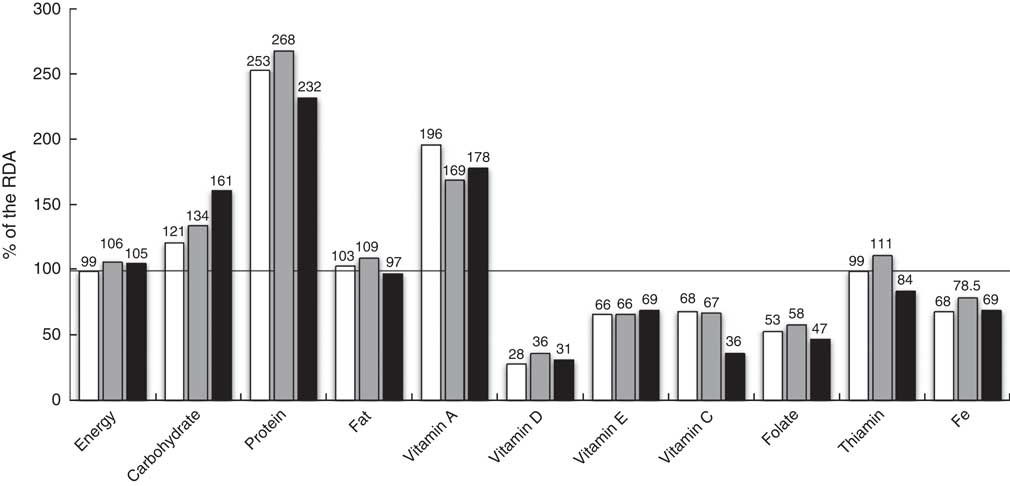
Fig. 2 Percentage achievement of the RDA for energy and selected nutrients(
Reference Jarosz
1
), by level of food neophobia (![]() , low;
, low; ![]() , medium;
, medium; ![]() , high), among pre-school children aged 2·5–7 years (n 325) from ten kindergartens located in or near Cracow, southern Poland, 2012–2013
, high), among pre-school children aged 2·5–7 years (n 325) from ten kindergartens located in or near Cracow, southern Poland, 2012–2013
In the neophobic group, the percentage achievement of the intake norm for thiamin was significantly lower: 84·0 (sd 15·5) % of the RDA (P L-H=0·034). A deficiency was also noted in their intake of folate: 47·5 (sd 20·2) % of the RDA (Fig. 2). A negative correlation was observed between the level of neophobia and vitamin C consumption, with the correlation value at r Pr=−0·35, P=0·041. This interdependence was further confirmed in a regression analysis (P<0·001, β=−0·34). The value of the regression coefficient was −3·08, which means that a 1-point increase in CFNS score results in a 3 % decrease in achieving the recommended vitamin C intake.
Anthropometric parameters of children
The distribution of BMI varied depending on the level of food neophobia. The highest percentage of obesity was found in the low neophobia group, 17·5 % compared with 6·4 and 5·6 % in the medium and high neophobia groups, respectively. Of the neophobic children, a larger proportion belonged to the underweight group than to the overweight or obese group, but the differences were not statistically significant (Fig. 3).
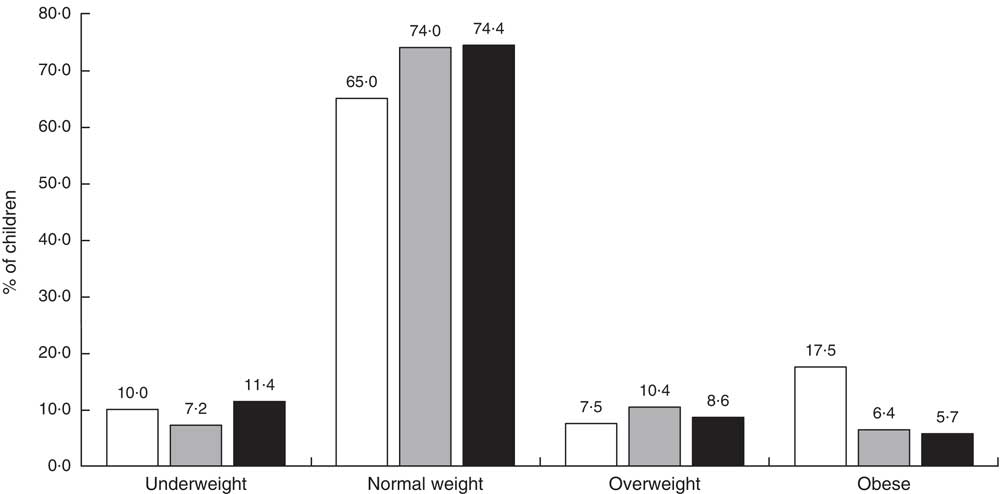
Fig. 3 Distribution of BMI, by level of food neophobia (![]() , low;
, low; ![]() , medium;
, medium; ![]() , high), among pre-school children aged 2·5–7 years (n 325) from ten kindergartens located in or near Cracow, southern Poland, 2012–2013
, high), among pre-school children aged 2·5–7 years (n 325) from ten kindergartens located in or near Cracow, southern Poland, 2012–2013
Discussion
Rejection of novel foods is likely to decrease diet variety and it might be expected that there will be nutritional consequences of food neophobia. Therefore, the objective of the current paper was to present the prevalence of food neophobia in pre-school children and its association with the children’s diet and anthropometric parameters. The results indicate that almost every eleventh child (10·8 %) was neophobic, and food neophobia may influence dietary habits causing lower consumption of vegetables (including legumes) and eggs. On the other hand, higher intakes of total energy and carbohydrate were observed in neophobic children’s diets, which may be a consequence of the more frequent consumption of sweet or salty snacks (between meals) identified in this group. However, no correlation between the level of neophobia and children’s anthropometric parameters was noticed. Lower consumption of vegetables in the group of children with high level of neophobia, accompanied by low consumption of fruits, resulted in deficiency in realisation of the norm for vitamin C. Insufficient intakes of other nutrients such as vitamin D, Ca and Fe were also registered. On the other hand, more than half of the study children with high level of neophobia were administered vitamin and mineral supplements by their parents, which may be indicative of the fact that parents do take the risk of dietary deficiencies into consideration. In a nationwide population study, only 14·4 % of all children and adolescents took dietary supplements( Reference Markiel and Chalcarz 28 ).
Data on age and gender differences as well as eating habits in food neophobia are difficult to describe in a simple way. Various studies have used different age ranges, different methods of testing eating habits and different measures of food neophobia; nevertheless, some of the results can be compared.
When the relationship between age and food neophobia level is examined, it appears that neophobia declines with age. Pre-school children accept fewer novel foods than junior-school students who, similarly, accept fewer novel foods than their older peers( Reference Addessi, Galloway and Visalberghi 29 – Reference Rubio, Rigal and Boireau-Ducept 33 ). A decrease in neophobia level with age may be explained by the fact that fewer products are a novelty to teenagers or adults than to children( Reference Galloway, Fiorito and Francis 15 ). There is an exception to this rule because food neophobia prevalence is minimal in the infancy period until the age of 2 years( Reference Carruth, Ziegler and Gordon 34 ). Neophobic behaviour increases as a child becomes mobile, and peaks between 2 and 6 years of age, which was also observed in the present study( Reference Pliner 10 , Reference Galloway, Fiorito and Francis 15 , Reference Addessi, Galloway and Visalberghi 29 ).
Although some gender differences in neophobia levels can be expected due to various taste preferences in males and females, the majority of studies did not find such gender-dependent differences( Reference Russell and Worsley 8 , Reference Mennella, Jagnow and Beauchamp 13 , Reference Guzek, Głąbska and Lange 17 , Reference Pliner and Hobden 22 ). Only in two Scandinavian studies conducted on representative populations of adolescents and adults was it observed that men had a moderately higher level of neophobia than women( Reference Hursti and Sjödén 35 , Reference Tuorila, Lähteenmäki and Pohjalainen 36 ). In the present study, no statistically significant differences were observed between boys and girls in the level of food neophobia. The impact of other socio-economic factors on the level of neophobia was not found in the present study, either. A few studies have examined the relationship between food neophobia and socio-economic factors. It was observed that level of education of adult responders and mothers of children was negatively correlated with the level of neophobia( Reference Cooke, Carnell and Wardle 18 , Reference Tuorila, Lähteenmäki and Pohjalainen 36 ). People from an urban environment had a lower level of neophobia than their rural counterparts( Reference Flight, Leppard and Cox 37 , Reference Jacobi, Agras and Bryson 38 ).
The data presented here allow us to conclude that neophobia may influence the variety of the diet, as children with high level of neophobia tended to eat important foods like vegetables less often than their peers. Nearly 40 % of the neophobic children did not eat raw vegetables at all. Many previous studies indicate that food neophobia is associated with reduced consumption of fruits and vegetables and the quality and variety of pre-school children’s diets( Reference Cooke, Wardle and Gibson 19 , Reference Tuorila, Lähteenmäki and Pohjalainen 36 , Reference Halland, Bere and Bjørnarå 39 ). In previous research by Galloway et al., a negative correlation was shown between consumption of fruits and the level of neophobia in 7-year-old girls( Reference Galloway, Lee and Birch 20 ). The only Polish study concerning food neophobia in a group of children aged 10–12 years presented a negative correlation between food neophobia level and vegetable intake for both girls and boys, whereas for girls differences in vegetables intake were observed also between various food neophobia categories( Reference Guzek, Głąbska and Lange 17 ). The recommendations concerning fruit and vegetable consumption are not followed by the majority of children in Poland. This situation may be caused by generally poor nutrition awareness about the role these foods play in a healthy diet as well as by economic factors( Reference Harton, Florczak and Myszkowska-Ryciak 2 , Reference Gacek 3 , Reference Guzek, Głąbska and Lange 17 ).
Food neophobia has also been associated with reduced intakes of main nutrients, causing nutritional consequences( Reference Russell and Worsley 8 , Reference Galloway, Fiorito and Francis 15 , Reference Cooke, Carnell and Wardle 18 ). Falciglia et al. compared three groups of children (neophobic, neophilic and average) and found that those in the first group were less likely to meet recommended values for vitamin E than others. In addition, an overall healthy eating index score was significantly lower for the neophobic group, who also had higher intake of saturated fat and less food variety than children in the other two groups( Reference Falciglia, Couch and Gribble 26 ). Some previous studies have shown that neophobic children had reduced intake of protein food products like meat, eggs and fish( Reference Galloway, Fiorito and Francis 15 , Reference Cooke, Wardle and Gibson 19 , Reference Halland, Bere and Bjørnarå 39 ). Although in the present study 20 % of the neophobic children did not eat eggs, they also did not have insufficient intake of protein probably because they often ate dairy products between meals. On the other hand, children in the study group had insufficient intakes of micronutrients such as Ca and Fe.
No differences were observed in the anthropometric status of pre-school children according to the level of identified food neophobia. The reason may be too low number of children with neophobia in the study. The anthropometric parameters of the studied group are relevant to the general population of children this age in Poland( Reference Kułaga, Gurzkowska and Grajda 40 ). However, there are examples in the literature presenting studies that assessed the influence of feeding disorders (mainly picky/fussy eater attitude) on children’s nutritional status. The research suggests that children aged 9–12 years who display the aforementioned types of eating disorders have BMI levels significantly lower than children who do not reveal such disorders( Reference Weber, Hill and Saxton 41 ). In Galloway et al.’s study, 9-year-old picky eater girls had lower BMI and were less likely to be overweight( Reference Galloway, Lee and Birch 20 ). It would be hard, however, to use these results to describe neophobic children. Neophobia is one of the feeding disorders, hence neophobic children will constitute only a fraction of the group of children with feeding disorders.
The results of the present study as well as others confirm that food neophobia is associated with low diet variety and low consumption of vegetables perceived beneficial for children’s health, particularly if consumed adequately( Reference Cooke, Wardle and Gibson 19 , Reference Galloway, Lee and Birch 20 , Reference Wardle, Carnell and Cooke 23 , Reference Cooke, Wardle and Gibson 25 ). A WHO report indicated that consumption of the prescribed amount of vegetables and fruits (at least 400 g/d) reduces the risk of non-communicable diseases, including CHD, stroke and some types of cancer( 42 ). Consumption of vegetables in every meal is a positive behaviour that may contribute to healthier dietary patterns in children and help them maintain a healthy weight, which is important for public health strategy in the face of the childhood obesity epidemic in Europe. In this context, food neophobia should be taken under consideration in nutritional education programmes directed to children and their parents as one of the modifiable factors of children’s preferences.
Despite the fact that the tools used in the present study (FFQ and nutrition diary) are the most commonly applied methods in dietary research, the authors are aware that the study is not bias-free. The first error is associated with the fact that the FFQ that was used is retrospective (i.e. based on the memory of respondents). Reducing the number of products occurring in the FFQ to those commonly used in the Polish diet allowed us to limit the error. A nutrition diary was applied to verify information from the questionnaire. This is also a well-known method to reduce a social desirability bias( Reference Gibson 43 ). Another source of systematic error may be the fact that the study concerns children attending kindergartens, so the parents do not have full knowledge about the portions which were eaten in day care. For that reason, the parents were asked to get to know as much as they could about the menu and portions consumed. They were also asked to keep a dietary record from the remaining part of the day and from one weekend day, and the average intake was calculated. On the other hand, in Poland on average 77 % of children (in cities 98 %) attend kindergartens and eat there, so the examined children are a representative group for children of pre-school age( 44 ). The applied methodology is commonly used in this age group by other researchers and so gives an opportunity to make a comparison. Another limitation is the fact that food neophobia is not the only factor influencing variety of children’s diets, especially at pre-school age when picky eating takes place, as it can coexist with picky eating or independently, causing the same effect (i.e. lack of a diverse diet)( Reference Lafraire, Rioux and Giboreau 16 ). The authors are aware that such an approach cannot eliminate bias completely.
The tendencies that seem to materialise in the small sample of children in the present paper may, but do not necessarily have to be true for the whole population. Nevertheless, as the problems of insufficient nutrient intakes and feeding disorders do exist in Polish children, such research projects are warranted, especially in the light of the fact that food neophobia has a potentially detrimental effect on food choices, limiting the variety of eaten foods or leading to insufficient intakes of nutrients for a given age. However, drawing more general conclusions requires conducting further studies.
Conclusions
Taking account of the present results, it can be concluded that high level of neophobia occurred in almost 11 % of pre-school children, most often in 5- and 6-year-olds. The level of food neophobia in children was not correlated with their socio-economic status. Neophobic children’s diets were poorer in vegetables compared with children with low levels of neophobia, which resulted in deficiency in realisation of the norm for vitamin C. There was no association between children’s anthropometric parameters and their high or low level of neophobia. It is essential to conduct parents’ education to achieve a reduction in the level of food neophobia in their children and it would be advisable to perform further studies on the subject.
Acknowledgements
Acknowledgements: The authors would like to thank Mr Paweł Jagielski for his help with statistical analysis. Financial support: This research received no specific grant from any funding agency in the public, commercial or not-for-profit sectors. Conflict of interest: The authors declare no conflicts of interest regarding the submission of this paper. Authorship: A.K.-K., conception of the study design, carrying out the study, analysing the data, writing the article and revision; B.P., carrying out the study, writing the article and revision; M.S.-Z., conception of the study design, drafting the article and revision. Ethics of human subject participation: This study was conducted according to the guidelines laid down in the Declaration of Helsinki and all procedures involving human subjects were approved by the Ethics and Research Committee of the Jagiellonian University Medical College (register number KBET/27/B). Parents of all participating children provided a Term of Consent.


