Article

Using Virtual Learning Environment Data for the Development of Institutional Educational Policies

by
Emanuel Marques Queiroga
1,*,
Carolina Rodríguez Enríquez
2,
Cristian Cechinel
3,
Alén Perez Casas
4,
Virgínia Rodés Paragarino
5,
Luciana Regina Bencke
6 and
Vinicius Faria Culmant Ramos
3
1
Instituto Federal do Rio Grande do Sul, IFSul, Pelotas 96015560, Brazil
2
Facultad de Enfermería, Universidad de la República, Udelar, Montevideo 11600, Uruguay
3
Centro de Ciências, Tecnologias e Saúde (CTS), Universidade Federal de Santa Catarina, UFSC, Araranguá 88906072, Brazil
4
Facultad de Información y Comunicación, Universidad de la Republica, Udelar, Montevideo 11200, Uruguay
5
Comisión Sectorial de Enseñanza, Universidad de la República, Udelar, Montevideo 11200, Uruguay
6
Instituto de Informática, Universidade Federal do Rio Grande do Sul, UFGRS, Porto Alegre 91501970, Brazil
*
Author to whom correspondence should be addressed.
Appl. Sci. 2021, 11(15), 6811; https://doi.org/10.3390/app11156811
Submission received: 8 June 2021 / Revised: 16 July 2021 / Accepted: 19 July 2021 / Published: 24 July 2021
(This article belongs to the Section Computing and Artificial Intelligence)

Abstract

:

Featured Application

Combining different data sources has high power to predict students at-risk of failure and to identify behavior patterns to develop institutional polices based on evidence.

Abstract

This paper describes the application of Data Science and Educational Data Mining techniques to data from 4529 students, seeking to identify behavior patterns and generate early predictive models at the Universidad de la República del Uruguay. The paper describes the use of data from different sources (a Virtual Learning Environment, survey, and academic system) to generate predictive models and discover the most impactful variables linked to student success. The combination of different data sources demonstrated a high predictive power, achieving prediction rates with outstanding discrimination at the fourth week of a course. The analysis showed that students with more interactions inside the Virtual Learning Environment tended to have more success in their disciplines. The results also revealed some relevant attributes that influenced the students’ success, such as the number of subjects the student was enrolled in, the students’ mother’s education, and the students’ neighborhood. From the results emerged some institutional policies, such as the allocation of computational resources for the Virtual Learning Environment infrastructure and its widespread use, the development of tools for following the trajectory of students, and the detection of students at-risk of failure. The construction of an interdisciplinary exchange bridge between sociology, education, and data science is also a significant contribution to the academic community that may help in constructing university educational policies.

1. Introduction

Universities have been concerned with using the extensive data produced by their educational systems in aiming to improve the overall performance of students [1,2,3,4,5,6]. According to [7], the scope of contemporary higher education is vast, and concerns about the performance of higher education systems are widespread. Among several challenges that have been faced by universities, one can mention low completion rates, which are commonly associated with inefficiencies in higher education, even though they also depend on other factors, such as the student profiles and their paths to completion [5,7,8].
Data mining techniques can be used to overcome some of these challenges. Two specific areas are used to refer to the application of data mining in educational settings: Educational Data Mining (EDM) and Learning Analytics (LA) [9,10]. EDM is an interdisciplinary research field that deals with the development of methods to explore data sourced from the educational context [11,12]. LA seeks to measure, collect, analyze, and report data about students and their contexts to understand and optimize their learning and learning environment [13]. Student and teacher interactions within Virtual Learning Environments (VLEs) provide data that feed the research in these areas, thus, enabling the discovery of new knowledge [14].
Learning Management Systems (LMSs) and student information systems containing socio-demographic and student enrollment data can be considered the technological foundation for higher education institutions [15]. Modern educational systems use VLEs to support classroom activities, even in face-to-face courses. In these environments, it is possible to share materials, perform tasks, and interact with other users with the ultimate goal of generating and acquiring knowledge, both individually and collectively [14,16,17]. Modular Object-Oriented Dynamic Learning Environment (Moodle) is one of the most widely used VLEs worldwide. In Uruguay, there are 413 installation sites [18].
Data mining in higher education is mainly used for techniques, such as classification, clustering, and association rules as well as to predict, group, model, and monitor various learning activities [5,9,19]. Current studies on LA vary in several dimensions, covering, for instance, the techniques employed (data mining, visualization, social network analysis, and statistics), the source of the data (LMSs, surveys, and sensors), the stakeholders involved (students, professors, and administrators), and the educational level to which the systems/experiments are directed [20].
This work aims to unveil educational patterns of student interactions with the VLE in higher education courses that use Moodle as a complementary tool for teaching and learning processes. Hence, a series of data mining experiments are applied to the data from the VLE and also to data from other sources, such as surveys and academic systems. The experiments intend to better understand the VLE’s role in helping students’ education inside the studied courses and to discover educational patterns and knowledge that can further help in planning future actions and policies inside the institution. For the present work, we propose the following research questions (RQ):
  • RQ1: Is the use of VLE associated with student approval?
  • RQ2: Which features from the different datasets (VLE, census, and academic system) are the most important for the early prediction of student performance?
  • RQ3: Which learning patterns can educational data mining help to unveil in the studied courses?
In this work, data mining was used as a tool to unveil educational knowledge and possible existing patterns related to the final status of the students. Even though we report quantitative results about predictive models, our main goal is to uncover these patterns to better understand the role that VLEs and other variables have in students’ performance so that future educational policies can be built based on empirical findings. The process followed here can also be defined as Knowledge Discovery in Databases (KDD).
The context of the study is the University of the Republic (Udelar), the main institution of higher education in Uruguay. The remainder of this work is organized as follows: Section 2 presents related works, and Section 3.2 describes the context of the present study. Section 3 depicts the methodology followed in the paper (data collection, model generation, and evaluation). Section 4 presents the results, and Section 5 discusses the research questions based on the results. Section 6 presents possibilities of institutional polices based on the evidence, and Section 7 indicates our conclusions, limitations, and future research.

2. Related Work

This section presents an overview of the research problem topic. Also in this section, Table 1 presents a summary of the aboarded studies.
Leitner et al. [21] presented a practical tool that can be used to identify the risks and challenges that arise when implementing LA and explained how to approach the same. The authors propose a framework with seven main categories for LA initiatives: Purpose and Gain, Representation and Actions, Data, IT Infrastructure, Development and Operation, Privacy, and Ethics. They remarked that the order of implementation depends on each institution. The Data dimension encompasses the application of the advantages of modern technology and the various data sources available, looking for the right analysis to improve the quality of learning and teaching, as well as to enhance the chances of student success.
In a global context, the prediction of performance and dropout is concentrated at the university level, with about 70% of the research focused on this purpose [22]. This trend is the same in Latin America [23]; however, according to [1], Latin American universities still have considerably lower adoption rates compared to institutions in other regions. Thus, Latin American educational institutions can use LA to combat disparities in teaching quality, performance problems, and high dropout rates.
The potential of using predictive methods in education has already been demonstrated by numerous works in the literature [4,14,24,25,26,27,28,29,30,31,32].
Our work focuses on the data dimension, as it is essential to analyze practical case studies and understand which are the key metrics and the processes they are applying. As there is already another work summarizing the important findings up to 2017 (i.e., [9]), we concentrated our exploratory search on papers after 2017. The systematic review from [9] covered the most relevant studies related to four main dimensions: computer-supported learning analytics, computer-supported predictive analytics, computer-supported behavioral analytics, and computer-supported visualization analytics from 2000 to 2017.
The authors identified twelve relevant EDM/LA techniques that researchers normally combine: classification (26.25%), clustering (21.25%), visual data mining (15%), statistics (14.25%), association rule mining (14%), regression (10.25%), sequential pattern mining (6.50%), text mining (4.75%), correlation mining (3%), outlier detection (2.25%), causal mining (1%), and density estimation (1%). Searching EDM/LA works after 2017, we found research applying different techniques and using different sources of data that we mention here.
A practical application of early prediction is proposed by [29]. The authors implemented an alert system to predict performance in some classes at the university. The research demonstrated that the use of predictive methods in education allowed an increase of up to 15% on te students’ performance compared to those in classes that did not use the models.
Gutiérrez et al. [27] proposed the use of the Learning Analytics Dashboard for Advisers (LADA) as a tool to support the learning process and the students’ final success. This tool seeks to assist educational counselors in the decision-making process through comparative and predictive analyses of the student data. The use of the predictive methods of this tool showed significant results, especially in complex cases, in student success.
Foster and Siddle [26] investigated the effectiveness of LA in identifying at-risk students in higher education. To this end, the authors compared the low-engagement alerts of an LA tool with the results of students at the end of the first year of graduation. In addition, different methodologies for generating alerts have been compared, such as the use of demographic data and only VLE participation data. The tests demonstrated that the VLE-data approach was more efficient at generating alerts than using socio-demographic data. In the end, the authors demonstrated that students who had performance problems or dropped out at the end of the first year received an average of 43% more alerts on the tool.
The problem of college-going students taking longer to graduate than their parental generations was tackled by [33]. The authors presented a prediction model to identify students at-risk of failing courses that they plan to take in the next term (or future). Different models are learned from different courses. To predict a student’s grades in the next courses, his grades from prior courses are fed into corresponding models. To capture the sequential characteristics of students’ grades in prior courses, they modeled the learning behavior and performance using recurrent neural networks with long short term memory (LSTM).
In Latin America, a number of initiatives proposed approaches to the use of Educational Data Mining and Learning Analytics at the higher educational level [23]. In this context, [4] presented a proposal that aimed at early prediction of university student retention at Chile. For that, the authors applied a number of different data mining algorithms (decision trees, k-nearest neighbors, logistic regression, naive Bayes, random forest, and support vector machines) over students socioeconomic information and previous achievements in their courses. The results demonstrated an accuracy on the classification higher than 80% in all tested scenarios.
Table 1. Summary of related works.
WorkGoalTechniqueAlgorithmEdu. LevelFeatures Used
[29]To predict students at-risk of failClassificationLogistic regressionHigherStudent factors (IMD area, price area, and disability), Previous studies (highest qualification on entry), Student course (total credits studying in a year and late registration), Previous progress at the university (best previous score and number of fails)
[27]To support academic advising scenariosMultilevel clusteringFuzzy C-meansHigherGrades and the number of courses students took during the semester
[26]To predict students at-risk of failNot-mentionedNot-mentionedHigherDemographic data versus only VLE participation data
[4]To predict student retentionClassificationDecision trees, k-nearest neighbors, logistic regression, naive Bayes, random forest, and SVMHigherEducational score and the community poverty index and university grades.
[30]To predict students at-risk of failStatistical AnalysisCorrelation and regression analysisHigherClick stream data, self-reported measures, and course performance.
[24]To predict both marginal and at-risk students of failClassificationTraining vector-based SVMHigherDemographic data and interaction with a virtual learning environment.
[25]To select best features to improve predicting students performanceFeature selection to improve supervised learning classifiersDeep learning with LSTMHigherMetrics from navigation events that are combined in the LSTM network.
[28]To predict students at-risk of dropoutClassificationRandom forest and boosted decisionSchoolAttendance and course performance.
[32]To identify learners personalityClassificationNaive bayesHigherParticipation in forums and chats, access to supplementary course materials, delay in assignment delivering, score, accomplishment of assignments, time solving of quizzes, and number of entrances in the system.
[33]To predict students at-risk of failClassificationLSTM and RNNHigherPrevious grades.
The learning process in which students are responsible for defining their goals and constantly auto-regulating their objectives towards some content or course is named Self-Regulated Learning (SLR) [34]. Li et al. [30] evaluated SRL in face-to-face courses that are supported by online activities/courses to demonstrate the extent to which LMS interactions may be used to better understand how students manage their time and regulate their efforts. By doing so, the authors aim to improve their performance on the identification of at-risk students.
They collected questionnaire data (pre- and post-course) from freshmen university students enrolled in a 10-week course. The questions were based on the following: the Motivated Strategies for Learning Questionnaire (MSLQ), the students’ interactions with the VLE, and socio-demographic data. Their findings showed a moderate positive correlation between the VLE clicks and students’ SRL, as well as between VLE clicks and the students’ final performance. Moreover, the authors reported that the combination of demographic attributes with SRL variables significantly impacted the model’s ability to predict at-risk students.
According to [25], a significant challenge faced when building predictive models of student learning behaviors is to use handcrafted features that are effective for the prediction task at hand. The authors, then, adopted an unsupervised learning approach to learn a compact representation of the raw features. They sought to capture the underlying learning patterns in the content domain and the temporal nature of the click-stream data. The authors used Deep Learning the training and a modified auto-encoder combined with the LSTM network to obtain a fixed-length embedding for each input sequence.
The selected features used in supervised learning models achieved superior results. Identifying at-risk students is the main goal of [28]. Dropout reasons include not only poor performance but also other events, such as violation of school rules, illness, etc. The authors addressed the class imbalance problem in the binary classification (dropout corresponds to 1% of the labeled dataset) through oversampling techniques.
They trained the embedded methods of random forest and boosted decision trees using the big data samples of the 165.715 high school students. The 15 features used referred to attendance (for example, unauthorized early leave in the first four weeks), behavior (number of volunteer activities), and course performance (normalized ranking on Math). A ROC and PR curve analysis was presented, showing that the boosted decision tree achieved the best performance.

3. Materials and Methods

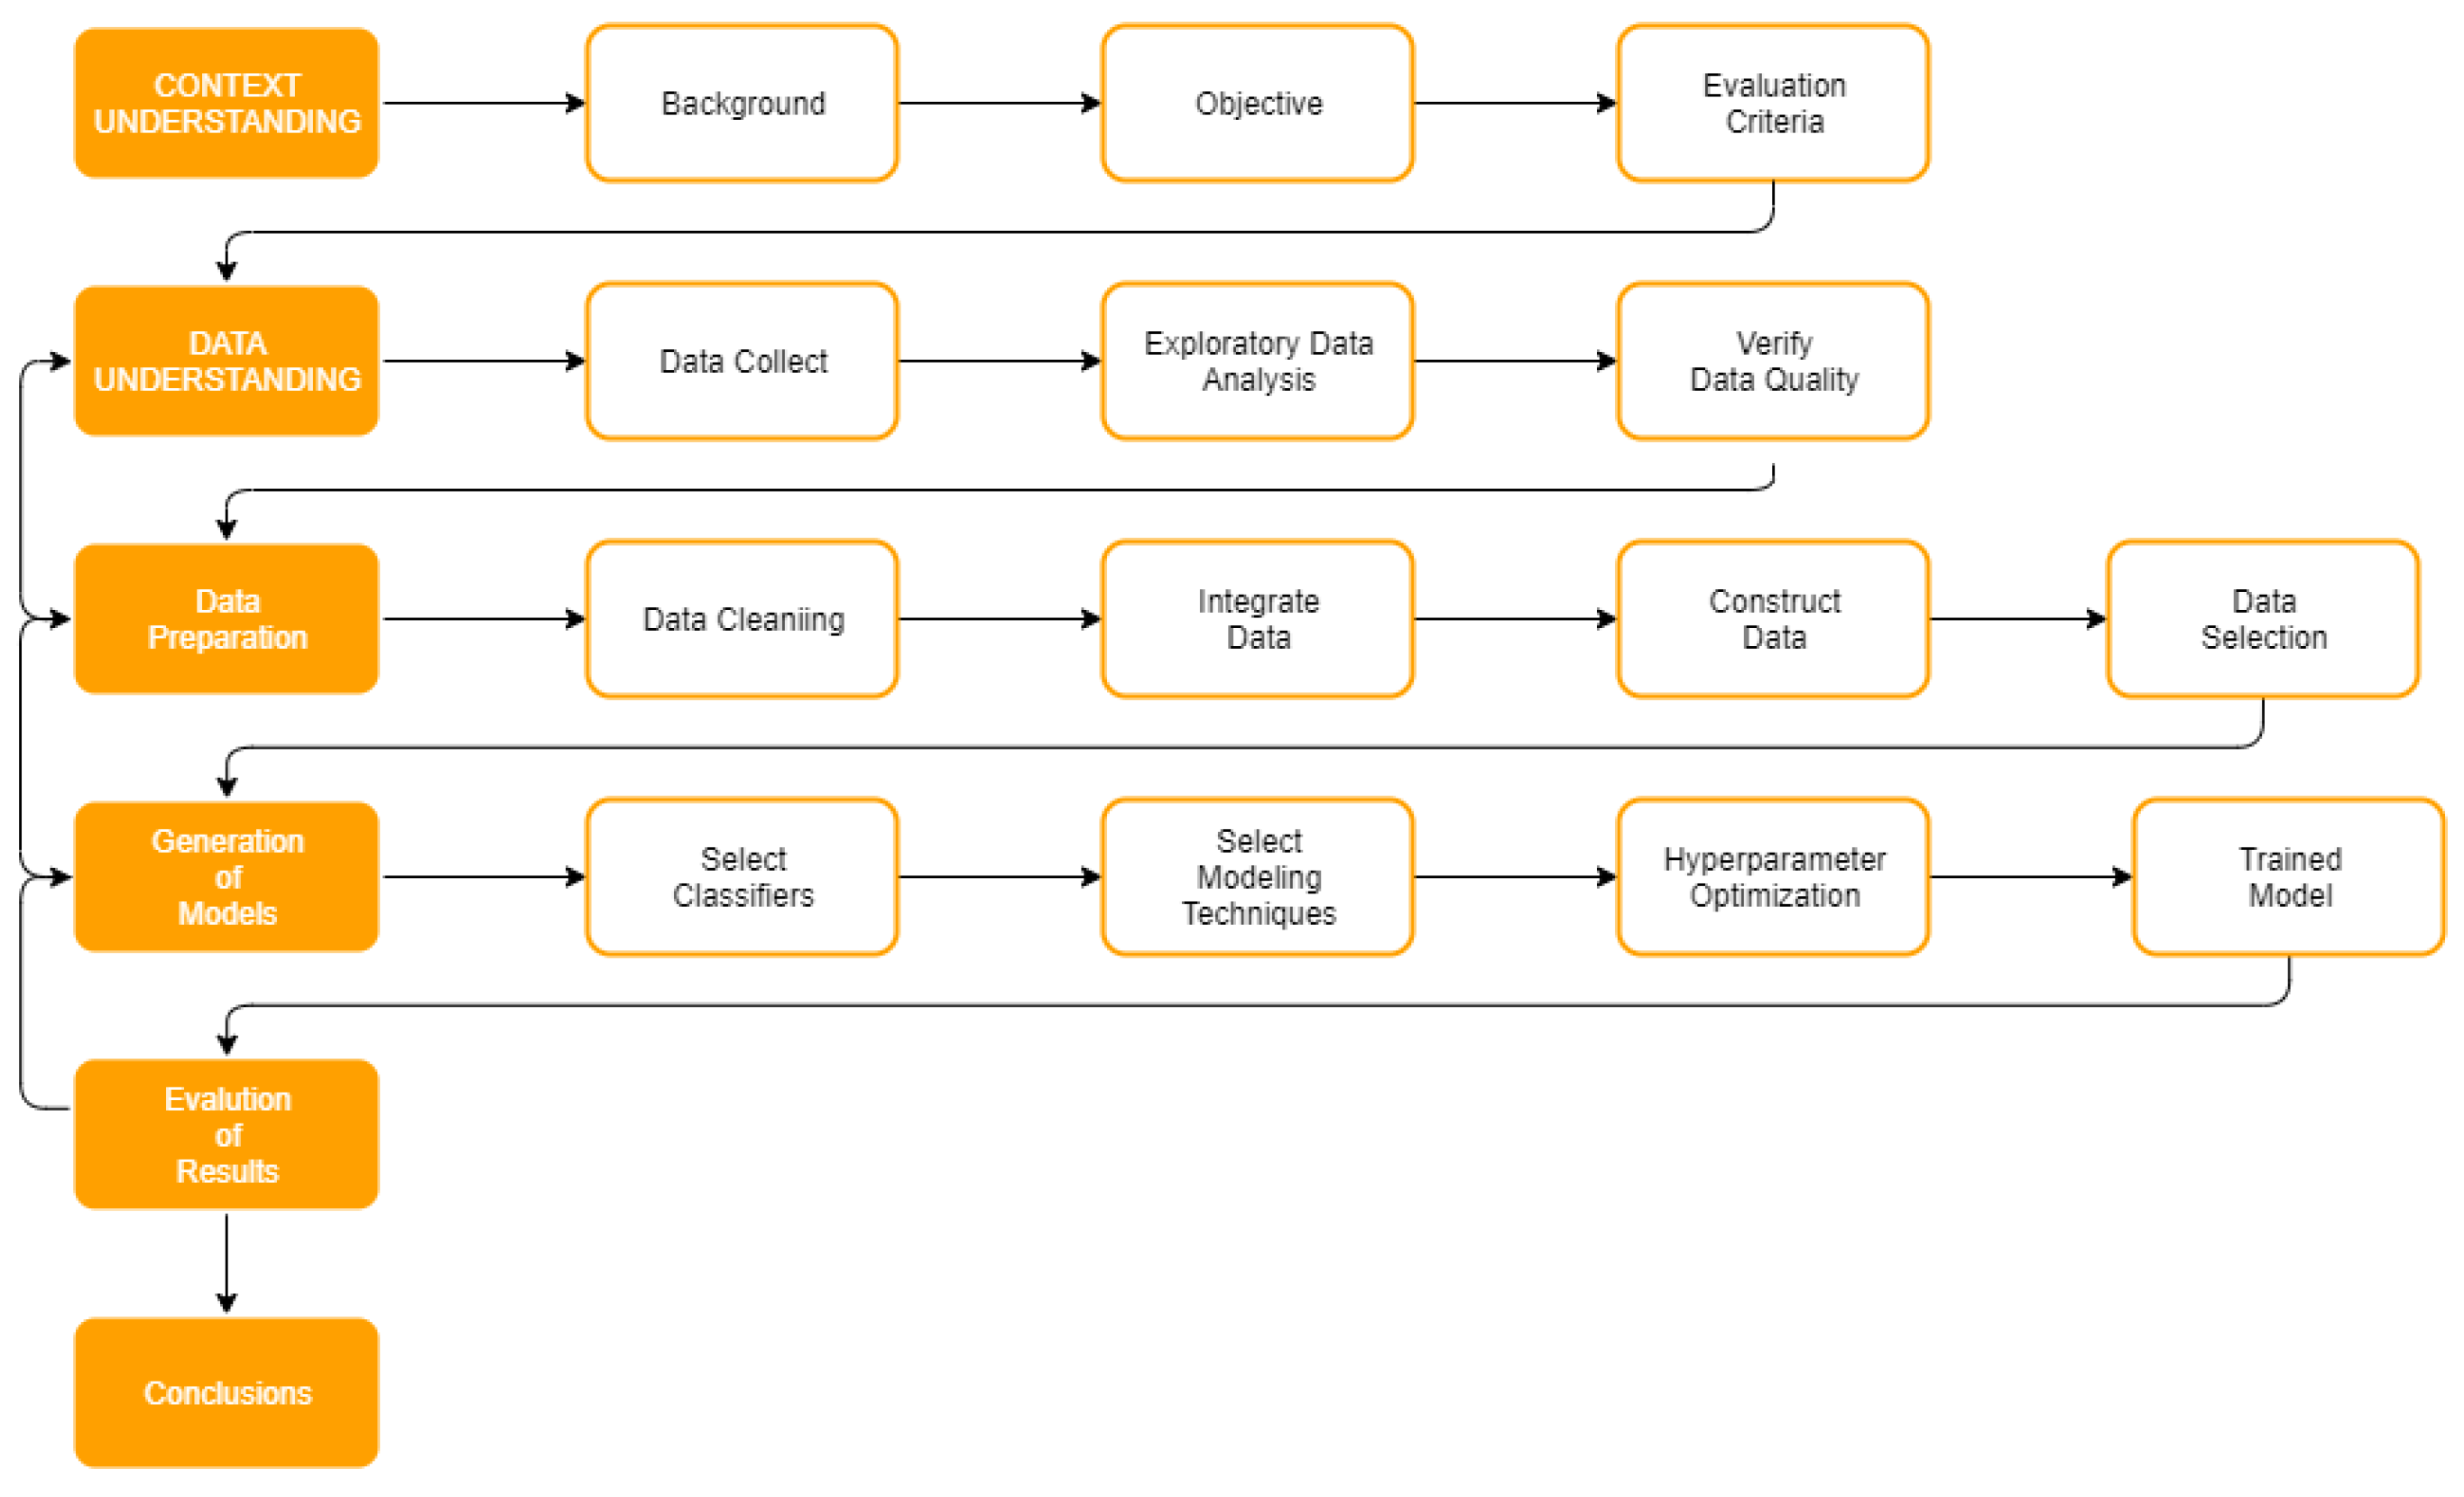
This section presents an overview of the research methodology and the general context of the case study.

3.1. Overview

In Data Science, it is essential to define the project flow steps and the methodology to be followed. The method used in this work is the Cross-Industry Standard Process for Data Mining (CRISP-DM) [35] with minor adaptations to the application for the context of this research. Figure 1 shows the flow of the methodology model used and Figure 2 shows the proposed solution to this project.
The adapted CRISP-DM process and its six steps were applied and are presented in the sections of this paper as follows: context understanding is presented in Section 1 and Section 3.2; data understanding is presented in Section 3.4; data preparation consists of the feature engineering process and is detailed in Section 3.5; the generation of models (modeling) is an iterative step that occurs in conjunction with data preparation, and this is shown in Section 3.6; evaluation of the results and its discussion are presented in Section 4, Section 5 and Section 6; and, at the end, the conclusions are shown in Section 7.

3.2. Contextualization: Case Study of Udelar

In Uruguay, Udelar is the main institution of higher education, concentrating 75% of the students (public and private), 90% of the university system, and 99.5% of the public universities. It has a policy of free and unrestricted admission, with no other condition than the completion of high school. In 2020, the Udelar had 100 undergraduate courses and a few more than 200 graduate courses. In 2018, the university had more than 135 thousand undergraduate students and more than 10 thousand graduate students [36].

The Continuous Survey of Udelar’s Students

To better understand its students, Udelar developed a set of statistical survey mechanisms to generate information about their characteristics and distribution, called “FormA-Students”. The FormA-Students is a longitudinal survey that must be responded to annually by all students. The survey covers questions in the following dimensions: (a) sociodemographic, (b) pre-university education, (c) work, (d) other university and/or higher education studies outside Udelar, (e) languages, (f) academic mobility, and (g) scholarships.
In addition to these dimensions, this research also uses data of their activity and qualifications recorded in the Bedelias System, the administrative management system that collects all the official records of the students’ academic career, the subjects taken and completed, the approvals and failures, and the grades received.
The present work analyzed data from the second-year students enrolled in courses from three different faculties, in the year 2017, as follows: (1) Faculty of Information and Communication (FIC), (2) Faculty of Nursing (FEnf), and (3) Faculty of Sciences (FCien). These faculties have similar number of students and represent the three macro areas in which the Udelar are organized.

3.3. Computational Settings

The computer used to process the data used the Operating System Ubuntu 18.04 and had an Intel i5 4th generation processor with 8 GB RAM. The environment was created using an Anaconda distribution, and the scripts were developed in Python 3.8 with scikit-learn, Pandas, and Numpy packages. The total runtime for training and testing the models was roughly 24 h. For each dataset combination, the model generation took from 2 to 4 h.

3.4. Data Understanding

Data from students enrolled in three bachelor programs from three different faculties of Udelar were collected. The programs are Biology (BIO), Communication (COM), and Nursing (NUR). Table 2 shows the number of subjects used in each program, the total number of interactions inside the VLE for each subject, the total number of students enrolled in, and the following: students that had success without retaking exams, students that had success after the final exams, and students that failed.
It is important to highlight that it is not mandatory for the student to attend the classes to take or retake the final exams. This particularity affects the way students use VLE, especially during the first year when a large number of students drop out of university as this public university does not have entrance exams. This is the main reason for choosing data from second-year students as it tends to be stable in terms of dropout. In this sense, we believe that we have a clearer picture of the use of the VLE by the students, which was intended to keep them enrolled in the courses.
Two different output variables (targets) were defined for our study: the prediction of success in the course (students who passed without the need of exams) and the prediction of success in the final exams. For the first target, the models predict whether a given student will be approved directly or if they will need to take exams. For the second target, the models predict whether a given student will pass or fail after taking the exams. Together with the students’ interactions inside Moodle, we also used data from the university’s academic system and the FormA-Students survey database.
Students’ interactions within VLE in its raw state were collected. These data were separated by students, day of interaction, and type of content. We collected, from the academic system, the subjects enrolled in by each student, the academic performance in the subjects, and the number of previous failures in each subject. The third data’s source was the continuous survey called FormA-Students. This survey is completed by students annually, and it collects 111 attributes distributed in sections referring to socio-demographic and socio-economic background, pre-university and further university studies, employment status, language proficiency, motivation and expectations about career, academic mobility, and scholarships.
According to the dean of Udelar [37], the survey data can enable the institution to think about itself in the long term and in strategies that require the prediction of the state of affairs of the different actors to achieve specific objectives. For example, it has the education and occupational category of the father and mother, marital status, family income, ethnic self-perception, disabilities, employment status, occupation classification, scholarship receptions, place of birth, and the place where they live and with whom.
The exploratory data analysis step sought to visualize the different datasets before integration to identify database sizes, become familiar with the data, and gain insights for the transformation of target features, as well as identify visible behavioral patterns.
Figure 3 shows the distribution of interactions in VLE by age. A possible observation is that the older the student, the lower their use of the VLE. This may represent an acceptance trend where younger students tend to adhere more to the use of Moodle. Still the right sidebar of the graph shows the distribution of students by age, and the top bar shows the distribution by interactions. As seen, the highest concentration of interactions was found in students between 20 and 25 years of age.
Another important analysis of the Figure 3 is that a significant part of the dispersion was located between 0 and 200 interactions. In this range, 52 students were identified who had 0 interactions with the VLE during the courses, of which 16 passed the course (without exam), 23 passed the exam, and 13 failed. In addition to that, only two students took the course for the first time, and both failed.
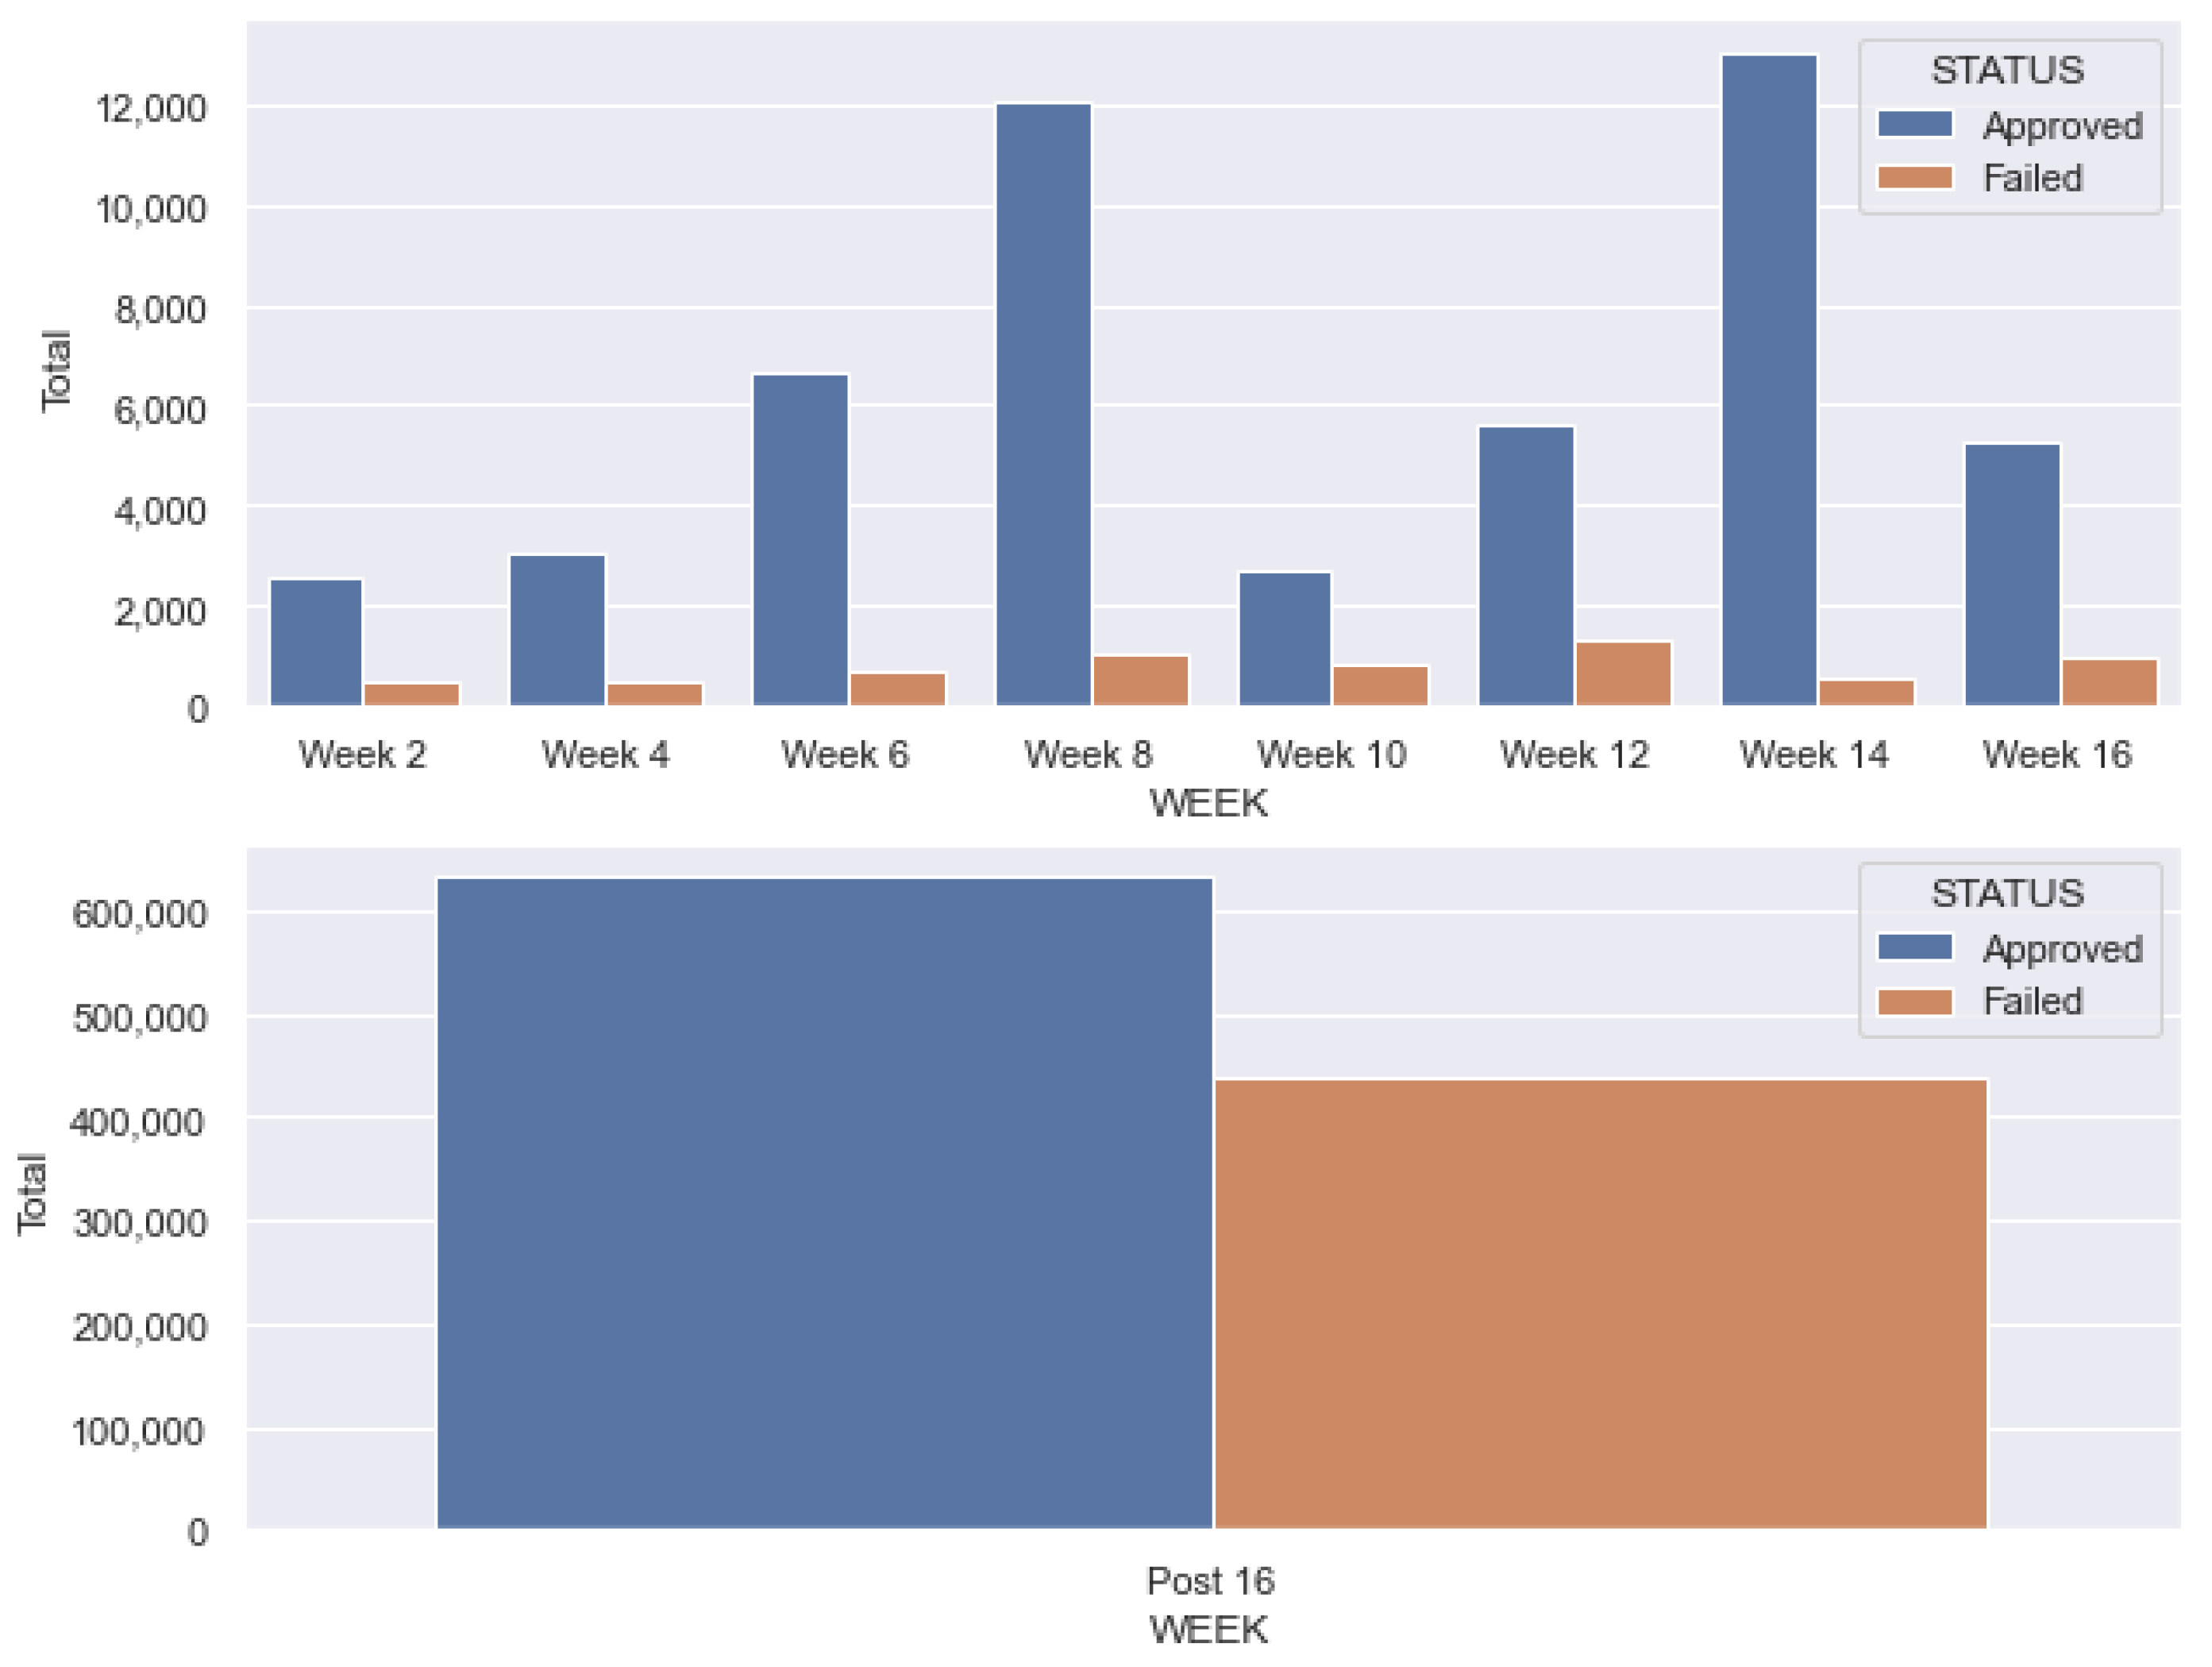
Figure 4 shows the difference of interactions between students who had success versus students who failed the subjects. In the upper part of the figure, interactions are presented during the 16 weeks of the subjects, where notably the students who had success demonstrate a higher engagement in VLE compared to those who failed. The bottom part of the figure shows the total number of interactions after the end of the semester (after the 16 weeks and the final exam) and before students retake the exams. It must be noticed that the failing students had higher engagement compared to the course progress but less than the successful students.
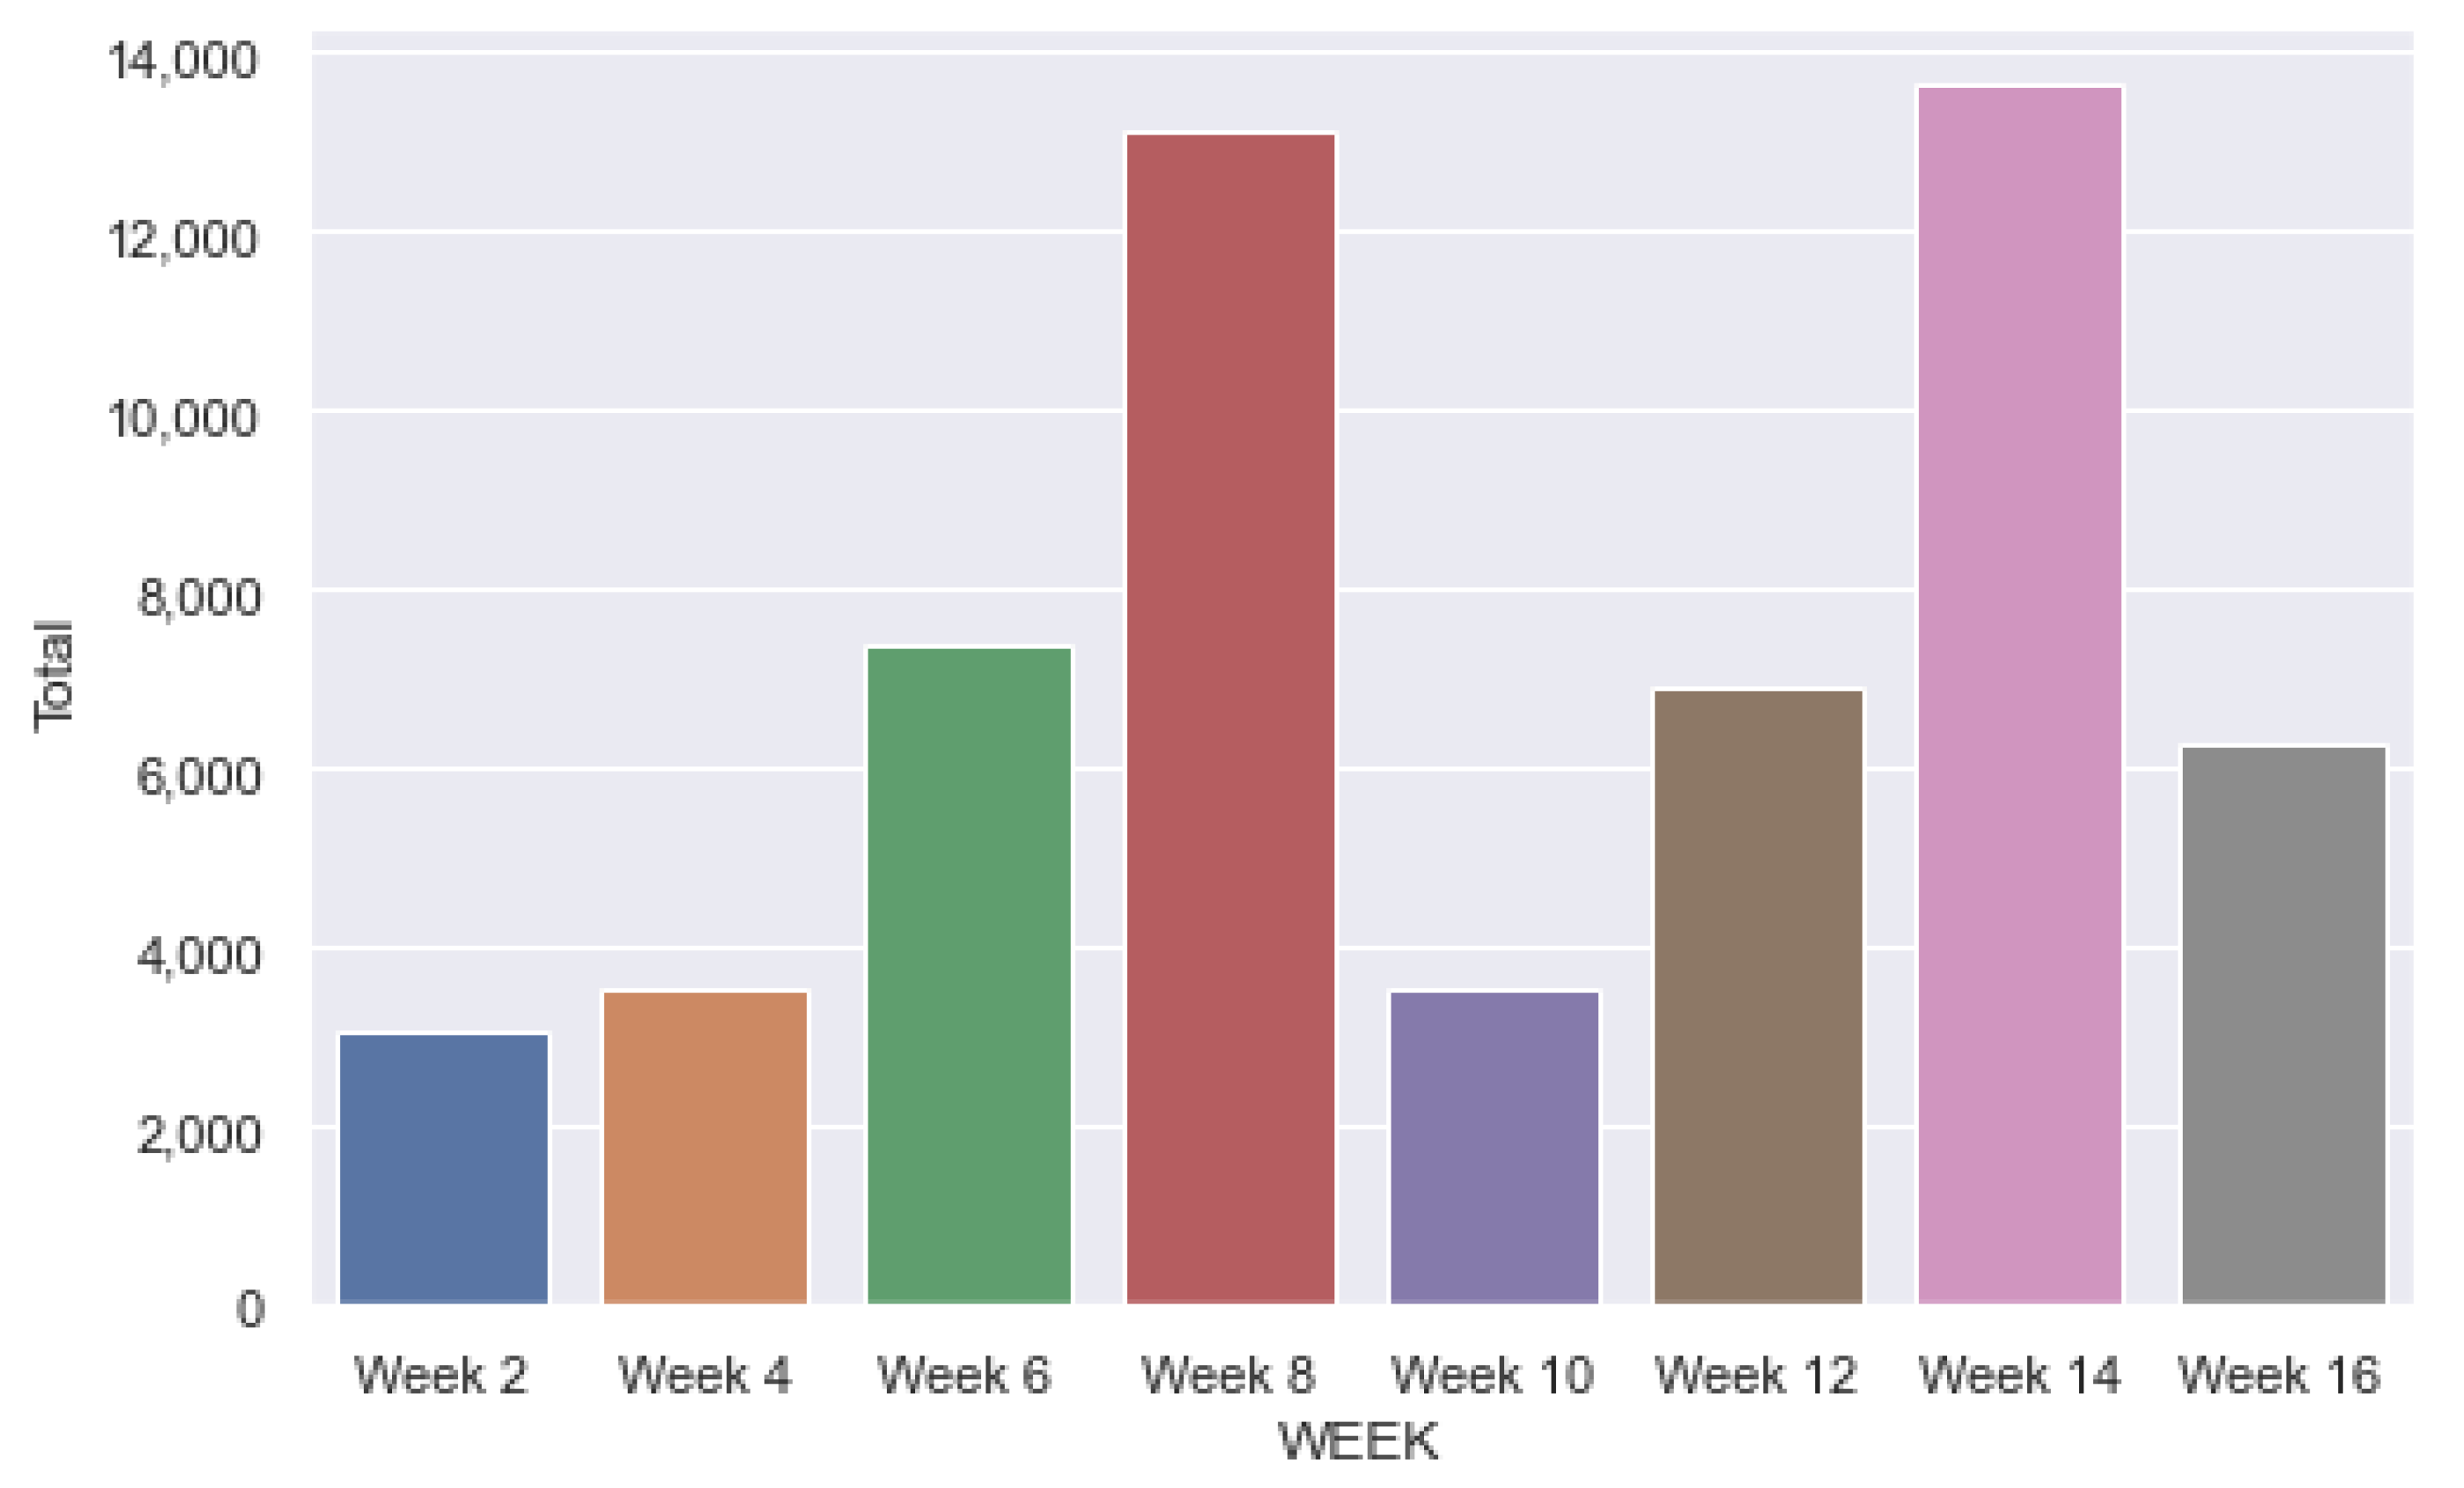
Figure 5 shows the distribution of interactions during the weeks of the course. The interactions grew until the partial exams (in weeks 8 and 14/16). This movement is an indication that the closer the exams/tests are in a given subject, the higher the students access to the VLE to consult the materials.
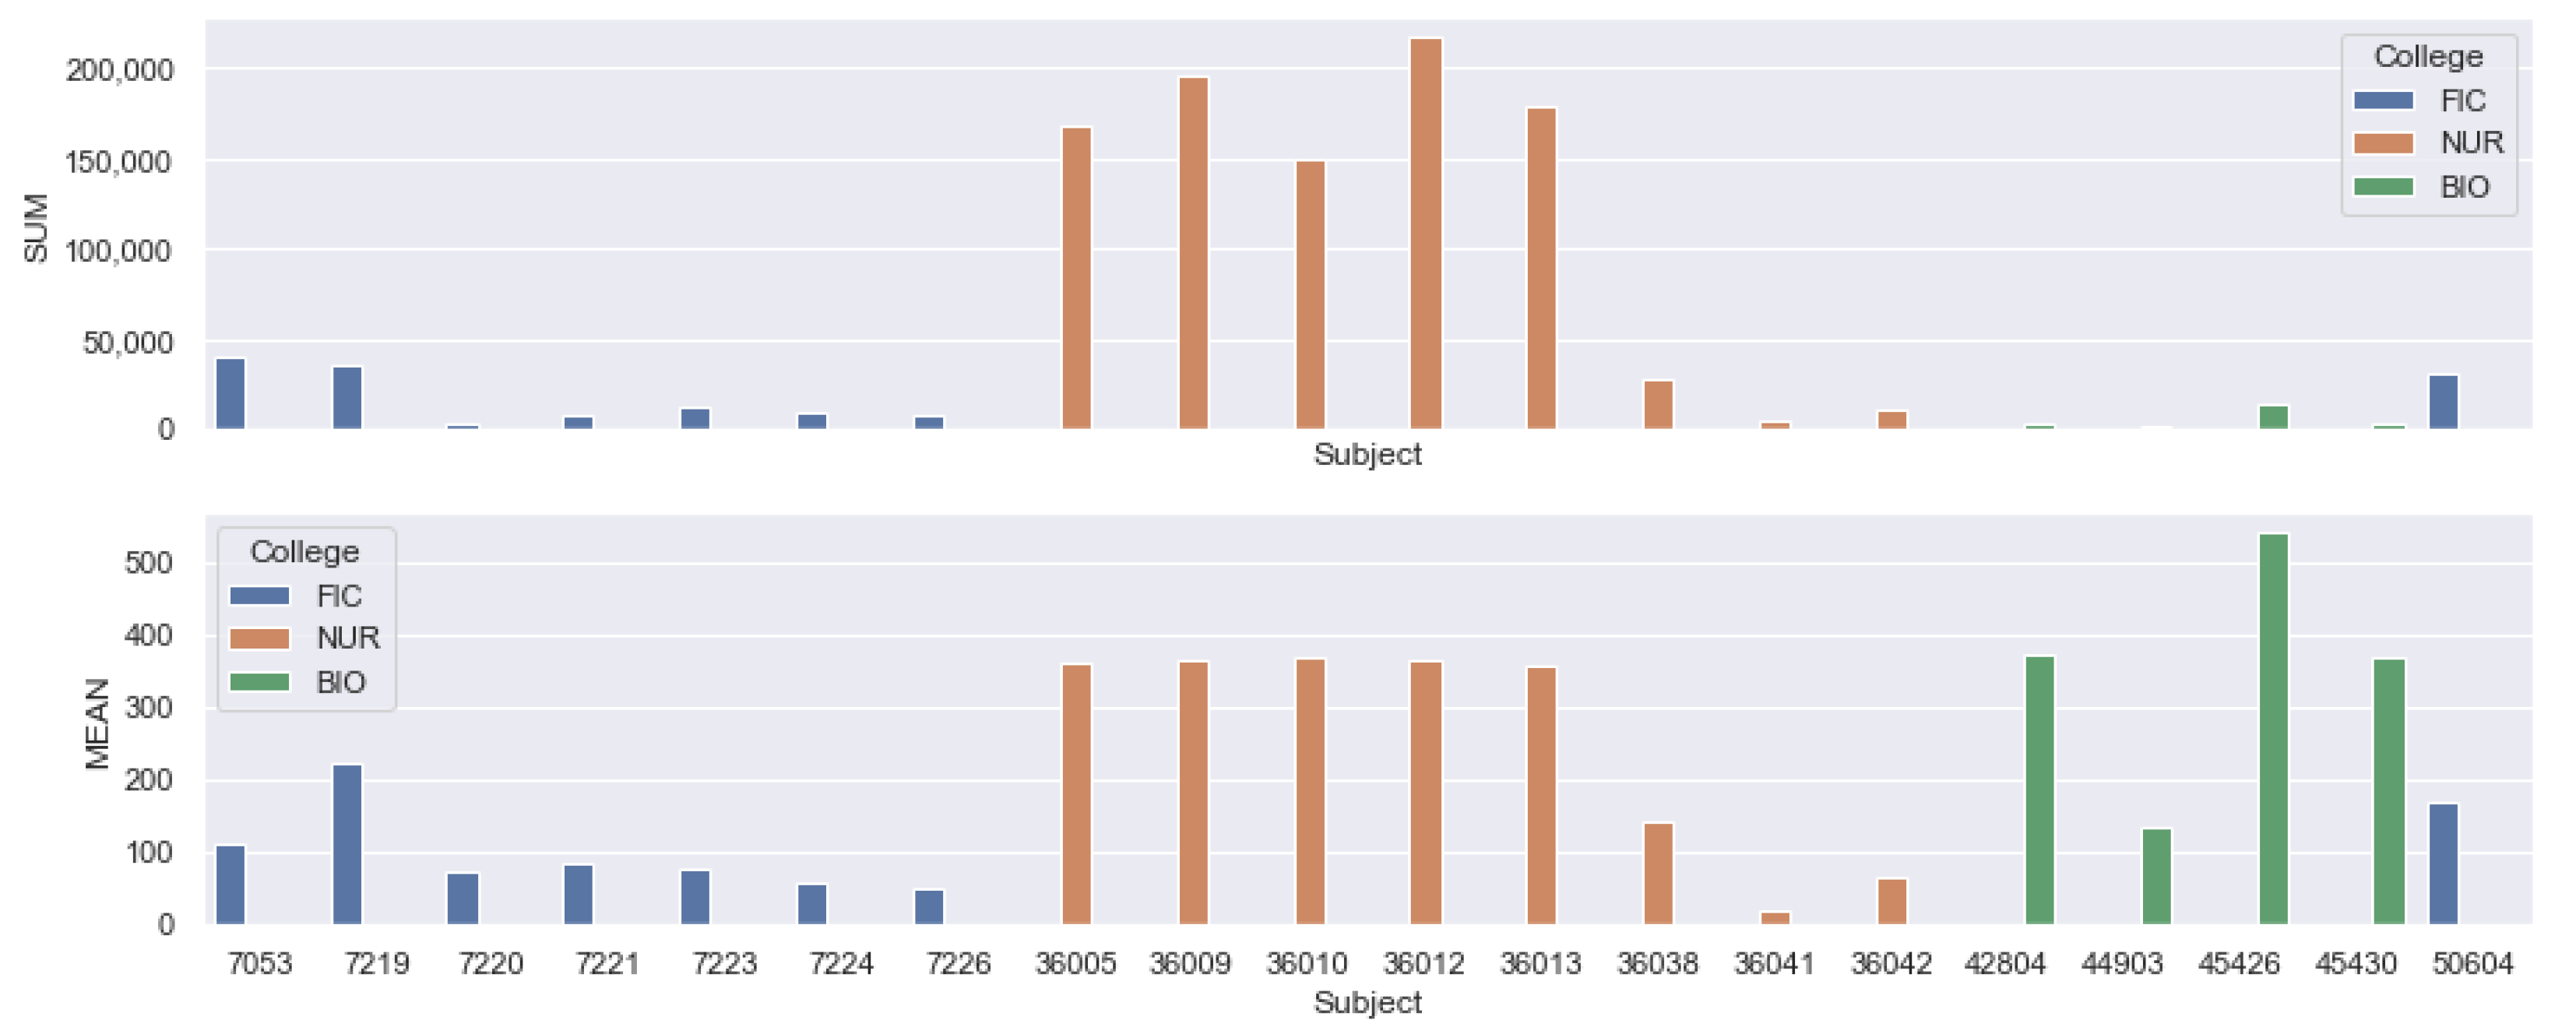
Figure 6 shows the total number of interactions per subject (upper) and the average number of interactions for each of the analyzed subjects (bellow). It is possible to analyze that, even within a program, the use of VLE was considerably different between subjects.
Analyzing the VLE subjects’ didactic design, it was possible to characterize them as mainly organized as repositories of resources to support face-to-face classes, where professors upload materials, such as text, images, and videos, and provide online assessments and self-assessments. Forums are used mainly as a place for coordination and information dissemination rather than for the discussion of content-related issues.
The two main uses of a quiz are as follows: first, as a form of assessment evaluation of learning instruments, generally mandatory, by a single attempt, for all active students and carried out on a pre-established date; and second, as an interactive activity oriented to education and training over a long period and allowing multiple attempts. Rodés et al. [38] defined a typology of didactic designs according to the type of resources and activities supported by VLE. The courses analyzed here fall mainly under the repository and self-assessment types.
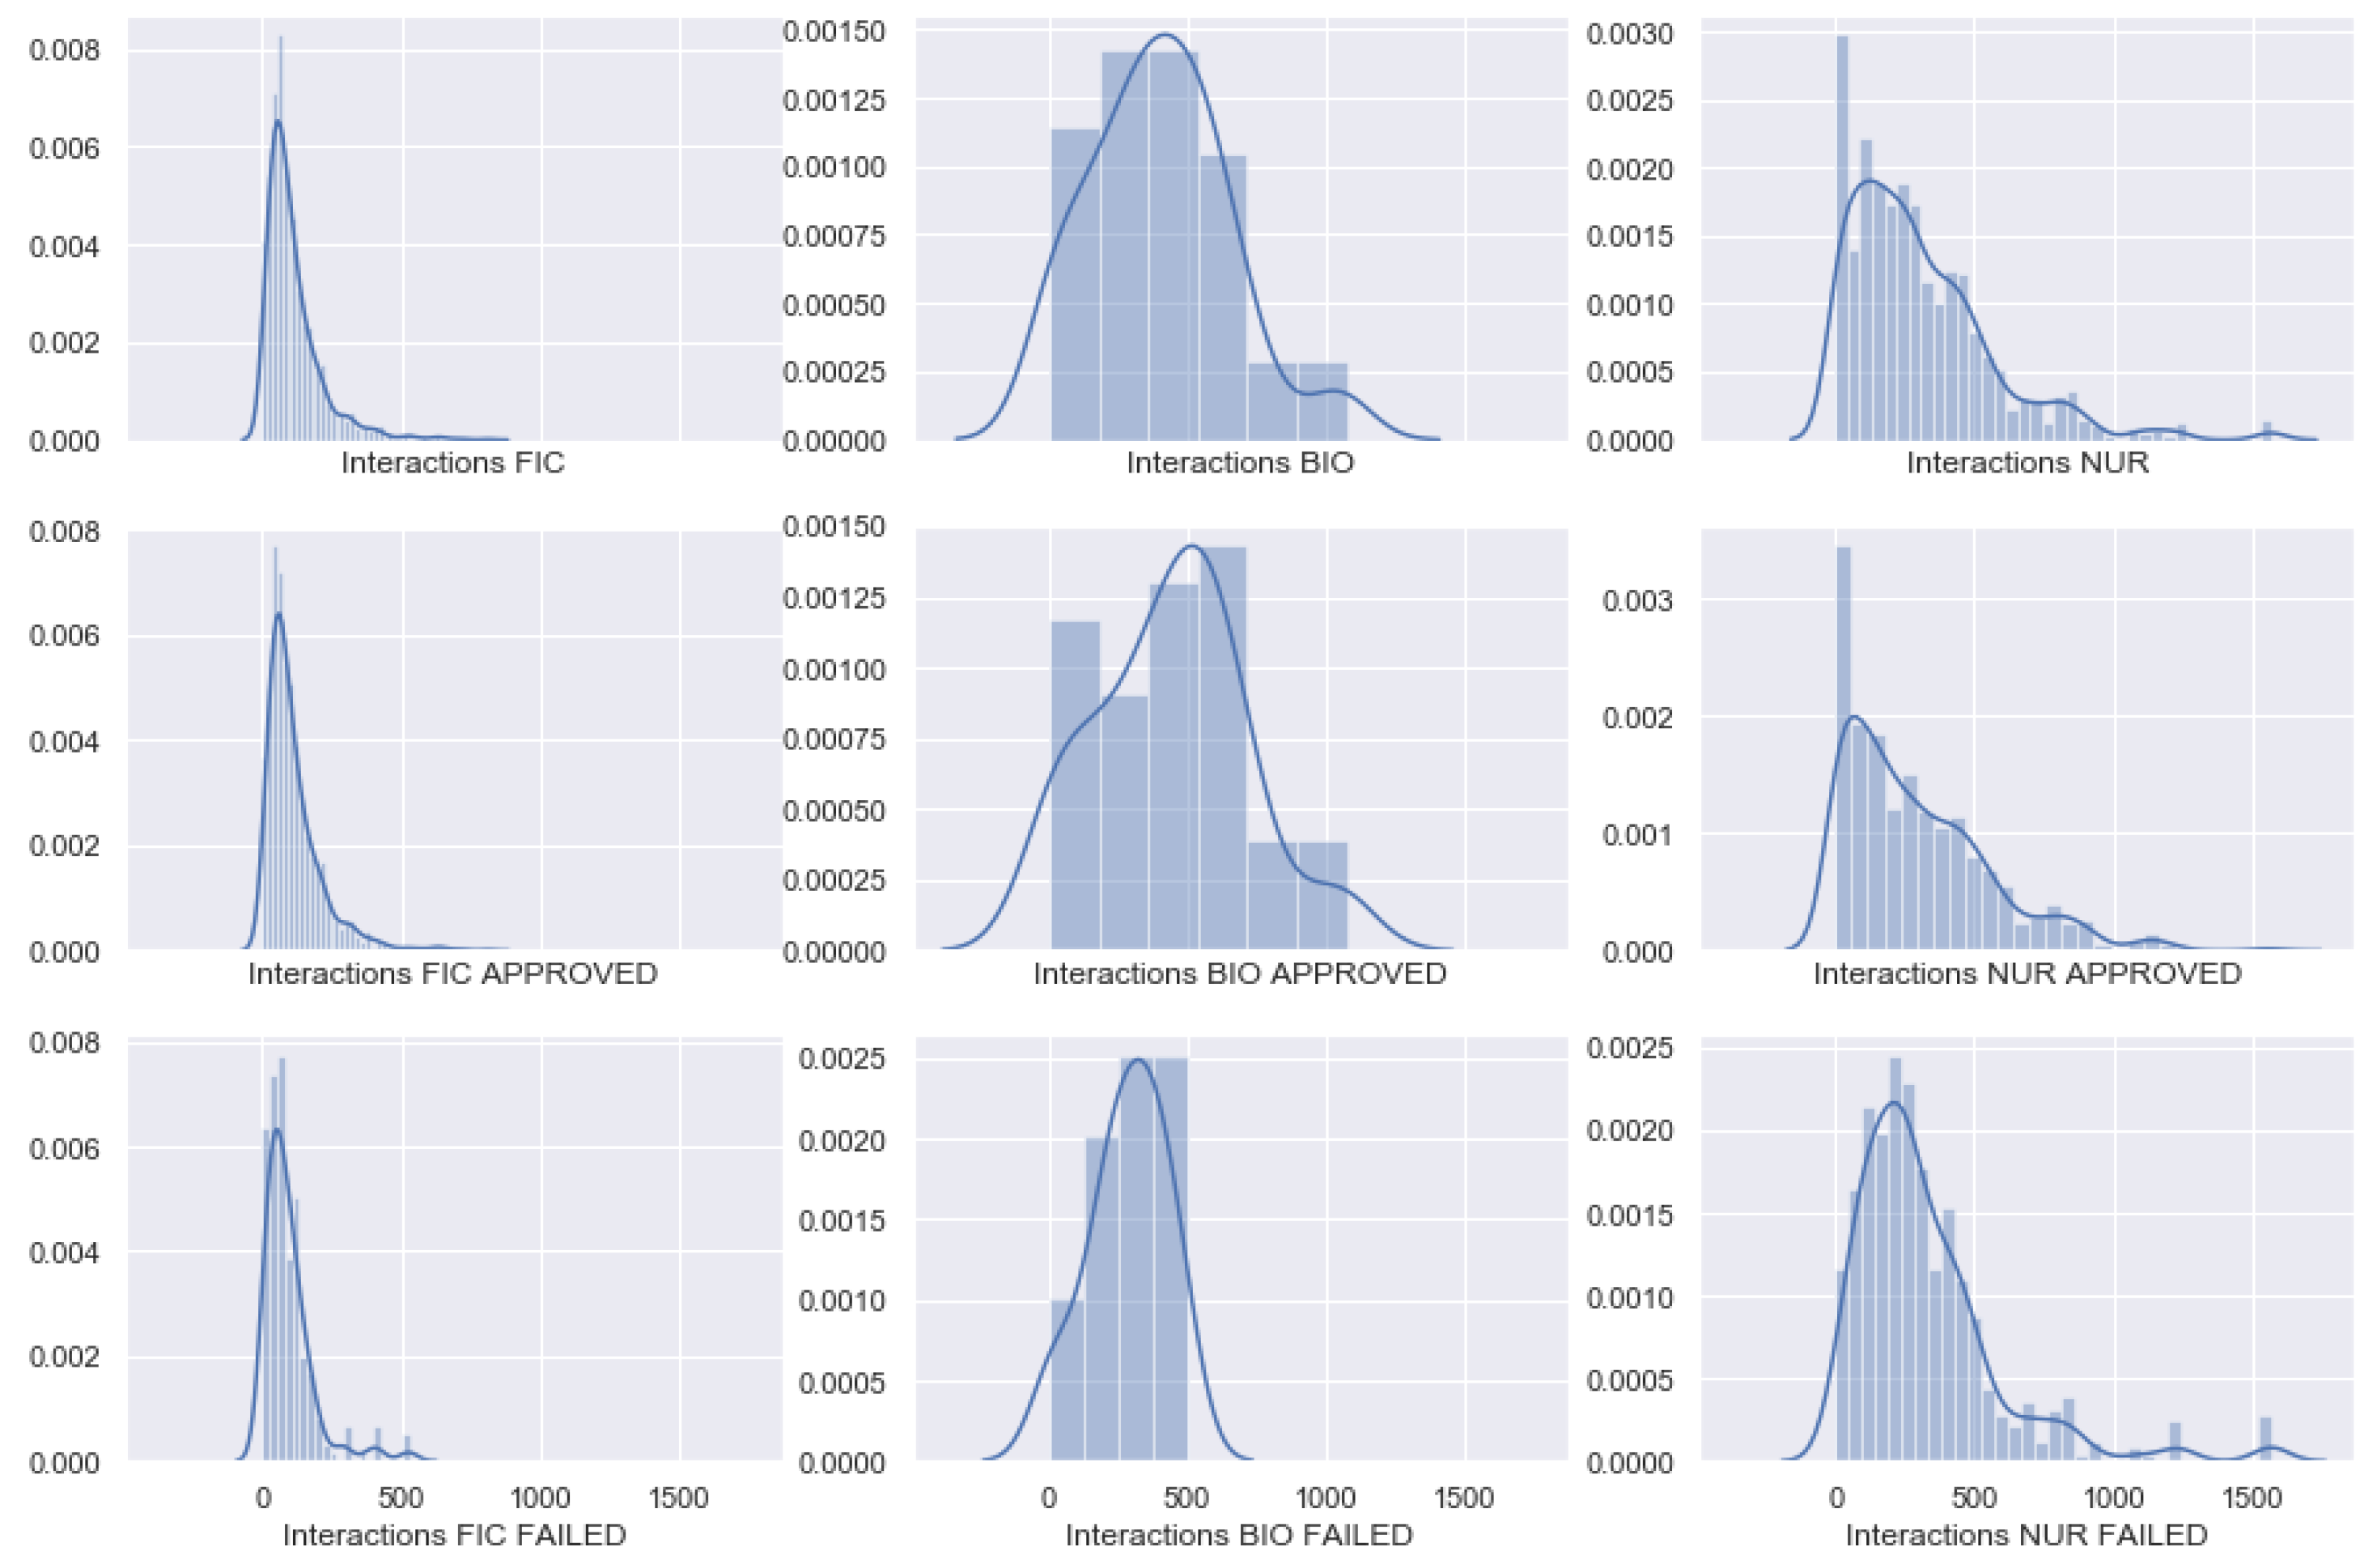
Figure 7 displays the frequencies of the distribution of total interactions by programs and the students’ final status. In FIC and NUR, both categories have their peak of interaction near zero and do not seem to present a different distribution. On the other hand, BIO presents a different distribution of interactions between the categories, with the peak of interactions for the success category near 500 and for the failed category near 300.
To evaluate whether the VLE’s students’ interactions were associated with their final status in the subjects, we performed a statistical analysis. First, we used the Shapiro–Wilk test to verify whether interactions from both groups (success and failure) of each course followed a normal distribution. For the groups that follow a normal distribution, we performed a t-test and for the others, we applied the Mann–Whitney non-parametric test. The goal was to check whether the means/medians (depending on the test) of the groups present statistically significant differences. This analysis was performed for three different periods of the semester: week 4, week 8, and week 16 (all weeks). The results are shown in Table 3.
As shown in Table 3, the only case where the distribution was normal was for the Biology course considering all 16 weeks. In this case, the T-Test showed a statistical difference between the means of the two groups. For the other cases, the Mann–Whitney test showed statistical differences between the medians of the two groups. These results allowed us to conclude that the students’ usage of VLE was associated with their subjects’ final status: success or fail.
Another interesting observed attribute is the number of subjects the student was enrolled in and the relation with their final status. 
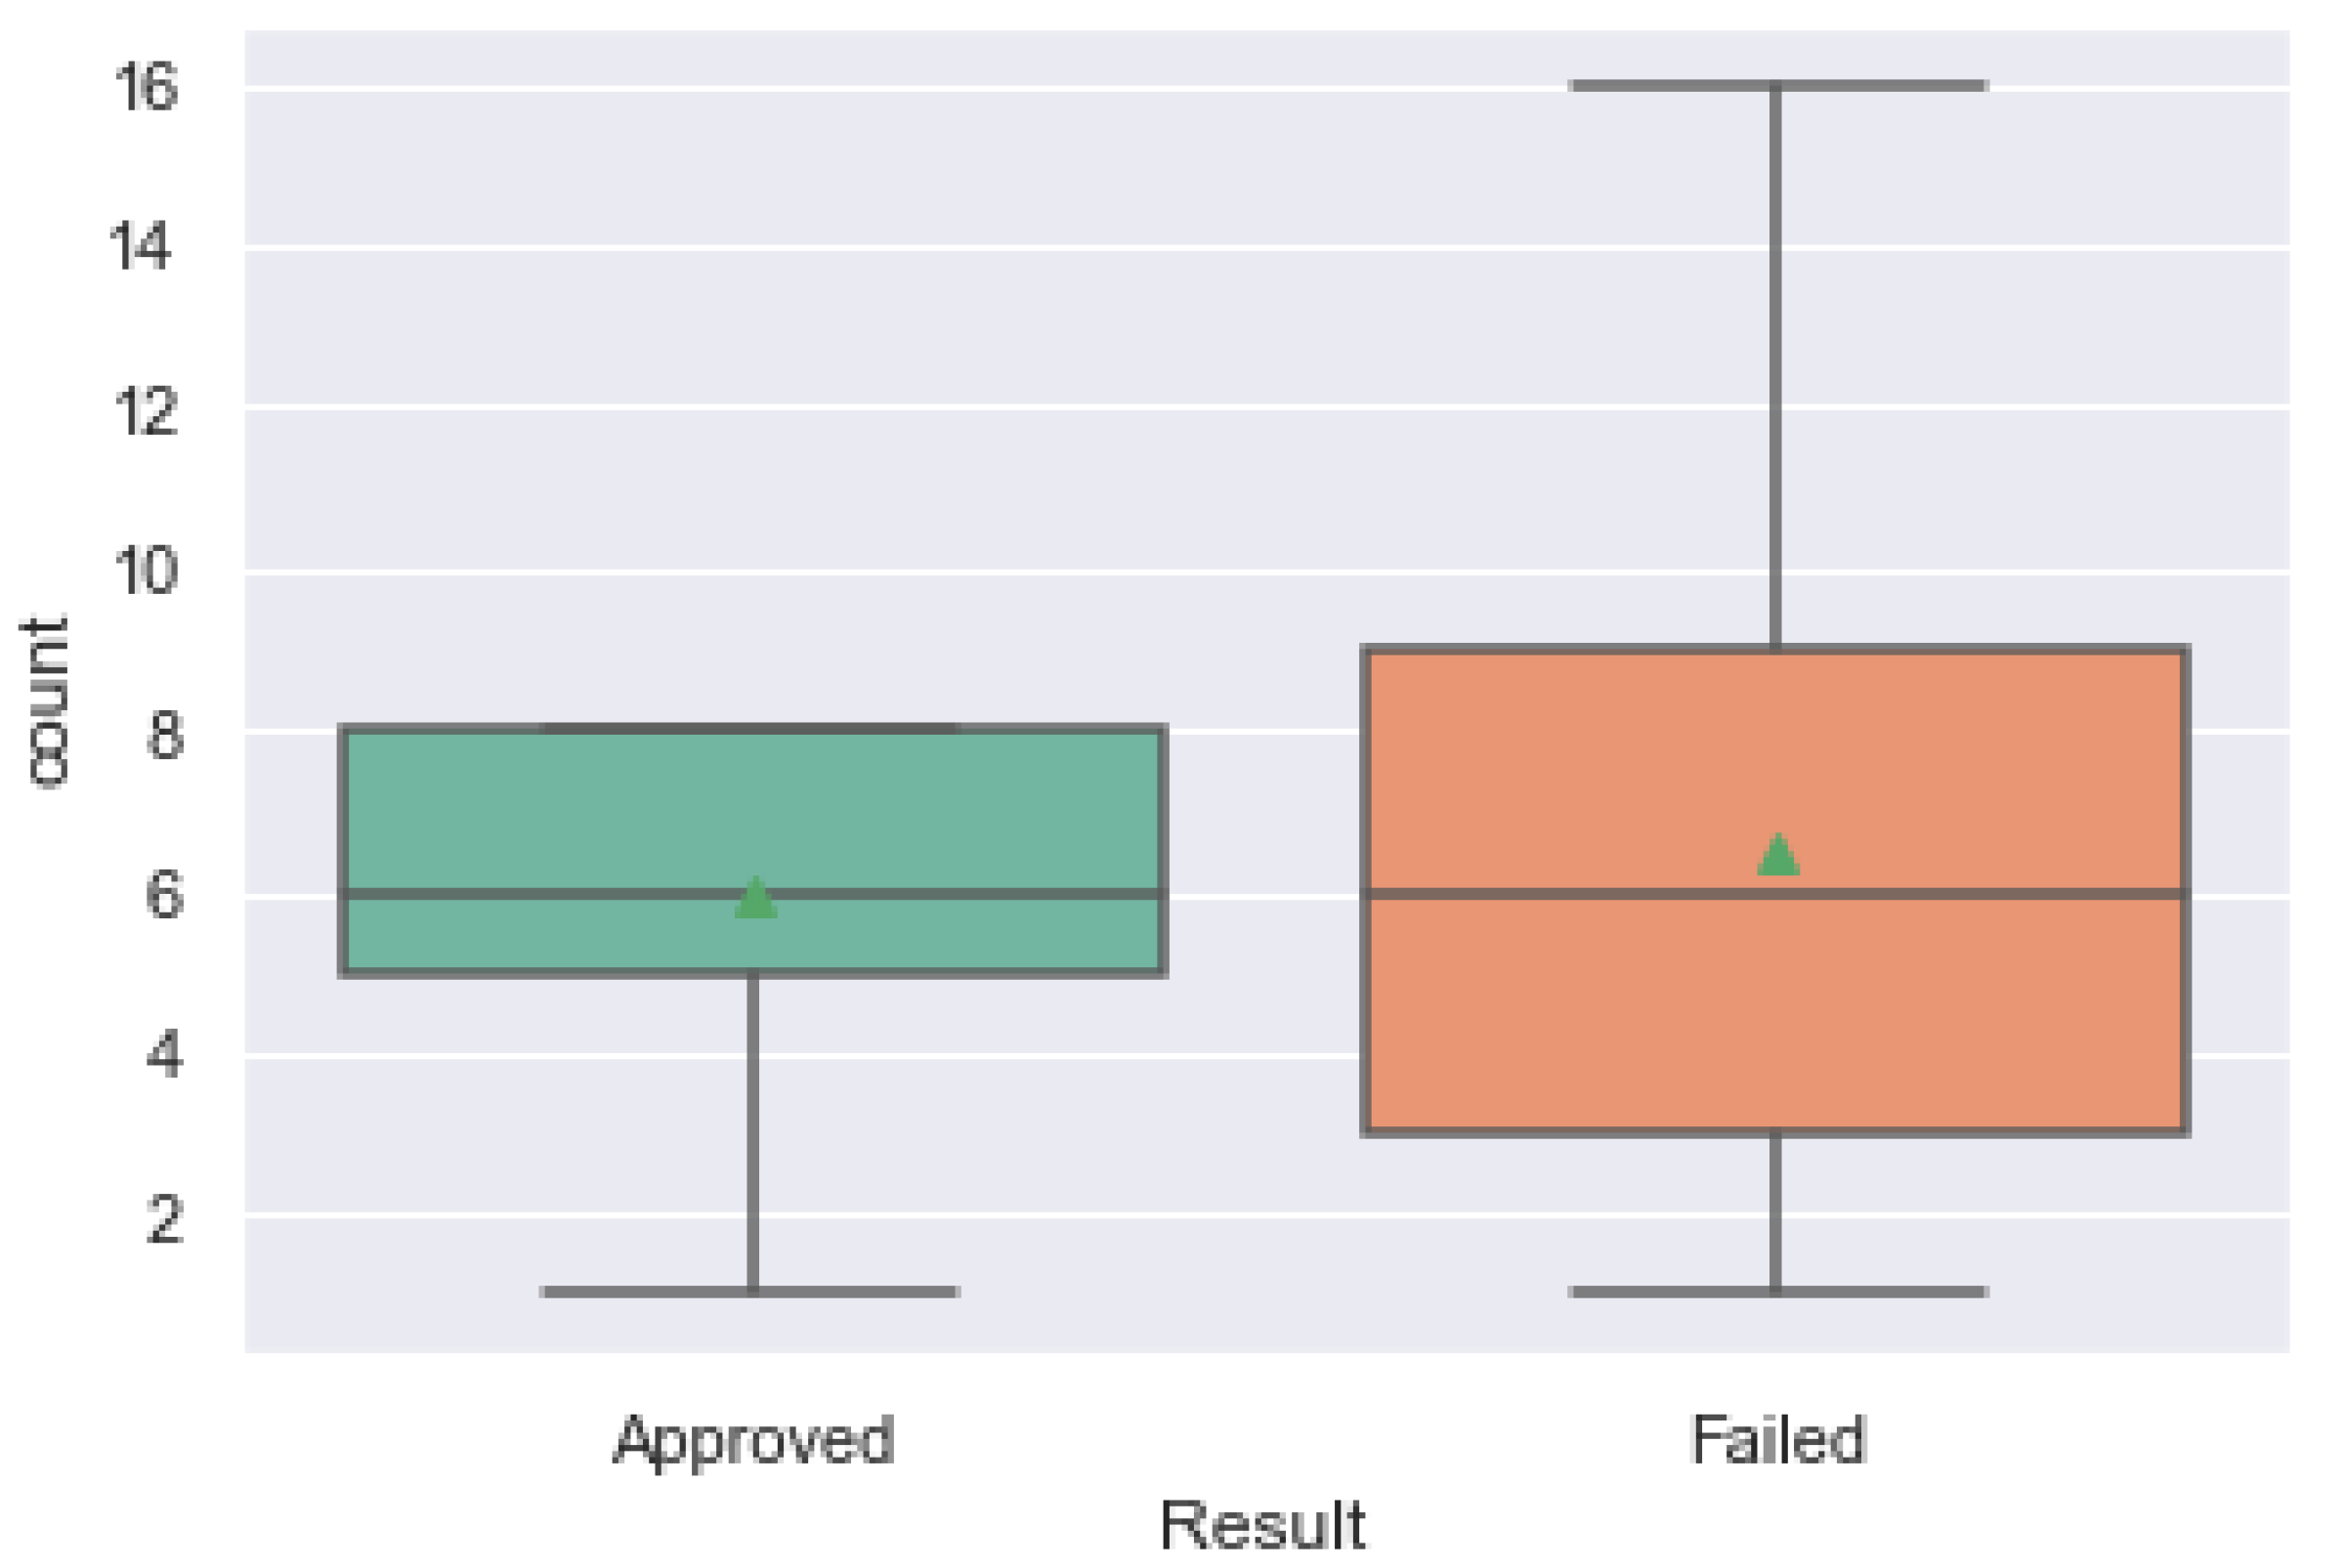
Figure 8 shows a box-plot for both groups of students versus the number of subjects enrolled. Even though the mean and median of subjects for both groups were the same (Success: median = 6.0 and mean = 5.93; Fail: median = 6.0; and mean = 6.47), a Mann–Whitney test showed a significant statistical difference between them (statistic = 2,138,630.0, p-value < 0.05).
Figure 8 shows that students who failed in the subjects presented a wider dispersion in the number of subjects. Students who had success, tended to enroll in five to eight subjects, while students who failed tended to enroll in three to nine subjects. One of the possible reasons for this discrepancy may be related to the fact that students may enroll in subjects that they are not necessarily interested in taking (as they are allowed to take the final exams without attending classes for those subjects).
This may contribute to the fact that some subjects have a high number of students enrolled although they are not effectively participating. For instance, one given subject from the Nursing course had 590 students enrolled. This is a relatively common practice in Udelar; however, the data seem to show that students regularly attend the subjects in which they have success. This flexibility may also reflect in the engagement of the students in the subjects with students enrolling in more subjects than they are able to attend.
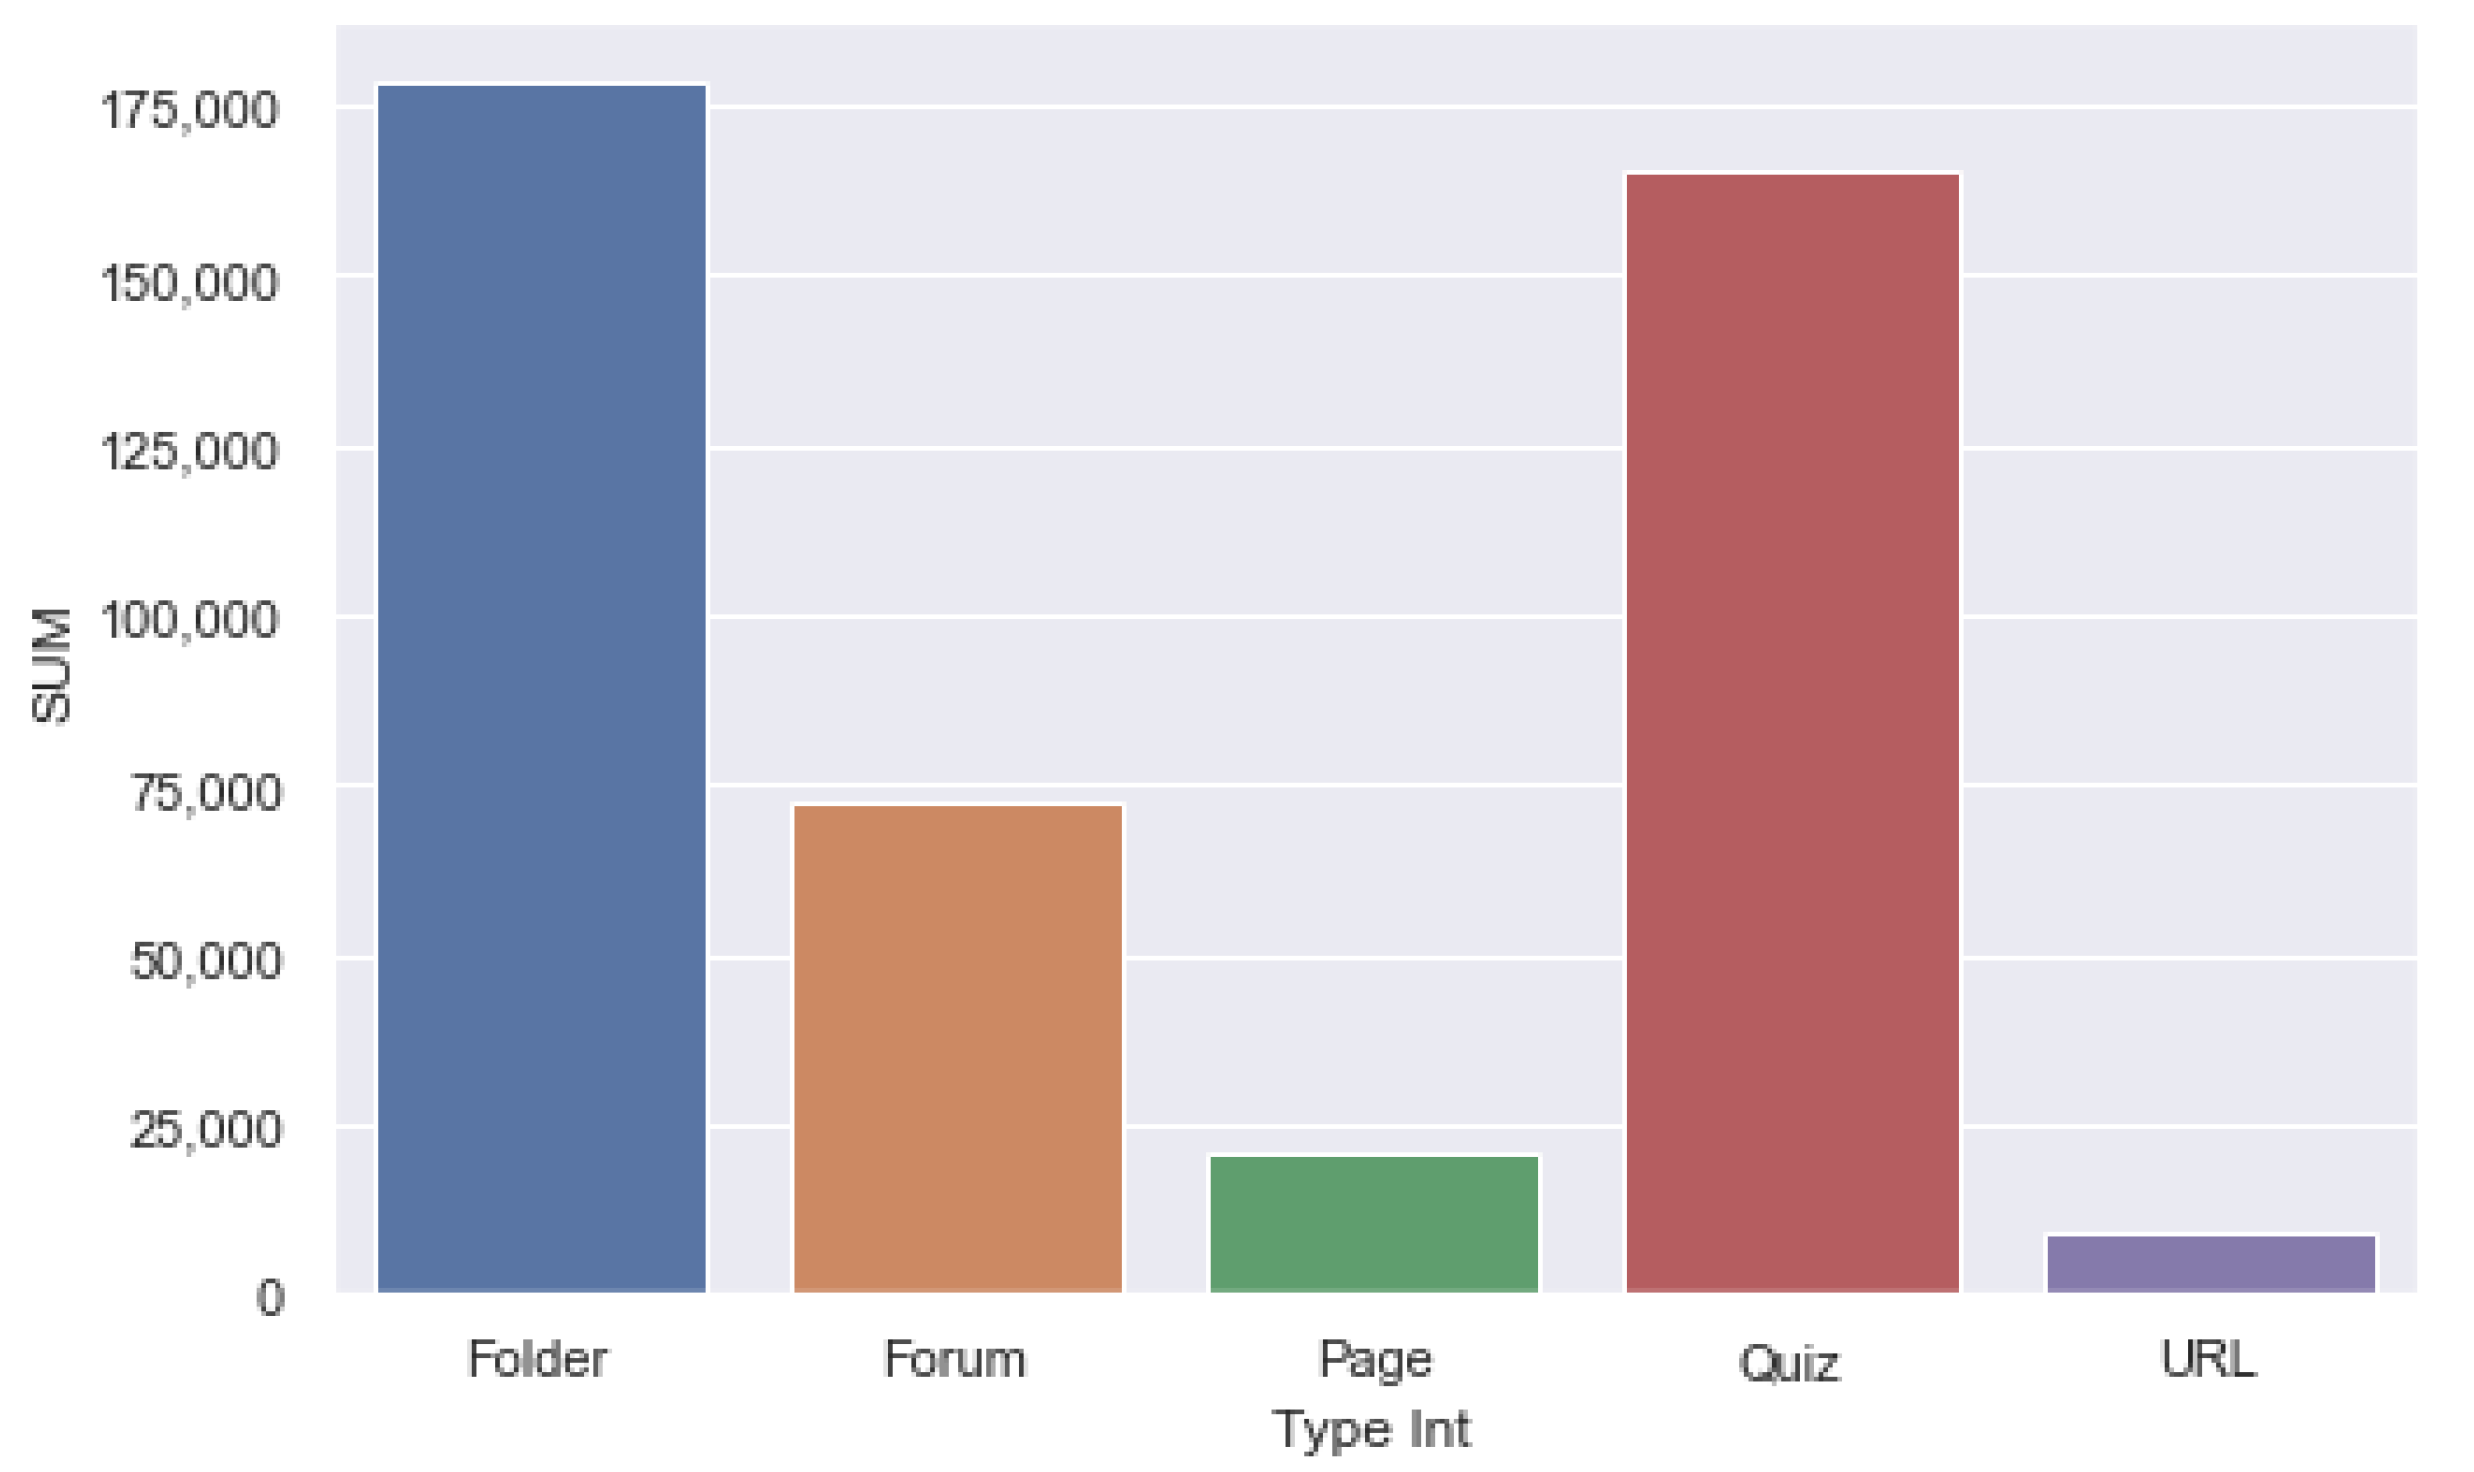
The analysis of the features used in Moodle (Figure 9) showed that Folder, Forum, Page, Quiz, and URL represented around 90% of the students’ environment interactions. From these, most were interactions with folders and quizzes.
Although they are all asynchronous tools, they can be separated into two categories: interactive and non-interactive. First, there are methods that do not interact with students or professors and are basically used as a content repository, such as Folder, Page, and URL. Second, there are others with interactions, such as forums and quizzes, but no synchronous communication was found, such as conferencing or chat.

3.5. Data Preparation

After the exploratory data analysis, the data were cleaned, and inconsistencies were treated (such as missing values). Additionally, normalization techniques were applied wherever necessary. The next steps consisted of data integration where scripts were generated to match students enrolled in the subjects with data from survey and the academic system.
The derived attributes were generated from the student’s interactions, type of interaction and subject. Subsequently, interactions were grouped every fortnight and classified according to the five main types of interactions used in Udelar’s VLE (Folder, Forum, Page, Quiz, and URL). The average number of interactions per week and the standard deviation of the interactions per week (or period) were calculated. This approach is based on previous findings [20,39,40,41] that indicated the possibility of generating models to predict at-risk students by using the VLE’s count of interactions along with the derived attributes from these counts.
The target features for both approaches were constructed based on information from the academic system. The initial academic database consisted of the student’s grade in the final exam of the subject and the retaken exam (when this was the case). Thus, two variables were generated from that. In the first scenario, we classified whether the student passed the course without retaking the final exams or if they had to retake the final exams. In the second scenario, we classified whether the student who retook the final exam had success or failure.

3.6. Modeling

This step consists of finding the best combinations of input data to generate predictive models, as well as to fine tune the hyperparameters of the algorithms used to generate the models. Data selection and data preparation were performed together with the modeling. An essential task in data mining and predictive modeling is choosing the performance evaluation metric. For this work, we chose the Area Under the Receiver Operating Characteristic Curve (AUC) [42].
The AUC is calculated from the size of the area under the plotted curve where the Y-axis is represented by the True Positive Rate (TPR) or Sensitivity (or Recall) (A1) and the X-axis is the True Negative Rate (TNR) or Specificity (A2) [43]. In order to provide a general overview of the results, the following metrics are also presented for comparison: the Accuracy (A5), F1-score (A3), and Precision (A4).
Among the classifiers initially tested, AdaBoost [44], logistic regression [45], and random forest [46] obtained the best results. However, random forest exceeded the others in practically all tested scenarios, and it was chosen for the work sequence. SKlearn’s GridSearchCV was chosen as the hyperparameter selection technique. GridSearchCV is a parameter selector that tests a combination of hyperparameters initially set and that returns the one that obtained the best results in the tested set. The data normalization technique with the best results was SKlearn’s StandardScaler.
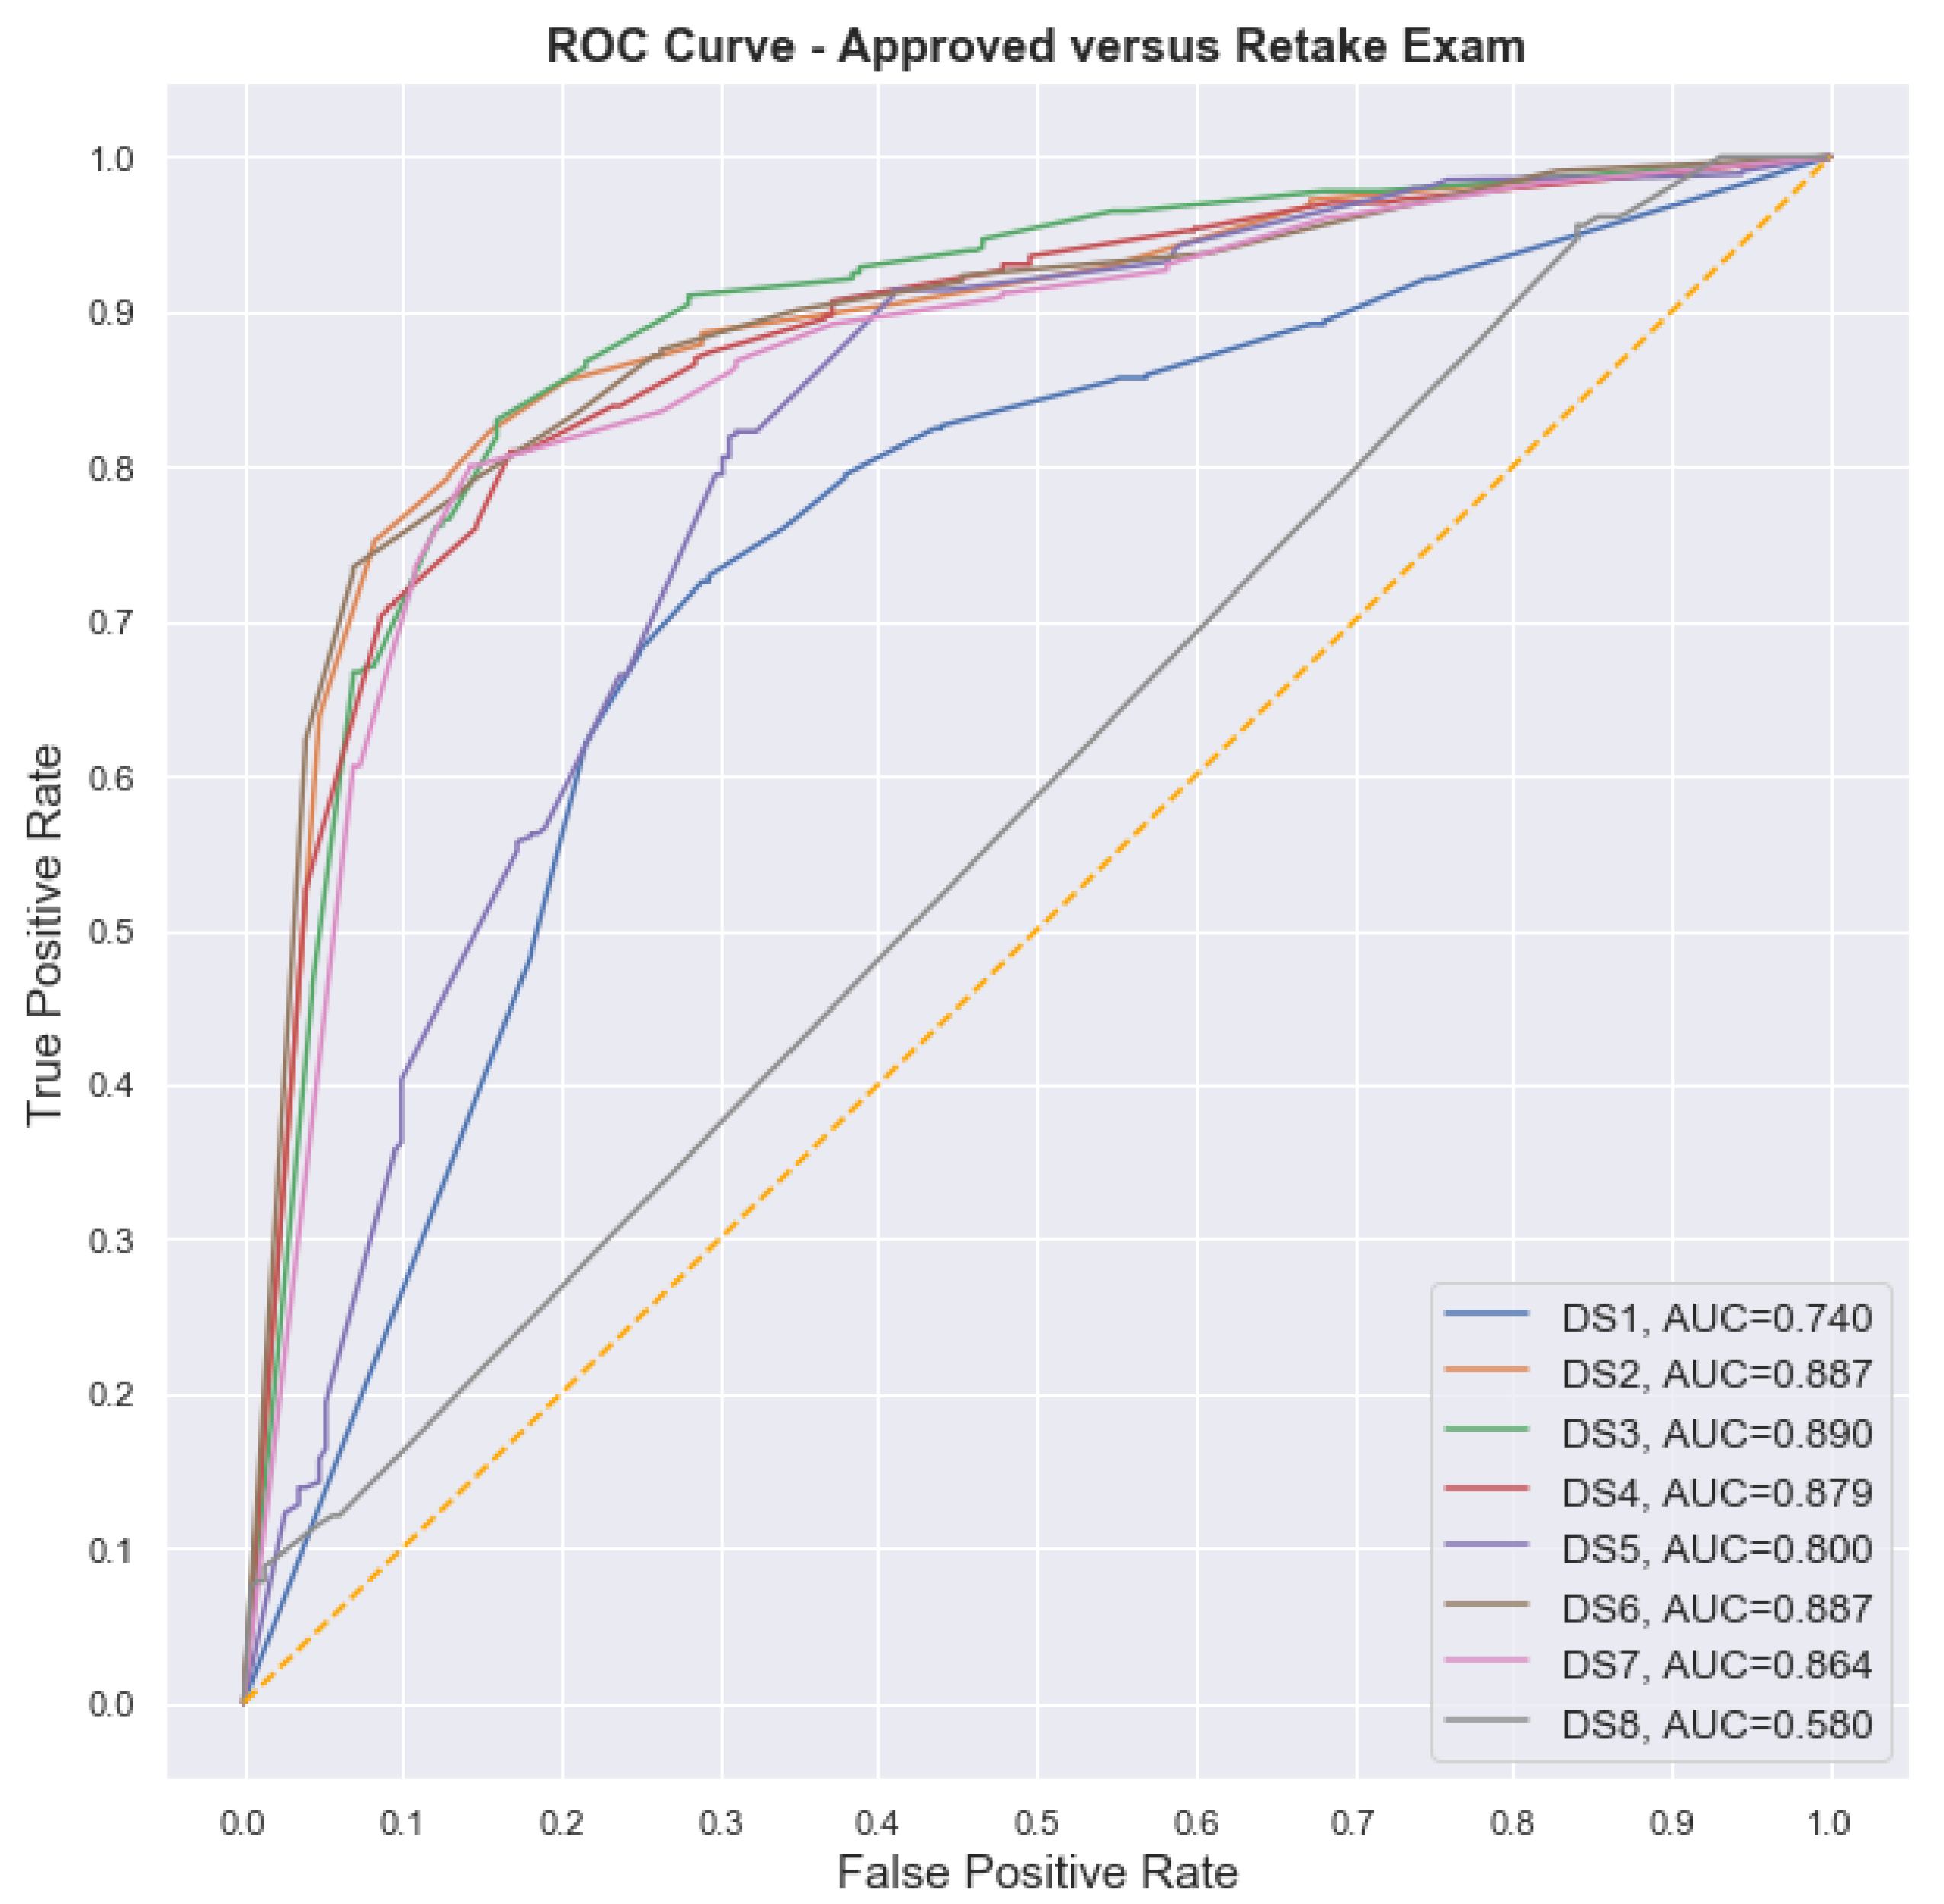
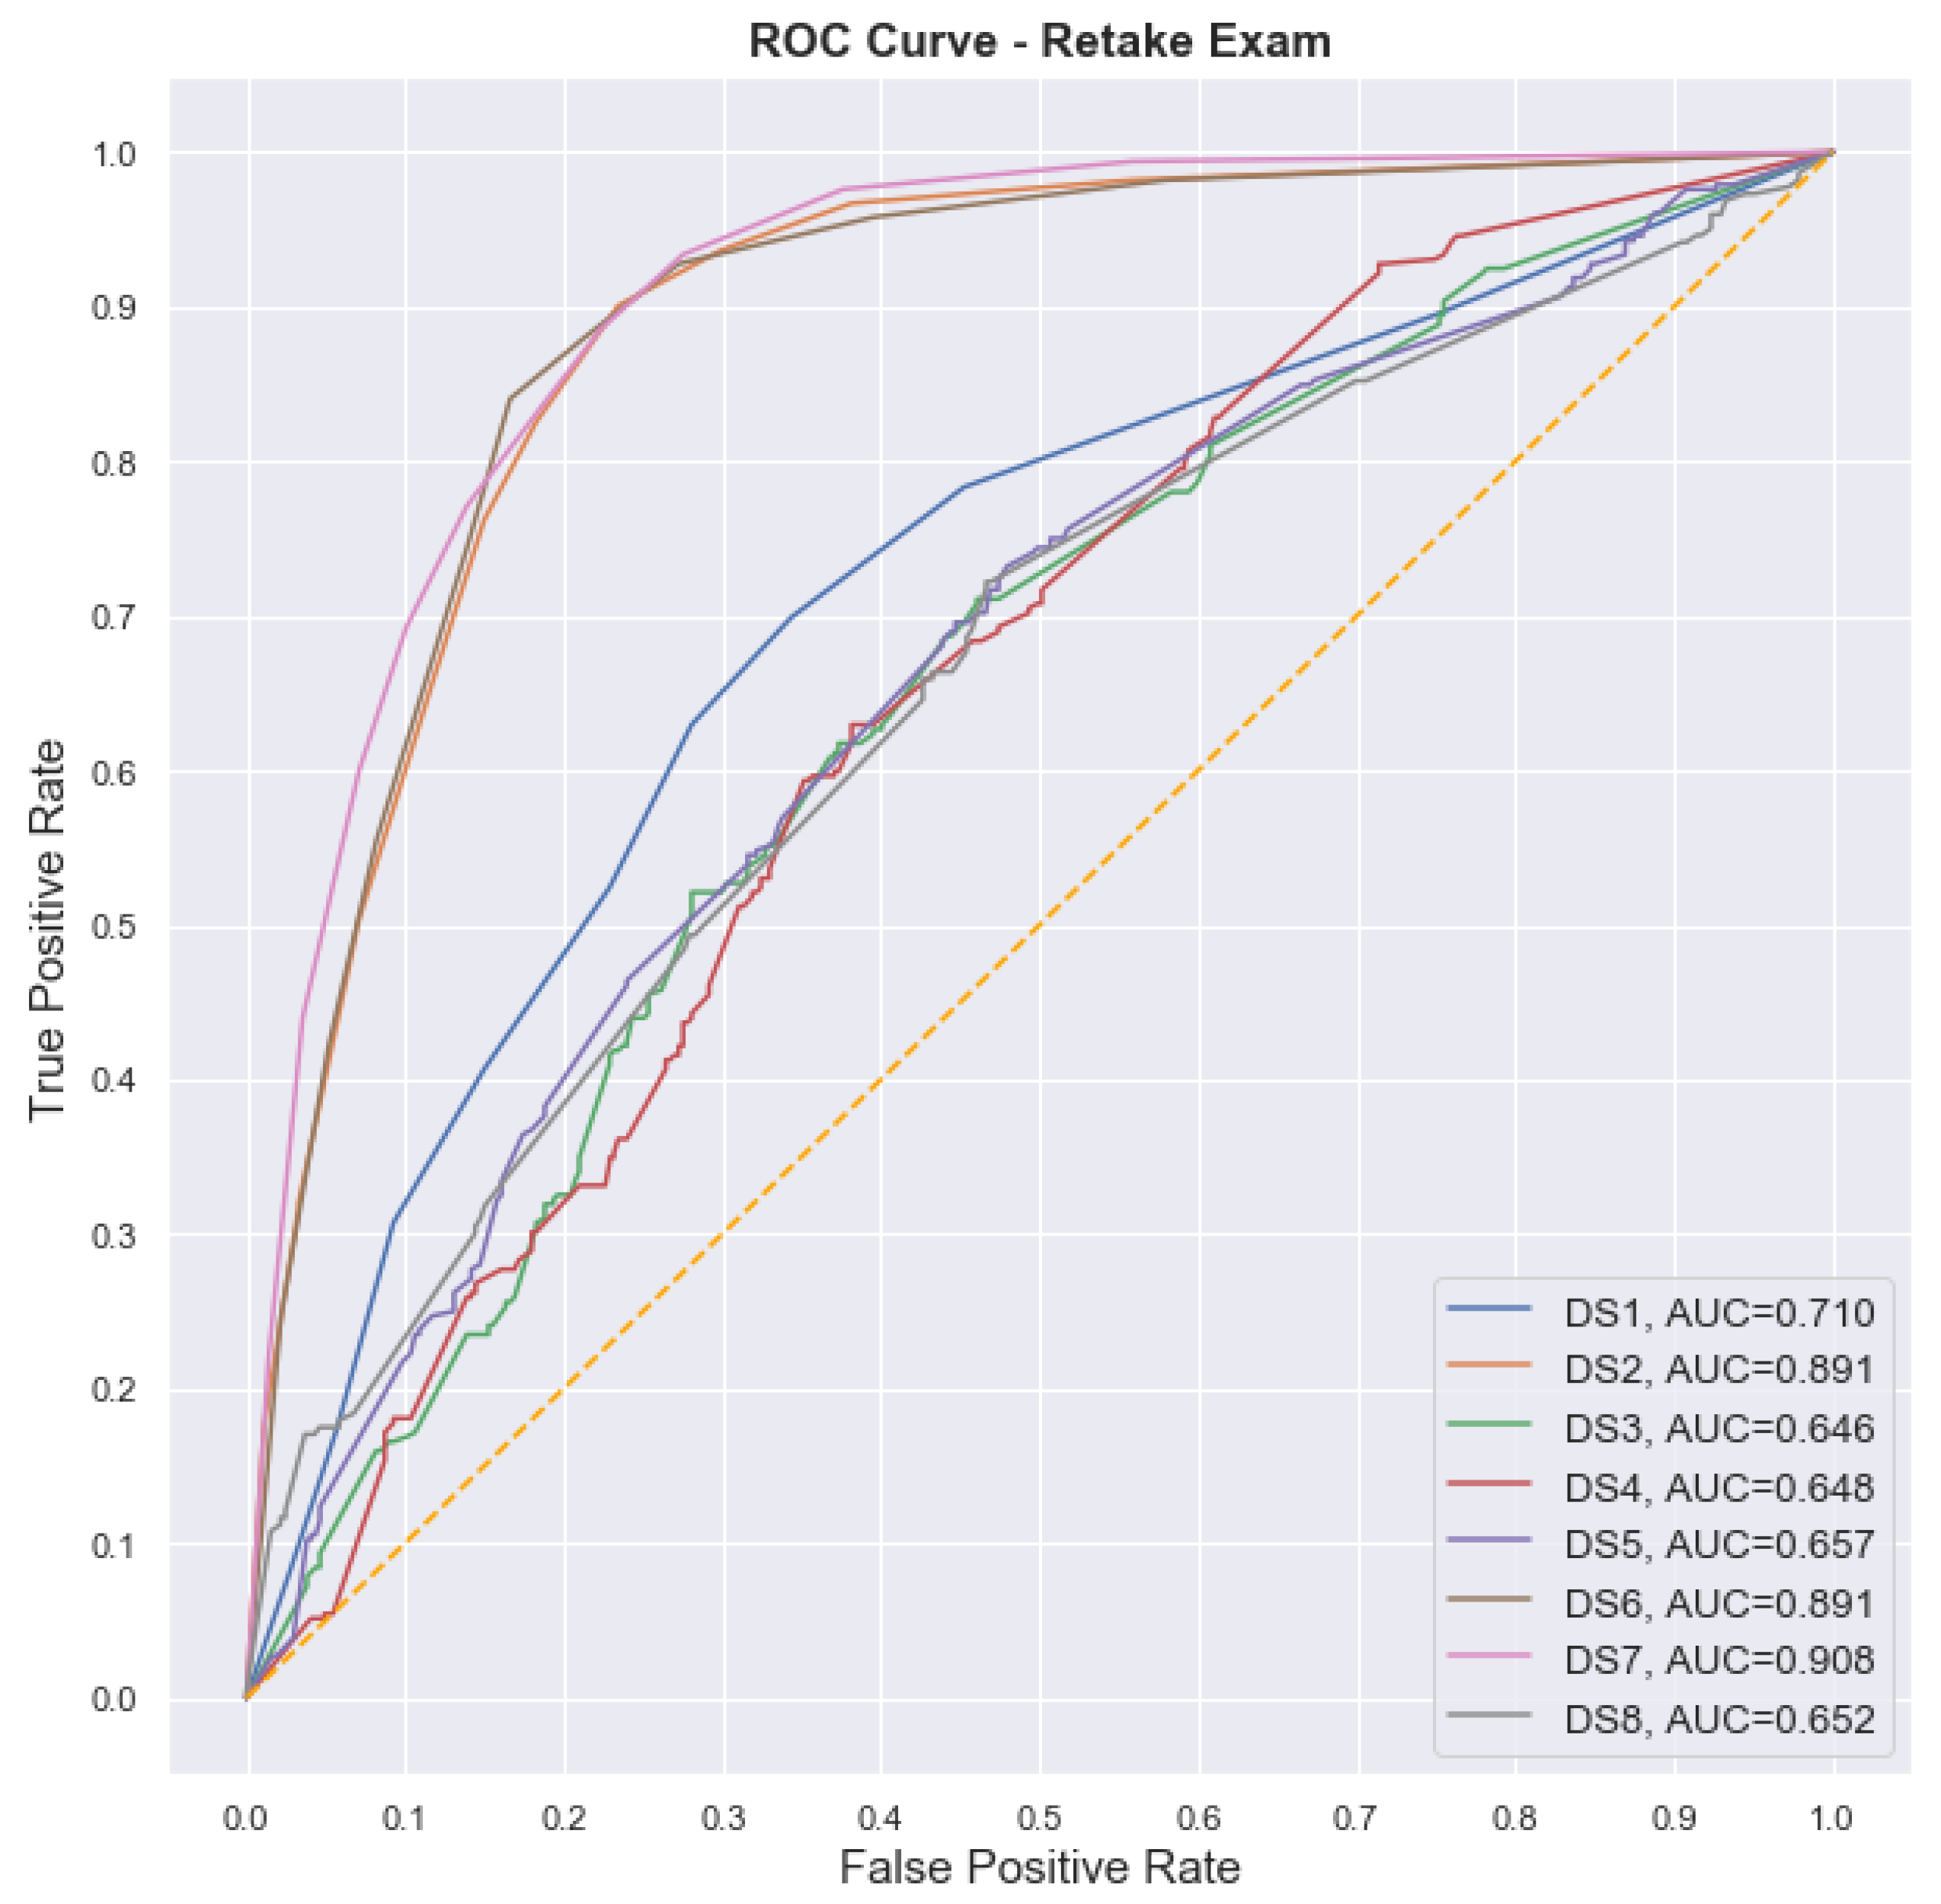
We generated eight different datasets to evaluate the extent to which the different configurations could help to improve the models’ performance, as shown in Table 4. The main idea of these configurations is to evaluate how the combination of different datasets may interfere in the models’ performance, thus, showing the importance of each database for a better prediction.
The use of DS1 seeks to assess the potential for prediction presented by the survey without any other information besides academic. DS2 is generated by adding the count of total interactions to the survey data. After the EDA, the evaluation shows that this base would be the one with the highest predictive power, being able to be considered the maximum value that can be predicted with the available data. In this way, DS2 is used to compare the gains of using information from the survey along with the information related to the count of interactions.
DS3 and DS4 contain the total count of interactions within the VLE, and DS4 also contains the type of each interaction. DS5, DS6, DS7, and DS8 aim to verify the extent to which it is possible to early predict the performance of the students, so that there is time to perform pedagogical interventions. For that, the count of interactions is performed for a limited number of weeks. All datasets that used VLE data contained the derived attributes earlier described according to the number of weeks covered by the dataset and the inclusion of the type of the interaction or not.
After defining the datasets, a random forest classifier was executed in GridSearchCV to obtain the most optimized configuration for the predictive model. The 10-fold cross-validation was used to evaluate the models. The approach to deal with unbalanced data was the Synthetic Minority Oversampling Technique (SMOTE), which generated new synthesized cases on the training datasets.

4. Results

This section presents the results obtained by the models for each scenario evaluated and considering the different datasets.

4.1. Scenario 1: Predicting Success in Final Exams

The goal here was to generate predictive models able to classify students between two groups: those who had success in the final exams and those who had to retake the exams. Table 5 presents the results for each dataset configuration and the following metrics: True Positives (TP), True Negatives (TN), Accuracy (ACC), F1-Score, Precision, and Recall. Comparing the metrics here is quite important as the AUC presented low values in some cases, as shown in Figure 10.
In the figure, True Positives (TP) represents the accuracy for classifying the successful students in the final exams and True Negatives (TN) the accuracy for classifying students who need to retake exams. This AUC low value raised the question of whether the random forest model was really learning or just classifying all students in the major category. This was the case of the classifier generated with DS8, which was able to only correctly classify a few cases of the minor category (TP = 12.58 and TN = 94.48). As evidenced in Figure 10, there was an increase in performance when using both the survey and VLE data.
The AUC shows all models with acceptable values (higher than 0.50). DS1 achieved 0.78, which can be considered excellent [43]. Moreover, DS2, DS6, and DS7 achieved values higher than 0.87 and very close to what can be considered outstanding discrimination (0.9 or higher). These are the datasets that combined information from the survey and the VLE. It is important to highlight the results obtained by using DS7, which is the dataset that used data from both the survey and the VLE’s count of interactions (including the type of interactions) for the first four weeks of the courses. This model yielded excellent results (AUC = 0.864).

4.2. Scenario 2: Predicting Approval in Retaking Exams

The second scenario aims to predict whether students will be successful after retaking exams. Table 6 presents the results for each dataset configuration and the following metrics: Positives (TP), True Negatives (TN), Accuracy (ACC), F1-Score, Precision, and Recall. Results obtained using the AUC for the different datasets are presented in Figure 11. Here, TP is the accuracy of correctly classifying a student who failed, and TN is the accuracy of correctly classifying a student who had success in the retake exam.
As shown in Figure 11, the performance of the models for the datasets DS3, DS4, DS5, and DS8 can be classified as acceptable [43]. For DS3, DS4, and DS5, the classifiers presented low accuracy to classify successful students. This leads to the conclusion that it is not recommended to use only the data coming from VLE to predict student performance in this scenario.
DS1 presented an excellent AUC but low accuracy to classify students who failed (51.23%). DS2, DS6, and DS7 presented the best results, thus, confirming that using data from the survey together with the VLE’s data was the best combination to generate predictive models. The performance achieved by the model trained with DS7 can be classified as outstanding (0.908), which allows us to say that it is possible to generate models to early-predict student performance using the survey and the interactions of the first four weeks for the present scenario.

5. Discussion

In this section, we answer the research questions proposed at the beginning of the paper.
RQ1—Is the use of VLE associated with the students’ qualifications? Yes. We found significant statistical association between the number of student interactions within the VLE and the final status (success or fail). Moreover, after the analysis, we concluded that using only the count of the interactions inside the VLE or using only survey data to generate the predictive models led to lower model performance compared with using a combination of both.
Models trained with a combination and using the count of the first four weeks (DS7) were able to achieve excellent and outstanding performances; thus, one can say that it is possible to predict students’ final status at the beginning of the courses. These findings suggest the importance of VLE in face-to-face courses, even though its usage mainly focuses on the delivery of materials and activities without much collaboration among peers. In addition, it can also be said that different VLE’s activities weigh differently inside the models, as the type of interaction also increases their performances.
The work of [20] used VLE data together with data collected from a student survey and evaluated the extent to which the use of the combination of both databases interfered in the models’ performance. The authors concluded that there was no gain in using data collected from the survey.
Moreover, the authors also tested different dataset combinations considering the different types of VLE’s presence (teaching, cognitive, and social presence), according to the theory of [47], and found no statistically significant difference in the performance of the models that used this differentiation. Their results contradict the present paper’s findings. Based on that, one could say that the use of different combinations of databases to improve the performances of the models as well as considering different types of interactions inside the VLE are context dependent.
For the present scenario, the combination of databases and the differentiation of the types of interaction helped to improve the performance of the classifiers.
RQ2—Which features from the different databases are the most important to early predict students’ performance?Figure 12 presents the fifteen most important attributes used by the models to predict student performance. The attribute that helped the most in predicting student performance was the number of subjects a student was enrolled in. This attribute is located in the academic system database, which was used in all possible scenarios and datasets of this study.
Moreover, attributes that belong to the VLE appeared most frequently in the list (week 2, mean week 2, week 4, and mean week 4, among others). Regarding the VLE attributes, it is important to notice that Forum Week 4 appears at the seventh place of importance. As the forum is used only by the professors to communicate operational/academic/administrative things about the subjects, this attribute may indicate the importance of students being up to date about the daily routine of their courses.
The importance of the types of interaction inside VLE becomes evident from the figure. Attributes Forum, Quiz, URL, and Page appear in the list of the most important attributes together with weeks 2 and 4. Regarding the survey data, it is important to mention that the educational level of the student’s mother was the third strongest attribute used by the models. The place of residence is another attribute that played an important role in the prediction.
RQ3—Which educational patterns can educational data mining help to unveil in the studied courses?
The most notable finding of the present study is VLE’s importance in the teaching-learning process and its association with the final status of the students. This finding can help institutions implement official policies focused on a more widespread dissemination of the VLE usage, along with the other existing faculties, departments, and courses at the university.
Such a policy could encompass different initiatives, such as offering practical training for professors in VLE, the inclusion of introductory subjects in the curriculum, focusing on VLE features and usage, and the increase of physical and personnel infrastructure to maintain new VLE services. Moreover, considering the high accuracy achieved by the predictive models developed here, it is now possible to use such models to follow up students more closely and intervene early on in situations that identify at-risk students.
The university may consider investing in the development of new tools and technologies to follow students’ trajectories and improve their learning experiences, e.g., through LA dashboards [48] and e-learning recommender systems [49]. We also found that the number of subjects the students were enrolled in was the strongest attribute associated with their success.
This finding may help coordinators better plan the curriculum of their courses so that students can maintain a course load up to an ideal number. Finally, two other important attributes that influence predictive models were the “mother’s education” and “place of residence”. These attributes could be monitored by the university to offer assistance aimed at students in these specific categories.

6. Towards the Implementation of Institutional Policies

This section presents a broad discussion of the results obtained in this work in order to provide evidence for the implementation of institutional policies at Udelar.

Institutional Polices Based on Evidence

University policies are public policies, and the Udelar is the main higher education institution in Uruguay. Considering that, Udelar is also responsible for proposing the agenda of such policies to transform higher education in Uruguay. In this context, it is important to bring the digital inclusion process to the debate, which requires a collective action with some key actors: decision makers, researchers, students, and professors/teachers to which the findings of this study will be useful to generate such public policies.
Furthermore, this study presents conclusions based on evidence and it is fundamental to implement public policies and to treat educational problems, such as evasion, time spent in the program/course (lag), and contextual variables (both are present here). The main beneficiaries of the paper’s findings are the general population and it is possible to quantify the impact of that on a regional and international scale. Based on this, we present a discussion considering some factors that are important to the creation and implementation of educational policies based on our findings.
We consider that, at any educational institution, especially at universities, there is more than one database with a diversity of features, and it is potentially possible to combine and mine these features to contribute to the understanding of the learning process. We consider the creation of strategies to guide the educational policies based on evidence, that is, based on empirical data (information) transformed into knowledge to be very important, necessary, and not able to be postponed.
In this paper, we show evidence on predicting, starting at the beginning of a course, what the final status of the student will be based on a combination of datasets. The use of such predictors (models) allows the manager to create, early in the course, alerts and warnings to students and professors. It is also possible to help the professors to redesign their materials and pedagogical strategies in their courses.
On the one hand, we found that the expanded classrooms were the most frequent classes in the VLEs of the faculties. On the other hand, the importance of hybrid classrooms emerged from our work, since the student performance was higher in this modality. In fact, these models are proposed in a general context of educational uncertainty and changes that are necessary for digital transformation, which has been accelerated.
However, the usefulness of these models for creating educational and institutional policies not only reaches guidelines for the individuals (students, professors, researchers, and so on) but also contributes to the understanding of the educational problems associated with backwardness and evasion, thus, helping to create policies and technical teams to support and protect educational paths.
The results highlight the importance of participants’ mediation within the online classrooms, which increases student performance. Additionally, due to the strict relation between the learning and teaching process, the lecturers’ formation policies should point to the development of digital skills to allow them to include hybrid models in their teaching–learning process.
Our findings present evidence that the students’ age is an important factor using the VLE: the younger they are, the more they use the VLE. In this context, it is good to raise different pedagogical hypotheses to attempt to understand this behavior. If students older than 25 years old do not frequently use the VLE, it is mandatory to develop pedagogical policies to guide strategies to digital literacy focusing on these different groups of students in order to mitigate evasion and to promote lifelong education development supported by educational technologies. This is particularly important in Latin America, where educational institutions tend to present retention problems.
The distribution of interactions during the courses present differences among the subjects and disciplinary areas but are roughly similar when comparing the final status of the students. Those students who had the least interactions were the the ones who tended to fail in the courses. Why did they not use the VLE? Can it be due to educational causes, where the student infers that there is no new content, material, or changes in the teaching process? Or is it an individual cause, where the student infers that it is not necessary to revisit the content and only carry out the tests and assessments to have success?
In this case, we suggest the development of actions addressed to those students who fail, stimulating them to use the VLE through instructional design specifically dedicated to this population. The other way around, successful students had more interactions within the VLE, and this raises more questions: why did they have success in the subject? Is it due to the interactions with educational technologies? These are all questions that still need to be answered and that will help with the development of institutional policies based on evidence.
The VLE interactions appear to be a very strong indicator of a student’s commitment to their studies. It shows how they tackle the learning process and what their strategies are to achieve success. Furthermore, students that sustained their participation permanently within the VLE over the whole semester were more likely to pass than students who participatee only at the end, even when they used the environment intensively (but still less than the successful students). The comparison between the student trajectories in VLE shows learning strategies that resulted in better performance and allow for the development of protection policies based on evidence. One way to do this is to design teaching and learning paths considering these students and their strategies.
The incorporation of the VLE in the educational processes of undergraduate teaching at Udelar has reached a point of naturalization. The results of the present study show the relevance of understanding the relations between the behavior of the students inside the VLE and their success in their disciplines, as this allows one to define didactic strategies, pedagogical orientations, and educational policies based on that.
Even though a VLE produces, collects, and stores a large amount of data about students and teachers interactions, there are a number of challenges and difficulties to face before properly transforming this data into meaningful knowledge. For that, specific computational strategies and tools are required. The present work also presents a contribution in this matter, as it provides a methodological framework that uses both EDM and LA to better understand students behavior inside a VLE.

7. Conclusions, Limitations, and Future Research

The present paper analyzed different aspects of data involving students enrolled in courses at the Universidad de la República in Uruguay. Precisely, we collected data from 4529 students of three programs and through three different sources: the academic system, an academic survey, and a VLE. We applied data science techniques (visualizations, statistics, and data mining) to understand how different combinations of the datasets could help predict students’ final status in the subjects and the role that different attributes played in this task.
The results presented an overview of the institutional patterns regarding the use of the VLE, and this will help pave the way for the implementation of future policies in institutions to diminish student failures and increase persistence. Among the findings was an association between the use of the VLE and the final status of the students (success and fail) and also the different types of activities inside the VLE presenting different levels of importance in this association.
Examples of institutional policies that could emerge from these findings are as follows: the allocation of extra computational resources for improving VLE infrastructure and its widespread use in the university, the development of new tools for following students’ trajectory and detecting at-risk students at early stages of their courses, and the construction of more institutional policies to mitigate students’ failure based on other relevant attributes (e.g., the number of subjects the student is enrolled in, the student’s mother’s education, and the student’s neighborhood).
The proposed methodology for combining different data sources, as well as their pre-processing and feature engineering, demonstrated that the combination of data had a high predictive power. In this regard, the combination of the survey variables, academic system, and virtual environment showed a high capacity for early prediction. Thus, it was possible to achieve prediction rates with outstanding discrimination as soon as in the fourth week of the course. This characteristic satisfies the temporal factor of precocity, which is considered to be a determining factor in identifying and attempting to reverse the problem [31,50].
This proposed approach model, although initially restricted to only three university programs, can serve as a basis for future work that seeks to implement methods of online information and prediction on student behavior, such as academic dashboards. However, for these steps, it is still necessary to clarify two key points: how this approach would behave with more data and the analysis of its acceptance regarding the technology and the reliability of the methods by the stakeholders, teachers, and students.
The present work can help the university to develop user profiles based on the students practices inside the VLE, thus, allowing the future development of systems able to continuously deliver indicators related to the learning processes. In this way, it contributes to the production of primary information that can potentially help to the evaluation of quality and the definition of strategies that guide the university teaching and learning processes.
One limitation of the present work is the lack of a qualitative analysis of the scenarios. Future work could explore the opinions of students and professors regarding the usage and importance of the VLE in their teaching and learning processes. Another limitation is the restricted number of courses used in this study. As mentioned before, Udelar has 100 undergraduate courses and the number of courses studied here (only three) can not be considered representative of the whole university, even though it serves for the purpose of an initial assessment. Future work could expand the data analyzed by increasing the number of courses. Future work could also include new data covering the period of the COVID-19 pandemic and evaluate how this period influenced the behavior of the students inside the VLE.
Moreover, future work could explore a voting scheme with the learning algorithms utilized here (AdaBoost, logistic regression, and random forest) to improve the accuracy of the predictions. Finally, it would be interesting to also explore the reasoning followed by the predictors developed here, thus, assisting the stakeholders to better understand the role each feature plays in the classification.
Finally, traditional approaches to the investigation of student persistence in the teaching–learning process are normally carried out from the sociology of education and educational sciences with a fundamentally deductive perspective. The introduction of data science tools with inductive approaches challenges and empowers traditional theoretical and methodological models of educational science. The construction of this interdisciplinary exchange bridge is perhaps the most significant contribution to the academic community that may help in constructing university educational policies.

Author Contributions

E.M.Q.: experimental data analysis, algorithms development, experiments conduction, results description, and manuscript writing; C.C.: methodology definition, experiments setup, and writing; A.P.C.: virtual courses setup, server administration, data setup, and pre-processing; V.R.P.: writing, editing, review, and educational policies proposals; L.R.B.: writing; V.F.C.R.: writing, review, and editing; C.R.E.: writing, editing, review, and educational policy proposals. The manuscript was written and approved to submit by all authors. All authors have read and agreed to the published version of the manuscript.

Funding

This work was supported by Faculty of Nursing of Udelar (University of the Republic) through PIMCEU project and by CNPq (Brazilian National Council for Scientific and Technological Development) [Edital Universal, proc.404369/2016-2] [DT-2 Productivity in Technological Development and Innovative Extension scholarship, proc.315445/2018-1].

Data Availability Statement

Please contact the authors for data requests.

Conflicts of Interest

The authors declare no conflict of interest.

Abbreviations

The following abbreviations are used in this manuscript:
EDMEducational Data Mining
LALearning Analytics
UdelarUniversity of the Republic
VLEVirtual Learning Environments
LMSLearning Management Systems
MoodleModular Object-Oriented Dynamic Learning Environment
LSTMLong Short Term Memory
CRISP-DMCross-Industry Standard Process for Data Mining
SLRSelf-Regulated Learning
KDDKnowledge Discovery in Databases

Appendix A. Formulas

True Positive Rate (TPR) or Sensitivity (or Recall)
T P R = T P T P + F N
True Negative Rate (TNR) or Specificity
T N R = T N T N + F P
F-Score
F 1 S c o r e = 2 X P r e c i s i o n R e c a l l P r e c i s i o n + R e c a l l
Precision
P r e c i s i o n = T P T P + F P
Accuracy
A c c u r a c y = T P + T N T P + F P + T N + F N

References

  1. Hilliger, I.; Ortiz-Rojas, M.; Pesántez-Cabrera, P.; Scheihing, E.; Tsai, Y.S.; Muñoz-Merino, P.J.; Broos, T.; Whitelock-Wainwright, A.; Pérez-Sanagustín, M. Identifying needs for learning analytics adoption in Latin American universities: A mixed-methods approach. Internet High. Educ. 2020, 45, 100726. [Google Scholar] [CrossRef]
  2. Kurilovas, E. On data-driven decision-making for quality education. Comput. Hum. Behav. 2020, 107, 105774. [Google Scholar] [CrossRef]
  3. McKnight, K.; O’Malley, K.; Ruzic, R.; Horsley, M.K.; Franey, J.J.; Bassett, K. Teaching in a digital age: How educators use technology to improve student learning. J. Res. Technol. Educ. 2016, 48, 194–211. [Google Scholar] [CrossRef]
  4. Palacios, C.A.; Reyes-Suárez, J.A.; Bearzotti, L.A.; Leiva, V.; Marchant, C. Knowledge discovery for higher education student retention based on data mining: Machine learning algorithms and case study in Chile. Entropy 2021, 23, 485. [Google Scholar] [CrossRef] [PubMed]
  5. Salazar-Fernandez, J.P.; Sepúlveda, M.; Munoz-Gama, J.; Nussbaum, M. Curricular Analytics to Characterize Educational Trajectories in High-Failure Rate Courses That Lead to Late Dropout. Appl. Sci. 2021, 11, 1436. [Google Scholar] [CrossRef]
  6. Gómez-Pulido, J.A.; Park, Y.; Soto, R. Advanced Techniques in the Analysis and Prediction of Students’ Behaviour in Technology-Enhanced Learning Contexts. 2020. Available online: https://www.mdpi.com/2076-3417/10/18/6178 (accessed on 3 May 2021).
  7. OECD. Benchmarking Higher Education System Performance; OECD Publishing: Paris, France, 2019; p. 644. [Google Scholar] [CrossRef]
  8. Gralka, S. Persistent inefficiency in the higher education sector: Evidence from Germany. Educ. Econ. 2018, 26, 373–392. [Google Scholar] [CrossRef] [Green Version]
  9. Aldowah, H.; Al-Samarraie, H.; Fauzy, W.M. Educational data mining and learning analytics for 21st century higher education: A review and synthesis. Telemat. Inform. 2019, 37, 13–49. [Google Scholar] [CrossRef]
  10. Moissa, B.; Gasparini, I.; Kemczinski, A. A systematic mapping on the learning analytics field and its analysis in the massive open online courses context. Int. J. Distance Educ. Technol. (IJDET) 2015, 13, 1–24. [Google Scholar] [CrossRef]
  11. Romero, C.; Ventura, S. Educational Data Mining: A Review of the State of the Art. IEEE Trans. Syst. Man Cybern. Part C Appl. Rev. 2010, 40, 601–618. [Google Scholar] [CrossRef]
  12. Kabathova, J.; Drlik, M. Towards Predicting Student’s Dropout in University Courses Using Different Machine Learning Techniques. Appl. Sci. 2021, 11, 3130. [Google Scholar] [CrossRef]
  13. Brown, M. Learning analytics: Moving from concept to practice. In EDUCAUSE Learning Initiative, v. 7; 2012; pp. 1–5. Available online: https://library.educause.edu/-/media/files/library/2012/7/elib1203-pdf.pdf (accessed on 24 June 2021).
  14. Waheed, H.; Hassan, S.U.; Aljohani, N.R.; Hardman, J.; Alelyani, S.; Nawaz, R. Predicting academic performance of students from VLE big data using deep learning models. Comput. Hum. Behav. 2020, 104, 106189. [Google Scholar] [CrossRef] [Green Version]
  15. Gasevic, D.; Tsai, Y.; Dawson, S.; Pardo, A. How do we start? An approach to learning analytics adoption in higher education. Int. J. Inf. Learn. Technol. 2019, 36, 342–353. [Google Scholar] [CrossRef] [Green Version]
  16. Alghamdi, A.; Karpinski, A.C.; Lepp, A.; Barkley, J. Online and face-to-face classroom multitasking and academic performance: Moderated mediation with self-efficacy for self-regulated learning and gender. Comput. Hum. Behav. 2020, 102, 214–222. [Google Scholar] [CrossRef]
  17. Xia, X. Interaction recognition and intervention based on context feature fusion of learning behaviors in interactive learning environments. In Interactive Learning Environments; 2021; pp. 1–18. Available online: https://www.tandfonline.com/doi/full/10.1080/10494820.2021.1871632 (accessed on 24 June 2021).
  18. MOODLE. Statistics. 2020. Available online: https://stats.moodle.org/ (accessed on 3 April 2020).
  19. Hegazi, M.O.; Abugroon, M.A. The state of the art on educational data mining in higher education. Int. J. Comput. Trends Technol. 2016, 31, 46–56. [Google Scholar] [CrossRef]
  20. Macarini, B.; Antonio, L.; Cechinel, C.; Batista Machado, M.F.; Faria Culmant Ramos, V.; Munoz, R. Predicting Students Success in Blended Learning—Evaluating Different Interactions Inside Learning Management Systems. Appl. Sci. 2019, 9, 5523. [Google Scholar] [CrossRef] [Green Version]
  21. Leitner, P.; Ebner, M.; Ebner, M. Learning Analytics Challenges to Overcome in Higher Education Institutions. In Utilizing Learning Analytics to Support Study Success; Ifenthaler, D., Mah, D.K., Yau, J.Y.K., Eds.; Springer: Cham, Switzerland, 2019; pp. 91–104. ISBN 978-3-319-64792-0. [Google Scholar] [CrossRef]
  22. Rastrollo-Guerrero, J.L.; Gómez-Pulido, J.A.; Durán-Domínguez, A. Analyzing and Predicting Students’ Performance by Means of Machine Learning: A Review. Appl. Sci. 2020, 10, 1042. [Google Scholar] [CrossRef] [Green Version]
  23. Cechinel, C.; Ochoa, X.; Lemos dos Santos, H.; Carvalho Nunes, J.B.; Rodés, V.; Marques Queiroga, E. Mapping Learning Analytics initiatives in Latin America. Br. J. Educ. Technol. 2020, 51, 892–914. [Google Scholar] [CrossRef]
  24. Chui, K.T.; Fung, D.C.L.; Lytras, M.D.; Lam, T.M. Predicting at-risk university students in a virtual learning environment via a machine learning algorithm. Comput. Hum. Behav. 2020, 107, 105584. [Google Scholar] [CrossRef]
  25. Ding, M.; Yang, K.; Yeung, D.Y.; Pong, T.C. Effective Feature Learning with Unsupervised Learning for Improving the Predictive Models in Massive Open Online Courses. In Proceedings of the 9th International Conference on Learning Analytics & Knowledge; LAK19; ACM: New York, NY, USA, 2019; pp. 135–144. [Google Scholar] [CrossRef] [Green Version]
  26. Foster, E.; Siddle, R. The effectiveness of learning analytics for identifying at-risk students in higher education. Assess. Eval. High. Educ. 2020, 45, 842–854. [Google Scholar] [CrossRef]
  27. Gutiérrez, F.; Seipp, K.; Ochoa, X.; Chiluiza, K.; De Laet, T.; Verbert, K. LADA: A learning analytics dashboard for academic advising. Comput. Hum. Behav. 2020, 107, 105826. [Google Scholar] [CrossRef]
  28. Lee, S.; Chung, J. The Machine Learning-Based Dropout Early Warning System for Improving the Performance of Dropout Prediction. Appl. Sci. 2019, 9, 3093. [Google Scholar] [CrossRef] [Green Version]
  29. Herodotou, C.; Rienties, B.; Verdin, B.; Boroowa, A. Predictive learning analytics ‘at scale’: Towards guidelines to successful implementation in Higher Education based on the case of the Open University UK. J. Learn. Anal. 2019, in press. [Google Scholar] [CrossRef] [Green Version]
  30. Li, Q.; Baker, R.; Warschauer, M. Using clickstream data to measure, understand, and support self-regulated learning in online courses. Internet High. Educ. 2020, 45, 100727. [Google Scholar] [CrossRef]
  31. Lykourentzou, I.; Giannoukos, I.; Nikolopoulos, V.; Mpardis, G.; Loumos, V. Dropout prediction in e-learning courses through the combination of machine learning techniques. Comput. Educ. 2009, 53, 950–965. [Google Scholar] [CrossRef]
  32. Tlili, A.; Denden, M.; Essalmi, F.; Jemni, M.; Chang, M.; Kinshuk; Chen, N.S. Automatic modeling learner’s personality using learning analytics approach in an intelligent Moodle learning platform. In Interactive Learning Environments; 2019; pp. 1–15. Available online: https://www.tandfonline.com/doi/abs/10.1080/10494820.2019.1636084?journalCode=nile20 (accessed on 24 June 2021). [CrossRef]
  33. Hu, Q.; Rangwala, H. Reliable Deep Grade Prediction with Uncertainty Estimation. In Proceedings of the 9th International Conference on Learning Analytics & Knowledge; LAK19; ACM: New York, NY, USA, 2019; pp. 76–85. [Google Scholar] [CrossRef] [Green Version]
  34. Pintrich, P.R. The role of goal orientation in self-regulated learning. In Handbook of Self-Regulation; Elsevier: Amsterdam, The Netherlands, 2000; pp. 451–502. [Google Scholar]
  35. Wirth, R.; Hipp, J. CRISP-DM: Towards a standard process model for data mining. In Proceedings of the 4th International Conference on the Practical Applications of Knowledge Discovery and Data Mining; Springer-Verlag: London, UK, 2000; Volume 1, pp. 29–39. [Google Scholar]
  36. Dirección General de Planeamiento. Estadísticas Básicas 2018 de la Universidad de la República; Technical Report; Universidad de la República: Montevideo, Uruguay, 2018. [Google Scholar]
  37. Universidad de la República. Relevamiento de Estudiantes: Udelar Crece y Democratiza. 2019. Available online: http://www.universidad.edu.uy/prensa/renderItem/itemId/43652/refererPageId/12 (accessed on 3 June 2021).
  38. Rodés, V.; Canuti, L.; Regina Motz, N.M. Aplicando una categorización a diseños educativos de cursos en entornos virtuales. Calid. Y Accesibilidad De La Form. Virtual 2012, 1, 425–432. [Google Scholar]
  39. Queiroga, E.M.; Lopes, J.L.; Kappel, K.; Aguiar, M.; Araújo, R.M.; Munoz, R.; Villarroel, R.; Cechinel, C. A Learning Analytics Approach to Identify Students at Risk of Dropout: A Case Study with a Technical Distance Education Course. Appl. Sci. 2020, 10, 3998. [Google Scholar] [CrossRef]
  40. Queiroga, E.; Cechinel, C.; Araújo, R. Predição de estudantes com risco de evasão em cursos técnicos a distância. In Anais da XXVIII Brazilian Symposium on Computers in Education (Simpósio Brasileiro de Informática na Educação (SBIE 2017)); de Menezes, C.S., Melo, J., Eds.; Sociedade Brasileira de Computação—SBC: Recife, Brazil, 2017; pp. 1547–1556. [Google Scholar]
  41. Machado, M.; Cechinel, C.C.; Ramos, V. Comparação de diferentes configurações de bases de dados para a identificação precoce do risco de reprovação: O caso de uma disciplina semipresencial de Algoritmos e Programação. Braz. Symp. Comput. Educ. (Simpósio Bras. De Inform. Na Educ. SBIE) 2018, 29, 1503. [Google Scholar] [CrossRef] [Green Version]
  42. Kuhn, M.; Johnson, K. Applied Predictive Modeling; Springer: Berlin/Heidelberg, Germany, 2013; Volume 26. [Google Scholar] [CrossRef]
  43. Gašević, D.; Dawson, S.; Rogers, T.; Gasevic, D. Learning analytics should not promote one size fits all: The effects of instructional conditions in predicting academic success. Internet High. Educ. 2016, 28, 68–84. [Google Scholar] [CrossRef] [Green Version]
  44. Schapire, R.E. Explaining adaboost. In Empirical Inference; Springer: Berlin/Heidelberg, Germany, 2013; pp. 37–52. [Google Scholar]
  45. Russell, S.; Norvig, P. Artificial Intelligence: A Modern Approach, Global Edition, 4th ed.; Foundations, v. 19; Pearson Deutschland GmbH: München, Germany, 2021; p. 23. [Google Scholar]
  46. Liu, Y.; Wang, Y.; Zhang, J. New Machine Learning Algorithm: Random Forest. In Information Computing and Applications; Liu, B., Ma, M., Chang, J., Eds.; Springer Berlin Heidelberg: Berlin/Heidelberg, Germany, 2012; pp. 246–252. [Google Scholar]
  47. Garrison, D.R.; Anderson, T.; Archer, W. Critical inquiry in a text-based environment: Computer conferencing in higher education. Internet High. Educ. 1999, 2, 87–105. [Google Scholar] [CrossRef] [Green Version]
  48. Einhardt, L.; Tavares, T.A.; Cechinel, C. Moodle analytics dashboard: A learning analytics tool to visualize users interactions in moodle. In Proceedings of the 2016 XI Latin American Conference on Learning Objects and Technology (LACLO), San Carlos, Costa Rica, 3–7 October 2016; pp. 1–6. [Google Scholar]
  49. dos Santos, H.L.; Cechinel, C.; Araújo, R.M. A comparison among approaches for recommending learning objects through collaborative filtering algorithms. Program 2017, 51, 35–51. [Google Scholar] [CrossRef]
  50. Márquez-Vera, C.; Cano, A.; Romero, C.; Noaman, A.Y.M.; Mousa Fardoun, H.; Ventura, S. Early dropout prediction using data mining: A case study with high school students. Expert Syst. 2016, 33, 107–124. [Google Scholar] [CrossRef]
Figure 1. CRISP-DM with adaptation.
Applsci 11 06811 g001
Figure 2. The proposed solution.
Applsci 11 06811 g002
Figure 3. Dispersion between interactions and age.
Applsci 11 06811 g003
Figure 4. Interactions per weeks approval X failed.
Applsci 11 06811 g004
Figure 5. Interactions per weeks.
Applsci 11 06811 g005
Figure 6. Sum and mean interactions by subject.
Applsci 11 06811 g006
Figure 7. Distribution of interactions by courses.
Applsci 11 06811 g007
Figure 8. Number of subjects enrolled versus final status.
Applsci 11 06811 g008
Figure 9. Type of interactions.
Applsci 11 06811 g009
Figure 10. ROC Success in a course.
Applsci 11 06811 g010
Figure 11. ROC Success in the exam.
Applsci 11 06811 g011
Figure 12. Feature importance.
Applsci 11 06811 g012
Table 2. Description of the student population and final status.
CollegeTotal of InteractionsSubjectsStudentsSuccessFail
Final ExamRetake Exam
BIO23,60635904316
COM150,62351361820318223
NUR955,163631099149011294
Total1,129,392144529308912621533
Table 3. Statistical analysis.
StatusShapiroMann–WhitneyMeanMediant-Test
Statisticp-ValueStatisticp-ValueStatisticp-Value
BIOAllSuccess0.9590.138--442.8465−2.1940.0322
Failed0.9610.684 285.1316
BIO W4Success0.8410.00208.50.0016.5511--
Failed0.6730.00 72.5
BIO W8Success0.8970.001188.50.0081.1892--
Failed0.7720.001 34.933.5
FIC AllSuccess0.7570.00109,676.50.00113.785--
Failed0.7910.00 94.7273
FIC W4Success0.4330.00114,591.50.003.382.5--
Failed0.3930.00 1.190
FIC W8Success0.5030.00114,197.00.0016.977.5--
Failed0.2780.00 4.580
NUR AllSuccess0.8140.001,061,837.50.00295.1235--
Failed0.8920.00 324.2259.5
NUR W4Success0.2900.001,148,365.00.050.594--
Failed0.3500.00 0.430
NUR W8Success0.2790.001,135,913.00.020.8713--
Failed0.5140.00 0.850
Table 4. Configuration of the different datasets.
DatasetAcademic DataSurveyVLEType of InteractionNumber of Weeks
DS1YESYESNO--
DS2YESYESYESYES16
DS3YESNOYESNO16
DS4YESNOYESYES16
DS5YESNOYESYES8
DS6YESYESYESYES8
DS7YESYESYESYES4
DS8YESNOYESYES4
Table 5. Predicting success in the final exams versus retaking exams.
DSTPTNACCF1-ScorePrecisionRecall
DS176.9664.0472.400.720.720.72
DS288.4179.0085.090.850.850.85
DS385.9777.1682.870.820.820.82
DS486.9876.1183.000.830.830.83
DS582.8375.0680.090.800.800.80
DS687.4175.0683.050.830.820.83
DS788.1273.7583.050.820.820.83
DS812.5894.4841.480.320.650.41
Table 6. Predicting success in retaking the exam versus failure.
DSTPTNACCF1-ScorePrecisionRecall
DS176.9664.0472.400.720.720.72
DS288.4179.0085.090.850.850.85
DS385.9777.1682.870.820.820.82
DS486.9876.1183.000.830.830.83
DS582.8375.0680.090.800.800.80
DS687.4175.0683.050.830.820.83
DS788.1273.7583.050.820.820.83
DS812.5894.4841.480.320.650.41
Publisher’s Note: MDPI stays neutral with regard to jurisdictional claims in published maps and institutional affiliations.

