Experimental exposure assessment of designed chemical mixtures in cell-based in vitro bioassays
 Luise Henneberger1*
  Julia Huchthausen1 Maria König1 Alina Menge1 Niklas Wojtysiak1 Beate I. Escher1,2
- 1Helmholtz Centre for Environmental Research—UFZ, Department of Cell Toxicology, Leipzig, Germany
- 2Department of Geosciences, Environmental Toxicology, Eberhard Karls University Tübingen, Tübingen, Germany
Cell-based bioassays are useful tools for the effect assessment of complex mixtures, but so far exposure assessment has not been performed for mixtures of chemicals. In the present study, cytotoxicity and activation of oxidative stress response were measured for three designed chemical mixtures with up to twelve components. The measurements of biological responses were complemented by concentration measurements using solid-phase microextraction to derive the freely dissolved concentrations of the mixtures (Cfree,mix). The tested mixtures showed slightly higher cytotoxic effects than predicted by the concentration addition model. Nominal and freely dissolved effect concentrations of the mixtures were very similar (within a factor of 1.5), but nominal concentrations (Cnom) and Cfree of the individual mixture components were only similar for the hydrophilic chemicals (e.g., caffeine, coumarin, lamotrigine). For hydrophobic (e.g., fluoranthene) and acidic chemicals (e.g., diclofenac, naproxen) Cfree was up to 648 times lower than Cnom. Chemicals were dosed in equipotent nominal concentration ratios and therefore contributed equally to the detected effects. Hydrophilic chemicals with low potency dominated Cnom,mix (up to 95%) and Cfree,mix (up to 99%). Several mixture components (e.g., diclofenac, ibuprofen, naproxen and warfarin) showed increasing free fractions with increasing Cnom,mix and therefore also a concentration-dependent contribution to Cfree,mix. Based on the findings of this study, we concluded that Cnom,mix will be sufficient for evaluating the toxicity of mixtures that contain chemicals with diverse physicochemical properties at low concentration levels. In contrast, for risk assessment purposes and quantitative in vitro to in vivo extrapolations, Cfree,mix is a better parameter because the in vitro responses can be related to freely dissolved concentrations in human plasma.
Introduction
Humans are exposed to diverse and often undefined chemical mixtures from various sources like air, drinking water, food or personal care products. This fact is often neglected in chemical risk assessment that is typically focused on the testing of individual chemicals, although a large body of evidence suggests that the combined effects of chemicals should be considered (Kortenkamp et al., 2007; Kortenkamp et al., 2009).
The toxicity of a chemical mixture can be evaluated either by treating the mixture as a single chemical or by investigating how the mixture components contribute to the overall mixture toxicity (Rider et al., 2018). Two additivity models are most commonly applied to predict mixture toxicity or interpret experimental toxicity data of mixtures. Concentration (or dose) addition (CA) is assumed for chemicals that share a common mode of toxic action (Altenburger et al., 2000), while independent action (IA) can be expected if the chemicals act at different target sites (Backhaus et al., 2000). At low chemical concentrations (typically up to 10% of effect), where many concentration–response curves (CRC) are linear, the data interpretation can be further simplified, because the mixture models for CA and IA have been shown to converge to one common model (Escher et al., 2020a).
Mixture toxicity is typically assessed using the nominal concentrations of the mixture components (Cnom), which is the total amount of chemicals dosed to a certain volume of test medium (Kisitu et al., 2019). In cell-based in vitro bioassays depending on the physicochemical properties and the stability of the test chemicals Cnom may be reduced significantly due to binding to proteins and lipids in the assay medium (Gülden et al., 2002; Kramer et al., 2012), plastic sorption (Kramer et al., 2012; Fischer et al., 2018), volatilization (Escher et al., 2019), abiotic degradation (Huchthausen et al., 2022) or cellular metabolism (Fischer et al., 2020). Recent advances in the exposure assessment of single chemicals in cell-based in vitro bioassays have led to an improved understanding of the different distribution and loss processes. Numerous computational models have been published (Fischer et al., 2017; Fisher et al., 2019; Armitage et al., 2021) that can predict chemical distribution in vitro systems as recently reviewed by Proença et al. (2021). Furthermore, an increasing number of experimental studies has been performed to quantify exposure concentrations in vitro assays (Tanneberger et al., 2013; Huchthausen et al., 2020; Schug et al., 2020; Zhang et al., 2020). Diverse experimental approaches can be used to measure exposure concentrations of test chemicals. If the assay medium does not contain high amounts of proteins and lipids and cells are attached, pure or diluted medium can be injected and analyzed directly by LC-MS. Cell-culture media containing fetal bovine serum (FBS) or suspension cells need more complex approaches like cell centrifugation and cell removal followed by protein precipitation (PP), solid-phase extraction (SPE), equilibrium dialysis (ED) or solid-phase microextraction (SPME) that separate the chemical of interest from interfering proteins and lipids in the medium. The choice of method will also depend on the concentration metric of interest. PP and SPE can be used to measure the total medium concentrations, while ED and SPME are used to derive the freely dissolved concentration (Cfree) in the water phase of the medium. SPME is the method of choice for the determination of Cfree in cell-based in vitro bioassays as it requires only small sample volumes, can be automated in 96-well plate format (Roy et al., 2021; Huchthausen et al., 2022) and is applicable to a wide range of chemicals—from hydrophilic to hydrophobic and from neutral to ionic (Vuckovic and Pawliszyn, 2011; Henneberger et al., 2020).
All approaches mentioned above for Cfree prediction and measurement in cell-based in vitro bioassays have focused on single chemicals. In the present study, we have applied the knowledge gained from single chemicals to three defined chemical mixtures with up to twelve components. We applied a previously published workflow that combines the measurement of effects in cell-based bioassays and experimental determination of Cfree (Henneberger et al., 2019; Huchthausen et al., 2020). The SPME measurements were used to calculate the contribution of the individual mixture components to Cnom and Cfree of the mixture (Cnom,mix and Cfree,mix) as well as the contribution to cytotoxic effects and activation of oxidative stress response. We hypothesized that Cnom and Cfree of the mixtures would follow the same principles as single chemicals, e.g., mixtures containing mainly hydrophilic chemicals would show similar Cfree and Cnom. We also expected that the chemicals that were dosed in mixtures would behave in an additive manner with regards to toxicity (i.e., according to the concept of concentration addition). Finally, the implications of the findings of the present study for the effect assessment of complex environmental mixtures are discussed.
Materials and methods
Test chemicals
Twelve chemicals were selected for the present study, including two neutral hydrophobic and three neutral hydrophilic chemicals and seven organic acids (Table 1). For all chemicals nominal effect concentrations for cytotoxicity (IC10,nom) and activation of oxidative stress response (ECIR1.5,nom) in the AREc32 assay were available from previous studies (Escher et al., 2020b; Huchthausen et al., 2020). For more information on the test chemicals (CAS No., provider, purity, chemical structure) see Supplementary Table S1.
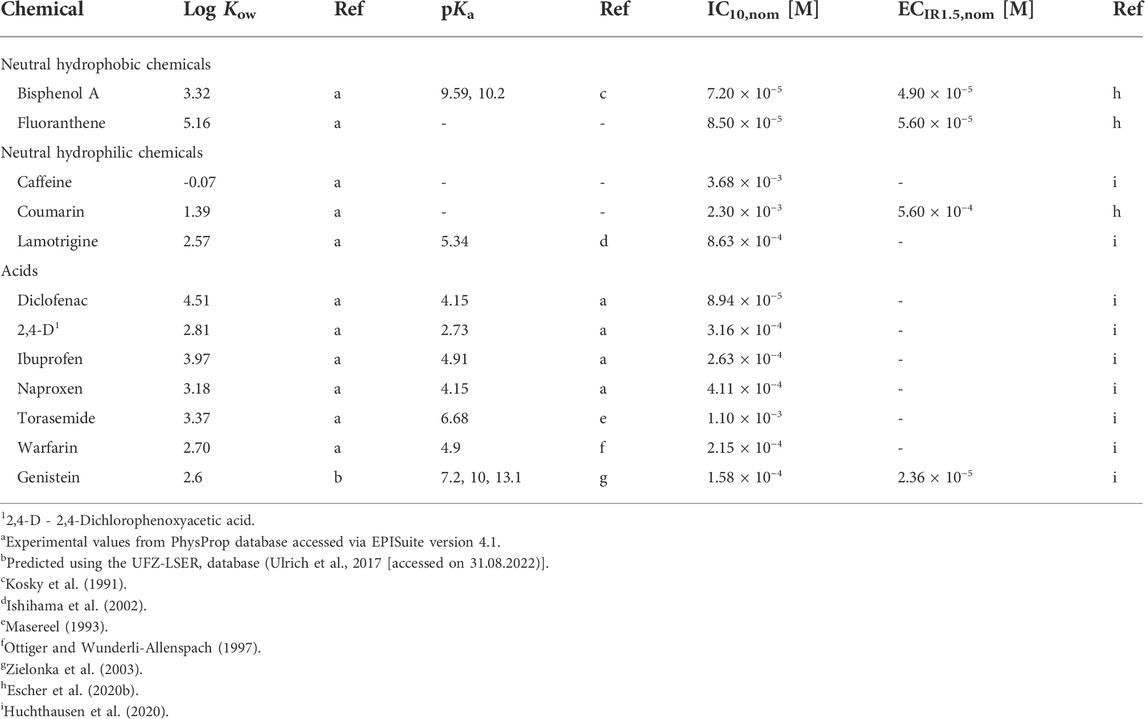
TABLE 1. Test chemicals with their respective chemical class, logarithmic octanol-water partition constants (log Kow), acidity constants (pKa), reported nominal concentrations causing 10% inhibition of cell viability (IC10,nom) and 1.5-fold induction of oxidative stress response (ECIR1.5,nom) in the AREc32 assay.
Mixture design
Based on the nominal effect concentrations of the single chemicals (Table 1) three different equipotent mixtures were designed assuming concentration addition (CA) of cytotoxicity or effect (Eq. 1). Using the CA model the nominal effect concentration of a mixture (IC10,nom,mix or ECIR1.5,nom,mix) with n different components i can be calculated from the nominal effect concentrations of the single chemicals (IC10,nom,i or ECIR1.5,nom,i) using Eq. 1.
The fractions of the mixture components (pi) are calculated from the nominal concentrations of the individual components (Cnom,i) and the nominal concentration of the mixture (Cnom.mix, Eq. 2) with Σpi = 1.
Mix 1 contained all twelve chemicals mixed in their IC10 ratios for cytotoxicity, Mix 2 four chemicals that showed an activation of oxidative stress response (bisphenol A, fluoranthene, coumarin and genistein) mixed in their ECIR1.5 ratios and Mix 3 contained the four active chemicals and four chemicals (caffeine, lamotrigine, diclofenac, torasemide) that showed no activation of oxidative stress response below the IC10,nom. These were again mixed in their IC10 ratios for cytotoxicity. The detailed composition of all mixtures can be found in Supplementary Table S2.
Low-dose mixture model
If the CRC of the single test chemicals are fitted at low concentrations using a linear model (Escher et al., 2018), the slopes of the linear regressions of the single chemicals (slopenom,i) can be used to calculate the slopes of the CRCs of the mixtures (slopenom,mix) using Eq. 3 (Escher et al., 2020a). Unlike for single chemicals, where linearity holds up to 30% effect, the assumption of linearity of the CRC with this simple model is strictly valid only below 10% effect.
The IC10,nom and ECIR1.5,nom of the mixtures were calculated based on the calculated slopes of the mixtures using Eqs. 4, 5, respectively.
Materials
Detailed information on the materials used for the cell-based bioassays can be found in Escher et al. (2012) and Huchthausen et al. (2020) For the concentration measurements of the mixtures solid-phase microextraction (SPME) fibers from Supelco with C18/PAN coating were used (Sigma-Aldrich, 57281-U, coating volume 520 nL). Fibers were cut to approx. 30 mm length to fit into the vials containing the medium samples and conditioned before start of each experiment as previously described by Henneberger et al. (2020) in methanol (2 h) and water (20 min). Methanol (Chemsolute, UHPLC-MS grade) and acetonitrile (Chemsolute, UHPLC-MS grade) were obtained from Th. Geyer and dimethyl sulfoxide (DMSO, BioScience-grade, ≥ 99.5%) from Roth. Control samples for SPME were prepared in phosphate-buffered saline (PBS). To avoid loss of hydrophobic mixture components (e.g., fluoranthene) to the vials and septa, amber glass crimp vials sealed with caps with aluminum septa (Th. Geyer and Macherey-Nagel) were used for all samples and extracts. For the PBS control samples 10 ml amber glass crimp vials with aluminum-coated silicone septa (Th. Geyer) were used.
Preparation of mixture stock solutions
Stock solutions of the three mixtures were prepared in DMSO using a Digital Dispenser from Tecan (D300e). Caffeine was not included in these stock solutions, because its solubility in DMSO was too low. Instead, stock solutions were prepared for caffeine by dissolving the pure chemical in assay medium on the day of the experiment and added separately. The final dosing concentrations of the chemicals are summarized in Supplementary Table S2.
Cell-based bioassays
The detailed protocols for dosing of chemicals and detection of endpoints in the AREc32 assay can be found in Escher et al. (2012) and Huchthausen et al. (2020). The reference compound for activation of ARE was tert-butylhydroquinone (tBHQ). Mix 1 and 3 were dosed up to cytotoxic concentrations (at 2 × the predicted IC10,nom,mix) and Mix 2 was dosed up to 2 × the predicted ECIR1.5,nom,mix. The mixtures were tested on one assay plate in duplicate in a serial dilution to determine the best starting concentrations for the linear dilutions, followed by two assay plates that received two linear dilutions of the mixtures leading to a total number of six replicates. For Mix 1 two different linear dilutions were dosed (one starting at a higher, one at a lower concentration) to cover a wider range of concentrations. The concentration ranges tested for Mix 1 were 2.86 × 10⁻⁶ to 1.46 × 10⁻³ M for the serial dilution and 5.13 × 10⁻⁵ to 1.46 × 10⁻³ M and 5.13 × 10⁻⁶ to 1.46 × 10⁻⁴ M for the linear dilutions. For Mix 2 tested concentrations ranged from 6.74 × 10⁻⁷ to 3.45 × 10⁻⁴ for the serial dilution and from 1.21 × 10⁻⁵ to 3.45 × 10⁻⁴ M for the linear dilutions. For Mix 3 tested concentrations ranged from 3.76 × 10⁻⁶ to 1.93 × 10⁻³ M for the serial dilution and from 3.37 × 10⁻⁵ to 9.63 × 10⁻⁴ M for the linear dilutions. Fluoranthene and coumarin were also tested as individual chemicals, because no combined dataset for cytotoxicity, activation of oxidative stress response and Cfree measured at different time points and concentrations was available. The highest dosed concentrations were 2.42 × 10⁻⁴ M for fluoranthene and 3.35 × 10⁻³ M for coumarin and both chemicals were tested in duplicate in a serial dilution on one assay plate.
Concentration measurements
The freely dissolved concentrations (Cfree) of all chemicals in the mixtures were determined using solid-phase microextraction (SPME). The protocol published by Henneberger et al. (2019) for the determination of Cfree of single chemicals was adapted to chemical mixtures as detailed below. The SPME method was successfully used for all chemicals individually in previous studies (Henneberger et al., 2019; Henneberger et al., 2020; Huchthausen et al., 2020). The total concentration (Ctotal) of the mixtures was not measured, but was assumed to be stable as previous experiments from our group found stable exposure concentrations for all test chemicals of the present study (Henneberger et al., 2019; Huchthausen et al., 2020). Only for fluoranthene no measured Cfree at different time points were available and Cfree of fluoranthene was therefore tested again as single chemical to ensure stable exposure conditions.
Optimization of SPME protocol for chemical mixtures
Assuming that the chemical that showed the slowest sorption kinetics to the SPME fibers as single chemical (according to Henneberger et al. (2020) fluoranthene in all mixtures of the present study) determined the equilibration time of the mixtures with the SPME fibers, an equilibration time of 24 h and a shaking speed of 1,500 rpm at 37°C on a high-speed shaker (BioShake iQ from QInstruments or DMS-2500 from VWR International) were chosen to allow equilibration of all mixture components with the SPME fibers. Complete desorption of single chemicals from C18-SPME fibers with 520 nL of coating was achieved in previous studies by using 180 µL of an optimized desorption solution, e.g., acetonitrile/water 10/90 for caffeine and 100% acetonitrile for fluoranthene (Henneberger et al., 2020). As the chemicals in the mixtures of the present study had very diverse physicochemical properties the chemicals were desorbed from the SPME fibers in two consecutive desorption steps using 180 µL of desorption solution in each step. For each desorption step the fibers were shaken at 1,500 rpm for 2 h. The first desorption solution was a mixture of acetonitrile and water (10/90), the second desorption solution was 100% acetonitrile. 1-naphthalene acetic acid was added as internal standard (IS) to the second desorption solution to account for loss of solvent from the vials that was observed during storage and instrumental analysis. This chemical was chosen, because it is non-volatile, has similar physicochemical properties as the acidic chemicals in the mixtures, but was not included in the mixtures itself. Furthermore, it could be detected with both quantification methods.
After desorption, the fibers were removed from the vials and the two desorption solutions were analyzed separately using a liquid chromatography-triple quadrupole mass spectrometry system (LC-MS/MS, Agilent 1,260 Infinity II and 6,420 Triple Quadrupole) followed by a second analysis using liquid chromatography-fluorescence detection (HPLC-FLD, Agilent 1,260 Infinity) for the quantification of naproxen, fluoranthene and bisphenol A that showed high limits of quantification in the LC-MS/MS method. The chemical mixtures were separated on a BioZen peptide PS-C18 column (Phenomenex) at 25 °C (LC-MS/MS 1.6 μm, 50 × 2.1 mm, flow rate 0.5 ml/min, HPLC-FLD 3 μm, 50 × 3.0 mm, flow rate 0.8 ml/min). The eluent was a mixture of acetonitrile and water with 0.1% formic acid. Gradient elution was applied. More details on both instrumental analysis methods can be found in Supplementary Tables S3, S4. The PBS phase of the control samples was also measured to calculate the mass balance. For fluoranthene, bisphenol A and naproxen the PBS phase was diluted 1:1 with acetonitrile before the measurement, for all other chemicals the PBS phase was measured directly without dilution.
Comparison of SPME of single chemicals and mixtures
To proof the applicability of the SPME method for chemical mixtures the fiber-water distribution ratios (Df/w) of the chemicals were measured individually and compared to Df/w of the chemicals in a mixture containing all twelve chemicals. Stock solutions of the individual chemicals and an all-component mixture were prepared in methanol or DMSO and spiked to 10 ml of phosphate-buffered saline (PBS). The final concentration in PBS was 0.05 mg/L for fluoranthene and 0.5 mg/L for all other test chemicals. The fraction of solvents in PBS was always <0.6%. The same concentrations were used for the mixture samples and the samples with individual chemicals and all samples were prepared in triplicates. All PBS samples were equilibrated with the SPME fibers for 24 h, the fibers were desorbed and the concentrations of the test chemicals were quantified in the desorption solutions and in the PBS phase after SPME as described in Optimization of SPME protocol for chemical mixtures.
Concentration measurements in cell-based bioassays
A previously established protocol for the determination of Cfree of single chemicals was used for the determination of the Cfree of the mixtures components (Henneberger et al., 2019). In short, aliquots of bioassay medium (180 µL) were sampled from the dosing vials at the time point of dosing and after 24 h of incubation with the cells from the assay plates before detection of the specific effect. SPME fibers were added to all sampled aliquots and allowed to equilibrate for 24 h at 1,500 rpm and 37°C. Control samples for SPME in PBS were run in parallel containing a mixture of all chemicals at three different concentrations except for fluoranthene for which controls were only prepared at 0.05 mg/L. The fibers from all sampled aliquots and the control samples were desorbed and the concentrations of the test chemicals were quantified in the desorption solutions and in the PBS phase of the control samples after SPME as described in Optimization of SPME protocol for chemical mixtures.
Data evaluation
The concentrations of the individual test chemicals in the solutions from the two desorption steps, Cdes1,i (i.e., acetonitrile and water 10/90) and Cdes2,i (i.e., 100% acetonitrile) and the volumes of the solutions from the two desorption steps (Vdes1 and Vdes2) and the fiber coating (Vfiber) were used to calculate the concentration in the SPME fiber (Cfiber,i):
The fiber-water distribution ratios Df/w of the chemicals were calculated from Cfiber,i and the corresponding concentration measured in the PBS phase (Cw,i) of the control samples (Eq. 7).
The freely dissolved concentrations of the individual chemicals (Cfree,i) were calculated from the measured Cfiber,i, Df/w and the nominal amount of the chemicals (ntotal,i) added to the wells using Eq. 8 (Henneberger et al., 2019).
The freely dissolved concentrations of the mixtures (Cfree,mix) were calculated by summing up the Cfree,i of the mixture components (Eq. 9). Cfree,mix was only calculated if all components of the mixture could be quantified by instrumental analysis.
The CRCs of the mixtures were derived by plotting the cytotoxicity and activation of oxidative stress response against Cnom,mix or the experimentally determined Cfree,mix. The concentration of the mixture which caused a reduction of cell viability of 10% (IC10) was calculated using Eq. 4 from the slope of the linear range of the CRC (Escher et al., 2018). For activation of ARE the induction ratio (IR) was calculated using only concentrations below cytotoxicity. The concentration which led to an IR of 1.5 (ECIR1.5) was calculated from the linear range of the CRC using Eq. 5.
Results
Comparison of fiber-water distribution and Cfree of individual chemicals and mixtures
The fiber-water distribution ratios (Df/w) of chemicals tested individually and in a 12-component mixture were almost identical and agreed within a factor of 1.4 for all chemicals (Supplementary Figure S1; Supplementary Table S5).
Experimentally determined Cfree of the individual test chemicals were already available from previous studies as indicated in Table 1 and were measured for fluoranthene and coumarin in the present study. Although the dosed concentrations were typically much higher in the assays with the individual chemicals compared to the mixtures, there was a sufficient overlay of the tested concentrations to enable a comparison (Figure 1). For the majority of the chemicals the data points from the single chemical dosing and the mixture experiments were overlapping well (Figures 1A–G,I,J,L). Only for the acidic chemicals, ibuprofen and warfarin (Figures 1H,K), Cfree was lower when the test chemicals were tested individually compared to the experiment that used the 12-component mixture (Mix 1). For ibuprofen Cfree determined at a nominal concentration of approx. 9 × 10⁻⁶ M was eight times lower for the single chemical (3.63 × 10⁻⁷ M) compared to the Cfree measurement of Mix 1 (2.89 × 10⁻⁶ M). Similarly, Cfree determined for warfarin at a nominal concentration of approx. 3 × 10⁻⁶ M was five times lower for the single chemical (1.66 × 10⁻⁷ M) compared to the Cfree measurement of Mix 1 (8.19 × 10⁻⁷ M).
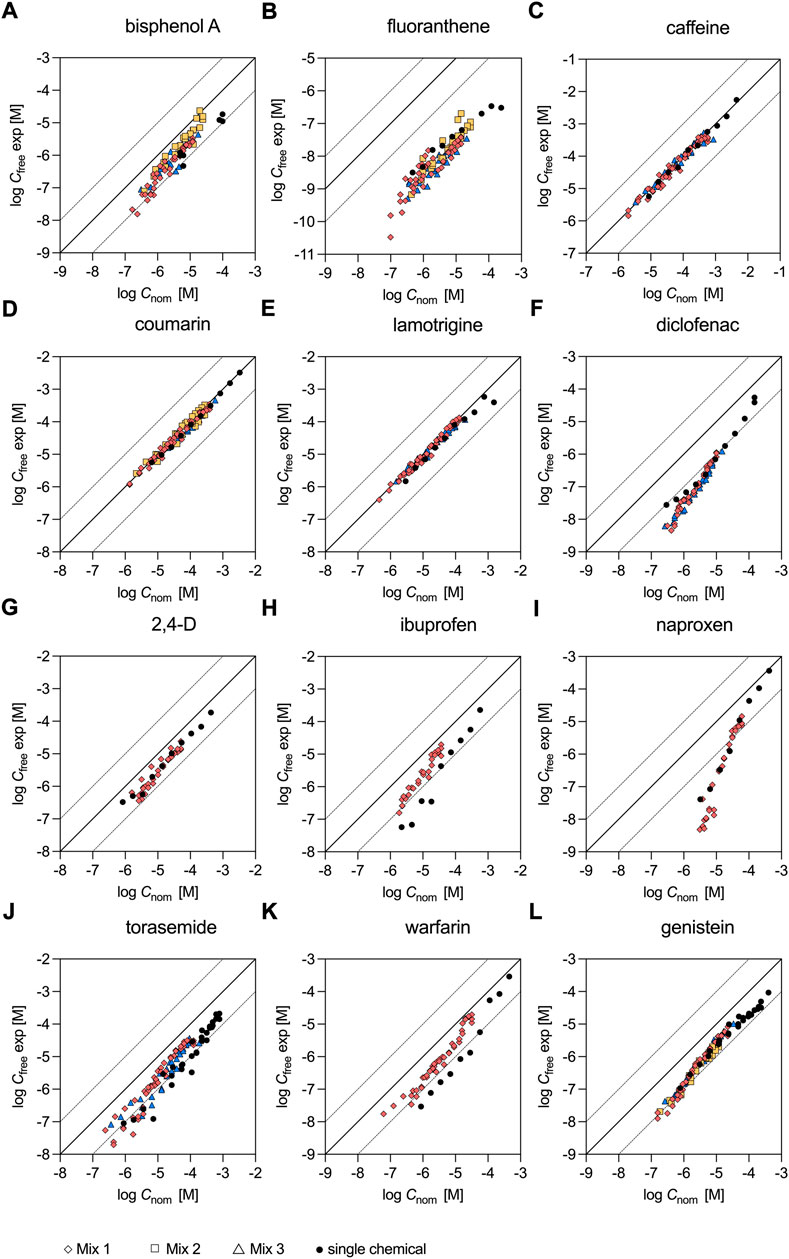
FIGURE 1. Freely dissolved concentrations of chemicals tested individually and in mixtures. Single chemical data stem from (A) Henneberger et al. (2019); (B), (D) present study; (C), (E)–(L) Huchthausen et al. (2020). Mixture data were measured in the present study.
Nominal and freely dissolved effect concentrations of fluoranthene and coumarin
Fluoranthene did not exceed 10% cytotoxicity in the present study up to a nominal concentration of 2.42 × 10⁻⁴ M (see also CRC in Supplementary Figure S2; Supplementary Table S6) and a measured Cfree of 3.43 × 10⁻⁷ M (Supplementary Figure S4), while our previous study reported an IC10,nom of 8.50 × 10⁻⁵ M (Escher et al., 2020b). However, cytotoxicity is difficult to measure for this hydrophobic chemical as the cytotoxic effects are observed close to the solubility limit. Fluoranthene activated oxidative stress response with an ECIR1.5,nom of 1.19 × 10⁻⁴ M (Supplementary Figure S2; Supplementary Table S6), which was also 2.1-times higher than the previously reported value of 5.60 × 10⁻⁵ M (Escher et al., 2020b). The ECIR1.5,free of fluoranthene was 2.18 × 10⁻⁷ M (Supplementary Figure S4). For coumarin IC10,nom was 8.12 × 10⁻⁴ M and the ECIR1.5,nom was 3.12 × 10⁻⁴ M (CRC in Supplementary Figure S2; Supplementary Table S6) and therefore 2.9- and 1.8-times lower than in our previous study. The determined IC10,free and ECIR1.5,free of the hydrophilic chemical coumarin were very similar (within a factor of 1.2) to the nominal effect concentrations (Supplementary Table S6).
Nominal and freely dissolved effect concentrations of mixtures and comparison with CA model predictions
All designed mixtures were cytotoxic and induced oxidative stress response in the AREc32 assay. The nominal effect concentrations of the three mixtures (Table 2) for cytotoxicity (IC10,nom,mix) and activation of oxidative stress response (ECIR1.5,nom,mix) were derived from the nominal concentration response curves (Supplementary Figure S3).
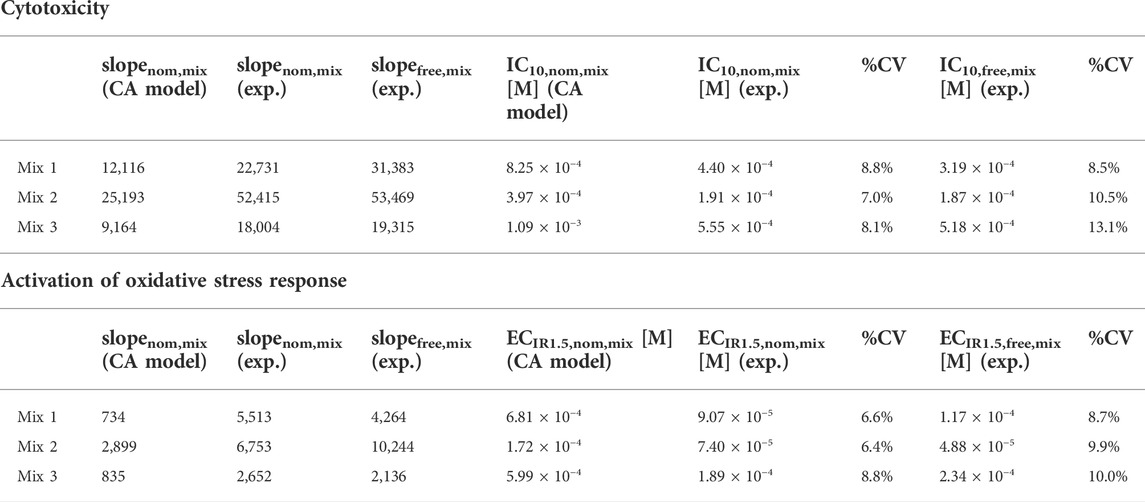
TABLE 2. Slopes of the nominal (slopenom,mix) and freely dissolved concentration response curves (slopefree,mix) of the mixtures, nominal and freely dissolved effect concentrations in the AREc32 bioassay for cytotoxicity (IC10,nom,mix and IC10,free,mix) and activation of oxidative stress response (ECIR1.5,nom,mix and ECIR1.5,free,mix) derived by experiment (exp.) and slopes and effect concentrations predicted using the concentration addition (CA) model.
All mixtures were slightly more cytotoxic/effective than predicted by the CA model, because the experimental effect concentrations of all mixtures were always lower than the predicted effect concentrations (Figure 2A). Experimental and predicted IC10,nom,mix agreed within a factor of 2.1 for all mixtures (Table 2; Figure 2A). Experimental and predicted ECIR1.5,nom,mix of Mix 2 and 3 were also within a factor of 3.2. The difference between experimental and predicted effect concentrations was most pronounced with a factor of 7.5 for ECIR1.5,nom,mix of Mix 1.
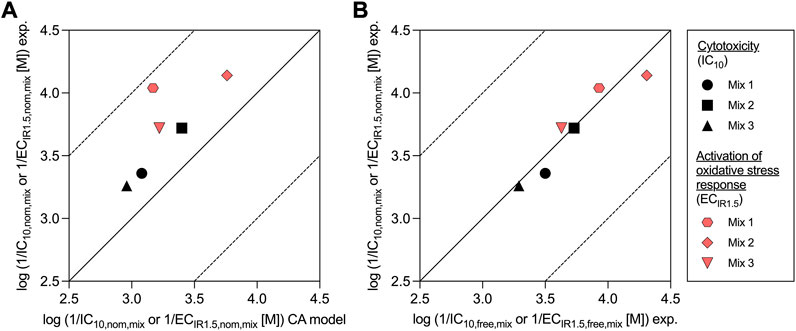
FIGURE 2. Comparison of experimentally derived (exp.) nominal effect concentrations of the mixtures for cytotoxicity (IC10,nom,mix) and activation of oxidative stress response (ECIR1.5,nom,mix) with (A) predicted values from the concentration addition (CA) model and (B) with experimentally derived (exp.) freely dissolved effect concentrations (IC10,free,mix and ECIR1.5,free,mix).
The freely dissolved CRCs were derived by plotting the measured effects from the AREc32 bioassay against the measured Cfree,mix. As Cfree,mix was only calculated for the samples for which the freely dissolved concentration of all mixture components could be quantified (see also Supplementary Tables S7–9), the freely dissolved CRCs (Supplementary Figure S5) have much fewer data points than to the nominal CRCs (Supplementary Figure S3). However, the majority of the data points with no measured Cfree,mix are at low concentrations where no effects were detected and a linear fit of the data for cytotoxicity and activation of oxidative stress response was still possible. The derived freely dissolved effect concentrations were very close to the nominal effect concentrations for all mixtures (within a factor of 1.5, Table 2 and Figure 2B).
Contribution of individual chemicals to concentrations and effects of mixtures
All mixtures of this study were designed to be equipotent, i.e., the contributions of each individual chemical to the effect of the mixture were equal. The experimental results confirmed the design: In Mix 1 and 3 all chemicals contributed equally to the cytotoxic effect of the mixture and in Mix 2 all chemicals had the same contribution to the activation of oxidative stress response (Figure 3).
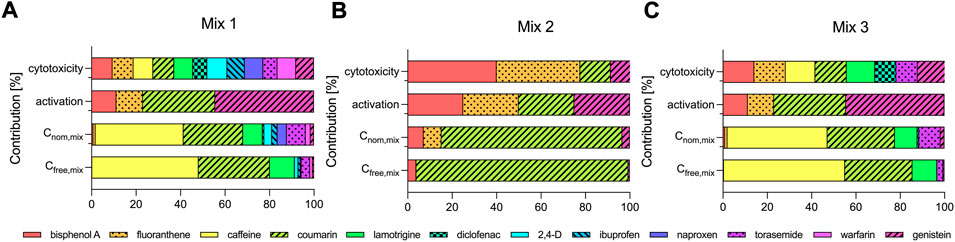
FIGURE 3. Contribution of the individual test chemicals to the cytotoxicity and activation of oxidative stress response and to the nominal (Cnom,mix) and freely dissolved concentrations of the mixtures (Cfree,mix) (A) Mix 1, (B) Mix 2 and (C) Mix 3.
As expected, the contribution of the individual chemicals to Cnom,mix and Cfree,mix differed widely (Figure 3). All three mixtures contained hydrophilic low-potency chemicals (caffeine, coumarin, lamotrigine and torasemide in Mix 1 and 3 and coumarin in Mix 2) that were added at high concentrations and they primarily defined Cnom,mix (Figure 3). Caffeine, coumarin, lamotrigine and torasemide constituted 84 and 95% of Cnom,mix of Mix 1 and 3, but contributed with only 33 and 50% to the cytotoxicity and 33 and 33% to the activation of oxidative stress response of the respective mixtures. Similarly, coumarin made up 81% of Cnom,mix of Mix 2, but contributed only with 14% to cytotoxicity and with 25% to the activation of oxidative stress response (Figure 3B).
Because the free fractions of caffeine, coumarin and lamotrigine in the assay medium were high (>80%), the contribution to Cfree,mix was also high for these chemicals and even more pronounced as compared to Cnom,mix. The sum of the contributions to Cfree,mix of caffeine, coumarin, lamotrigine and torasemide was 95 and 99% for Mix 1 and 3 and coumarin made up 95% of Cfree,mix of Mix 2.
Some interesting trends could also be deduced by comparing the contributions of individual chemicals in different mixtures. For example coumarin showed a similar contribution to the cytotoxic effects of Mix 2 and 3 (about 14% for both Mixes), but contributed remarkably different with 81 and 30% to Cnom,mix of Mix 2 and 3 and with 95 and 30% to Cfree,mix of Mix 2 and 3. For bisphenol A the trends are reversed in comparison to coumarin. Bisphenol A contributed with 9%, 40 and 14% to the cytotoxic effects of Mix 1, 2 and 3, but only showed very little contribution to Cnom. mix (0.8, 7 and 0.9% for Mix 1, 2 and 3) and even less to Cfree,mix (0.3%, 4 and 0.4% for Mix 1, 2 and 3).
In Figure 3 the contribution of the individual test chemicals to Cnom,mix and Cfree,mix appears to be very similar. A closer look at the measured Cfree of the individual mixture components revealed that Cnom and Cfree were only similar for caffeine, coumarin and lamotrigine (within a factor of 2.6 Figures 1C,D,E), but differed significantly for all other chemicals (Figure 1). For example, for fluoranthene Cnom and Cfree differed on average by a factor of 456 (Figure 1B) and for naproxen the difference ranged from a factor of 4.2 at the highest dosed concentration to 648 at the lowest concentration tested (Figure 1I). Furthermore, Cfree of the individual chemicals seemed to be independent of the mixture composition, as chemicals tested in different mixtures showed similar Cfree (see Supplementary Figures S2A–F,J,L for bisphenol A, fluoranthene, caffeine, coumarin, lamotrigine, diclofenac, torasemide and genistein) and were also similar for all chemicals except ibuprofen and warfarin when measured individually (black dots in Figure 1) and in the mixtures. The data for the individual chemicals were taken from previous studies as indicated in Table 1, except for fluoranthene and coumarin that were also measured individually in this study (Nominal and freely dissolved effect concentrations of fluoranthene and coumarin).
Interestingly, Cfree of diclofenac, ibuprofen, naproxen and warfarin was found to be concentration dependent and did not increase linearly with the dosed nominal concentration (Figures 1F,H,I,K). For diclofenac Cfree was 91 times lower than Cnom at the lowest measured Cfree of 4.53 × 10⁻⁹ M in Mix 1. With increasing concentrations, the difference between Cfree and Cnom continuously decreased and therefore Cfree was only a factor of nine lower than Cnom at the highest measured Cfree of 1.13 × 10⁻⁶ M in Mix 1. Similar trends were observed for ibuprofen, naproxen and warfarin. For these chemicals the differences between Cfree and Cnom ranged from 12 to 1.9, 648 to 4.2 and 13 to 1.4 for Mix 1.
The contribution of diclofenac, ibuprofen, naproxen and warfarin to Cfree,mix was also concentration-dependent (see Figure 4 for Mix 1 and Supplementary Figure S6 for Mix 2 and 3). The concentration-dependence of Cfree and the change in the contribution Cfree,i/Cfree,mix was most pronounced for the acid naproxen. Naproxen contributed 1.03% to Cfree,mix of Mix 1 at the highest measured Cfree,mix of 8.52 × 10⁻⁴ M and only 0.01% at the lowest measured Cfree,mix of 5.81 × 10⁻⁵ M, which was a difference of nearly a factor of 100.
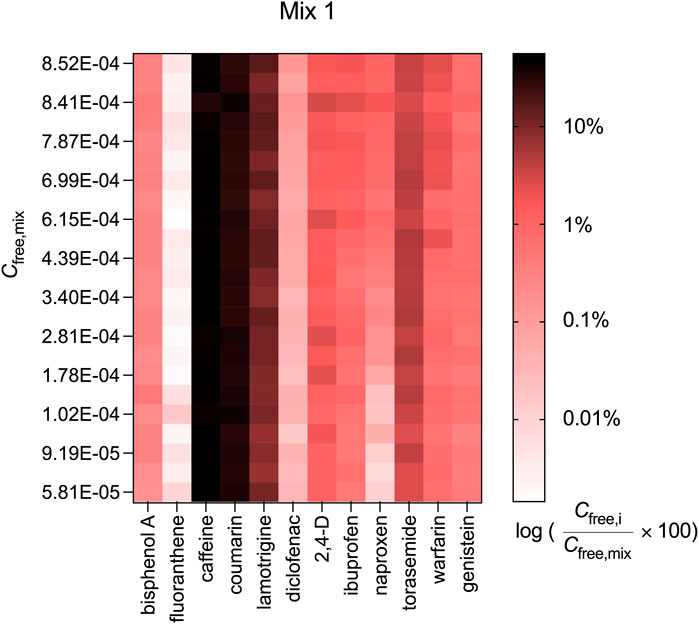
FIGURE 4. Contribution of the measured freely dissolved concentrations of the individual chemicals (Cfree,i) to the freely dissolved concentrations of Mix 1 (Cfree,mix).
Discussion
For the majority of the test chemicals the determined Cfree in bioassay medium showed a good overlap when chemicals were tested individually and in mixtures (Figure 1). This indicates that the SPME method developed for exposure assessment of single chemicals is also applicable to mixtures of chemicals. Only ibuprofen and warfarin had slightly lower Cfree when dosed individually compared to the 12-component mixture. Organic acids are considered to bind to only few specific binding sites on serum albumin and may compete for these binding sites if dosed in mixtures (Kragh-Hansen et al., 2002). This effect could explain the higher Cfree of ibuprofen and warfarin in the mixture as Mix 1 contained seven organic acids that potentially bind to the same sites on albumin. The protein binding sites of serum albumin may also become saturated at high chemical concentrations. Saturation effects (i.e., a non-linear increase of Cfree with increasing dosing concentrations) were observed for diclofenac, ibuprofen, naproxen and warfarin. This finding is in line with a previous study from our group that also demonstrated that Cfree was concentration-dependent for anionic organic acids in bioassay medium (Huchthausen et al., 2020).
The experimental effect concentrations of the designed mixtures of this study were found to be lower than predictions from a mixture model that assumes concentration addition of the effects. The CA model predicts the activation of oxidative stress response only based on the chemicals that showed activity below cytotoxicity as single chemicals. The predictions for Mix 1 are therefore only based on the four active components bisphenol A, fluoranthene, coumarin and genistein. However, the other chemicals may still have contributed to the mixture effect. While the single chemicals might not have reached the IR of 1.5 before cytotoxicity was observed, they may still contribute to the activation of ARE in the mixture. Similar results were also reported in a previous study (Escher et al., 2013). Furthermore, oxidative stress response is often detected close to cytotoxic concentrations and is therefore difficult to distinguish from the so-called “cytotoxicity burst phenomenon” (Judson et al., 2016; Escher et al., 2020b).
Low-potency chemicals that were added at high concentrations were found to dominate Cnom,mix and Cfree,mix in the present study, but not the effect (see Figure 3). For example, caffeine made up 45% of the nominal and 55% of the freely dissolved concentration of Mix 3, but did not contribute at all to the activation of oxidative stress response caused by the mixture. Hence, in designed equipotent mixtures all individual components contribute equally to the effect, but their contribution to the concentration nominal as well as freely dissolved of the mixture will be a function of their potency.
Implications for complex and undefined environmental mixtures
In many cases the use of Cnom,mix for mixture toxicity assessment will be sufficient. Especially if complex mixtures are extracted from environmental samples, their measured mixture effects are sufficiently well related to the nominal concentrations of the single chemicals in so-called iceberg modelling (Escher et al., 2021).
However, if one wants to do a risk assessment based on the mixture effect data, which requires in vitro to in vivo extrapolation, one needs to account for the differences in bioavailability in the in vitro bioassay in comparison to blood. If a mixture contains high concentrations of hydrophilic low-potency chemicals (e.g., sweeteners) they will have similar Cnom,mix and Cfree,mix, i.e., show similar behavior as the mixtures of this study. The use of Cfree,mix is advisable if the mixture is mainly composed of neutral hydrophobic chemicals (e.g., a mixture extracted from a soil sample) and consequently has orders of magnitude lower Cfree,mix than Cnom,mix. In this case Cfree,mix may also be predicted by mass balance models to avoid the laborious experimental determination of Cfree,mix. Special attention should be paid to mixtures that contain acidic components at variable concentration levels, e.g., mixtures of perfluorinated acids extracted from blood samples from the general population versus exposed workers. In these cases, Cfree,mix will be much lower than Cnom,mix, but a prediction of Cfree,mix would be challenging, because the free fraction will be dependent on the concentration and composition of the mixture. Furthermore, the concentration ratios Cfree,mix/Cnom,mix would not only depend on the absolute concentrations but also on other mixture components.
Data availability statement
The raw data supporting the conclusion of this article will be made available by the authors, without undue reservation.
Author contributions
All authors contributed to the preparation of the manuscript and have approved its final version. LH was responsible for experimental design and writing of the manuscript. Data evaluation was done by LH and JH. Dosing of chemicals and concentration measurements were carried out by JH, AM, and NW. MK was responsible for bioassays and cell culture. BE supervised the work and helped to design the mixtures.
Funding
Supported by the Helmholtz Association under the recruiting initiative scheme, which is funded by the German Ministry of Education and Research, within the Helmholtz POF IV Topic 9 Healthy Planet-towards a non-toxic environment.
Acknowledgments
We gratefully acknowledge access to the platform CITEPro (Chemicals in the Terrestrial Environment Profiler) funded by the Helmholtz Association.
Conflict of interest
The authors declare that the research was conducted in the absence of any commercial or financial relationships that could be construed as a potential conflict of interest.
Publisher’s note
All claims expressed in this article are solely those of the authors and do not necessarily represent those of their affiliated organizations, or those of the publisher, the editors and the reviewers. Any product that may be evaluated in this article, or claim that may be made by its manufacturer, is not guaranteed or endorsed by the publisher.
Supplementary material
The Supplementary Material for this article can be found online at: https://www.frontiersin.org/articles/10.3389/fenvc.2022.1018162/full#supplementary-material
References
Altenburger, R., Backhaus, T., Boedeker, W., Faust, M., Scholze, M., and Grimme, L. H. (2000). Predictability of the toxicity of multiple chemical mixtures to Vibrio fischeri: Mixtures composed of similarly acting chemicals. Environ. Toxicol. Chem. 19 (9), 2341–2347. doi:10.1897/1551-5028(2000)019<2341:pottom>2.3.co;2
Armitage, J. M., Sangion, A., Parmar, R., Looky, A. B., and Arnot, J. A. (2021). Update and evaluation of a high-throughput in vitro mass balance distribution model: IV-MBM EQP v2.0. Toxics 9 (11), 315. doi:10.3390/toxics9110315
Backhaus, T., Altenburger, R., Boedeker, W., Faust, M., Scholze, M., and Grimme, L. H. (2000). Predictability of the toxicity of multiple mixtures of dissimilarly acting chemicals to Vibrio Fischeri. Environ. Toxicol. Chem. 19 (9), 2348–2356. doi:10.1897/1551-5028(2000)019<2348:pottoa>2.3.co;2
Escher, B., Braun, G., and Zarfl, C. (2020a). Exploring the concepts of concentration addition and independent action using a linear low-effect mixture model. Environ. Toxicol. Chem. 39 (12), 2552–2559. doi:10.1002/etc.4868
Escher, B. I., Dutt, M., Maylin, E., Tang, J. Y. M., Toze, S., Wolf, C. R., et al. (2012). Water quality assessment using the AREc32 reporter gene assay indicative of the oxidative stress response pathway. J. Environ. Monit. 14 (11), 2877–2885. doi:10.1039/c2em30506b
Escher, B. I., Glauch, L., König, M., Mayer, P., and Schlichting, R. (2019). Baseline toxicity and volatility cutoff in reporter gene assays used for high-throughput screening. Chem. Res. Toxicol. 32 (8), 1646–1655. doi:10.1021/acs.chemrestox.9b00182
Escher, B. I., Henneberger, L., König, M., Schlichting, R., and Fischer, F. C. (2020b). Cytotoxicity burst? Differentiating specific from nonspecific effects in tox21 in vitro reporter gene assays. Environ. Health Perspect. 128 (7), 077007. doi:10.1289/EHP6664
Escher, B. I., Neale, P. A., and Villeneuve, D. L. (2018). The advantages of linear concentration-response curves for in vitro bioassays with environmental samples. Environ. Toxicol. Chem. 37 (9), 2273–2280. doi:10.1002/etc.4178
Escher, B. I., van Daele, C., Dutt, M., Tang, J. Y. M., and Altenburger, R. (2013). Most oxidative stress response in water samples comes from unknown chemicals: The need for effect-based water quality trigger values. Environ. Sci. Technol. 47, 7002. doi:10.1021/es304793h
Escher, B., Neale, P., and Leusch, F. (2021). Bioanalytical tools in water quality assessment. London, UK: IWA Publishing.
Fischer, F. C., Abele, C., Henneberger, L., Klüver, N., König, M., Mühlenbrink, M., et al. (2020). Cellular metabolism in high-throughput in vitro reporter gene assays and implications for the quantitative in vitro-in vivo extrapolation. Chem. Res. Toxicol. 33 (7), 1770–1779. doi:10.1021/acs.chemrestox.0c00037
Fischer, F. C., Cirpka, O. A., Goss, K. U., Henneberger, L., and Escher, B. I. (2018). Application of experimental polystyrene partition constants and diffusion coefficients to predict the sorption of neutral organic chemicals to multiwell plates in in vivo and in vitro bioassays. Environ. Sci. Technol. 52 (22), 13511–13522. doi:10.1021/acs.est.8b04246
Fischer, F. C., Henneberger, L., König, M., Bittermann, K., Linden, L., Goss, K. U., et al. (2017). Modeling exposure in the tox21 in vitro bioassays. Chem. Res. Toxicol. 30 (5), 1197–1208. doi:10.1021/acs.chemrestox.7b00023
Fisher, C., Siméon, S., Jamei, M., Gardner, I., and Bois, Y. F. (2019). Vivd: Virtual in vitro distribution model for the mechanistic prediction of intracellular concentrations of chemicals in in vitro toxicity assays. Toxicol. Vitro 58, 42–50. doi:10.1016/j.tiv.2018.12.017
Gülden, M., Mörchel, S., Tahan, S., and Seibert, H. (2002). Impact of protein binding on the availability and cytotoxic potency of organochlorine pesticides and chlorophenols in vitro. Toxicology 175 (1–3), 201–213. doi:10.1016/S0300-483X(02)00085-9
Henneberger, L., Mühlenbrink, M., Heinrich, D. J., Teixeira, A., Nicol, B., and Escher, B. I. (2020). Experimental validation of mass balance models for in vitro cell-based bioassays. Environ. Sci. Technol. 54 (2), 1120–1127. doi:10.1021/acs.est.9b06144
Henneberger, L., Mühlenbrink, M., König, M., Schlichting, R., Fischer, F. C., and Escher, B. I. (2019). Quantification of freely dissolved effect concentrations in in vitro cell-based bioassays. Arch. Toxicol. 93 (8), 2295–2305. doi:10.1007/s00204-019-02498-3
Huchthausen, J., Henneberger, L., Malzer, S., Nicol, B., Sparham, C., and Escher, B. I. (2022). High-throughput assessment of the abiotic stability of test chemicals in in vitro bioassays. Chem. Res. Toxicol. 35 (5), 867–879. doi:10.1021/acs.chemrestox.2c00030
Huchthausen, J., Mühlenbrink, M., König, M., Escher, B. I., and Henneberger, L. (2020). Experimental exposure assessment of ionizable organic chemicals in in vitro cell-based bioassays. Chem. Res. Toxicol. 33 (7), 1845–1854. doi:10.1021/acs.chemrestox.0c00067
Ishihama, Y., Nakamura, M., Miwa, T., Kajima, T., and Asakawa, N. (2002). A rapid method for pKa determination of drugs using pressure-assisted capillary electrophoresis with photodiode array detection in drug discovery. J. Pharm. Sci. 91 (4), 933–942. doi:10.1002/jps.10087
Judson, R., Houck, K., Martin, M., Richard, A. M., Knudsen, T. B., Shah, I., et al. (2016). Editor's highlight: Analysis of the effects of cell stress and cytotoxicity onIn VitroAssay activity across a diverse chemical and assay space. Toxicol. Sci. 152 (2), 323–339. doi:10.1093/toxsci/kfw092
Kisitu, J., Bennekou, S. H., and Leist, M. (2019). Chemical concentrations in cell culture compartments (C-5) concentration definitions. Altex-Alternatives Animal Exp. 36 (1), 154–160. doi:10.14573/altex.1901031
Kortenkamp, A., Backhaus, T., and Faust, M. (2009). State of the art report on mixture toxicity. European Commission. 070307/2007/485103/ETU/D.1).
Kortenkamp, A., Faust, M., Scholze, M., and Backhaus, T. (2007). Low-level exposure to multiple chemicals: Reason for human health concerns? Environ. Health Perspect. 115, 106–114. doi:10.1289/ehp.9358
Kosky, P. G., Silva, J. M., and Guggenheim, E. A. (1991). The aqueous phase in the interfacial synthesis of polycarbonates. Part 1. Ionic equilibria and experimental solubilities in the BPA-sodium hydroxide-water system. Ind. Eng. Chem. Res. 30 (3), 462–467. doi:10.1021/ie00051a005
Kragh-Hansen, U., Chuang, V. T. G., and Otagiri, M. (2002). Practical aspects of the ligand-binding and enzymatic properties of human serum albumin. Biol. Pharm. Bull. 25 (6), 695–704. doi:10.1248/bpb.25.695
Kramer, N. I., Krismartina, M., Rico-Rico, A., Blaauboer, B. J., and Hermens, J. L. M. (2012). Quantifying processes determining the free concentration of phenanthrene in basal cytotoxicity assays. Chem. Res. Toxicol. 25 (2), 436–445. doi:10.1021/tx200479k
Masereel, B. (1993). Torasemide derivatives: New perspectives. Cardiovasc. Drug Rev. 11 (3), 359–369. doi:10.1111/j.1527-3466.1993.tb00195.x
Ottiger, C., and Wunderli-Allenspach, H. (1997). Partition behaviour of acids and bases in a phosphatidylcholine liposome–buffer equilibrium dialysis system. Eur. J. Pharm. Sci. 5 (4), 223–231. doi:10.1016/S0928-0987(97)00278-9
Proença, S., Escher, B. I., Fischer, F. C., Fisher, C., Grégoire, S., Hewitt, N. J., et al. (2021). Effective exposure of chemicals in in vitro cell systems: A review of chemical distribution models. Toxicol. Vitro 73, 105133. doi:10.1016/j.tiv.2021.105133
Rider, C. V., Dinse, G. E., Umbach, D. M., Simmons, J. E., and Hertzberg, R. C. (2018). “Predicting mixture toxicity with models of additivity,” in Chemical mixtures and combined chemical and nonchemical stressors: Exposure, toxicity, analysis, and risk. Editors C. V. Rider, and J. E. Simmons (Cham: Springer International Publishing), 235
Roy, K. S., Nazdrajić, E., Shimelis, O. I., Ross, M. J., Chen, Y., Cramer, H., et al. (2021). Optimizing a high-throughput solid-phase microextraction system to determine the plasma protein binding of drugs in human plasma. Anal. Chem. 93 (32), 11061–11065. doi:10.1021/acs.analchem.1c01986
Schug, H., Maner, J., Hülskamp, M., Begnaud, F., Debonneville, C., Berthaud, F., et al. (2020). Extending the concept of predicting fish acute toxicity in vitro to the intestinal cell line RTgutGC. ALTEX - Altern. animal Exp. 37 (1), 37–46. doi:10.14573/altex.1905032
Tanneberger, K., Knöbel, M., Busser, F. J. M., Sinnige, T. L., Hermens, J. L. M., and Schirmer, K. (2013). Predicting fish acute toxicity using a fish gill cell line-based toxicity assay. Environ. Sci. Technol. 47 (2), 1110–1119. doi:10.1021/es303505z
Ulrich, N., Endo, S., Brown, T. N., Watanabe, N., Bronner, G., Abraham, M. H., et al. (2017). UFZ-LSER database v 3.2.1[Internet](accessed on 31.08.2022)
Vuckovic, D., and Pawliszyn, J. (2011). Systematic evaluation of solid-phase microextraction coatings for untargeted metabolomic profiling of biological fluids by liquid Chromatography−Mass spectrometry. Anal. Chem. 83 (6), 1944–1954. doi:10.1021/ac102614v
Zhang, C.-Y., Flor, S., Ludewig, G., and Lehmler, H.-J. (2020). Atropselective partitioning of polychlorinated biphenyls in a HepG2 cell culture system: Experimental and modeling results. Environ. Sci. Technol. 54 (21), 13817–13827. doi:10.1021/acs.est.0c02508
Keywords: mixture toxicity, concentration addition, cell-based bioassay, solid-phase microextraction, freely dissolved concentration
Citation: Henneberger L, Huchthausen J, König M, Menge A, Wojtysiak N and Escher BI (2022) Experimental exposure assessment of designed chemical mixtures in cell-based in vitro bioassays. Front. Environ. Chem. 3:1018162. doi: 10.3389/fenvc.2022.1018162
Received: 12 August 2022; Accepted: 08 September 2022;
Published: 28 September 2022.
Edited by:
Kilian E. C. Smith, Hochschule Magdeburg-Stendal, GermanyReviewed by:
Chang-Er Chen, South China Normal University, ChinaTu Binh Minh, VNU University of Science, Vietnam
Copyright © 2022 Henneberger, Huchthausen, König, Menge, Wojtysiak and Escher. This is an open-access article distributed under the terms of the Creative Commons Attribution License (CC BY). The use, distribution or reproduction in other forums is permitted, provided the original author(s) and the copyright owner(s) are credited and that the original publication in this journal is cited, in accordance with accepted academic practice. No use, distribution or reproduction is permitted which does not comply with these terms.
*Correspondence: Luise Henneberger, luise.henneberger@ufz.de