

Abstract
Making the global energy system more sustainable has emerged as a major societal concern and policy objective. This transition comes with various challenges and opportunities for a sustainable evolution affecting most of the UN's Sustainable Development Goals. We therefore propose broadening the current metrics for sustainability in the energy system modeling field by using industrial ecology techniques to account for a conclusive set of indicators. This is pursued by including a life cycle based sustainability assessment into an energy system model considering all relevant products and processes of the global supply chain. We identify three pronounced features: (i) the low-hanging fruit of impact mitigation requiring manageable economic effort; (ii) embodied emissions of renewables cause increasing spatial redistribution of impact from direct emissions, the place of burning fuel, to indirect emissions, the location of the energy infrastructure production; (iii) certain impact categories, in which more overall sustainable systems perform worse than the cost minimal system, require a closer look. In essence, this study makes the case for future energy system modeling to include the increasingly important global supply chain and broaden the metrics of sustainability further than cost and climate change relevant emissions.
Export citation and abstract BibTeX RIS

Original content from this work may be used under the terms of the Creative Commons Attribution 3.0 licence.
Any further distribution of this work must maintain attribution to the author(s) and the title of the work, journal citation and DOI.
Nomenclature
| a | partitioned process vector of A |
| A | technology matrix |
| b | partitioned process vector of B |
| B | intervention matrix |
| c | cost |
| d | discount rate |
| ESM | energy system model |
| f | final demand vector |
| g | inventory vector |
| GDP | gross domestic product |
| GHG | greenhouse gas |
| h | impact vector |
| i | flow |
| IPCC | Intergovernmental Panel on Climate Change |
| j | process |
| k | environmental intervention |
| l | impact category |
| LCA | life cycle assessment |
| LCI | life cycle inventory |
| MOrOSA | Multi-Objective Optimization Sustainability Assessment |
| n | power plant number |
| nbh | modeled hours of the modeling period |
| p | power |
| P | process vector |
| Q | characterization matrix |
| RES-E | renewable energy sources of electricity |
| s | scaling vector |
| S | feasible region in the solution space |
| SI | supplementary information |
| tec | technology type |
| u | availability factor |
| x | vector of decisions variables |
| α | depreciation period |
| η | efficiency factor |
| λ | modeling period |
| χ | binary decisions variables |
| φ | commission year |
Introduction
Climate change is one of the most important issues faced by global society in the 21st century. The magnitude of its contribution predetermines the energy supply sector as a key field of action due to the necessary transformation from a fossil fuel to a renewable based system. Energy policy is of great significance to energy systems, especially for the projected transition to a decarbonized sustainable energy supply. Policymakers usually need to establish policies based on a detailed assessment of competing technologies informed through energy system modeling. The common approach in energy system analysis is to model cost-optimal energy scenarios while constraining greenhouse gas (GHG) emissions. However, with an ever-increasing share of renewable energy sources of electricity (RES-E) this approach fails to account for other burdens and benefits associated with the deployment of power infrastructure and the operation of the power system. These co-burdens and benefits include, among many others, air pollution, public health effects (Lelieveld et al 2015, Rao et al 2016, West et al 2013), the water–energy–land nexus (Howells et al 2013) and biodiversity conservation (Gasparatos et al 2017, de Baan et al 2013, Gibon et al 2017). Consequently, the consideration of GHG emissions as the unique metric is not suitable for a holistic sustainability assessment. This is acknowledged on an international level by numerous organizations such as the World Energy Council, speaking of the 'Energy Trilemma' (World Energy Council 2016), the European Commission stating that the 'People's well-being, industrial competitiveness and the overall functioning of society are dependent on safe, secure, sustainable and affordable energy.' (European Commission 2011), and the Intergovernmental Panel on Climate Change (IPCC) specifying, 'Climate policy intersects with other societal goals creating the possibility of co-benefits or adverse side-effects. [...] This multi-objective perspective is important in part because it helps to identify areas where support for policies that advance multiple goals will be robust.' (Intergovernmental Panel on Climate Change 2014). Another recent prominent example is the formulation of the 17 Sustainable Development Goals by the UN. The 2030 Agenda for Sustainable Development seeks to achieve various targets such as building resilient infrastructure, ensuring access to clean energy and protecting sustainable use of ecosystems (United Nations 2015).
These examples elucidate the requirement of future energy system modeling to be capable of answering questions concerning not only the economic but also the environmental dimension. Seconding these arguments, the scientific community increasingly calls for an integrated assessment of these two dimensions, represented through the energy system and industrial ecology communities. (Liu et al 2015, Pauliuk et al 2017, Newlands 2016) Furthermore, the increasing relevance of the spatial aspects, which come with the shift of the environmental impacts from the point of converting chemical to electrical energy to the manufacturing of these technologies, emphasizes the need for a comprehensive assessment, including the whole global supply chain. (Laurent and Espinosa 2015, Daly et al 2015) We address these calls with an integrated life cycle based sustainability assessment combined with an energy system model (ESM) and apply this framework to the German power system expansion problem as a case study.
Various studies exist that use life cycle assessment (LCA) to examine the environmental impacts of electricity production from a product perspective (Turconi et al 2013, Varun et al 2009) or analyze the impacts of changed energy systems through scenario analysis (Gibon et al 2015, Kouloumpis et al 2015, Berrill et al 2016, Santoyo-Castelazo and Azapagic 2014b, Barteczko-Hibbert et al 2014). However, standard LCA models are static and linear, hence, lack relevance for identifying the optimal future mix of technology options and are unable to give insight concerning time-dependent decisions (Ekvall et al 2007). The necessary endogenous integration of the LCA into an ESM is missing (the decision of the ESM affects the LCA), suitable for answering key questions about the future energy supply.

Figure 1. Schematic of the general structure of MOrOSA. MOrOSA is a hybrid model combining ESM and LCA. The LCI database Ecoinvent 3 in conjunction with the impact assessment methodology of ReCiPe provides the technology specific impact indicator for the multi-objective ESM. One or more solutions of the resulting Pareto front of efficient solutions can then be analyzed in more detail with regard to capacity, commitment, costs, and LCA impacts.
Download figure:
Standard image High-resolution imageThe inclusion of the non-monetized life cycle based impacts into the optimization as well as developing the whole set of desirable solutions for decision makers is not possible with single objective ESMs and requires an extension to a multi-objective approach. Studies with a more comprehensive sustainability assessment are categorized according to the phase of decision maker inclusion (Hwang and Masud 1979) into the a priori (Oliveira and Antunes 2004, Meyerhoff et al 2010, Söderholm and Sundqvist 2003, Zhang et al 2007, Kim 2007, Gujba et al 2011, Wiser et al 2016a, 2016b, Stamford and Azapagic 2012, Treyer et al 2014, Gibon et al 2015, Shmelev and van den Bergh 2016, Atilgan and Azapagic 2016, Hertwich et al 2015), the interactive (Heinrich et al 2007, Karger and Hennings 2009, Kowalski et al 2009, Oliveira and Antunes 2004, Santoyo-Castelazo and Azapagic 2014a, Schenler et al 2009), and the a posteriori methods. The main drawback of the a priori assessment of energy scenarios is the fact that only cost optimal solutions are assessed for their environmental impact: the LCA dimension is not considered in the optimization or only enforced through emission limits i.e. additional constraints. Most importantly, however, only the a posteriori calculates the full spectrum of efficient solutions, called the Pareto front. This allows the decision maker to select the most preferred solution while being aware of the trade-off between the different systems. The relevance of this is acknowledged by the IPCC stating that '[...] a comprehensive exploration of the solution space [...] recognizes that mitigation itself is only one objective among others for decision makers.' (Pachauri et al 2014) There are examples in other fields of research for studies combining a posteriori multi-objective optimization with an LCA based sustainability assessment (Ingle and Lakade 2016, Gebreslassie et al 2009, Pieragostini et al 2012, Azapagic and Clift 1999, Azapagic 1999, Gerber et al 2011). In the ESM community, such models lack the foundation of the sustainability assessment based on the LCA methodology (Mavrotas et al 2008, Fazlollahi et al 2012, Buoro et al 2013, Sütő et al 2015) or consider systems very limited in systemic, spatial and temporal scope (Santoyo-Castelazo and Azapagic 2014b, Gebreslassie et al 2009, Pieragostini et al 2012, Azapagic 1999, Azapagic and Clift 1999).
Therefore, the aim of this study is to tackle the challenges mentioned above through the developed MOrOSA (Multi-Objective Optimization Sustainability Assessment) energy system model. The a posteriori model combines a detailed capacity expansion and unit commitment modeling with a multi-objective algorithm and an endogenously integrated elaborated LCA into a hybrid ESM. We illustrate this approach by applying MOrOSA to the capacity expansion and unit commitment problem of the German power system of 2030. Germany is chosen predominantly because of its prominent role in deploying renewable based power infrastructure, the importance of the production industry, the global integration of the economy, and its potential model role. The year 2030 serves as an intermediate time horizon on the way to a decarbonized energy supply while accounting for the current capital stock and avoiding over- or underestimation of long-term trends due to the partial-equilibrium formulation.
Methods
Figure 1 illustrates the structure of the MOrOSA framework. The model consists of the two main parts: energy system modeling and life cycle assessment. See appendix A for a detailed formulation of the ESM and appendix B for the LCA framework. As a general process, the LCA database is providing the technology specific impact indicators to the ESM. Then, the multi-objective optimization is performed utilizing these single score indicators, which can include several normalized and weighted impact categories. The resulting Pareto front provides an approximation of all efficient solutions which can then be selected for detailed analyses. The systemic characteristics of these points, each representing a potential future energy system, are fed back into the LCA database. The separation of the cost and impact in terms of fixed and variable portions facilitates the endogenous integration into the ESM. In contrast to the common approach of using unchanged LCA from the literature, this method avoids possible inconsistencies, for example concerning the development of full load hours not fed back into the LCA.
As stated above, the transition from a conventional technology-based system to an increased share of RES-E generation shifts the environmental impact from the process of generating electricity to the production of the generation technologies itself. The premise for developing the ESM is, therefore, to achieve a detailed power system operation while including the capacity expansion. Consequently, the model is designed as a partial equilibrium model formulated as a mixed integer linear programming problem with the focus on a detailed representation of the power system operation. Traditionally, the capacity expansion models neglected a detailed operation of the system, the reason being that the combination of a capacity expansion and a unit commitment quickly becomes intractable due to the computational complexity. However, the improvements in computational power as well as in the applied solvers facilitate the integration of both models (Rosen et al 2007, Kamalinia et al 2011, Ma et al 2013, Pina et al 2013, Flores-Quiroz et al 2016).
Presenting the whole picture of optimal solutions requires the efficient generation of the approximation of the Pareto front. The Pareto front consists of non-dominated solutions; this means that it is not possible to enhance the solution in one dimension without worsening it on another dimension. Therefore, instead of calculating one single optimal solution, a sufficient number of grid points approximating the Pareto front is required. This considerably raises the computational burden. Accordingly, the design of the multi-objective algorithm plays a crucial role in achieving an applicable modeling framework, see appendix A for details.
The electricity system expansion problem of Germany
The developed hybrid modeling framework is applied to the electricity system capacity expansion problem with Germany as a modeling region. The result encompasses the built/decommissioned capacity and its commitment in the modeling period λ of 2030 with 2015 as the base year. The modeled hours of the modeling period λnbh are four weeks of representative seasonal time slices with a total number of 672 h. See appendix C for a detailed description of the data sources and assumptions.
The electricity supply as well as the associated environmental impacts are separated into a fixed and a variable portion. The fixed portion reflects the cost and impact associated with the production and construction of the power generation infrastructure as well as all the upstream processes necessary, for example steel production and land transformation for the construction of a coal power plant. The variable portion on the other hand represents costs and impacts caused by the generation of electricity itself, for example mining and burning of coal. The emissions are based on the ecoinvent 3.2 LCA database encompassing about 13 000 production processes and 2000 emissions (Treyer and Bauer 2016) covering 89% of the global electricity production. These environmental interventions are translated into impacts using the widely accepted ReCiPe methodology (Goedkoop and Huijbregts 2013). This impact assessment methodology considers 17 midpoint indicators that can be converted into a single score by the use of a weighting procedure (see appendices A and B for details on the energy system model and LCA approach). All data and assumptions are available in the supplementary information (SI) available at stacks.iop.org/ERL/12/124005/mmedia, and in the code of the LCA method at https://doi.org/10.5281/zenodo.1010461.
The Pareto front of efficient solutions is shown in figure 2 (top left) (SI folder results 'pareto_front'). Every point represents a power system in 2030. The single score ReCiPe based LCA indicator hλ and the cost cλ are plotted relative to the cost optimal system, represented by P1. The Pareto front represents the trade-offs between cost and impact. Following the curve from P1−P11 (going from cost optimal to an increased consideration of impacts) reveals an initially relatively steep decrease of the LCA impact compared to the increase in cost, representing the low hanging fruit of impact mitigation. This decrease levels out starting from P7 and the last step from P10−P11 comes with a comparably high increase in cost. As stated above, the a posteriori method presents an approximation of the full spectrum of non-dominated systems. The nature of the solutions of being non-dominated requires a decision maker to choose the desired system according to a set of preferences. For the purpose of this study P10 is selected as a desirable system configuration. This low impact system is able to cut the impact by a factor of four with an increase of cost of 84%. Understanding the effect of the LCA impact consideration on the resulting system requires a detailed analysis. This is applied to the two extreme points P1, P11, and the selected low impact system P10. Figure 2 shows the resulting capacity in 2030 aggregated over the different technologies tec on the right side and the commitment of this capacity on the left side for each of these three points (SI folder results 'capacity_generation_2030_p01, _p10, _p11'). They significantly differ in total capacity as well as in the technological structure: the overall capacity almost doubles in P11 compared to P1, an effect of the considerably lower possible full load hours of renewables. The conventional technologies mainly differ in the increased decommissioning of lignite and coal and an increased resulting capacity of gas in P10 and P11. The RES-E technologies show a clear trend with a considerably higher capacity in P10 and P11 compared to P1. Solar photovoltaic (PV), wind and biogas all at least double their capacity, with wind >3 MW, wind offshore and ground mounted solar PV almost tripling. The changing capacity structure is reflected in the generation pattern: the massive expansion of RES-E pushes the conventional power plants into the role of peak load generation. Consequently, the base load generation of lignite and coal in P1 is replaced by volatile wind and solar PV and a flexible commitment of biogas and natural gas in P11.

Figure 2. Pareto point analysis in terms of capacity and generation. The top left shows the Pareto front of efficient solutions for the German power system in 2030 relative to the cost optimal solution P1. Here the ordinate shows the cost relative to a cost optimal system and the abscissa the impact also relative to a cost optimal system. Every point (P1−P11) of the front represents a non-dominated power system. The other three facets each depict the corresponding capacity on the right and the generation mix on the left for the modeling period λ of the three analyzed Pareto points. P1 (top right) represents the cost optimal, P11 (bottom left) the LCA based impact optimal and P10 (bottom right) the selected system.
Download figure:
Standard image High-resolution image
Figure 3. Pareto point analysis in terms of fixed and variable LCA-based impact. The top left shows the Pareto front of efficient solutions for the German power system in 2030 relative to the cost optimal solution P1. The other three facets each depict the corresponding fixed LCA-based impact on the right and the variable LCA-based impact on the left for the modeling period λ of the three analyzed Pareto points. P1 (top right) represents the cost optimal, P11 (bottom left) the LCA based impact optimal and P10 (bottom right) the selected system.
Download figure:
Standard image High-resolution image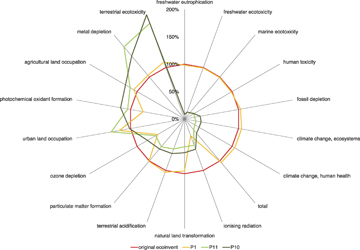
Figure 4. Categorical analysis of the process 'DE market for electricity, low voltage'. The three Pareto points chosen for the in-depth analysis are evaluated in terms of their performance concerning the 17 ReCiPe H/A midpoint impact categories. The impacts are plotted relative to those of the original ecoinvent 3.2 process.
Download figure:
Standard image High-resolution image
Figure 5. Spatial contribution analysis of the process 'DE market for electricity, low voltage'. The figure illustrates the spatial distribution of the total ReCiPe indicator and the seven midpoint categories of the original ecoinvent 3.2 process in (a). The midpoints categories are selected according to their relative contribution to the total impact, given in each caption. (b) Shows the redistribution effect for the same impact categories as a relative change from the original ecoinvent 3.2 to the P10 process.
Download figure:
Standard image High-resolution image
Figure 3 shows the temporally differentiated LCA dimension, again decomposed in a variable portion associated with the generation of electricity, and a fixed portion caused mainly through the capacity expansion. A very pronounced effect is visible concerning the fixed LCA-based impact. The low impact system of P10 shows a six-fold surge, which increases to even ten times the fixed impact in P11. The installation of wind and solar PV is the main driver for this development. Simultaneously, the variable impact is characterized by a massive decrease from P1−P10, mainly caused by the phase-out of lignite and coal. P11 only yields comparably small variable impact mitigation by restricting coal production to times with a very low wind generation. Essentially, the lower remaining impact associated with electricity is shifted from the generation to the production of the generation infrastructure. This trend is reflected when comparing the ratio of fixed to variable impact. In the cost optimal system the fixed impact is only 0.46% of the variable impact. This number rises to already 14.27% for P10 and 44.71% for P11.
This means, the generation of electricity causes mainly direct impacts in a cost-optimal system, for example, the combustion of fossil fuels, whilst the share of the impact caused by the production and construction of the power plants itself increases considerably in an LCA-based impact optimal system.
Contribution analyses
Constructing the modified technology matrix A and intervention matrices B facilitates the assessment of the effects of an optimized energy system on all products and processes of the global economy. Therefore, insights of the effect of a changing power supply on key industrial products and consumer goods is possible. The most pronounced effect however is expected for one unit of electricity itself, we therefore exemplary assess the environmental impacts of 1 kWh of German household level electricity for the three Pareto points and compare them to the corresponding impacts of the original ecoinvent 3.2 model (SI folder results 'H_elctr_ low_voltage_market_DE_original, _p01, _p10, _p11'). The approach of the ReCiPe method to model the effect of emissions on 17 so called midpoint indicators enables the details analysis of the three systems regarding their respective performance.
Figure 4 illustrates the performance concerning the 17 ReCiPe midpoint impact categories of the three Pareto points relative to the original data set (SI folder results 'categorical_analysis'). Noticeable is the very similar total impact and impact distribution of P1 compared to the original data. The total impact of the low impact system on the other hand is reduced to only 34%. Furthermore, the categorical distributions of the impacts vary significantly compared to the original process, representing co-benefits and burdens. Most categories show a reduction, however, there are a few categories with a significantly higher impact, namely terrestrial ecotoxicity, metal depletion, agricultural land occupation, photochemical oxidant formation, and urban land occupation.
The observed shift from direct to indirect emissions as well as the considerable changes in a variety of impact categories highlights the relevance of a spatial contribution analysis to understand possible spatial redistribution implications. There are efforts to develop spatially differentiated impact assessment methods (Mutel et al 2012, de Baan et al 2013, Verones et al 2016). However, we use the global generic approach of the ReCiPe method since very specific complementary modeling approaches are necessary, which is beyond the scope of this paper (disregarding geographic variations in sensitivities to environmental pressure, and long-range transport of emission).
Figure 5 shows the results of the spatial contribution analysis for the total ReCiPe score and the seven most influential impact categories in terms of their contribution to the total impact (SI folder results 'spatial_contribution_analysis'). The spatial distribution of the impact for every country is plotted for the original ecoinvent 3.2 process of 1 kWh of household level electricity relative to the overall intercategorical impact in figure 5(a). The impact of the total of the categories, fossil depletion, climate change, human health, and climate change ecosystems show a similar spatial distribution pattern. The majority is caused in Germany (53% for total), with France (6%), the United States (5%), Russia and China (3%) also facing a considerable amount of impacts. The agricultural land occupation map indicates a strong concentration of the impacts in Germany (24%) and even greater so in Sweden (59%, wood chips export). Human toxicity and metal depletion, on the other hand, are mainly attributed to the United States (24%) and China (15%) with only a small contribution in Germany (5%, 3%). Particulate matter is characterized by an expected concentration of the impacts in Germany with a share of 54%.
Highlighting the changes, which come with the low impact system P10, the relative changes compared to the original database are plotted in figure 5(b). Here the intercategorical spatial redistribution effects are examined. The shift from variable to fixed impacts already seen in the ESM is also prominent in the adjusted corresponding LCA database processes of P10. All eight indicators show a moderate to significant decrease of the impact in Europe and Germany especially. The absolute distribution of the total impact is shifting to only 31% (53% original) in Germany, 11% (5%) in the United States, 9% (3%) in Russia and 8% (3%) in China. As stated above the main cause is the redistribution of the impacts upstream on the supply chain. The analysis of the other world regions reveals the impact of this shift. Despite the decrease of the total impact in all countries, the heterogeneous redistribution mainly affects particulate matter formation, metal depletion, and agricultural land occupation. A very prominent example is particulate matter: the United States (16%) and China (14%) are almost experiencing the same impact as Germany (18%). The climate change categories redistribution effects indicate the increased GHG emissions outside of Germany for the production of power infrastructure.
Discussion
This study is the first analysis developing a hybrid modeling framework combining a multi-objective ESM with LCA answering the call for collaboration of the energy system modeling and the industrial ecology communities. Furthermore, the approximation of the whole spectrum of efficient solutions and the integration of a LCA database enables the decision maker to make truly informed decisions when designing policies, taking into account a wide array of emission and corresponding response functions. The encompassing nature of the method provides information about a comprehensive set of co-benefits and burdens identifying possible areas of conflict between a sustainability driven power supply and single impact categories. However, achieving completeness requires a generic impact assessment, the detailed assessment of these co-benefits and burdens each should be addressed with a more specific modeling approach.
MOrOSA includes the whole supply chain of the modeled technologies, achieved through the integration of a non-monetized elaborated LCA-based framework for sustainability. The separate modeling of capacity and generation provides a detailed assessment of the Pareto points, both in terms of the fixed impact associated with the power infrastructure and variable impact associated with the generation of electricity itself. This facilitates the analysis of spatial impact leakage up the supply chain. A feature highly relevant for policy advice when considering that only about 56% (original ecoinvent 3.2) of the impacts according to ReCiPe score are caused in Germany, this share even drops to 31% for the analyzed low impact system of P10. Besides that, the drastic increase of the impact caused by the power supply infrastructure compared to the actual burning of fuels highlights the relevance of the consideration of the whole supply chain accounting for embodied emissions. Another key insight is provided by the feedback of the ESM into the LCA database, facilitating the in-depth analysis of the implications of changing power systems on all processes and products of the economy. This is especially relevant for designing policies considering that every economic branch uses electricity as an input. The feedback also enables contribution analyses according to unit processes by providing a holistic picture of important processes and/or regions. The exemplary assessment of 1 kWh of electricity in Germany shows that besides the decrease of the total impact, there are other impact categories where the allegedly sustainable scenarios show a high increase in impact (metal depletion, agricultural land occupation). Additionally, the spatial contribution analysis differentiates this finding and illustrates which spatial implications arise due to an electricity system based on renewable energies. Although the overall ReCiPe impact score decreases in all countries, the analysis reveals the prevailing trend of certain environmental impacts shifting from Germany upstream the supply chain to the countries of production of the power generation technologies.
The combination of multi-objective energy system modeling and LCA has still a number of shortcomings. Generally, hybrid modeling does not provide full consistency (Haes et al 2004). The classification of processes in ecoinvent 3.2, relevant for the German energy system, is not identical to the classification in the ESM. To overcome this, we selected representative processes to determine the impacts of its variable and fixed parts impacts as input flow for the ESM. Respectively, it is necessary to split the aggregated structure of the ESM into the more detailed structure of ecoinvent 3.2. Hence, future effort is necessary to adjust the ESM technology classification to the LCI database. Additionally, the aim of future research should be to improve LCA databases by providing spatially differentiated processes as well as impact characterization factors. Another important issue is the process of updating the ecoinvent 3.2 databases according to the optimization. In the current version of the hybrid model, the LCA database is modified at the end of the optimization. The dynamic adoption of upstream effects due to a modified electricity system is not considered. Hence, future research should analyze to what extent a more frequent modification of the LCI database is preferable. The main issue here is the necessary inversion of the high dimensional technology matrix A, which will considerably increase computation time. Social aspects are so far only considered in the form of human health. However, there is the possibility to broaden the scope by introducing a third objective function using a social intervention matrix in the same manner as the environmental intervention matrix in LCA. Although there are recent efforts in the LCA community concerning the development of such databases, the current data availability is not suitable for inclusion in this study. Additionally, this study uses the cut-off model of the ecoinvent 3.2 database. There are other models differing in how they deal with multi-functional processes. The cut-off model always allocates primary production of to the primary user of a material. Future studies should check how upstream impacts change due to this modelling choice and to what extend results are affected. A potential alternative to LCA databases is the coupling of ESM with a multi-regional environmentally extended input-output database. Those databases can illustrate the interrelations of sectors between different regions in a more consistent manner. On the other hand, environmental interventions are less comprehensive compared to LCA databases. Combining both models and integrating them into ESM should therefore be another field of future research.
Conclusion
The application of the developed modelling approach to the case study of the German power system expansion problem revealed a variety of insights. Most prominently, the inclusion of the LCA based sustainability consideration into the optimization showed the cost efficient achievement of impact mitigation in the power sector: reducing the impact by a factor of four with a moderate increase in cost. Additionally, these results are in line with climate mitigation scenarios, showing the sustainability benefits of renewable power generation not only for the climate but on many environmental dimensions. The integrated assessment of energy system futures and their effect on sustainability is expected to gain relevance through projected developments in the energy system: for example the electrification of transport, heat and other sectors, global supply chains, and the decarbonization of the energy system of world regions with different speeds. Here trade-offs are often not obvious and informed decisions require an integrated assessment. This study should therefore be seen as a first step towards an integrated assessment strengthening the call for joint work of the energy system and industrial ecology communities on these issues.
Author contributions
S R led the overall effort and wrote most of the paper. M B contributed formulating the theoretical LCA chapters, carrying out the contribution analyses, and formulating the discussion. Both authors developed the general structure of the hybrid modeling.
Appendix A: Energy system modeling
The main parameters are the modeling period λ, the modeled hours λnbh, the region r, the power plant number n and the technology type tec. The objective function is to minimize the total system cost c for the modeling period, see equation A.1. Selected constraints are illustrated by equations A.2–A.8. They include the supply and demand, the maximal and minimal capacity, part-load efficiency and the shut-down and start-up constraints (SI ESM folder 'MOrOSA_core_GAMS_code').
subject to


The possibility to invest and disinvest is implemented by the introduction of binary variables described by equations (A.9) and (A.10)
The resulting fixed costs equation depends on the investment or disinvestment of capacity and consists of quasi-fixed and annualized capital cost related to the power plant capacity (equation A.11)
The introduction of the possibility to invest and disinvest in capacity requires the simplification of the model to be solvable in a reasonable time. Clustering is an effective way to improve the computational burden while limiting the loss of detail (Palmintier and Webster 2011). The model considers the fuel efficiency rate as a function of the technology type and the commission year. Therefore, the clustering is performed along these features.
Introducing the LCA dimension extends the original optimization problem to a multi-objective one represented by the formulation of equation (A.12)
where feconomic(x) and fLCA(x) are the objective functions, x the decision variables vector and S the feasible region in the solution space. fLCA(x) consists of a variable and a fixed share defined by equations (A.13–A.15). The fixed impacts are distributed over the depreciation period of the power plant

There are two methods that are mainly used to generate the Pareto front, the weighting, and the ε-constraint method (Mavrotas 2009). The weighting method is the most intuitive, as it finds the supported solutions through a convex combination of the objective functions. This, however, yields some disadvantages. Among them the inability to obtain unsupported solutions, the sensitivity to scaling and the difficulty in setting the number of calculated grid points. The ε-constraint method does not face these disadvantages and the inherent drawbacks can be dealt with through the development of an augmented version (Mavrotas and Florios 2013). The general idea is to optimize a primary objective function while expressing the other objective functions as inequality constraints, leading to equation (A.16)
The ε-constraint method was applied to a variety of energy-related problems, among them the electricity market clearing (Aghaei and Amjady 2012), the expansion planning of the transmission grid (Mavalizadeh and Ahmadi 2014) and portfolio management (Esmaeel Nezhad et al 2015). The algorithm applied in this study is an adapted version of the augmented ε-constraint algorithm (Mavrotas 2009, Mavrotas and Florios 2013a). The general process is to calculate the payoff table through lexicographic optimization, determining the nadir and utopia point. The range of the second objective function is then divided into intervals and corresponding grid points. These are iteratively used to adjust the ε of equation (A.16) while optimizing, feconomic generating the Pareto front. The advantages over the standard ε-constraint method are that grid points not providing Pareto optimal solutions are skipped. Additionally, the conversion of the inequalities to equalities through the introduction of slack variables ensures that only strict non-dominated solutions are calculated (Mavrotas and Florios 2013).
Appendix B: Life cycle assessment
Life cycle impact assessment converts the environmental inputs and outputs into indicator results of categories that are better understandable in terms of environmental significance. In matrix notation, the potential environmental impact vector hl results from multiplying the matrix of characterization factors Ql,k, the intervention matrix Bk,j (process specific environmental inputs and outputs), the inverse of the technology matrix Aj,i (representing the linkage between the processes) and the final demand vector fi that specifies the functional unit, expressed through equation (B.1). Where k is the environmental intervention, l the impact category, i the technology matrix flow and j the process (Heijungs and Suh 2002)
Several databases provide LCI data for A and B matrices. Additionally, a variety of life cycle impact assessment methodologies exists that provide the characterization factors of Q. In this study, LCI data of the ecoinvent 3.2 cut-off system model and the characterization factors of the ReCiPe methodology are used. This methodology provides characterization factors considering the significance of the indicator results of 17 midpoint impact categories. These are aggregated into three endpoint impact categories: damage to human health [disability-adjusted loss of life years], to ecosystem diversity [loss of species during a year] and to resource availability [increased cost]. The quantification of a single score using the hierarchist perspective enables the optimization of the German electricity system in terms of several weighted impact categories. This weighting in terms of societal preferences is subject to debate and adjustments according to decision maker preferences are possible.
As input, the optimization algorithm of the energy system model requires the environmental impacts of variable and fixed parts of each generation technology determined by equation (B.2)

Equation (B.3) calculates the indicator result of variable parts of the electricity system, such as fuel, related to 1 kWh electricity output of the corresponding technology. The demand vector for the variable part of the impact is calculated by subtracting the fixed share, such as construction material, from the functional unit that represents the overall generation of 1 kWh electricity of the corresponding technology (SI LCA folder 'h_variable')

Matching the fixed part of the ESM which is represented in units of capacity requires the indicator result to be divided by the size of the installed capacity (see equation (B.4)) (SI LCA folder 'h_fixed_kW')
The result of the optimization algorithm is a Pareto front of optimal solutions in terms of costs and environmental impacts. Assessing these optimal solutions with the full capabilities of the LCA is achieved through the feedback of the ESM results into the LCA database. Therefore, a new LCA database is created using the updated and optimized electricity processes. For each of them a new process vectors P⁎ is formulated to take into consideration technology and commissioning year specific characteristics, according to equation (B.5). These vectors include the new data of the optimization model for the technology matrix A⁎ and the intervention matrix B⁎
The change of efficiency rates incorporated in the efficiency rate vector Δηn are applied to the variable interventions b and the variable part of the technology vector a. Δηn is calculated throught the tec specific generation weighted difference of the commission date dependent efficiency compared to the base year efficiency. By the use of the adopted database, comprehensive analyses of the environmental impacts related to the changing German electricity system are possible.
The last phase of LCA, interpretation, deals with the meaning and the robustness of the results. An important aspect in terms of interpreting the meaning of results is the contribution analysis (Heijungs and Suh 2002). Thereby, for example, the contribution of unit processes to the overall impact indicator result can be determined according to equation (B.6). The set of unit processes P is partitioned according to i
Now it is possible to summarize hl(Pa) over different impact categories as well as geographic locations. The ecoinvent 3.2 database assigns a spatial location to all processes in the A matrix. Despite the majority of these spatial allocations being country or subcountry level, there are processes with a superordinate location assignment. To allocate these impacts to countries the relative economic performance based on gross domestic products (GDP) for the year 2015 (The World Bank 2017) is used.
Appendix C: Case study data and assumptions
The 2015 power system functions as the originator for the optimization. The input data encompasses the available generation capacity at the power plant level (Rauner et al 2016), the demand data of electricity (European Network of Transmission System Operators for Electricity 2016) as well as the capacity factors of RES-E (Staffell and Pfenninger 2016, Pfenninger and Staffell 2016) (SI folder ESM). Also included are the power plant data, in most cases a function of the commission year φ and the type of technology tec (Schröder et al 2013), the fuel price of conventional technologies (Kost et al 2013) which is assumed to be stable over the modeled period, and the efficiency data of conventional technologies (Schröder et al 2013). Similarly, the trend in recent years suggests the assumption of a stable load development is reasonable, despite other political goals. Additionally, the depreciation period α is an important parameter (Schröder et al 2013). The efficiency of RES-E technologies is also assumed to stable. The model is able to disinvest when the lifetime is reached with a period of five years after which the power plant has to be mandatorily disinvested. The bioenergy technology is assumed to be heat driven until 2015, plants with a later commissioning date are capable of flexible generation. The current wind power is assumed to fall in the ecoinvent 3.2 category of 1–3 MW turbines whilst the potential plants fall into the >3 MW category. Refer to SI folder LCA for the variable, associated with the generation of electricity, and fixed, power system infrastructure, s, g (inventory vector Bs) and h matrices of all tec. The extension of the RES-E technologies is restricted to 200% of the governmental goal until 2030. Load shedding is possible with assigned cost of 1000€ MWh−1. The storage water capacity is assumed exhausted already in the base year. Fuel tax of the base year and a CO2 price is set to 8€ t−1.