
Characterization of the complete mitochondrial genome sequences of three Merulinidae corals and novel insights into the phylogenetics
- Published
- Accepted
- Received
- Academic Editor
- James Reimer
- Subject Areas
- Genetics, Taxonomy
- Keywords
- Dipsastraea rotumana, Favites pentagona, Hydnophora exesa, Scleractinia, Mitochondrial genome, Characterization, Phylogenetic analysis
- Copyright
- © 2020 Niu et al.
- Licence
- This is an open access article distributed under the terms of the Creative Commons Attribution License, which permits unrestricted use, distribution, reproduction and adaptation in any medium and for any purpose provided that it is properly attributed. For attribution, the original author(s), title, publication source (PeerJ) and either DOI or URL of the article must be cited.
- Cite this article
- 2020. Characterization of the complete mitochondrial genome sequences of three Merulinidae corals and novel insights into the phylogenetics. PeerJ 8:e8455 https://doi.org/10.7717/peerj.8455
Abstract
Over the past few decades, modern coral taxonomy, combining morphology and molecular sequence data, has resolved many long-standing questions about scleractinian corals. In this study, we sequenced the complete mitochondrial genomes of three Merulinidae corals (Dipsastraea rotumana, Favites pentagona, and Hydnophora exesa) for the first time using next-generation sequencing. The obtained mitogenome sequences ranged from 16,466 bp (D. rotumana) to 18,006 bp (F. pentagona) in length, and included 13 unique protein-coding genes (PCGs), two transfer RNA genes, and two ribosomal RNA genes . Gene arrangement, nucleotide composition, and nucleotide bias of the three Merulinidae corals were canonically identical to each other and consistent with other scleractinian corals. We performed a Bayesian phylogenetic reconstruction based on 13 protein-coding sequences of 86 Scleractinia species. The results showed that the family Merulinidae was conventionally nested within the robust branch, with H. exesa clustered closely with F. pentagona and D. rotumana clustered closely with Favites abdita. This study provides novel insight into the phylogenetics of species within the family Merulinidae and the evolutionary relationships among different Scleractinia genera.
Introduction
Merulinidae (Verrill, 1865) is a clade of corals that belongs to the order Scleractinia and currently comprises 149 species across 24 genera (Huang et al., 2014a; see also WoRMS Editorial Board, 2019). These species are mainly distributed in the Indo-Pacific and Caribbean regions, but are absent in the eastern Pacific. Initially, Verrill (1865) posited that the family Merulinidae (type genus Merulina) fell within the suborder Fungacea. Merulinidae, however, was not recognized as a valid family by subsequent authors (Quenstedt, 1881; Quelch, 1886; Vaughan, 1918; Hoffmeister, 1925; Faustino, 1927; Matthai, 1928; Yabe, Sugiyama & Eguchi, 1936), until Vaughan & Wells (1943) revived it. Some modifications were proposed successively (Umbgrove, 1940; Chevalier, 1975; Veron, 1985). Nested within the ‘Bigmessidae’ (Budd, 2009), Merulinidae was polyphyletic and its species belonged to multiple divergent subclades (Fukami et al., 2004; Fukami et al., 2008; Huang et al., 2009; Huang et al., 2011; Benzoni et al., 2011; Budd & Stolarski, 2011; Arrigoni et al., 2012; Budd et al., 2012). In recent years, based on the molecular phylogenies by Fukami et al. (2008) and Huang et al. (2011), Merulinidae was redefined and expanded to include all members of ‘Bigmessidae’; Faviidae Gregory, 1900 was demoted to a subfamily (Faviinae) of the new family Faviidae Milne Edwards & Haime, 1957. Meanwhile, Pectiniidae and Trachyphylliidae were regarded as junior synonyms of the family Merulinidae (Huang et al., 2011; Budd et al., 2012).
Members of Merulinidae—namely, Dipsastraea de Blainville, 1830, Favites Link, 1807, and Hydnophora Fischer von Waldheim, 1807—have been closely associated in the past. Dipsastraea had never been applied since it was established. Until the recent revision, Dipsastraea was redefined to include the Indo-Pacific lineages of Favia and all species of Barabattoia (now a junior synonym of Dipsastraea) (Budd et al., 2012; Huang et al., 2014a). Favites is a controversial genus because Favites pentagona (Esper, 1795) is more closely related to species of other genera, indicating that Favites is polyphyletic (Huang et al., 2011; Huang et al., 2014a; Huang et al., 2014b; Huang et al., 2016; Arrigoni et al., 2012). Huang et al. (2011); Huang et al. (2014a)) discovered that F. pentagona clustered more closely with species of Caulastraea, Oulophyllia and Pectinia, than with other Favites species based on three nuclear and two mitochondrial loci (28S rDNA, histone H3, ITS rDNA, mt COI and mt IGR). Huang et al. (2014b) and Arrigoni et al. (2012) showed similar results based on histone H3 and COI/ITS genes. F. pentagona’s morphology, however, is consistent with other Favites species. Hydnophora is a distinct genus, and molecular data have supported its monophyly (Huang et al., 2011; Huang, 2012). All three genera are part of the family Merulinidae, but the current interpretations of phylogenetic relationships between Dipsastraea, Favites, and Hydnophora conflict. For instance, Huang et al. (2014a) concluded that Hydnophora and Favites (with the exception of F. pentagona) were more closely related to each other than to Dipsastraea species. Huang et al. (2014b), however, found that Hydnophora, F. pentagona, and subclade B (including Coelastrea, Dipsastraea and Trachyphyllia geoffroyi) were closely related; other Favites species formed a separate subclade F. A maximum likelihood genus-level phylogeny (576 species) of Scleractinia based on 12 DNA markers suggested that Hydnophora was more closely related to Dipsastraea than to Favites (Kitahara et al., 2016). More work is needed to clarify the evolutionary relationships between Dipsastraea, Favites, and Hydnophora.
In recent decades, mitochondrial DNA (mtDNA) has frequently been used in phylogeny and molecular evolution studies (Boore, 1999; Curole & Kocher, 1999). Mitochondrion is an important eukaryotic organelle, the mitochondrial genome has become highly economized. It typically includes 13 oxidative phosphorylation (OXPHOS) related genes, two rRNAs that encode the two subunits of mitochondrial ribosomes, and an array of tRNAs used for translation within the organelle. Previous studies revealed that the evolutionary rate of Scleractinia’s mitochondrial genome is 10–20 times slower than that of other metazoan taxa, and 5 times slower than that of its nuclear genome (Van Oppen et al., 2000; Chen et al., 2009). Mitochondrial genome rearrangements occur relatively infrequently within Scleractinia. The mitochondrial genome, therefore, played a significant role in scleractinian studies on phylogeny reconstruction (Fukami & Knowlton, 2005; Arrigoni et al., 2016; Capel et al., 2016; Terraneo et al., 2016a; Terraneo et al., 2016b). It could help us explore Scleractinia’s evolutionary process and clarify the evolutionary relationship between Scleractinia and other Hexacorallia members, such as Actiniaria, Antipatharia, and Corallimorpharia (Fukami & Knowlton, 2005; Kitahara et al., 2014; Lin et al., 2014).
In this study, we sequenced the complete mitochondrial genomes of three corals, Dipsastraea rotumana, Favites pentagona, and Hydnophora exesa, using a next-generation sequencing (NGS) strategy. Moreover, we reexamined the phylogeny of Scleractinia based on 86 species across 15 families using the mitochondrial genomes obtained in this study and those available in GenBank. We aimed to (1) describe and compare the mitogenomes of these corals and (2) provide new perspectives on the phylogenetic relationships within the family Merulinidae. The information obtained in this study may facilitate future phylogenetic and molecular evolutionary studies of Scleractinia.
Materials & Methods
Sample collection and DNA extraction
Wild specimens of three Merulinidae species (D. rotumana, F. pentagona, and H. exesa) were collected from Daya Bay (22.56 N, 114.65 E; under 5.2 m), Guangdong Province, China, on 23 November 2015. Each species has only one specimen (Figs. S1–S3). A dissecting microscope was used to identify all specimens based on skeletal morphology characteristics, including the number of septa and denticles, calices and the dimension of calices, in accordance with published taxonomic descriptions (Veron, 2000; Chan et al., 2005). Total genomic DNA was kept at 4 °C after extraction by the DNeasy Tissue Kit (Qiagen, Shanghai, China). DNA concentration was measured by the Nucleic Acid Protein Analyzer (Quawell Technology Inc., Sunnyvale, USA). The genomic DNA extracted with each system was quantified in duplicates with the NanoDrop 2000 spectrophotometer (Thermo Scientific, USA). Additionally, each DNA sample was quantified in duplicates with the Qubit 2.0 fluorometer (Life Technologies, USA).
Genome sequencing
After the quality control steps, a total of 2 µg double stranded DNA (dsDNA) was sheared to ∼550 bp by the M220 focused ultrasonicator (Covaris, Woburn, MA, USA). Using an Agilent Bioanalyzer 2100 (Agilent Technologies, Santa Clara, CA, USA), fragmented DNA was tested for size distribution, and the library for MiSeq was generated using a TruSeq DNA PCR-free LT Sample Preparation Kit (Illumina, San Diego, CA, USA) according to the manufacturer’s instructions. The final library concentration was determined by real-time quantitative PCR with Illumina adapter-specific primers provided by the KAPA Library Quantification Kit (KAPA Biosystems, Wilmington, MA, USA). Our strategy for assembling the complete mitogenomes was identical to that of Niu et al. (2016). Raw reads were assembled de novo using commercial software (Geneious V9, Auckland, New Zealand) to produce a single, circular complete mitogenome.
Mitogenome annotation and analyses
DOGMA (Wyman, Jansen & Boore, 2004) and MITOS (Bernt et al., 2013) were used for preliminary annotation, and then protein-coding genes (PCGs) and rRNA genes were annotated by aligning the homologous genes of other reported scleractinian mitogenomes. We also identified and annotated the PCGs and rRNA genes by BLAST searches on the National Center for Biotechnology Information website. Transfer RNA genes were identified by comparing the results predicted by ARWEN, and then the cloverleaf secondary structures of tRNA genes were predicted by tRNAscan-SE 2.0 (Laslett & Canback, 2008; Lowe & Chan, 2016). Codon usage and nucleotide frequencies were calculated by MEGA 6.0 (Tamura et al., 2013). Nucleotide composition skew analysis was carried out with the formulas AT-skew = [A-T] / [A+T] and GC-skew = [G-C] / [G+C] (Perna & Kocher, 1995). We determined the codon usage of all PCGs and used MEGA 6.0 to calculate the Relative Synonymous Codon Usage (RSCU). The rates of nonsynonymous substitutions (Ka) and synonymous substitutions (Ks) for each protein-coding gene were determined with DnaSP 5.0 (Librado & Rozas, 2009).
Phylogeny reconstruction
We constructed the phylogenetic topology of 86 Scleractinia species using the 13 tandem mitogenome PCG sequences (excluding the stop codon), with 10 Corallimorpharia species as out-groups (Table S1). All sequences obtained in this study were submitted to GenBank. A best-fitting model matrix (Table S2) was chosen by a comparison of the Akaike information criterion (AIC) strategy with jModelTest 2 (Darriba et al., 2012). Based on Bayesian inference (BI) methods, we performed a comprehensive phylogenetic analysis using MrBayes 3.12 (Huelsenbeck & Ronquist, 2001). According to Markov chain Monte Carlo analysis, four chains (one cold and three heated chains) were set to run simultaneously for 1,000,000 generations. Each set was sampled every 100 generations with a burn-in of 25%, and the remaining samples were used to obtain the 50% majority-rule consensus tree.
Results & Discussion
Genome organization and composition
The complete mitochondrial genomes of D. rotumana (GenBank accession no. MH119077), F. pentagona (KY247139), and H. exesa (MH086217) were 16,466 bp, 18,006 bp, and 17,790 bp in length, respectively. They carried the typical composition, including 13 PCGs, two transfer RNA genes (tRNAMet, tRNATrp) and two ribosomal RNA genes (Fig. 1, Table 1). Length differences were primarily the result of variation in intergenic nucleotides. As found in other Scleractinia species, all PCGs, tRNA, and rRNA genes were encoded on the H-strand. The mitochondrial genome of these three corals were identical to most published scleractinian mitogenomes (Van Oppen et al., 2000; Chen et al., 2008; Wang et al., 2013).
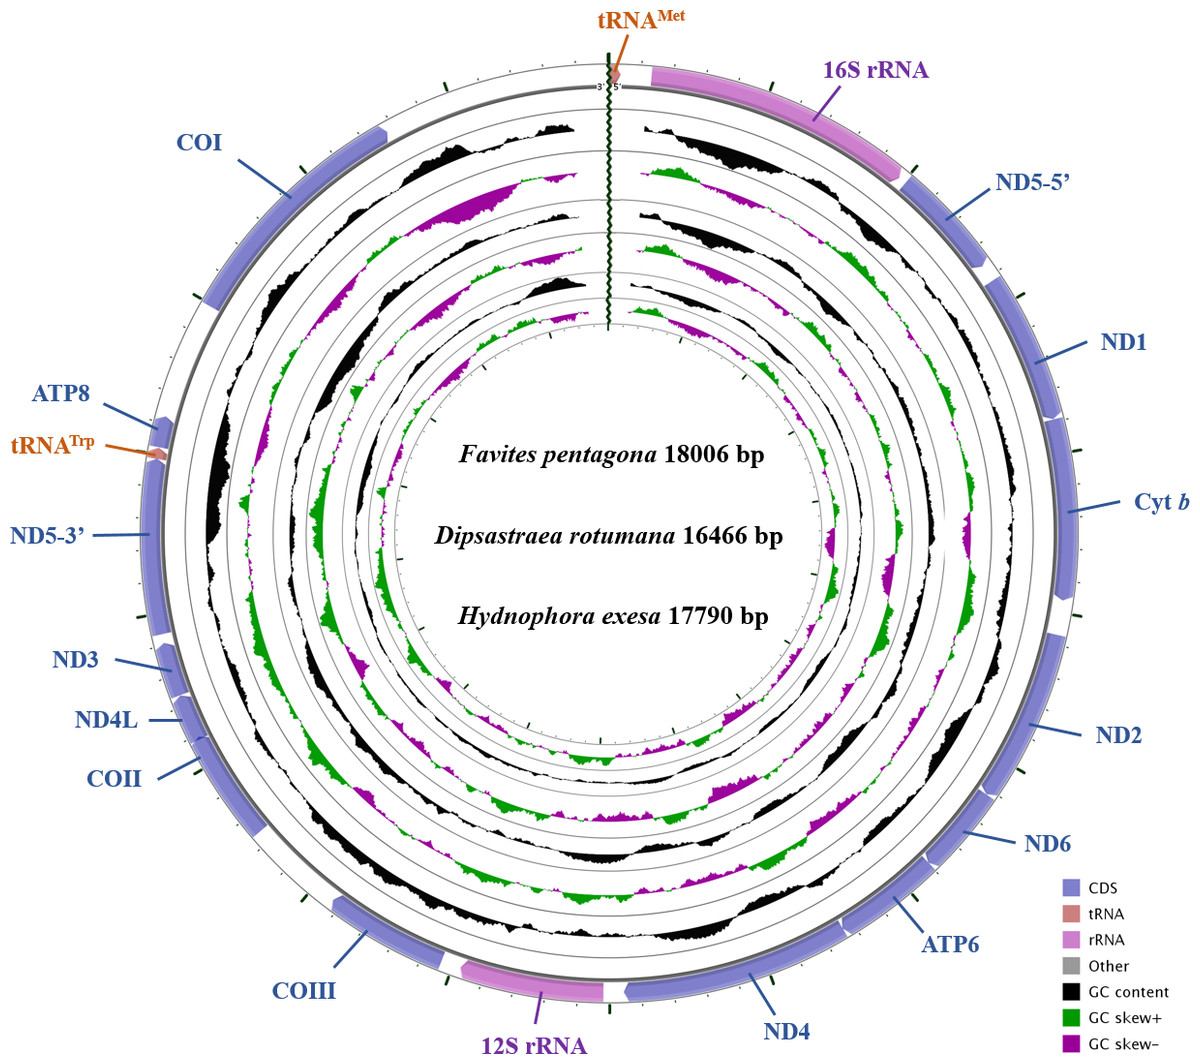
Figure 1: Gene map of the complete mitochondrial genomes for Dipsastraea rotumana (MH119077), Favites pentagona (KY247139), and Hydnophora exesa (MH086217).
The larger ring indicates gene arrangement and distribution, the smaller ring indicates the GC content. ND1-6: NADH dehydrogenase subunits 1-6; COI-III: cytochrome c oxidase subunits 1-3; ATP6 and ATP8: ATPase subunits 6 and 8; Cyt b: cytochrome b.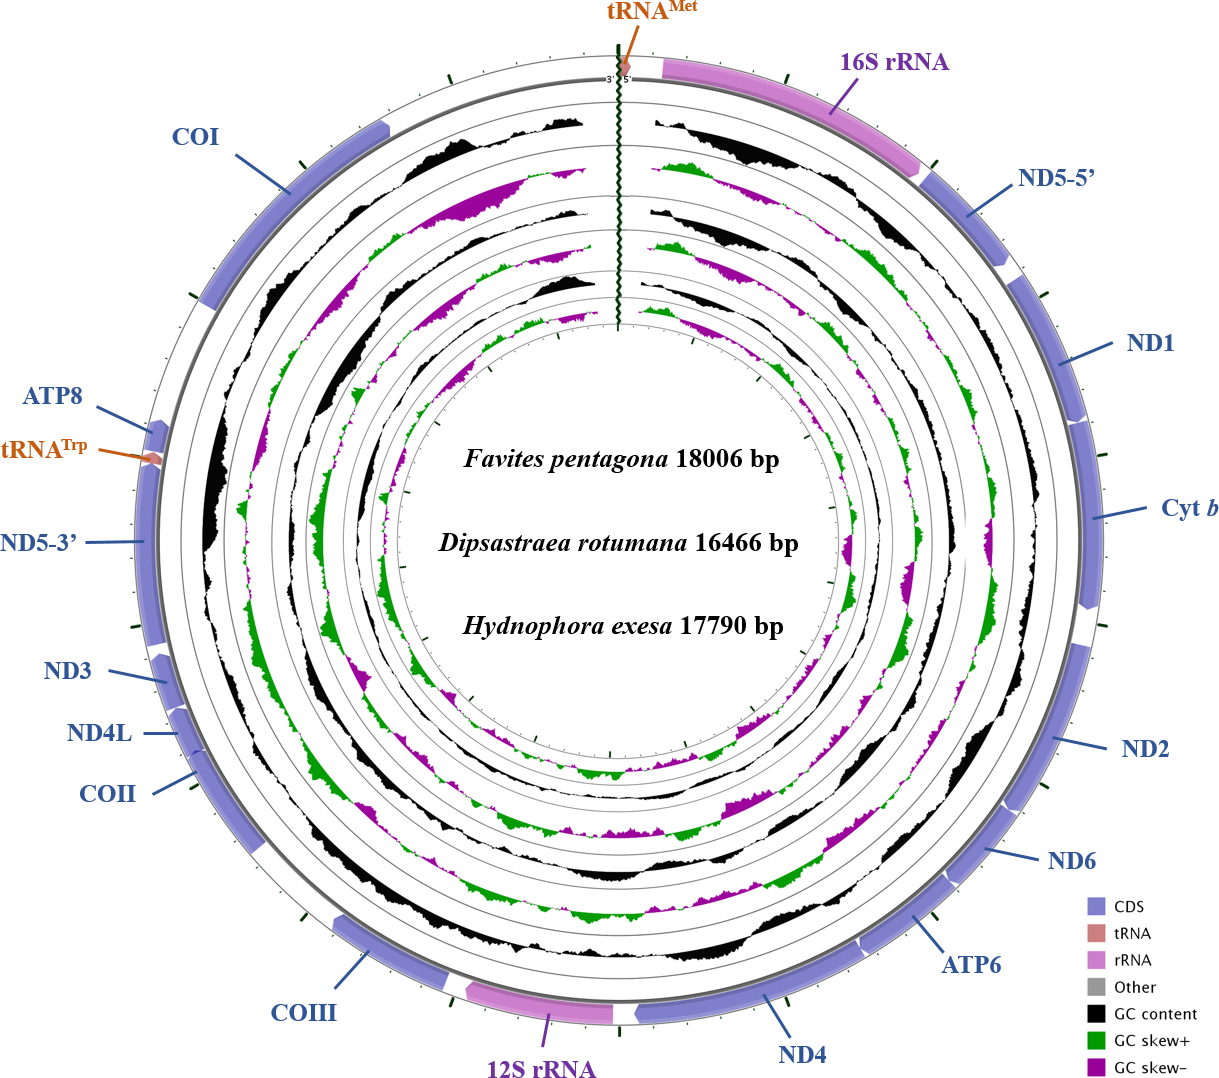
| Gene/ Element | Strand | Size (bp) | GC-Percent (%) | Amino Acids (aa) | InferredInitiation Codon | InferredTermination Codon | Anticodon | Intergenic Nucleotide* (bp) |
|---|---|---|---|---|---|---|---|---|
| tRNAMet | H | 72 | 43.06–44.44 | UAC (Y) | 674–1448 | |||
| 16S rRNA | H | 1698–1951 | 31.08–31.27 | 0–193 | ||||
| ND5 5′ | H | 711 | 32.35–32.84 | 236 | ATG | 0–49 | ||
| ND1 | H | 948 | 34.81–35.17 | 315 | ATG | TAG | 109–110 | |
| Cyt b | H | 1140 | 33.33–33.77 | 379 | ATG | TAA | 2 | |
| ND2 | H | 1287 | 31.88–32.42 | 428 | ATA | TAA | 25 | |
| ND6 | H | 561 | 30.84–31.55 | 186 | ATG | TAA | 1 | |
| ATP6 | H | 678 | 32.45–32.68 | 225 | ATG | TAA | −1 | |
| ND4 | H | 1440 | 32.24–33.82 | 479 | ATG | TAG | −1 | |
| 12S rRNA | H | 910–911 | 34.58–35.05 | 108–138 | ||||
| COIII | H | 780 | 36.79–37.18 | 259 | GTG | TAA | 67–125 | |
| COII | H | 708 | 33.63–34.6 | 235 | ATG | TAA | 626–713 | |
| ND4L | H | 300 | 28.67–29.96 | 99 | ATG | TAA | –19 | |
| ND3 | H | 342 | 31.29–31.76 | 113 | ATG | TAA | 2 | |
| ND5 3′ | H | 1104 | 30.34–30.53 | 367 | TAG | 56 | ||
| tRNATrp | H | 70–71 | 39.44–40.00 | AUC (I) | −2 | |||
| ATP8 | H | 198 | 19.70–20.71 | 65 | ATG | TAA | 3 | |
| COI | H | 1590 | 35.43–35.94 | 529 | ATG | TAA | −1–724 |
Nucleotide composition
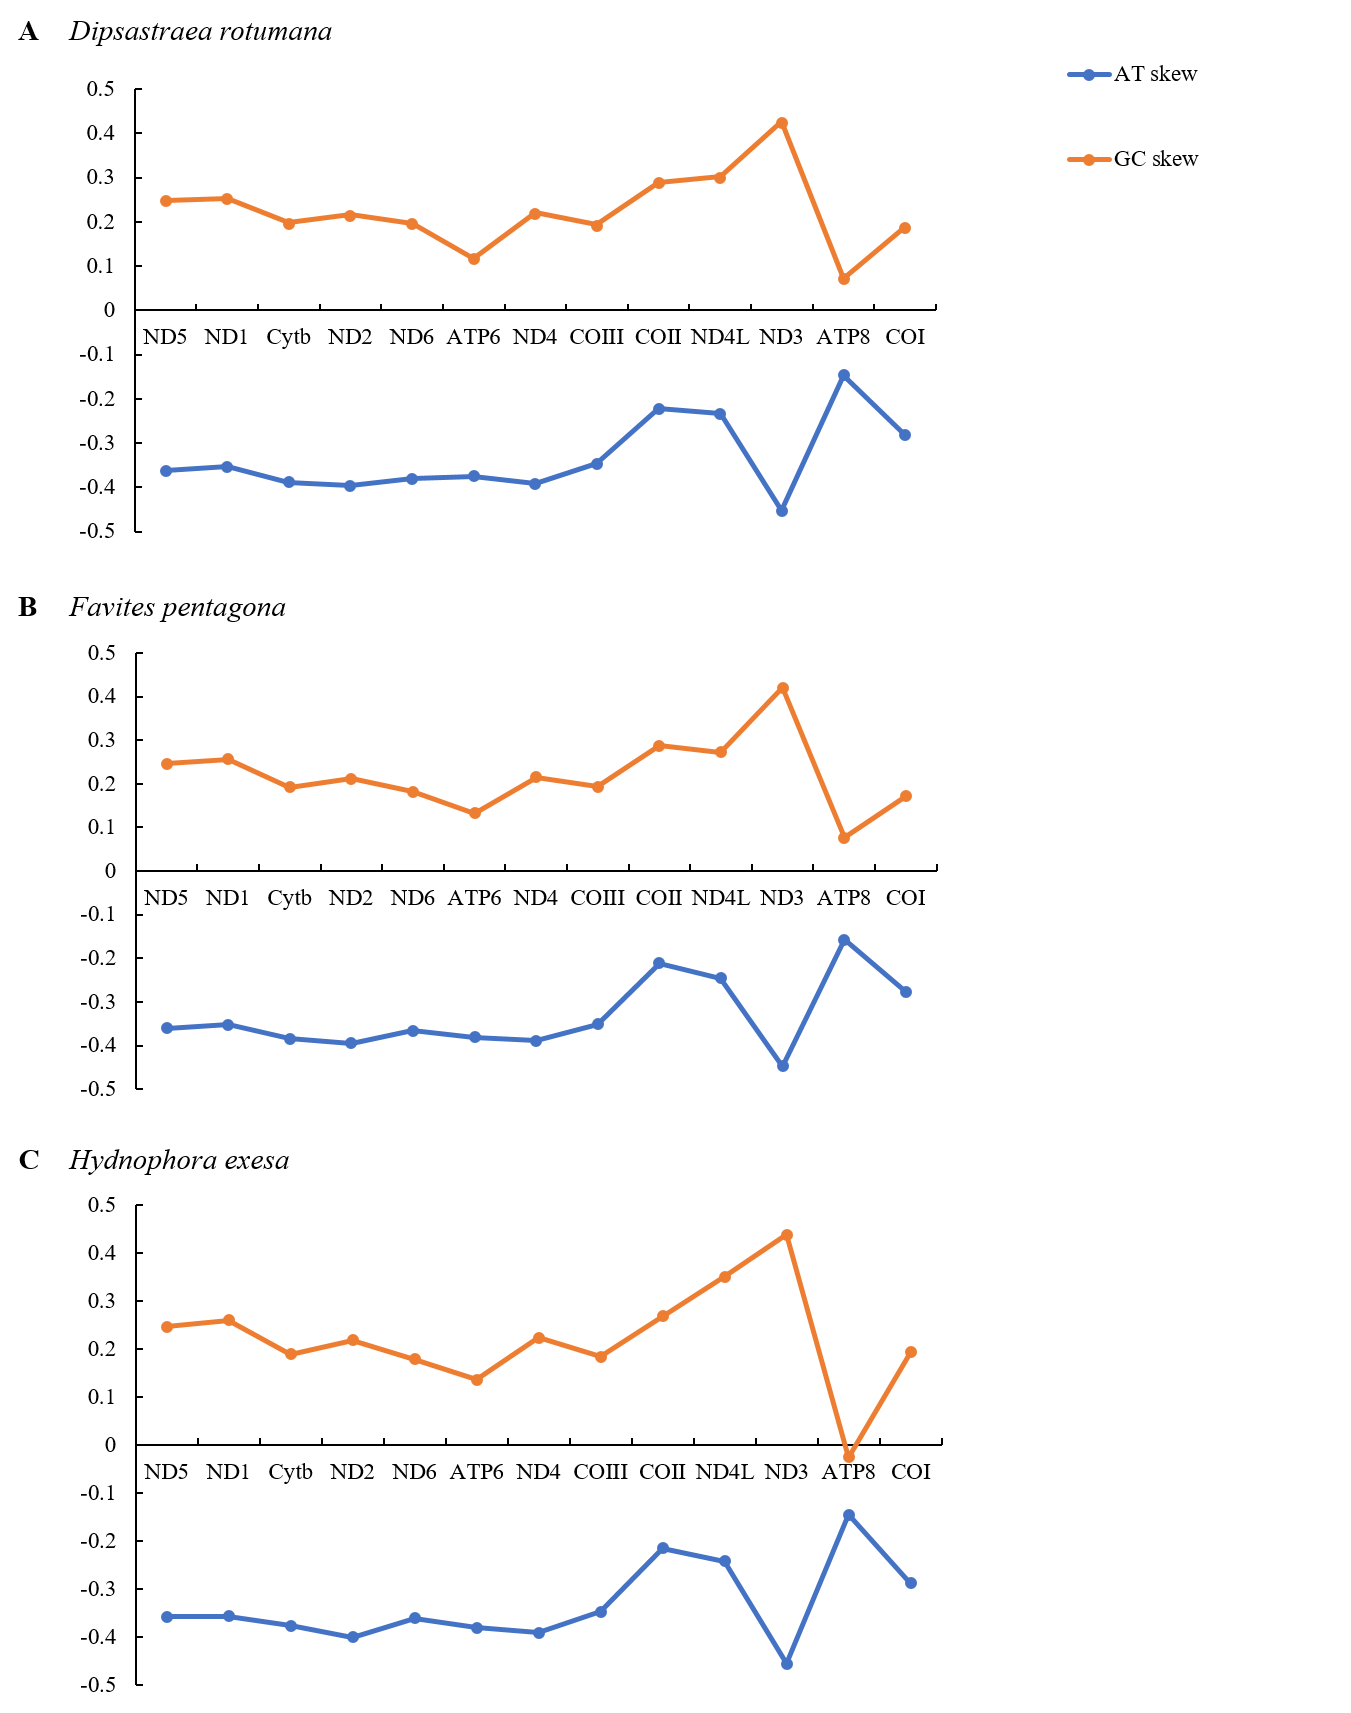
The overall nucleotide compositions of the three corals in descending order were 41.6% T, 25.2% A, 20.3% G, and 12.9% C for D. rotumana; 41.1% T, 25.3% A, 20.2% G, and 13.3% C for F. pentagona; 41.7% T, 25.0% A, 20.4% G, and 13.0% C for H. exesa; respectively. The dominant base of protein-coding genes was T and the dominant base of tRNA genes and rRNA genes was A. C was the least common base in all regions of the mitogenome for all three coral species, as is common in most species of Scleractinia (Fig. S4, Table 2). The nucleotide compositions of 14 related Scleractinia mitogenomes were also presented (Table 2). AT-skews analysis among these 14 species were all negative, while their GC-skews were all positive for both entire mitogenomes and protein-coding genes. AT-skew and GC-skew analyses indicated that in the complete mitogenomes, bases A and T were favored, whereas C was not. This was consistent with previous observations of most Scleractinia speices (Brugler & France, 2007; Niu et al., 2016). Regarding the PCGs, the ND3 gene showed the smallest value for AT-skews. The ATP8 gene showed the highest. The ND3 gene showed the highest value for GC-skews, whereas the ATP8 gene showed the lowest. H. exesa’s ATP8 gene had a negative value (Fig. S5).
| Species | Accessionnumber | Length(bp) | Entire genome | Protein-coding gene | ||||||||
|---|---|---|---|---|---|---|---|---|---|---|---|---|
| A (%) | T (%) | C (%) | G (%) | AT-Skew | GC-Skew | Length (aa) | AT (%) | AT-Skew | GC-Skew | |||
| Astrangia poculata | NC_008161 | 14,853 | 25.2 | 42.9 | 12.2 | 19.7 | −0.259 | 0.233 | 3837 | 68.039 | −0.345 | 0.231 |
| Colpophyllia natans | NC_008162 | 16,906 | 24.9 | 41.5 | 13.2 | 20.3 | −0.250 | 0.211 | 3847 | 67.040 | −0.351 | 0.224 |
| Cyphastrea serailia | KY094484 | 17,138 | 25.0 | 41.4 | 13.0 | 20.5 | −0.247 | 0.225 | 3916 | 66.735 | −0.350 | 0.219 |
| Echinophyllia aspera | MG792550 | 17,697 | 25.3 | 40.6 | 13.4 | 20.7 | −0.231 | 0.212 | 3943 | 66.044 | −0.349 | 0.211 |
| Favites abdita | NC_035879 | 17,825 | 25.0 | 41.2 | 13.3 | 20.5 | −0.245 | 0.213 | 3837 | 66.562 | −0.349 | 0.217 |
| Favites pentagona | KY247139 | 18,006 | 25.3 | 41.1 | 13.3 | 20.2 | −0.238 | 0.206 | 3915 | 66.502 | −0.349 | 0.216 |
| Dipsastraea rotumana | MH119077 | 16,466 | 25.2 | 41.6 | 12.9 | 20.3 | −0.246 | 0.221 | 3915 | 66.769 | −0.351 | 0.223 |
| Hydnophora exesa | MH086217 | 17,790 | 25.0 | 41.7 | 13.0 | 20.4 | −0.251 | 0.224 | 3915 | 66.863 | −0.350 | 0.223 |
| Mussa angulosa | NC_008163 | 17,245 | 25.1 | 41.2 | 13.4 | 20.3 | −0.242 | 0.203 | 3850 | 66.814 | −0.349 | 0.220 |
| Orbicella annularis | NC_007224 | 16,138 | 24.9 | 41.5 | 13.1 | 20.4 | −0.251 | 0.217 | 3912 | 66.385 | −0.352 | 0.220 |
| Orbicella faveolata | NC_007226 | 16,138 | 24.9 | 41.5 | 13.2 | 20.4 | −0.250 | 0.217 | 3912 | 66.377 | −0.352 | 0.220 |
| Orbicella franksi | NC_007225 | 16,137 | 24.9 | 41.5 | 13.2 | 20.4 | −0.250 | 0.215 | 3912 | 66.402 | −0.351 | 0.219 |
| Platygyra carnosa | NC_020049 | 16,463 | 25.6 | 41.4 | 12.8 | 20.1 | −0.236 | 0.222 | 3916 | 66.658 | −0.349 | 0.221 |
| Sclerophyllia maxima | FO904931 | 18,168 | 25.3 | 41.0 | 13.1 | 20.6 | −0.237 | 0.221 | 3943 | 66.863 | −0.354 | 0.231 |
Protein-coding genes
It is worth noting that the mitogenomes of all three Merulinidae species showed an intron insertion in the protein-coding gene ND5 (positions 10,147–10,243). The ND5 intron contained ten protein-coding genes and one rRNA gene, which was consistent with the canonical sequence in scleractinian mitogenomes (Type SII Lin et al., 2014). In the mitogenomes of D. rotumana, F. pentagona, and H. exesa, the COIII gene started with GTG, the ND2 gene started with ATA, and all of the remaining protein-coding genes used ATG as the start codon. In addition, three of the 13 PCGs (ND1, ND4, and ND5) used TAG as the stop codon, and the other ten PCGs (Cyt b, ATP6, ND2, ND4L, ND3, ND6, COIII, COII, COI, and ATP8) used TAA as the stop codon.
Mitochondrial gene codon usage
The amino acids Leu, Ser, and Arg, which were encoded by six different codons, appeared more frequently than other amino acids (Fig. 2). For all 13 mitochondrial PCGs of D. rotumana, F. pentagona, and H. exesa, the nonsynonymous/synonymous mutation ratio (Ka/Ks) varied from 0 to 0.5043 (Fig. 3). Nonsynonymous substitutions are generally more harmful than synonymous substitutions. In mitogenomes, some genes may play more important roles than other genes. Therefore, it is reasonable to assume that in order to maintain their function some genes have undergone stronger selective constraints to eliminate deleterious mutations than others. The analysis of the Ka/Ks ratios indicated that the mitochondrial PCGs evolved under strong purifying selection, which signified natural selection against deleterious mutations with negative selection coefficients (Yang & Bielawski, 2000). The Ka/Ks ratios varied for different genes, implying that different genes accumulated different amounts of deleterious mutations. The results showed that ATP8 genes in 13 PCGs presented the highest Ka/Ks values, indicating that the ATP8 gene was under minor selection pressures (Lynch, Koskella & Schaack, 2006).
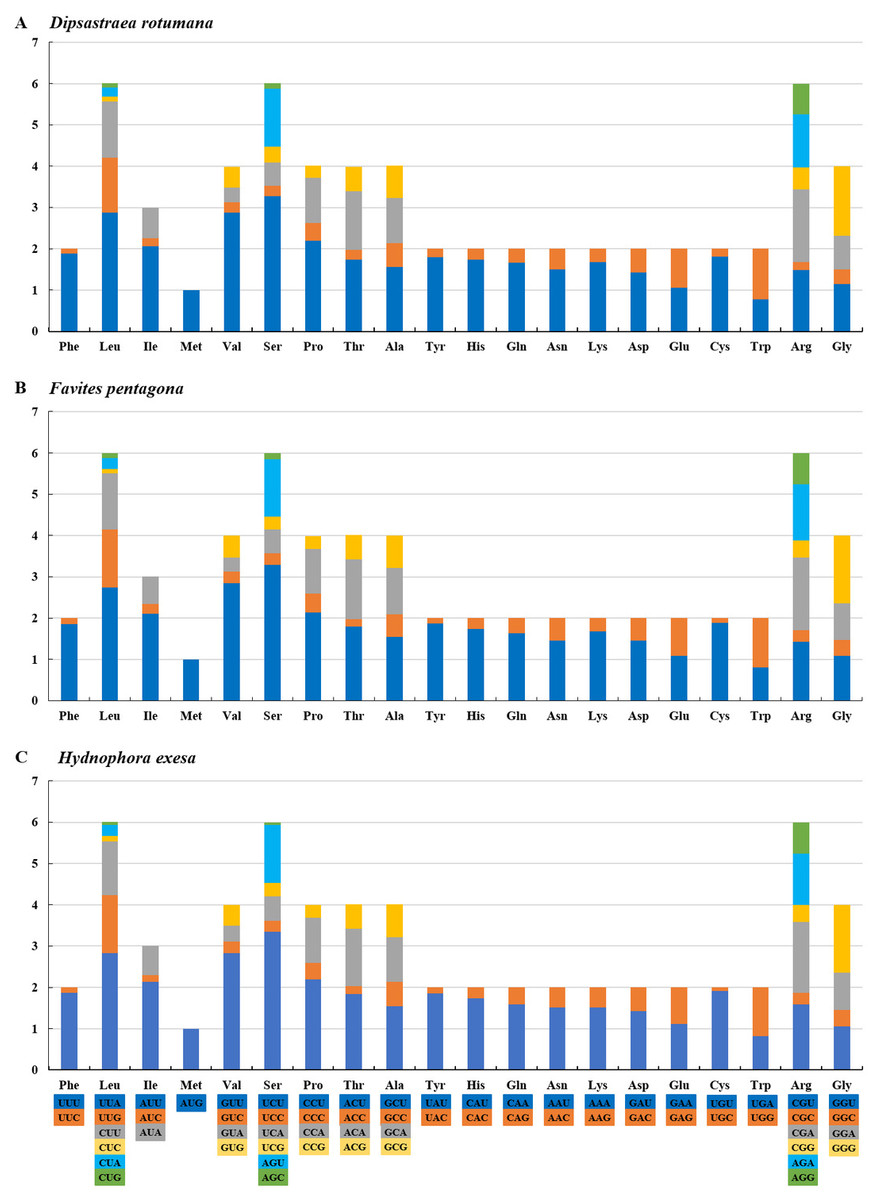
Figure 2: RSCU (Relative Synonymous Codon Usage) of mitochondrial genomes for (A) Dipsastraea rotumana, (B) Favites pentagona, and (C) Hydnophora exesa.
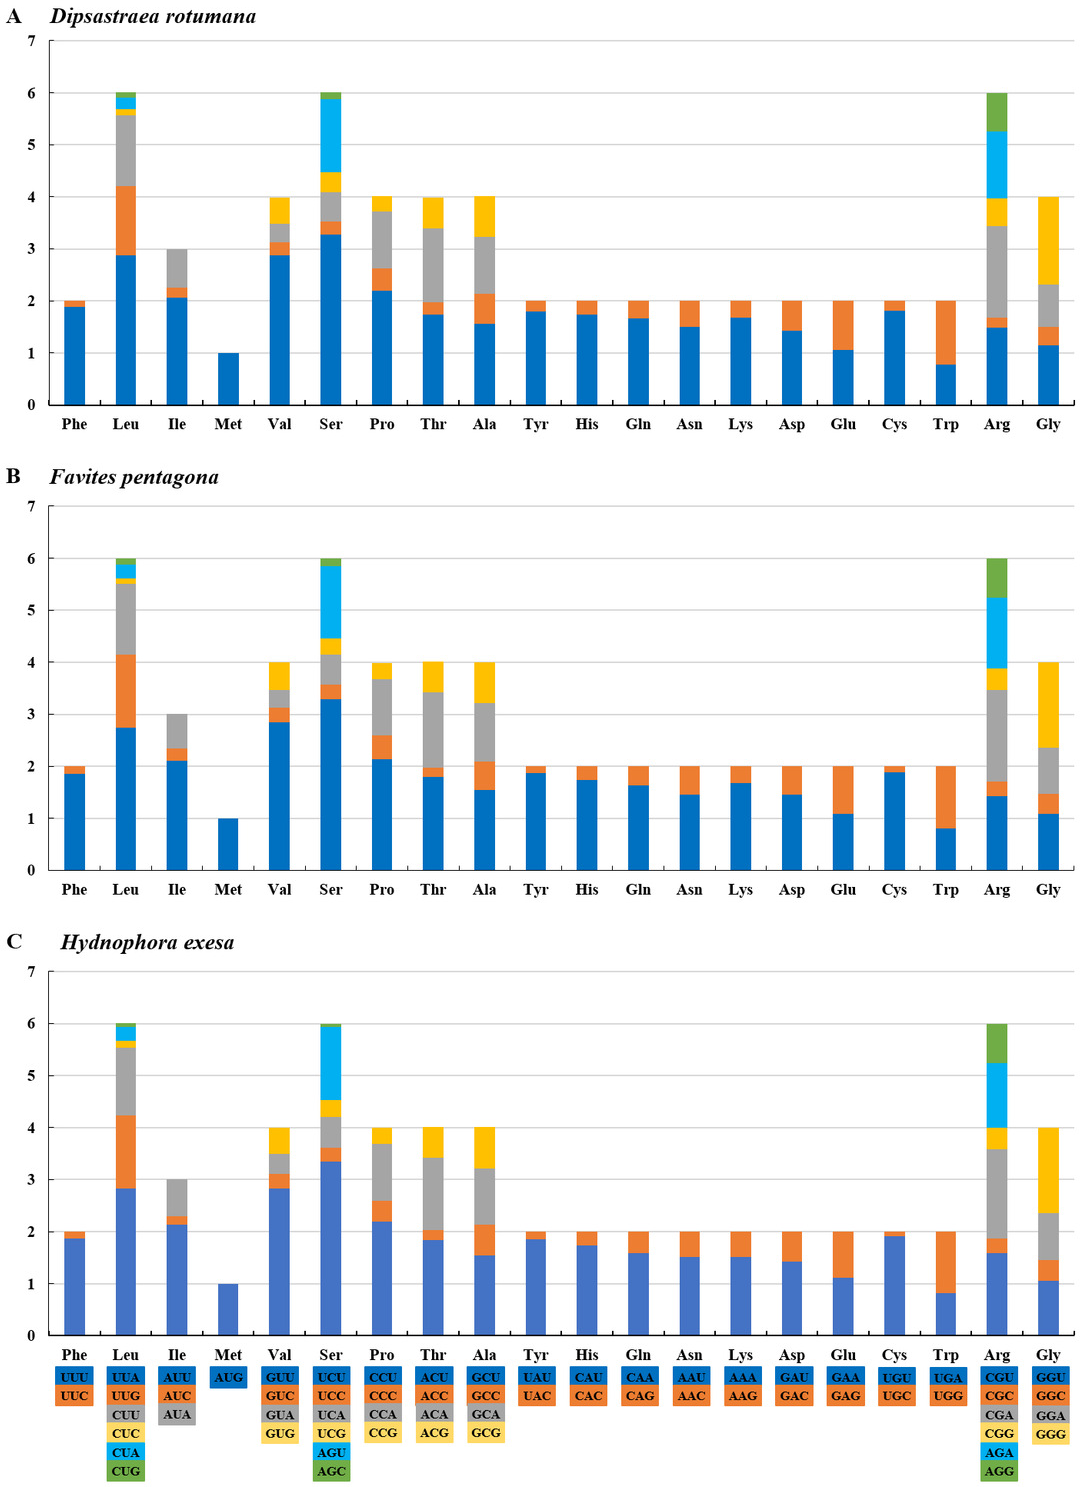
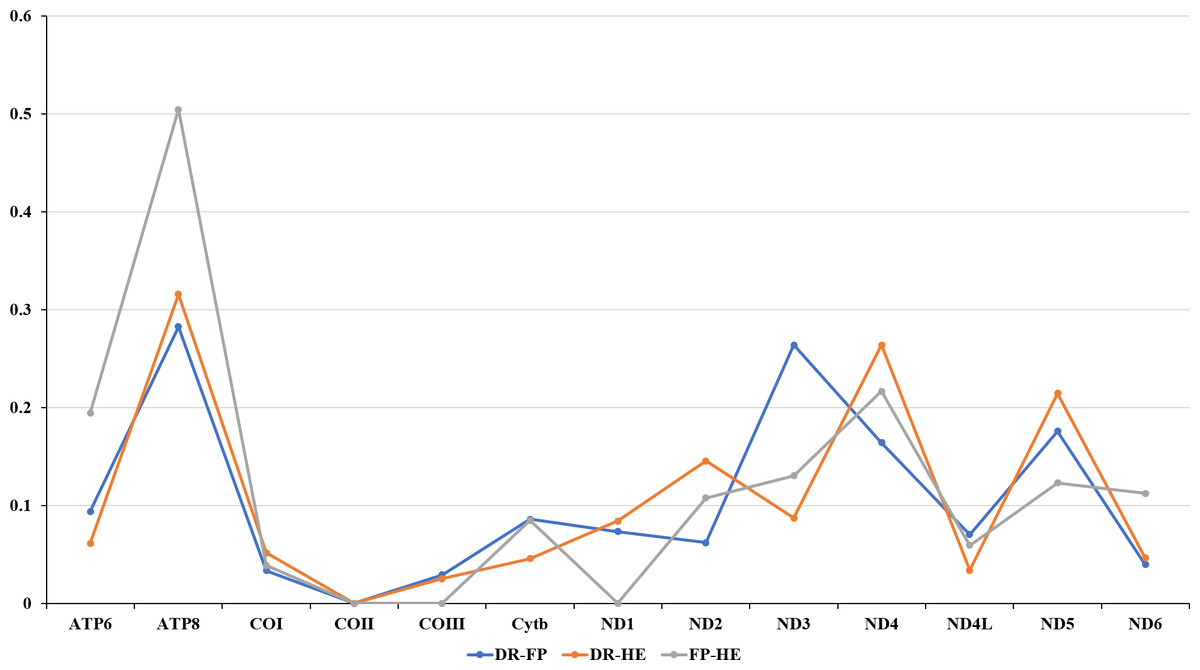
Figure 3: Evolutionary rates of the mitochondrial genome of Dipsastraea rotumana (DR), Favites pentagona (FP), and Hydnophora exesa (HE).
The ratio means the rate of non-synonymous substitutions to the rate of synonymous substitutions (Ka/Ks) for each PCG.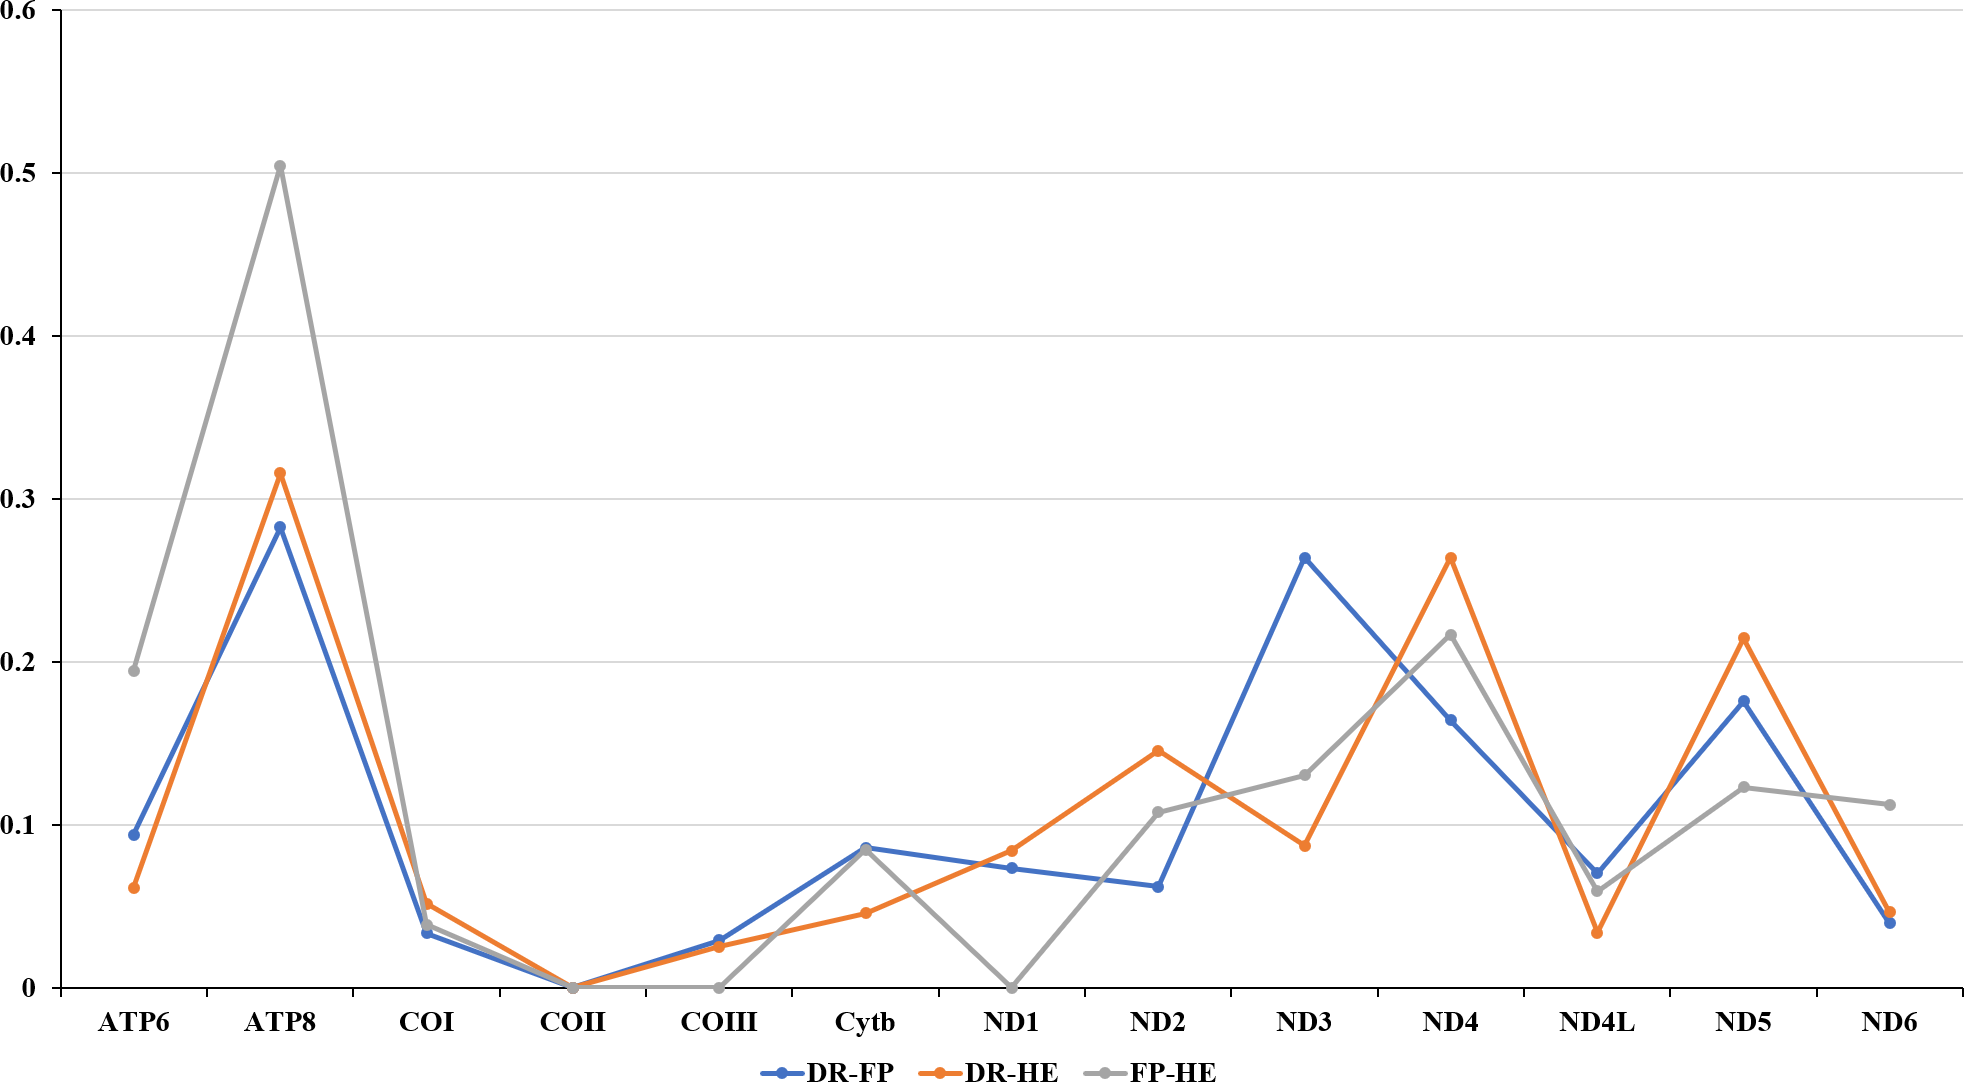
Ribosomal and transfer RNA genes
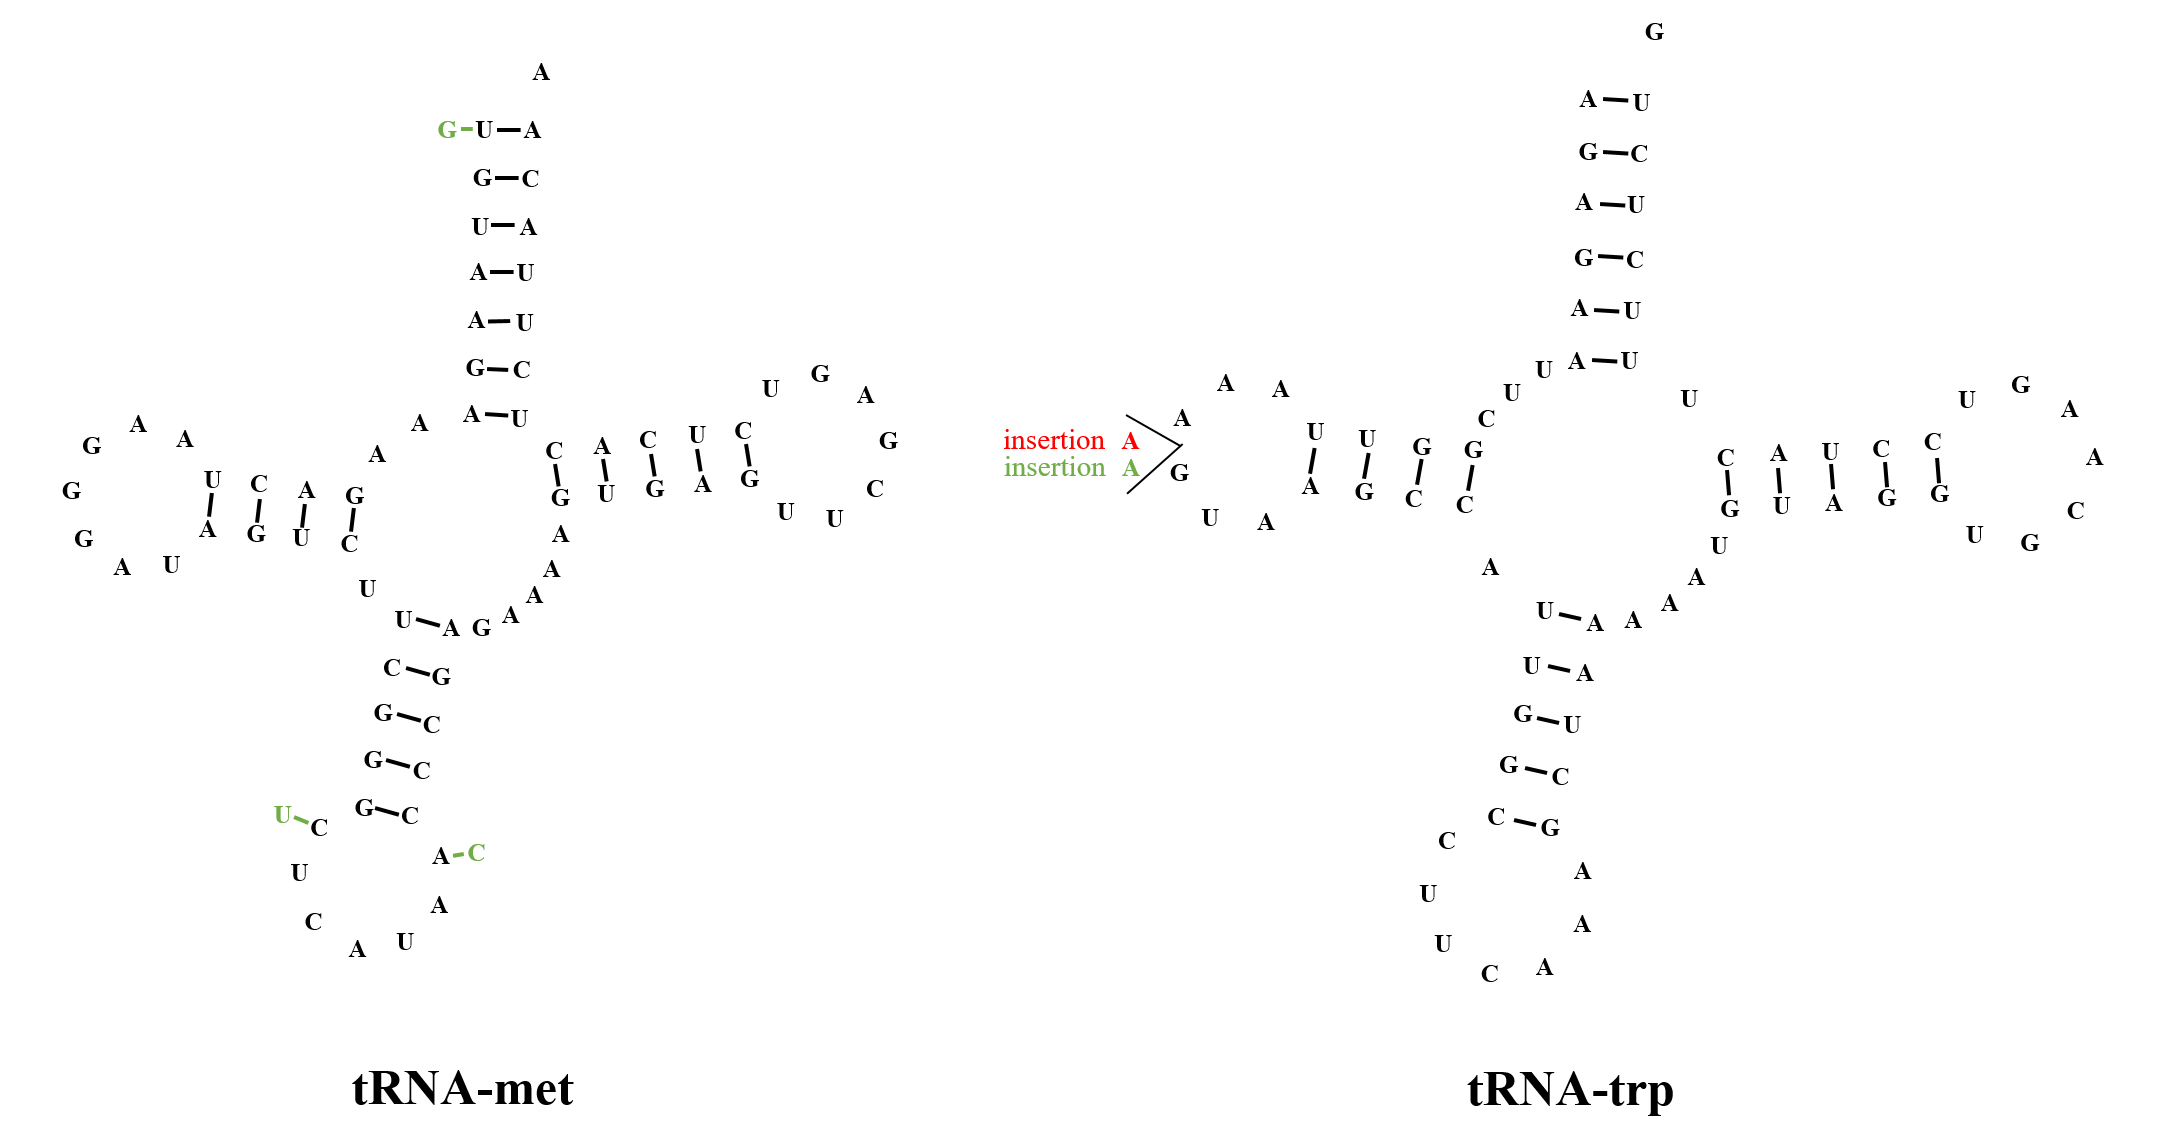
As is the case in most Scleractinia mitogenomes, two tRNA genes (tRNA-met and tRNA-trp) were found in the mitogenomes of D. rotumana, F. pentagona, and H. exesa. All three species exhibited a tRNA-met composed of 72 bp, yet the tRNA-trp gene varied in length from 70 bp (D. rotumana) to 71 bp (H. exesa and F. pentagona), with some subtle base composition difference between the species. Both tRNAs carried identical anticodons, as reported in other Scleractinia species (Niu et al., 2016; Terraneo et al., 2016a; Terraneo et al., 2016b). In addition, both tRNA genes were folded into typical cloverleaf secondary structures (Fig. S6), containing an amino acid acceptor stem, T ψC stem, anticodon stem, and DHU stem. Two rRNAs genes ranged in length from 910 to 911 bp (12S rRNA) and from 1698 to 1,699 bp (16s rRNA), respectively.
Phylogenetic analyses
In this study, the Bayesian analysis was constructed based on the 13 concatenated PCG sequences of 86 Scleractinia species (Table S1). The Bayesian phylogenetic tree indicated that all of the interspecific nodes were robust, with strong posterior probabilities (Fig. 4). Species in the same family were grouped together, with the exception of the Polycyathus sp. (NC_015642), which was distinct from other Caryophylliidae species. The family Merulinidae was conventionally clustered into a robust branch and affined with the family Lobophylliidae. Unexpectedly, based on the mitochondrial genome phylogeny, the topological structure of the relationship between H. exesa, F. pentagona, D. rotumana, and F. abdita, was not consistent with previous phylogenies (Huang et al., 2011; Huang et al., 2014a; Huang et al., 2014b; Huang et al., 2016; Katahara et al., 2016). For example, Huang et al. (2014a) found that F. pentagona and D. rotumana shared a close evolutionary relationship, whereas H. exesa clustered more closely with other Favites species according to three nuclear and two mitochondrial markers. Almost all previous molecular studies rendered the genus Favites as polyphyletic. As described above, we also found that, the genus Favites was polyphyletic, with F. pentagona clustered closely with H. exesa, and D. rotumana clustered closely with F. abdita. These results indicate novel interspecific relationships.
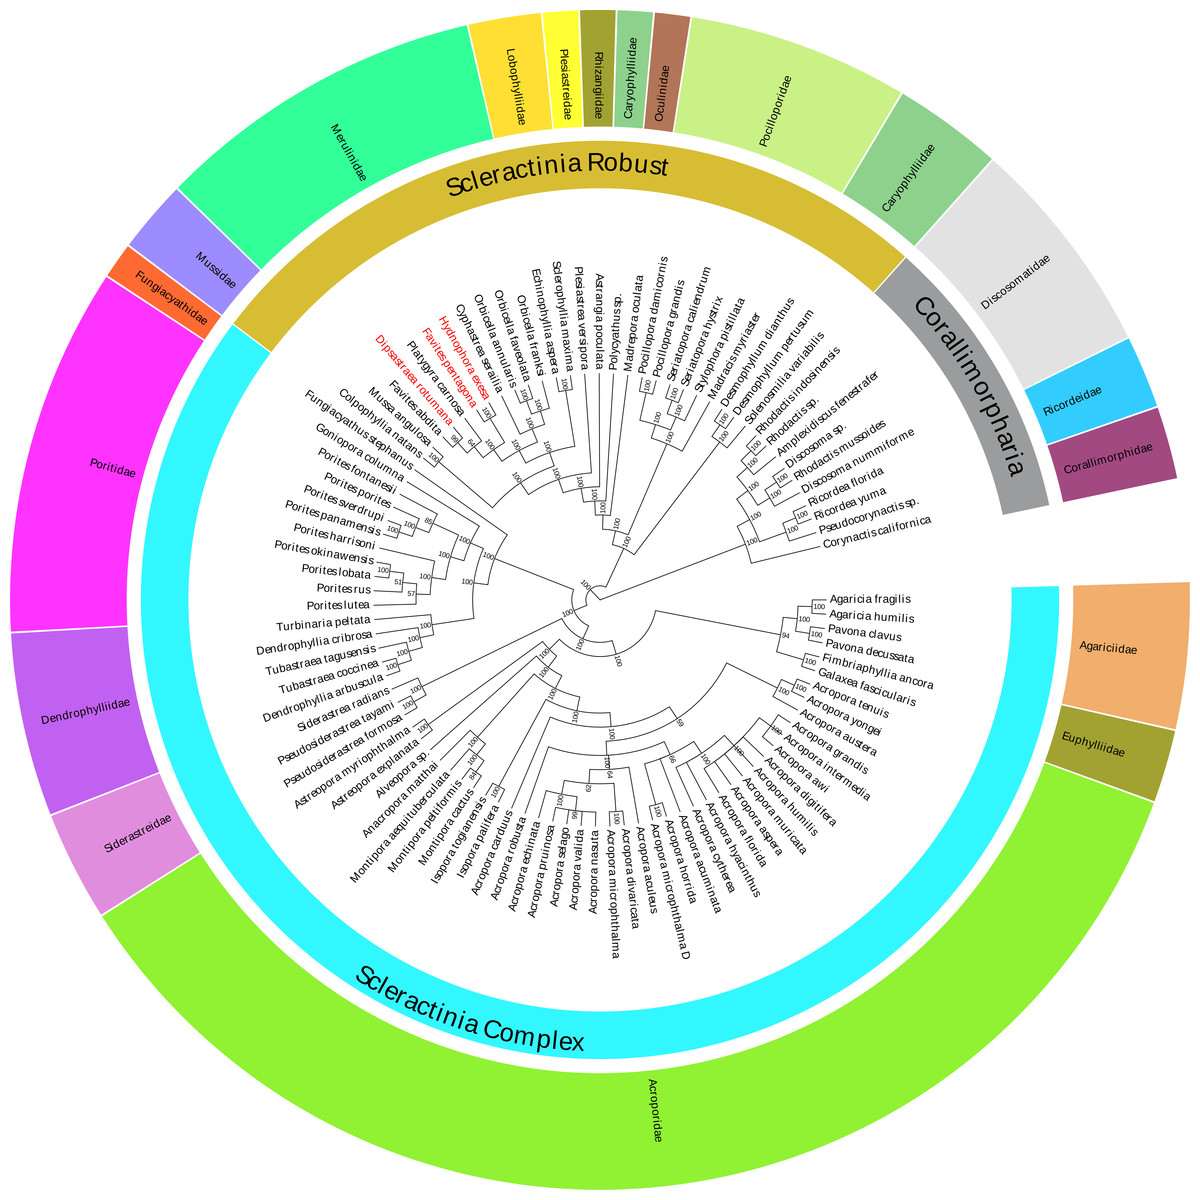
Figure 4: Bayesian inference (BI) tree inferred from the amino acid sequences of 13 PCGs of 86 Scleractinia species and 10 Corallimorpharia species as out-groups.
The numbers at the nodes showed the Bayesian posterior probabilities. The species in red Latin name indicated the sequences generated in this study.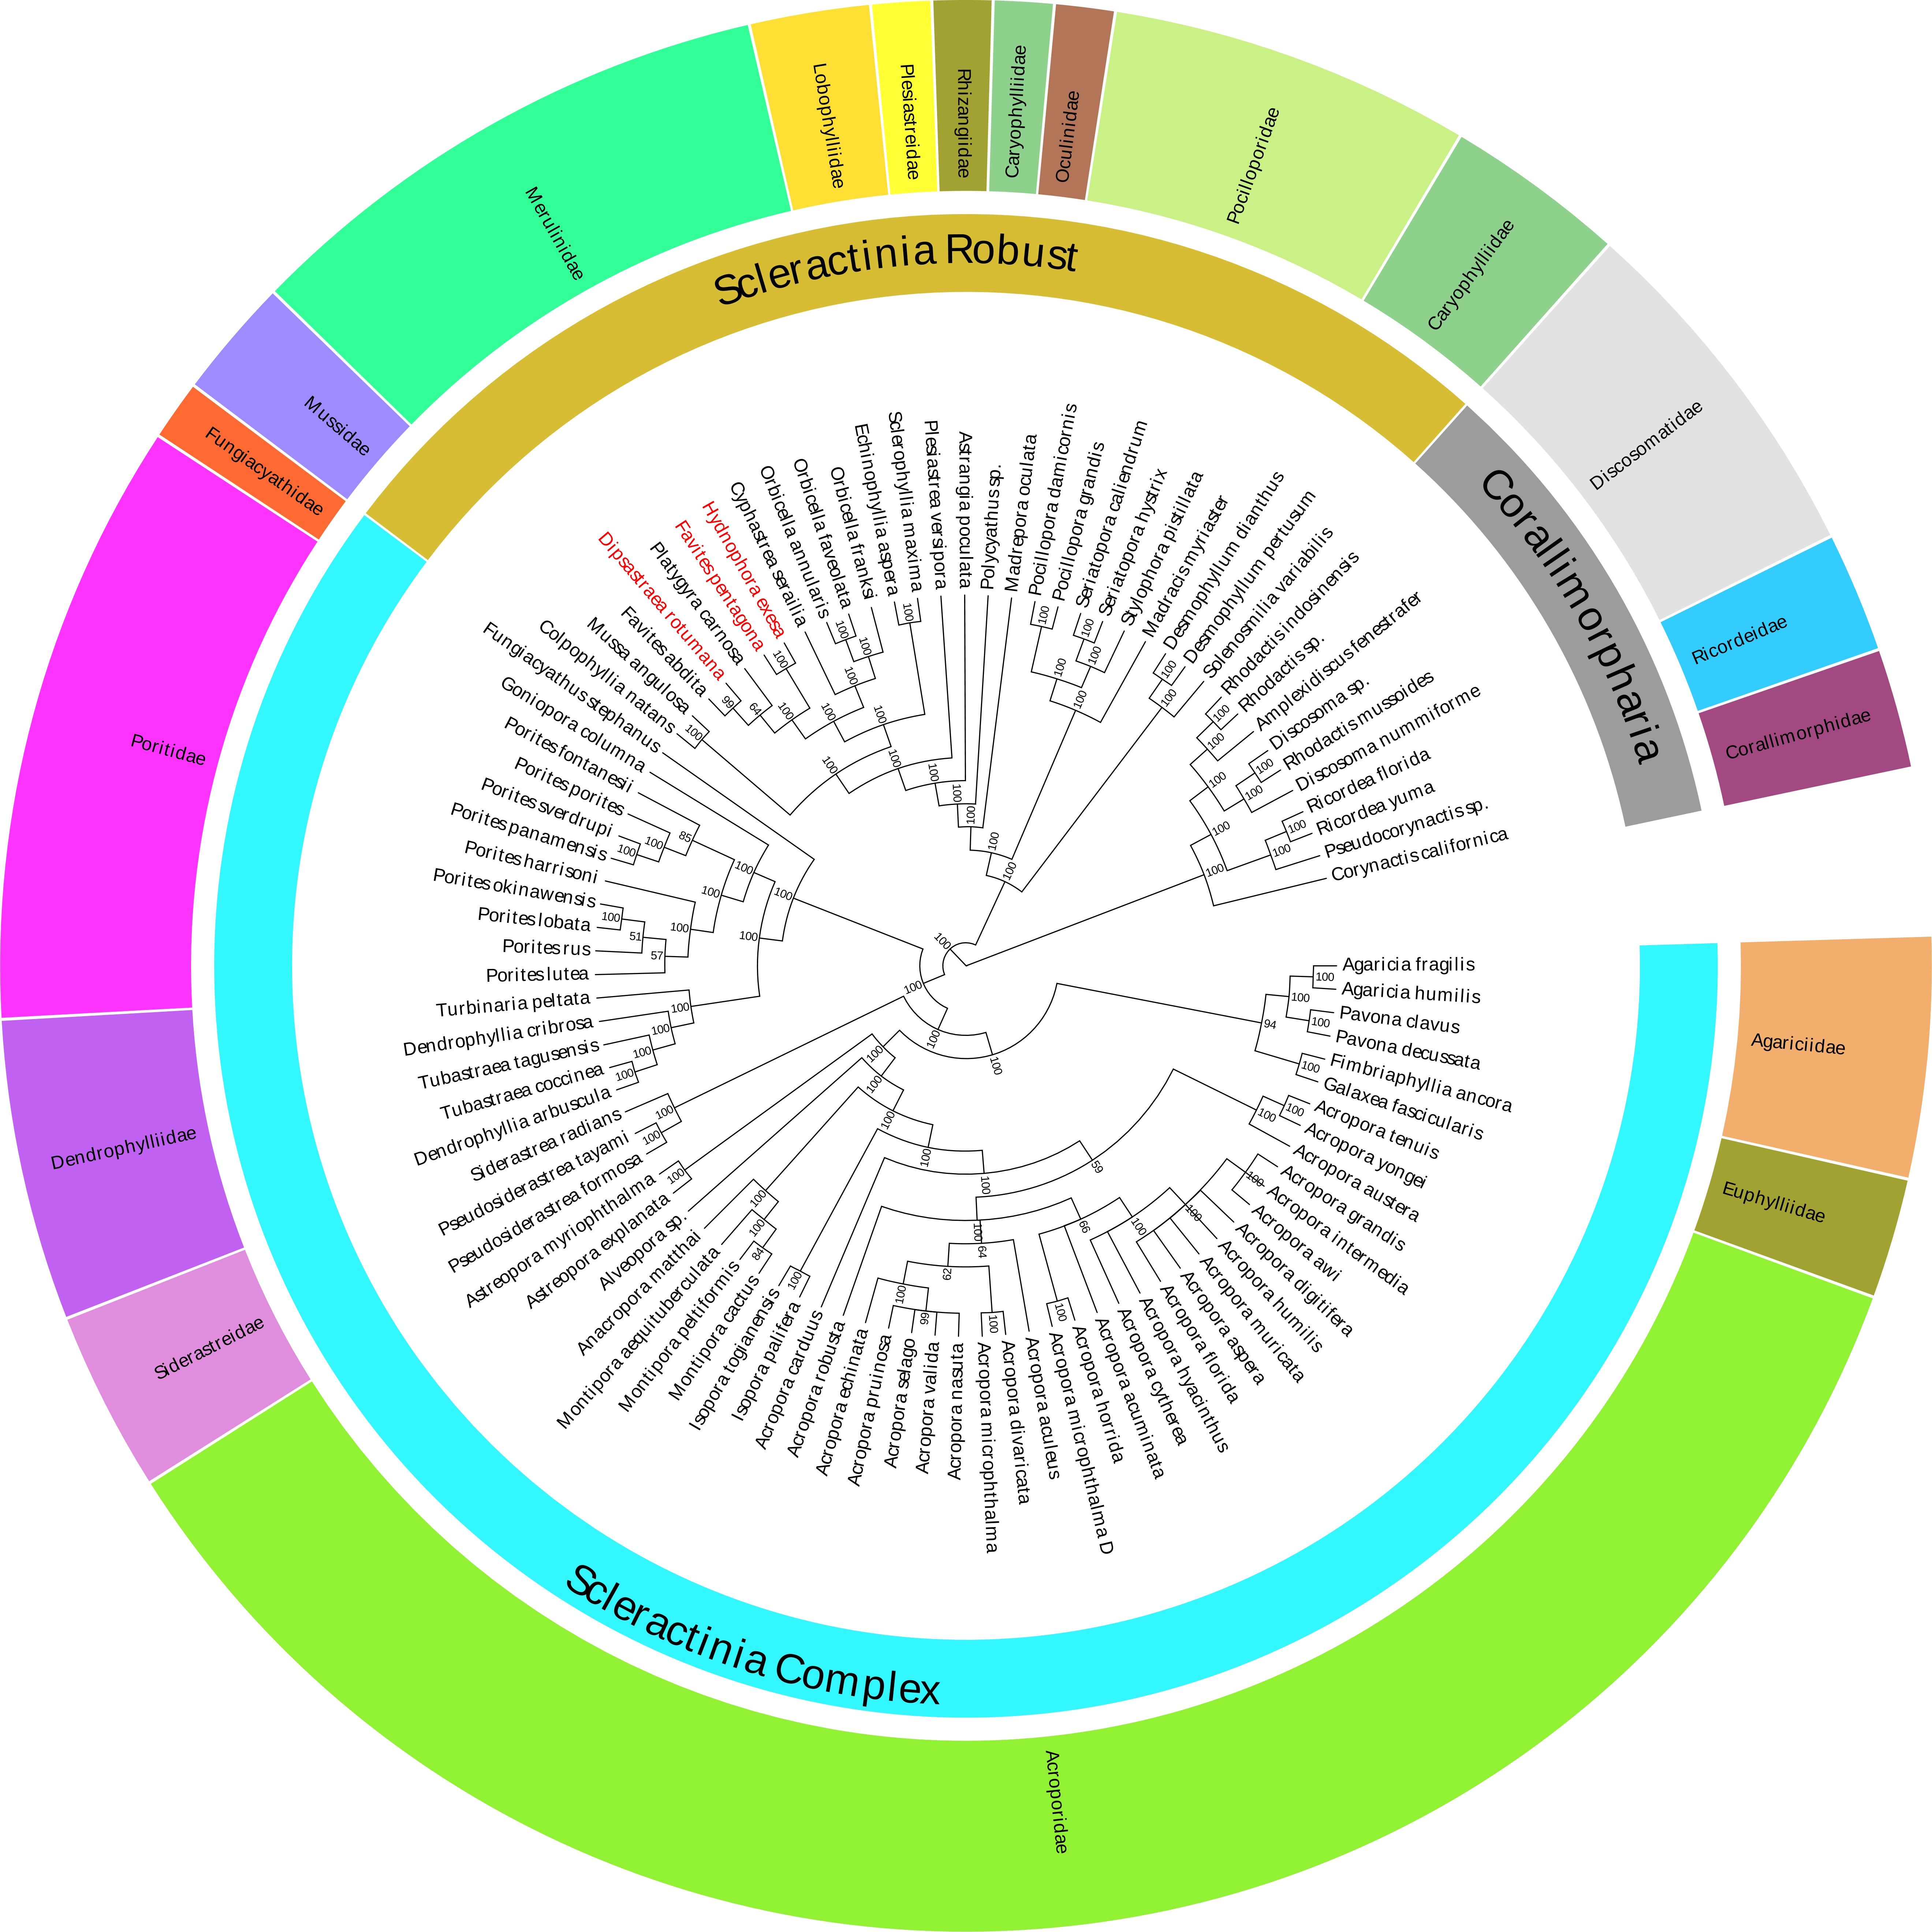
Conclusions
In the present study, the complete mitochondrial genome sequences of three Merulinidae corals (D. rotumana, F. pentagona, and H. exesa) were determined for the first time using next-generation sequencing. The gene arrangement and composition of the three corals were identical to each other and consistent with other Scleractinia mitogenomes. The Bayesian inference results showed that the family Merulinidae was clustered into the robust branch, with H. exesa clustered closely with F. pentagona and D. rotumana clustered closely with F. abdita. This study provides reliable mitogenome data and novel insight into the phylogenetic relationships of the genera in the family Merulinidae. Our study may also facilitates future phylogenetic and evolutionary studies of Scleractinia.
Supplemental Information
Raw data of mt-genome sequence of D. rotumana.
The complete mitochondrial genome of D. rotumana was 16,466 bp in length with GenBank accession no. MH119077.
Raw data of mt-genome sequence of F. pentagona.
The complete mitochondrial genome of F. pentagona was 18,006 bp in length with GenBank accession no. KY247139.
Raw data of mt-genome sequence of H. exesa.
The complete mitochondrial genome of H. exesa was 17,790 bp in length with GenBank accession no. MH086217.
Underwater picture of Dipsastraea rotumana
Corallites are large, with diameter over 12 mm; deep and subplocoid, with a cerioid tendency especially towards the top surfaces of the coral. Corallites can appear completely cerioid, highly packed and crowded. Corallite shapes are irregular and vary within a single colony. Septa are very exsert and have permanent dentation of irregular length.
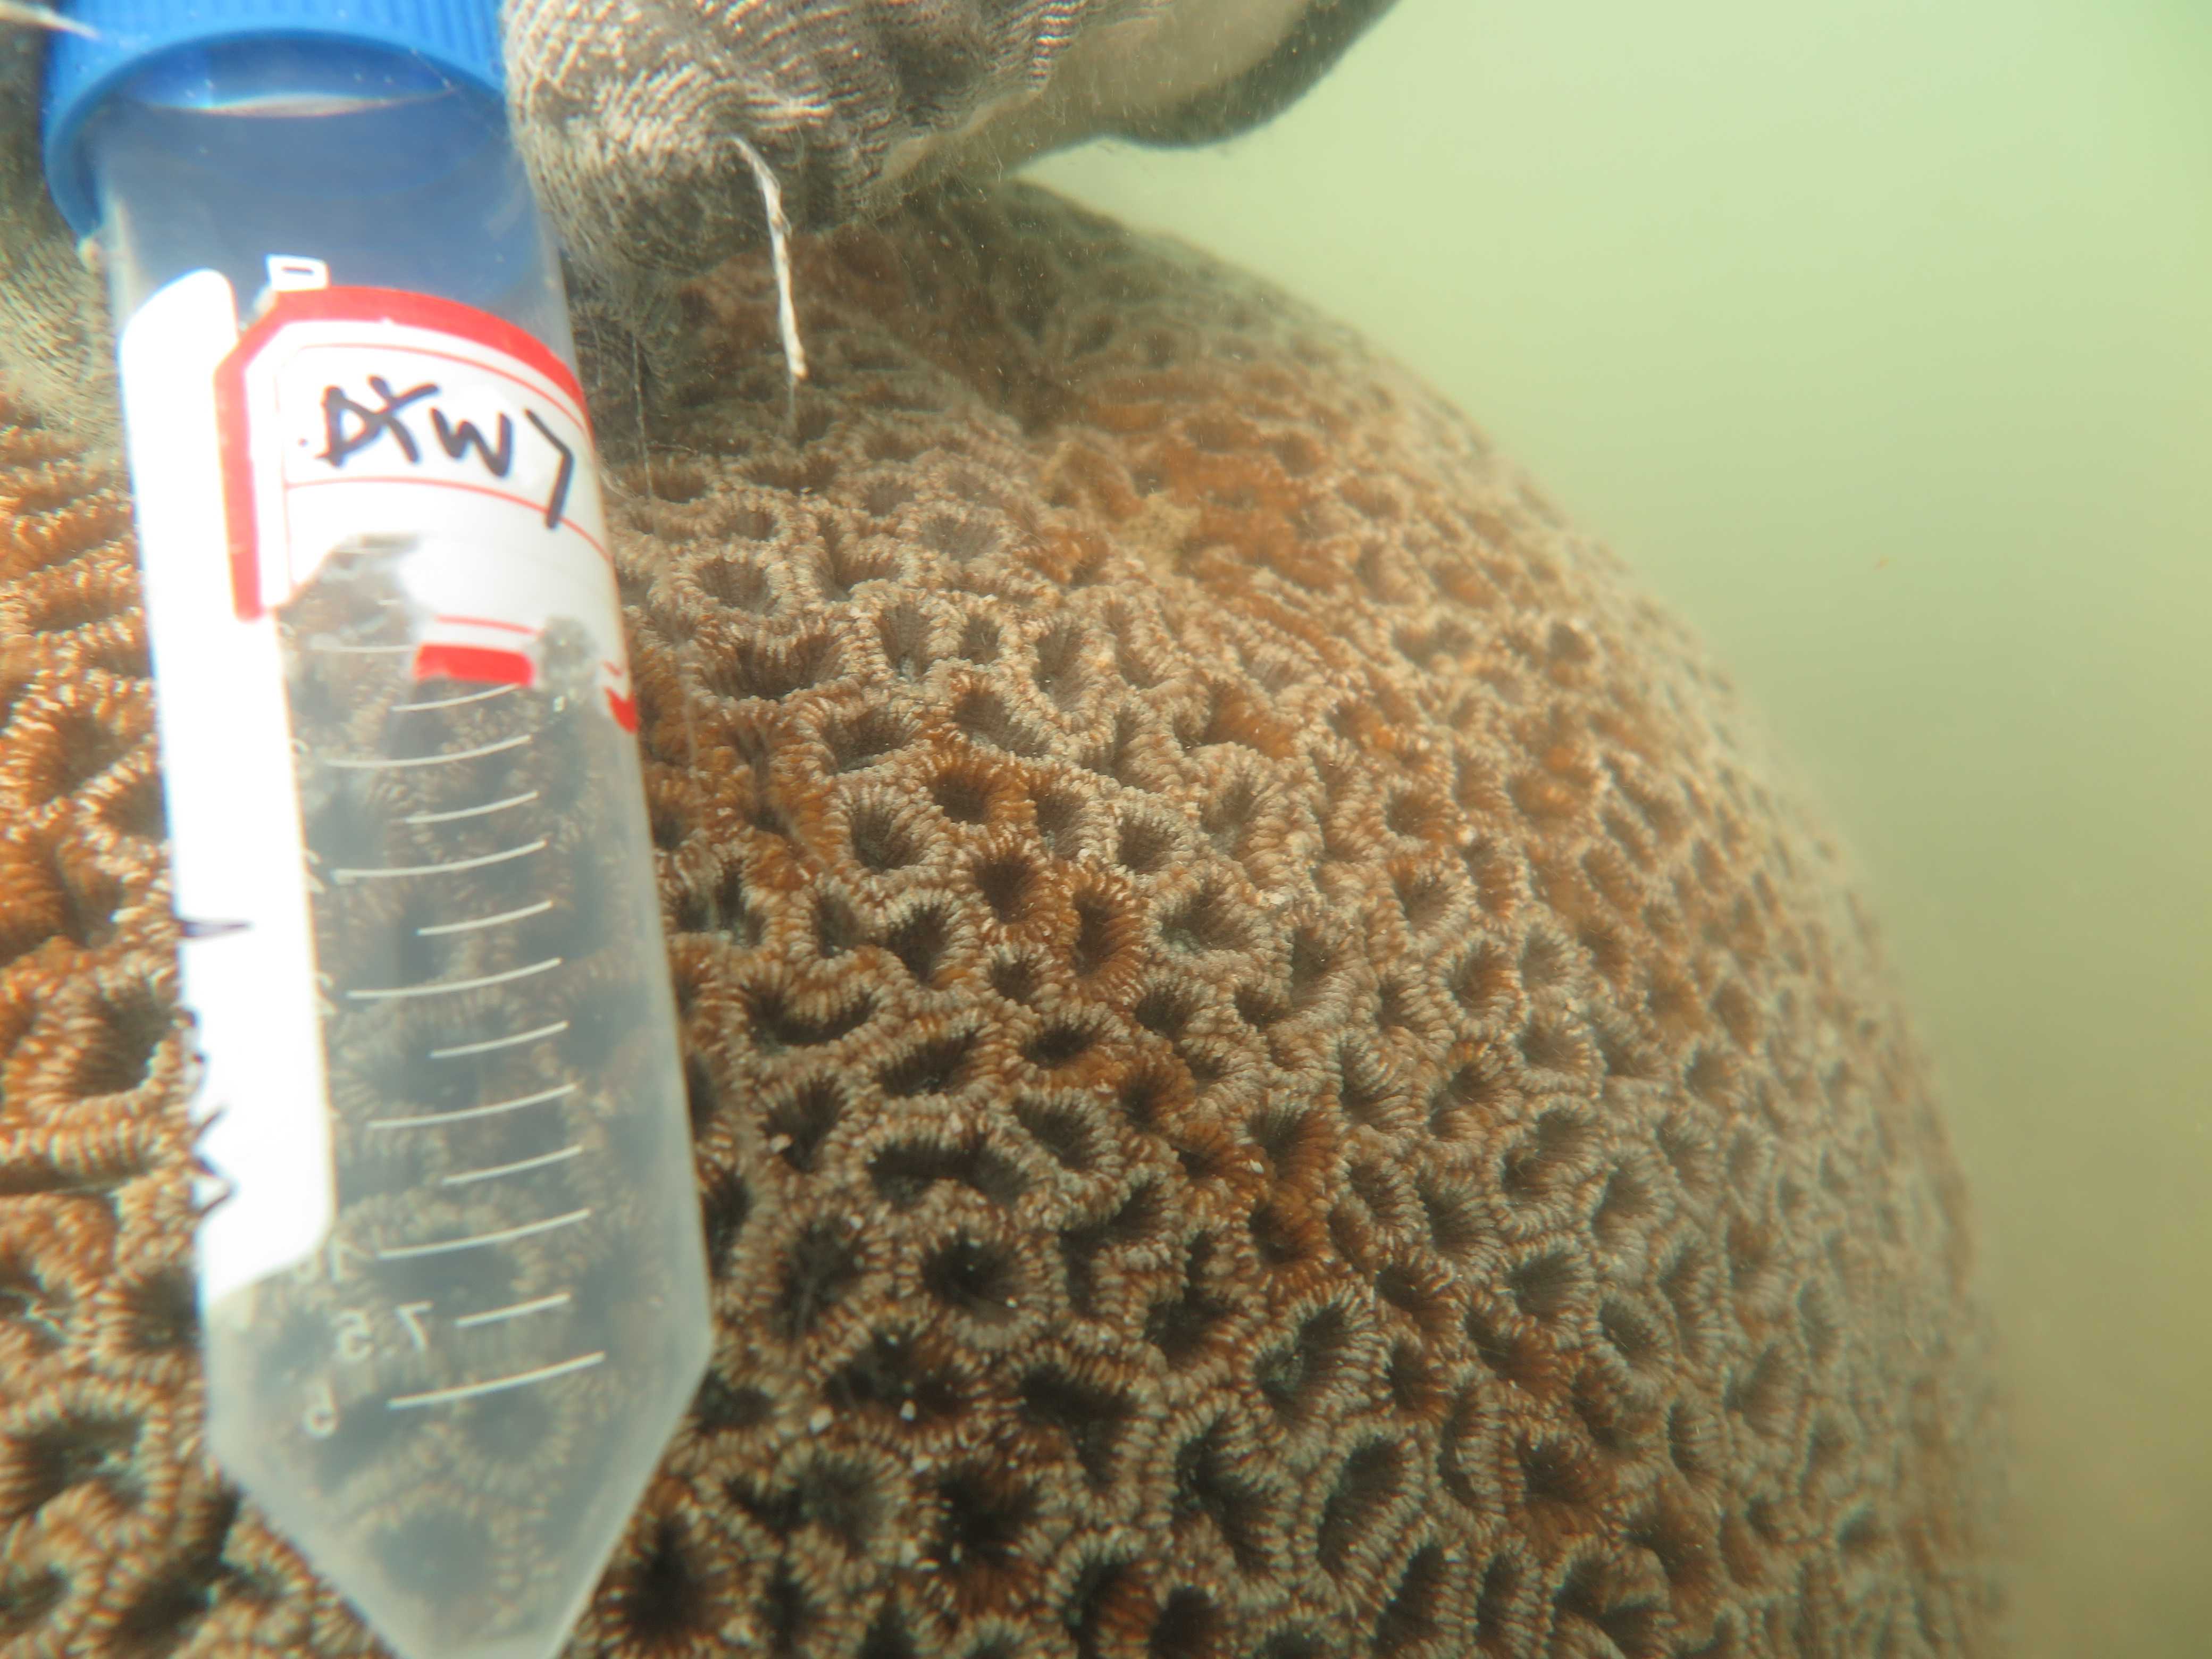
Underwater picture of Favites pentagona
Corallites are typically cerioid, angular-shaped with thin walls, i.e., honeycomb shapes, with small size of about 5–6 mm in diameter. Corallite walls have a distinctive demarcations of light grey or white, with dark brown or grey inner walls.
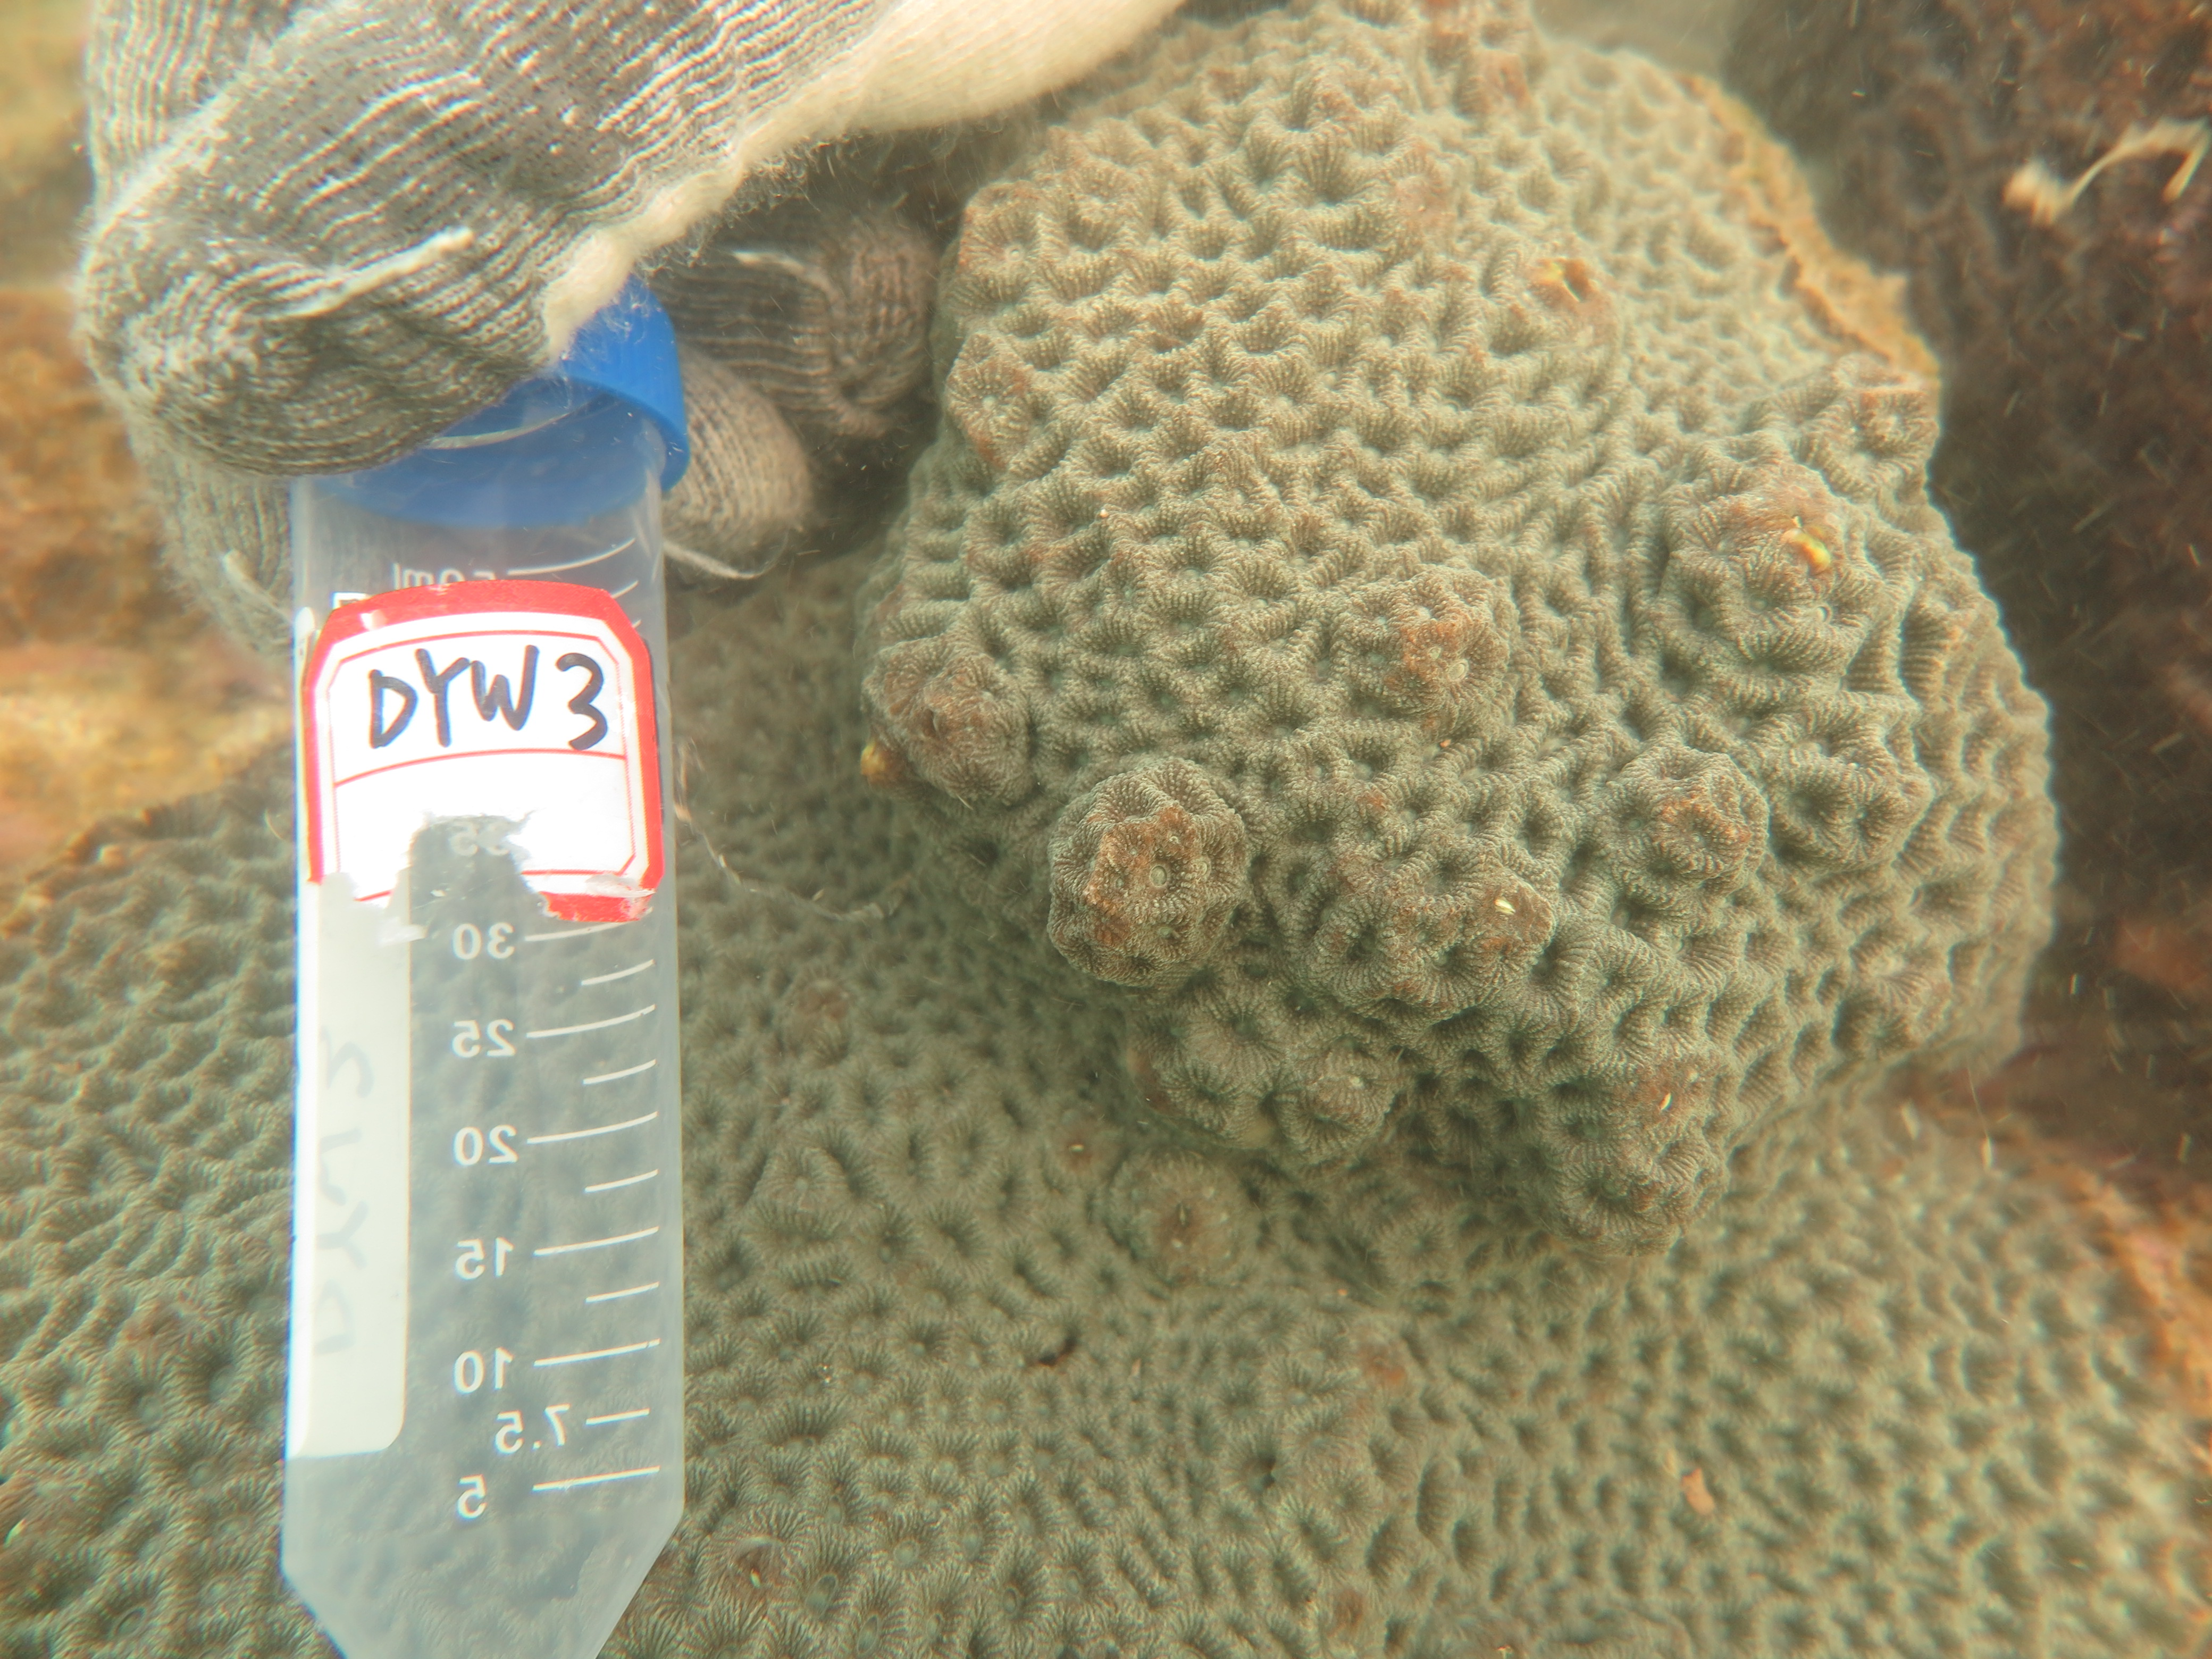
Underwater picture of Hydnophora exesa
Unique skeletal structures, with highly pointed small conical mounds, growing throughout the colony surface. They can reach up to 8–10 mm in diameter. Septa are irregular and vary within a single colony.
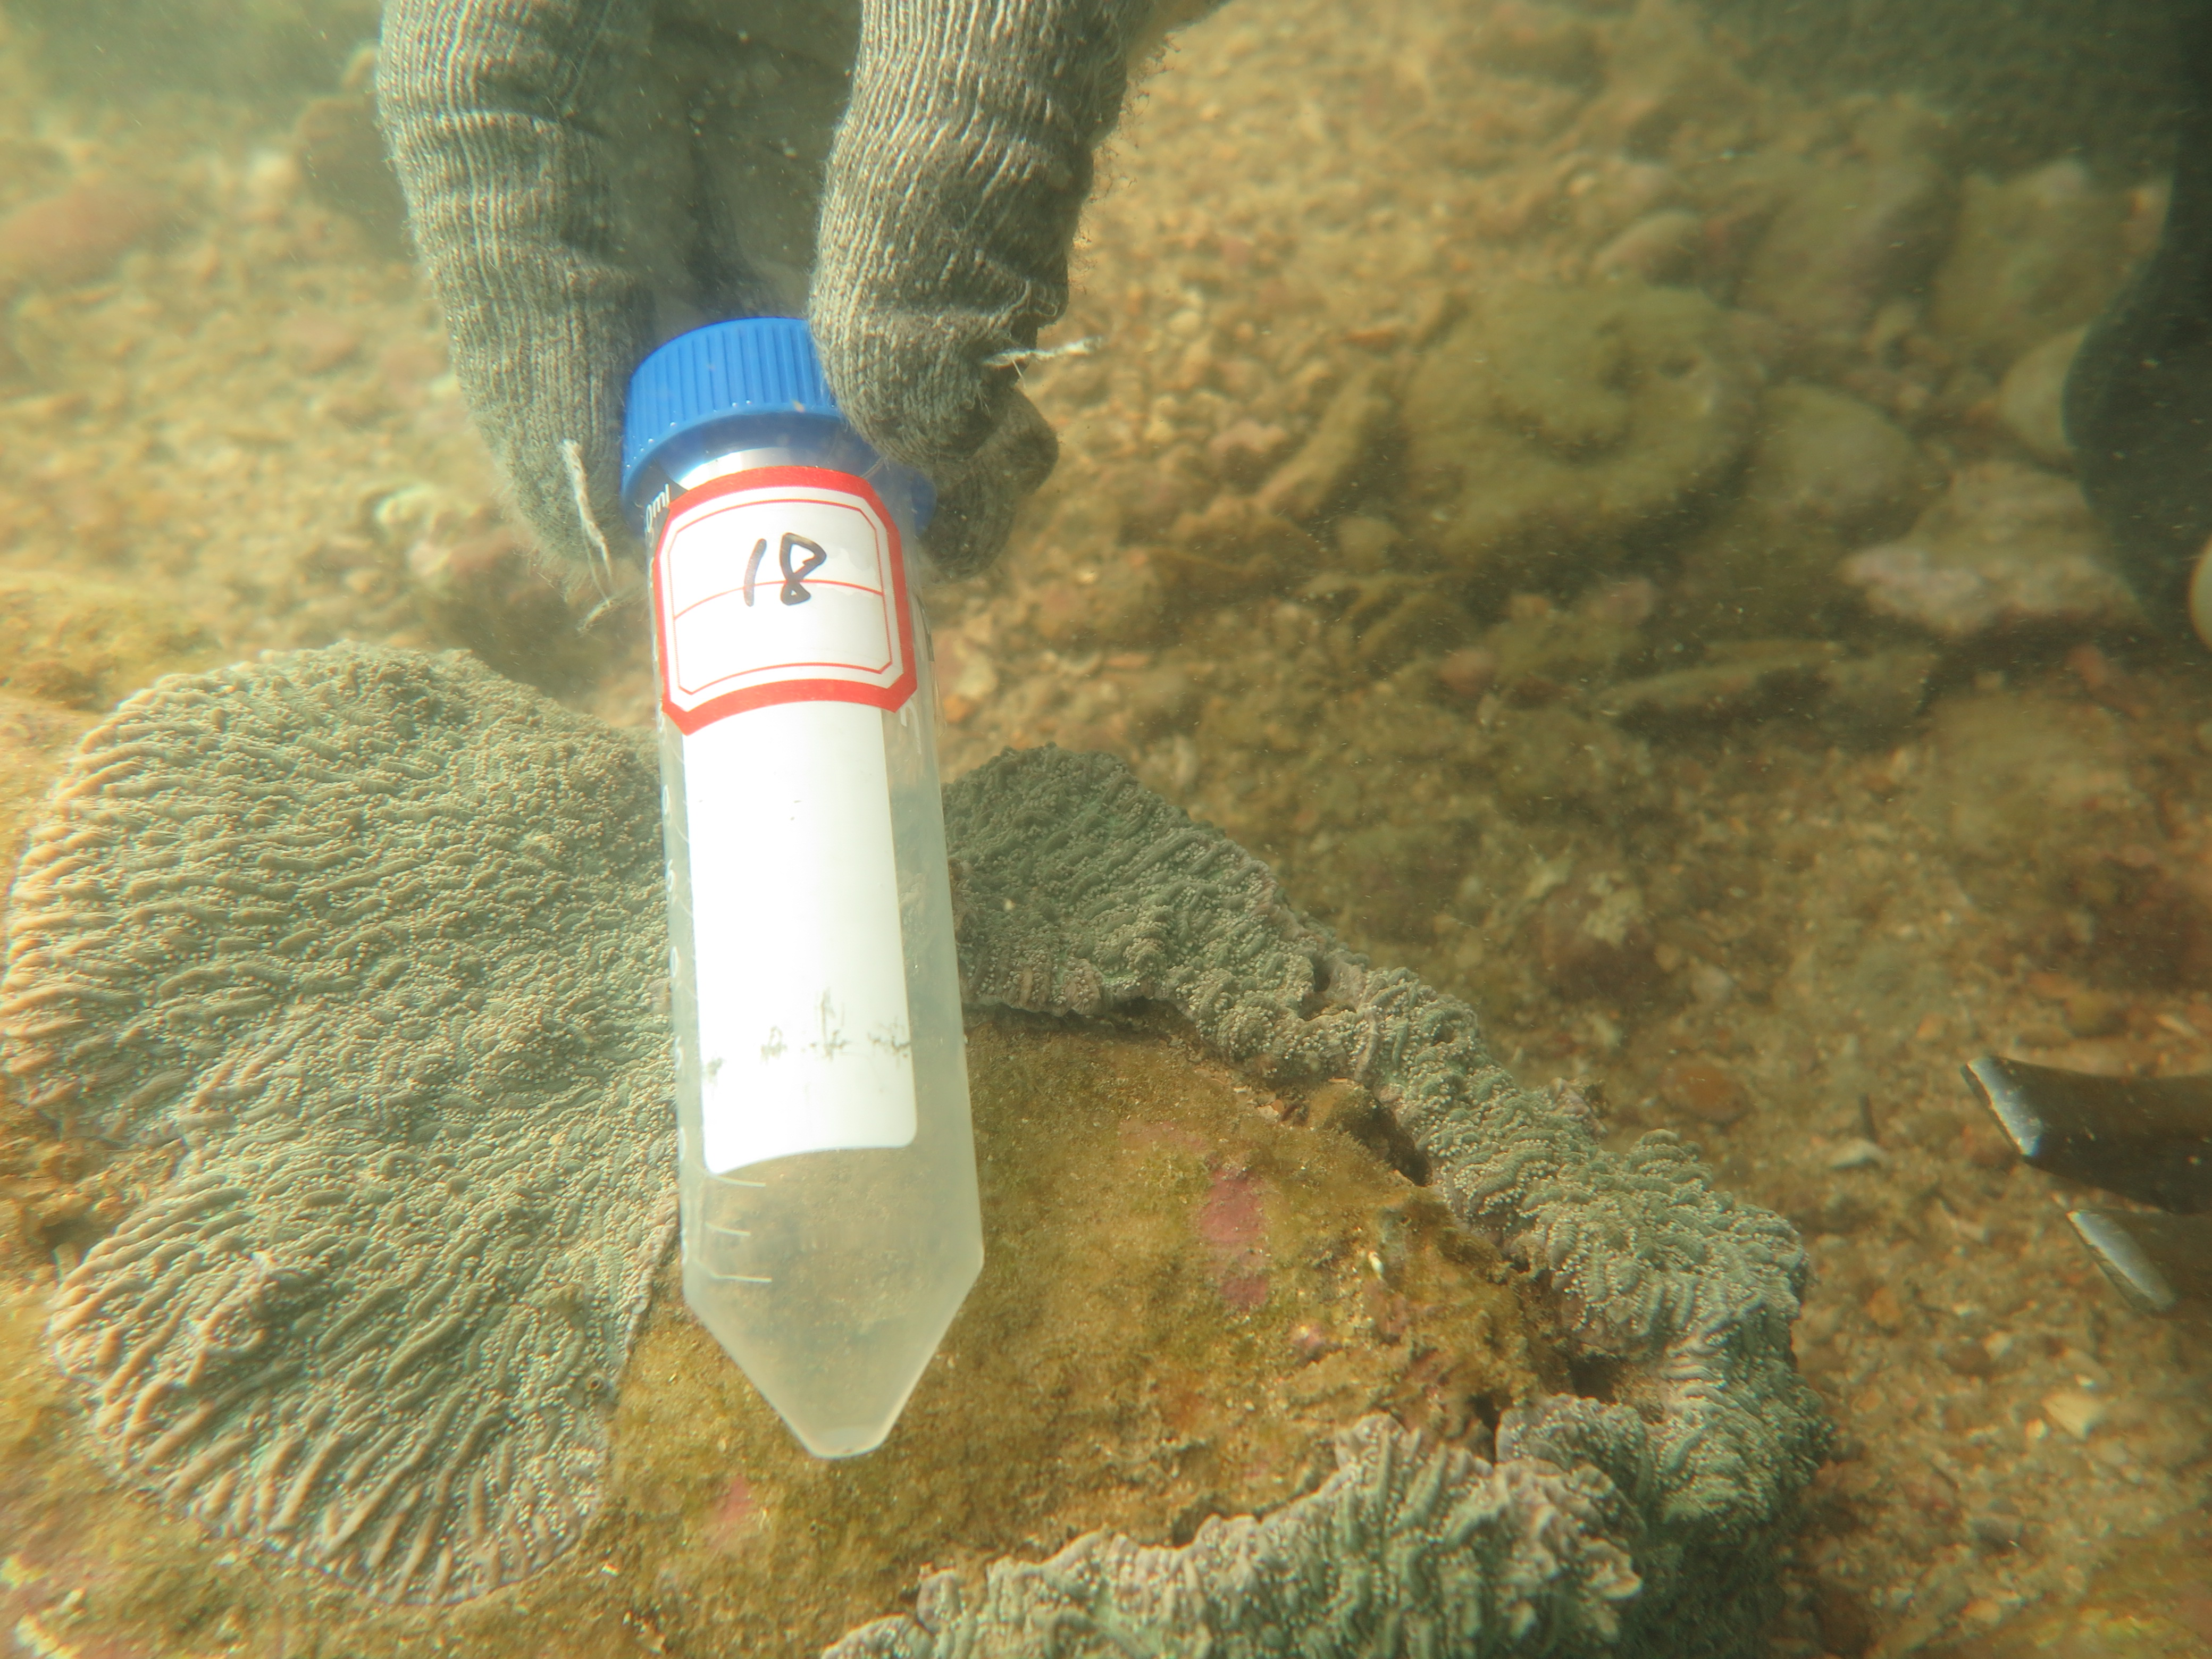
Codon usage bias in different regions of mitochondrial genome of Dipsastraea rotumana, Favites pentagona, and Hydnophora exesa
PCGs, protein coding genes; 1st, the first positions of codons; 2nd, the second positions of codons; 3rd, the third positions of codons.
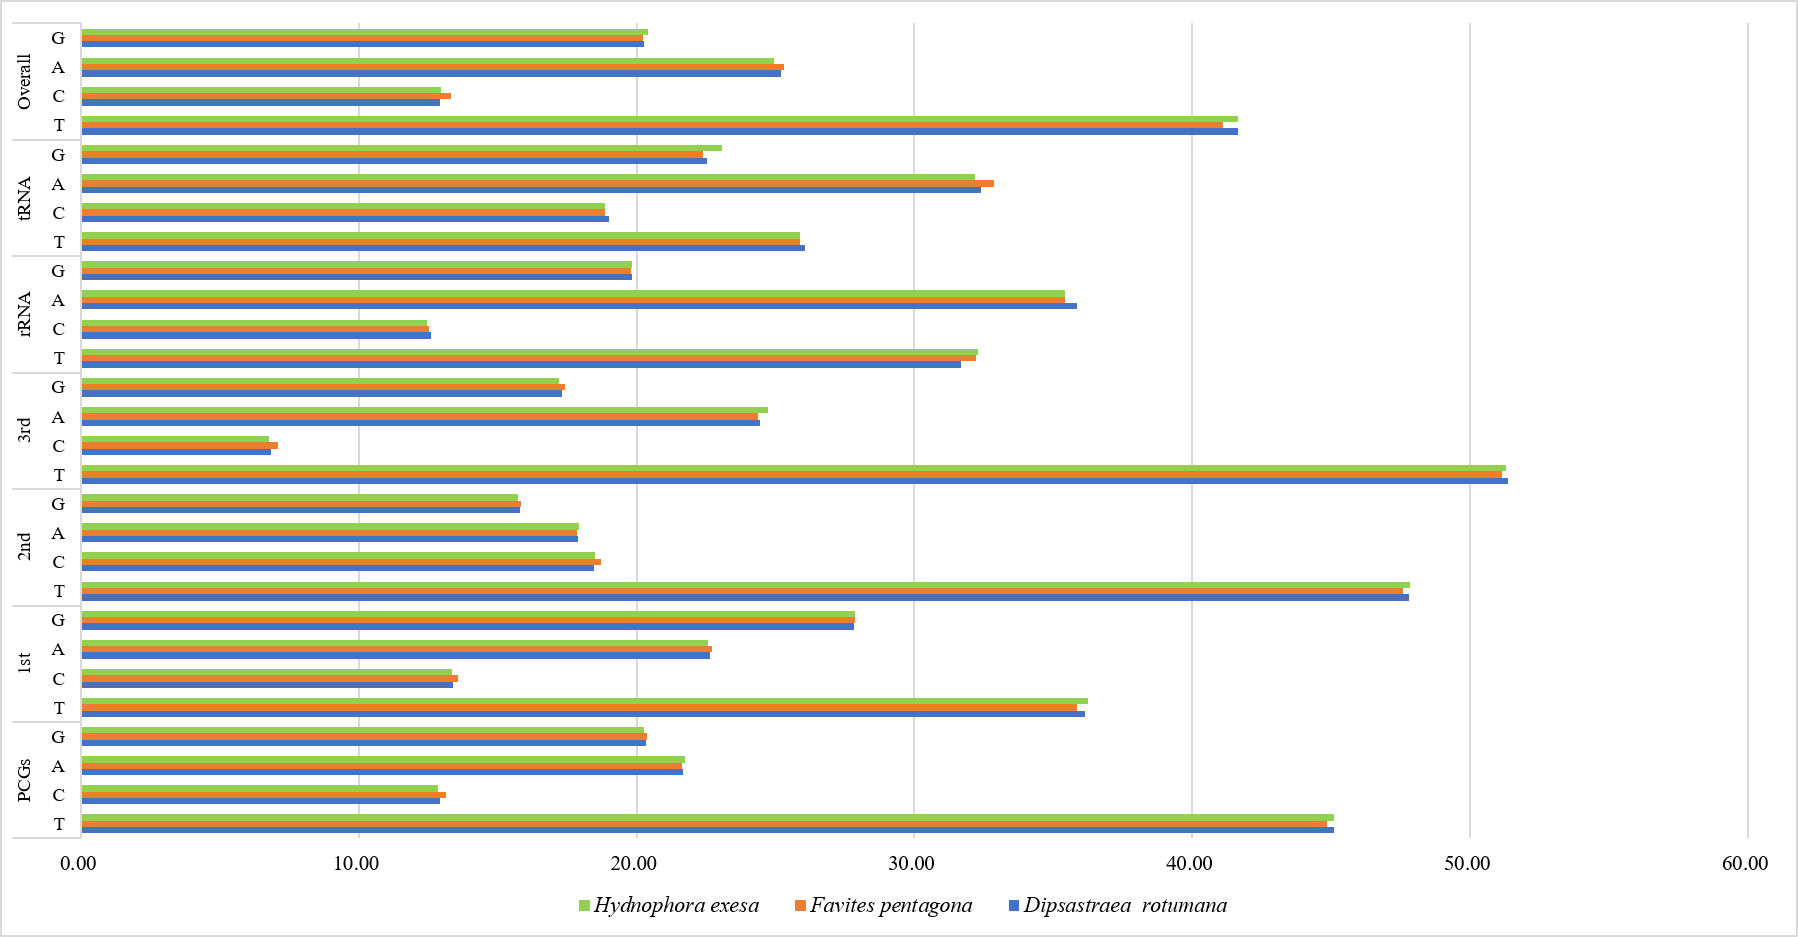
Graphical illustration showing the AT- and GC-skew in the PCGs of the mitochondrial genome of (A) Dipsastraea rotumana, (B) Favites pentagona, and (C) Hydnophora exesa
Secondary structures of Dipsastraea rotumana tRNAs
Single variable sites from two species are labelled in different colours (Favites pentagona: red; Hydnophora exesa: green).