
Genome-wide identification and characterization of heat shock protein family 70 provides insight into its divergent functions on immune response and development of Paralichthys olivaceus
- Published
- Accepted
- Received
- Academic Editor
- James Reimer
- Subject Areas
- Aquaculture, Fisheries and Fish Science, Marine Biology
- Keywords
- Phylogenetic analysis (phylogeny), Edwardsiella tarda challenge, Japanese flounder (paralichthys olivaceus), Heat shock protein 70 (hsp 70), Embryo development dynamics
- Copyright
- © 2019 Liu et al.
- Licence
- This is an open access article distributed under the terms of the Creative Commons Attribution License, which permits unrestricted use, distribution, reproduction and adaptation in any medium and for any purpose provided that it is properly attributed. For attribution, the original author(s), title, publication source (PeerJ) and either DOI or URL of the article must be cited.
- Cite this article
- 2019. Genome-wide identification and characterization of heat shock protein family 70 provides insight into its divergent functions on immune response and development of Paralichthys olivaceus. PeerJ 7:e7781 https://doi.org/10.7717/peerj.7781
Abstract
Flatfish undergo extreme morphological development and settle to a benthic in the adult stage, and are likely to be more susceptible to environmental stress. Heat shock proteins 70 (hsp70) are involved in embryonic development and stress response in metazoan animals. However, the evolutionary history and functions of hsp70 in flatfish are poorly understood. Here, we identified 15 hsp70 genes in the genome of Japanese flounder (Paralichthys olivaceus), a flatfish endemic to northwestern Pacific Ocean. Gene structure and motifs of the Japanese flounder hsp70 were conserved, and there were few structure variants compared to other fish species. We constructed a maximum likelihood tree to understand the evolutionary relationship of the hsp70 genes among surveyed fish. Selection pressure analysis suggested that four genes, hspa4l, hspa9, hspa13, and hyou1, showed signs of positive selection. We then extracted transcriptome data on the Japanese flounder with Edwardsiella tarda to induce stress, and found that hspa9, hspa12b, hspa4l, hspa13, and hyou1 were highly expressed, likely to protect cells from stress. Interestingly, expression patterns of hsp70 genes were divergent in different developmental stages of the Japanese flounder. We found that at least one hsp70 gene was always highly expressed at various stages of embryonic development of the Japanese flounder, thereby indicating that hsp70 genes were constitutively expressed in the Japanese flounder. Our findings provide basic and useful resources to better understand hsp70 genes in flatfish.
Introduction
Heat shock proteins (HSPs) are a super family of proteins that are induced by physical, chemical and biological stressors in all living organisms from bacteria to humans (Kregel, 2002). HSPs were first discovered as genes involved in heat-shock responses in the fruit fly Drosophila melanogaster (Ritossa, 1962). Based on their roles and expression patterns, HSPs were categorized into two different types: constitutive heat shock proteins (HSCs) that are expressed constitutively, and inducible forms that are expressed in response to certain factors (Boone & Vijayan, 2002). HSCs are expressed early in development and are involved in cellular activity, in contrast, inducible HSPs are involved in the response to harmful circumstances and protect the cell from stress (Angelidis, Lazaridis & Pagoulatos, 1991; Whitley, Goldberg & Jordan, 1999). HSPs have also been classified based on their protein molecular weight, where they are divided into HSP90 (83∼110 KD), HSP70 (66∼78 KD), HSP60 (58∼65 KD) and other small molecular weight proteins (Morimoto, Tissieres & Georgopoulous, 1990). Characterization of HSPs in a species genome will facilitate better interpretation of how an organism responds to environmental stressors.
HSP70 are the most conserved HSPs across different species (Hunt & Morimoto, 1985; Mayer & Bukau, 2005). HSP70 proteins have a characteristic N-terminal ATPase domain, substrate binding domain, and C-terminal domain (Schlesinger, 1990; Kiang & Tsokos, 1998), the N-terminal ATPase domain, and the substrate binding domain are often more conserved than the C-terminal domain (Munro & Pelham, 1987). Humans, birds, amphibians, zebrafish, catfish, and medaka contain 17, 12, 19, 20, 16, and 15 hsp70 genes, respectively (Song et al., 2015). In previous studies, it was shown that hsp70 genes play fundamental roles as chaperones involved in maintaining cellular function that facilitate protein-folding, regulate kinetic partitioning, and reduce protein aggregation (Gething & Sambrook, 1992; Pratt & Toft, 1997; Parsell et al., 1994; Morimoto et al., 1997; Pratt, 1993).
HSP70 is a well-known stress protein in aquatic organisms, which is involved in stress response, including thermo tolerance as well as regulating the immune system (Gornati et al., 2004; Poltronieri et al., 2007; Bertotto et al., 2011; Wallin et al., 2002; Tsan & Gao, 2009). For example, hyper-thermic treatment of Penaeus monodon increases hsp70 expression and reduces the replication of gill associated virus (GAV) (Vega et al., 2006). In addition, upregulation of endogenous HSP70 in the Artemia franciscana (Kellogg) occurs simultaneously when shielding bacterial infection (Sung et al., 2009). Coho salmon infected with Renibacteriumsal moninarum expressed higher levels of hsp70 in the liver and kidney when compared with uninfected salmon, highlighting the importance of hsp70 genes in immune response of fish (Forsyth et al., 1997). Juvenile rainbow trout (Oncorhynchus mykiss) infected with Vibrio anguillarum has higher hsp70 expression in hepatic and kidney tissues before showing clinical signs of disease (Ackerman & Iwama, 2001). Therefore, hsp70 is important for the immune response of aquatic species against diverse infections.
In addition to its role in cellular function, stress response and immunity, HSPs have also been shown to be involved in embryonic development and extra-embryonic structures (Morange et al., 1984; Voss et al., 2000; Matwee, 2001; Louryan et al., 2002; Rupik et al., 2006). During embryonic development, Many HSPs exhibit complex spatial and temporal expression patterns (Krone, Lele & Sass, 1997). For example, mouse embryos treated with anti-HSP70 showed significant reduction in the progression of development (Neuer et al., 1998). Zebrafish demonstrated low and constitutive hsp90a expression during embryonic development, and these levels increased when the gastrula and later stage embryos were exposed to heat (Krone & Sass, 1994). Moreover, hsp47 showed higher expression in response to stress (Pearson et al., 1996), and was involved in the formation of embryonic tissues in fish through its interaction with procollagen (Krone, Lele & Sass, 1997). Therefore, HSPs play an important role during embryonic development in addition to their basic cellular functions.
Japanese flounder is endemic to the northwestern Pacific Ocean (Minami & Tanaka, 1992). It is the dominant flatfish species in the aquaculture industry because of its rapid growth rate, delicious taste, and high nutritional value, therefore becoming an economically important marine species in China, Korea, and Japan (Fuji et al., 2006). The genome of Japanese flounder was recently completed (Shao et al., 2017), thereby facilitating the discovery of hsp70 genes. Here, we identified and characterized the Japanese flounder hsp70 family and determined whether these genes are involved in stress response to a pathogen, and embryonic development. Comparative genomics between the other closely related species offer a chance to understand the evolutionary relationship of hsp70 and the selective pressures that affect the evolution of these genes. Our findings provide insight into the function of hsp70 in embryonic development and disease defense in the Japanese flounder, which may help future improvement of the Japanese flounder for aquaculture.
Materials & Methods
Ethics statement
The handling of experimental fish was approved by the Animal Care and Use Committee of the Chinese Academy of Fishery Sciences, and all protocals were performed in accordance with the guidances of the Animal Care and Use Committee.
Database mining and sequence extraction
A comprehensive search of the sequence database on the NCBI website and Ensemble website was employed to identify hsp70 orthologs among six different teleost fish, including: zebrafish, stickleback, medaka, tilapia, platyfish, and tetraodon. Protein sequences of all chosen species were collected, and HSP70 proteins were selected from zebrafish according to the accession number, and HSP70 protein sequences from zebrafish were used as queries to search against the Japanese flounder gene set with an intermediate stringency of e−10. Redundant gene sequences were removed by setting the identity value and coverage of the alignment length to 60% and 60%, respectively. All remaining sequences were manually confirmed for the presence of known HSP70 domains using the software SMART (Schultz et al., 1998; Schultz et al., 2000) to remove pseudogenes. When applying a similar method, hsp70 gene sequences were retrieved from the gene set of other species, including stickleback, medaka, platyfish, tilapia, and tetraodon. The Zebrafish Nomenclature Guidelines were used as a benchmark to name hsp70 genes in flounder. Furthermore, the isoelectric point (pI) of the HSP70 protein was determined using ExPASy (https://www.expasy.org/).
Phylogenetic analyses
To investigate the phylogenetic relationship of hsp70 genes among the surveyed fish species, the sequences were processed as follows: protein sequences were aligned using Guidance2 with MAFFT as the MSA algorithm and 100 bootstrap repeats. Ambiguous sites were manually trimmed while aligning sequences. The multiple sequence alignment was used as input into MEGA7 to construct a phylogenetic tree (Kumar, Stecher & Tamura, 2016). The phylogenetic relationships of hsp70 genes of seven teleost fishes were constructed using the ML method in MEGA7. In the ML analyses, the maximum composite likelihood model was used, and a total of 1,000 bootstrap replicates were conducted for each calculation. Finally, Evolview was used to visualize the phylogenetic tree (Zhang et al., 2012).
Sequence structure analysis and motif prediction of hsp70
To analyze the gene structure of hsp70 in the Japanese flounder, the Gene Structure Display Server of Peking University (Hu et al., 2015) was used to display the intron and exon structure of all hsp70 genes. To identify the motif of hsp70 genes, a structural motif search was conducted using MEME (Machanick & Bailey, 2011) with a target motif number setting of 15.
Molecular evolution analysis
Protein sequences from each clade in the phylogenetic tree were retrieved and used for multiple sequence alignment with Guidance2 (Sela et al., 2015). Unreliable sites were trimmed in the multiple sequence alignment, and a tree was constructed using IQ-TREE (Nguyen et al., 2014). Codon alignment of protein sequences was converted by pal2nal (Suyama, Torrents & Bork, 2006). Using these data, molecular evolution analysis was conducted to measure the selection pressure within each clade, and the CODEML program from PAML (Yang, 1997; Yang, 2007) was used to estimate the ω value using the branch site model. The aim of the branch-site test was to identify episodic Darwinian selection along a prespecified branch in a phylogenetic tree that impacts only a few codons in the coding sequence of a gene. Using this model, we detected genes under positive selection and the corresponding sites with a nonsynonymous/synonymous ratio of ω > 1 (Yang & Nielsen, 2002; Yang & Reis, 2011; Zhang, Nielsen & Yang, 2005).
Structure modeling
To better understand the protein structure of genes under positive selection in Japanese flounder, PHYRE2 (Kelley & Sternberg, 2009) was used to predict the protein structure and secondary structure using the default parameter. The sites under positive selection were marked by PyMol 2.0.
Immune response expression profile of hsp70 genes against Edwardsiella tarda infection in the Japanese flounder
RNA-seq data was downloaded from Sequence Read Archive (SRA) database in NCBI, including the following accession numbers: SRR5713071, SRR5713072, SRR5713073, SRR5713074, SRR5713075, SRR5713076, SRR5713077, SRR5713078, SRR5713079, and SRR5713080. These data represented the Japanese flounder that was challenged with E. tar at 0 h, 8 h, and 48 h, as well as a control injected with Ringer’s solution (Li et al., 2018). The data was trimmed and the quota transcripts per million of each gene (TPM) was used to display the expression profile of hsp70 genes.
Expression pattern of hsp70 genes during embryonic development of Japanese flounder
The hsp70 gene expression analysis was conducted during early stages of embryonic development and mature gonads of Japanese flounder. The family of Japanese flounder with crosses of normal females and males were produced and kept in separate units until the collection of samples of sperm, oocytes, the 4 cell stage, 32 cell stage, 128 cell stage, high blastula stage, low blastula stage, early gastrula stage, late gastrula stage, myomere stage, heart beat stage, and hatched larva stage. RNA-seq was conducted on all the above developmental samples (Table S1). In addition, raw sequence data of ovaries and testis were downloaded from NCBI (accession numbers SRR3509719 and SRR3525051). Gene expression levels were assessed using TPM, then the R package pheatmap (Kolde, 2018) was used to illustrate the expression patterns at different developmental stages.
Results
Identification of hsp70 superfamily genes
A total of 111 genes were retrieved from seven fish species (Japanese flounder, zebrafish, stickleback, medaka, tilapia, platyfish, and tetraodon), where the number of hsp70 genes ranged from 9 to 21, depending on the species. There were 9 hsp70 genes in the tetraodon, whereas tilapia had 21 hsp70 genes. Fifteen hsp70 genes, including hspa1a, hspa4a, hspa12a, hsc70, hspa5, hspa9, hspa1b, hspa12b, hspa14, hspa13, hspa4l, hspa4b, hspa8a, hspa8b, and hyou1 were identified in the Japanese flounder (Table 1). All genes contained the necessary domains of hsp70. The length of the corresponding protein ranged from 442 to 1,020 amino acids. The pI of different genes was variable, ranged from 4.97 to 8.17 (Table 1).
| Name | Accession number | Gene length (bp) | Protein length (aa) | pI |
|---|---|---|---|---|
| hspa1b | N_000000250.1 | 1839 | 613 | 5.31 |
| hspa4a | N_000000247.1 | 11776 | 834 | 5.13 |
| hspa12b | N_000000248.1 | 11247 | 673 | 8.17 |
| hsc70 | N_000000245.1 | 2998 | 578 | 5.08 |
| hspa5 | N_000000244.1 | 2767 | 654 | 4.97 |
| hspa9 | N_000000246.1 | 7683 | 716 | 6.23 |
| hspa1a | N_000000243.1 | 1923 | 640 | 5.42 |
| hspa12a | N_000000237.1 | 21277 | 655 | 7.3 |
| hspa14 | N_000000249.1 | 7155 | 506 | 5.96 |
| hspa13 | N_000000242.1 | 2934 | 442 | 5.5 |
| hspa4l | N_000000241.1 | 8479 | 1005 | 5.25 |
| hspa4b | N_000000236.1 | 7353 | 835 | 4.98 |
| hspa8a | N_000000238.1 | 10619 | 1020 | 6.47 |
| hspa8b | N_000000239.1 | 4364 | 659 | 5.32 |
| hyou1 | N_000000240.1 | 11459 | 970 | 5.12 |
Notes:
pI indicates the protein isoelectric point.
Phylogenetic analysis of hsp70 in fish
We next conducted a phylogenetic analysis using 111 hsp70 genes from seven teleost species (Fig. 1). In our analysis, hsp70 genes were divided into eight subclades, which matched the known subfamilies of hsp70 genes. However, we observed ambiguous separation between hspa1, hsc70, and hspa8. Not all the fish species had genes from each clade. For example, tetraodon did not contain hspa14 and medaka did not contain hyou1. All the members of the flounder hsp70 were split into distinct clades and were grouped with the corresponding genes from zebrafish and other fish.
Sequence structure analysis and motif prediction of hsp70 gene family
In general, hsp70 genes are variable in length, ranging from from 1839 bp to 21277 bp (Table 1 and Fig. 2). They have diverse numbers of exons, for instance, hspa1a and hspa1b contained one exon, hspa4a, hspa4b, and hspa4l that belong to the same subfamily contained 19–23 exons. Other genes within the same subfamily shared similar number of introns and exons. The gene structures of hsp70 from the seven species included in this study are displayed in (Table S2 and Fig. S1). The hsp70 found in flounder had variable protein motif patterns (Fig. 3). Genes hspa12a and hspa12b contained three motifs, and hspa1a and hspa1b contained the maximum number of motifs (15). The motif compositions of different hsp70 genes are listed in Fig. S2.
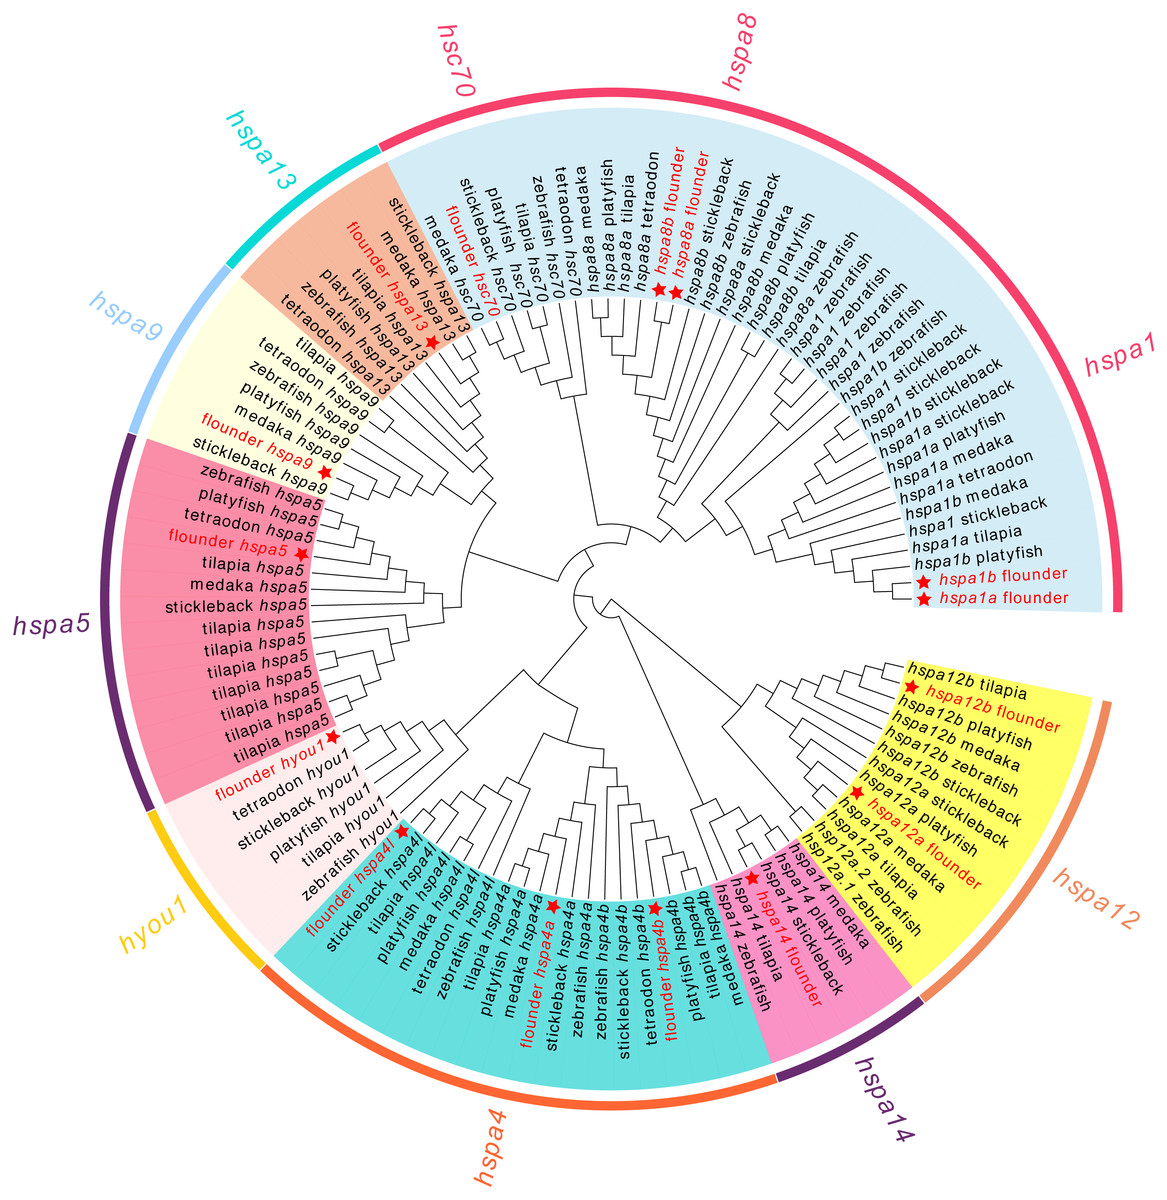
Figure 1: Phylogenetic tree of hsp70 from flounder, medaka, tilapia, zebrafish, platyfish, tetraodon, and stickleback.
The color in the background indicates the branch of sub-family and corresponds to the sub-family names marked in the same color as the circle beyond. The hsp70 genes from flounder are marked with a red star.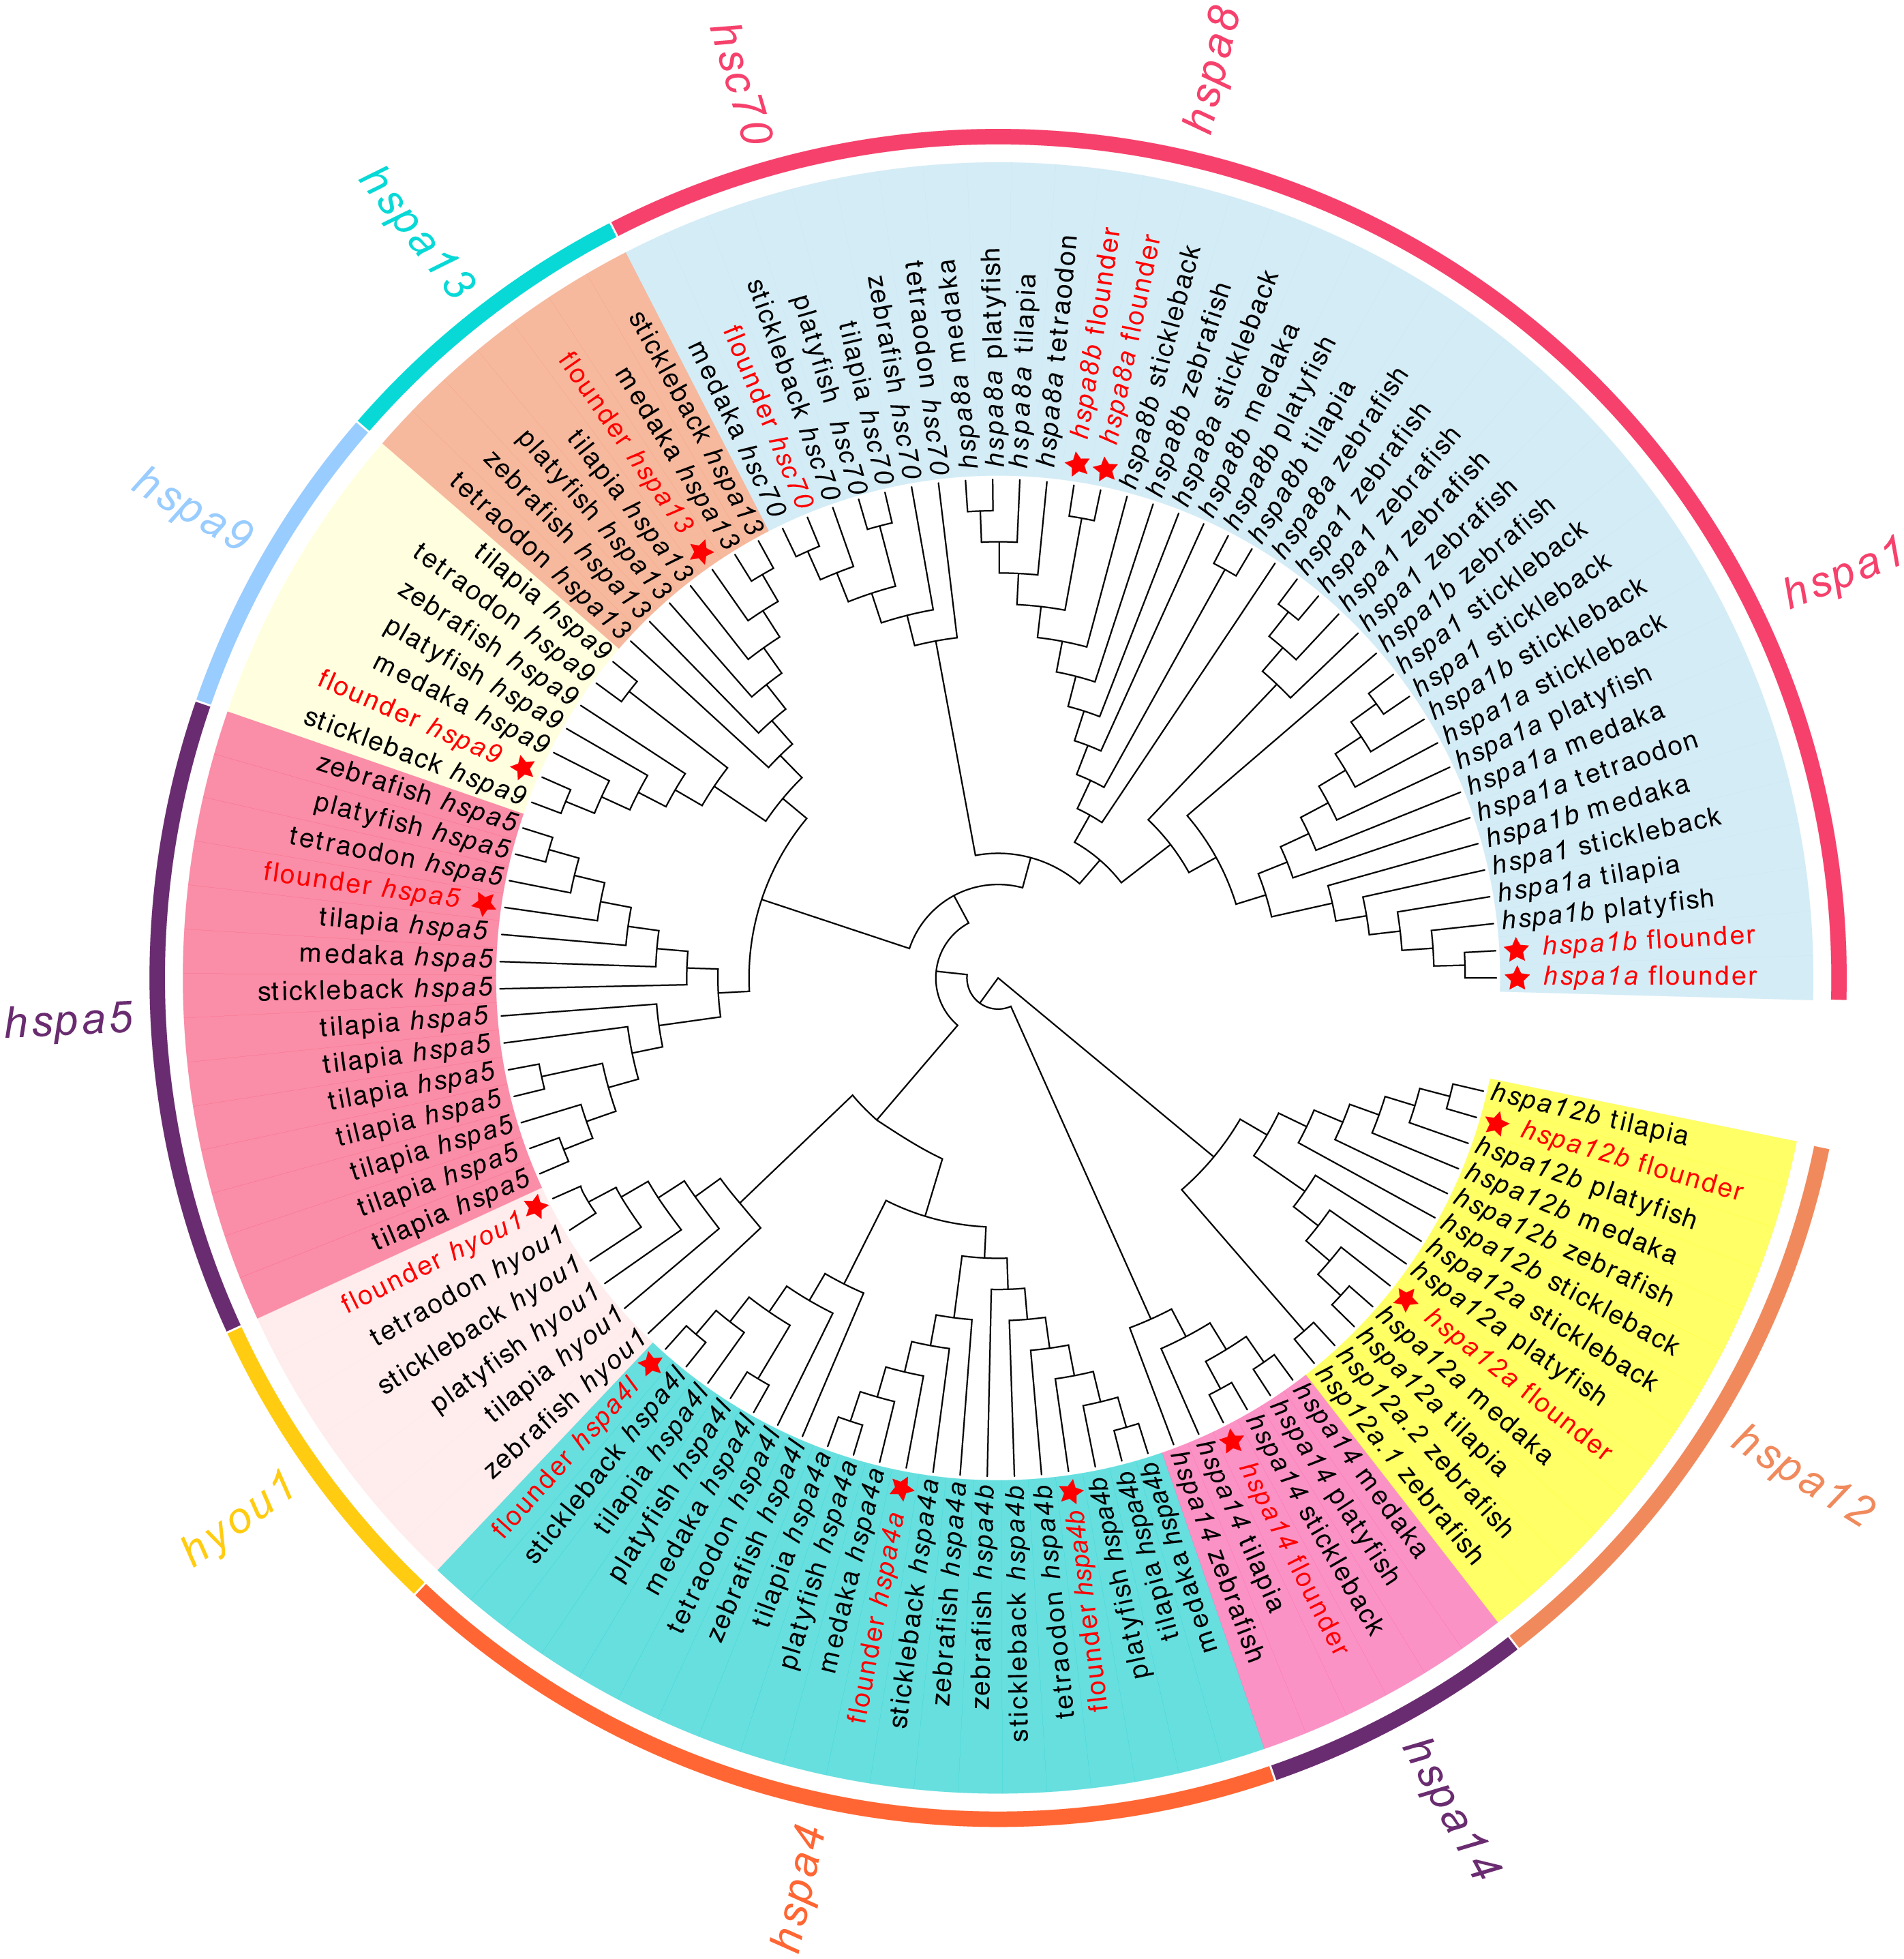
Molecular evolution analysis
Although eight subclades can be found, hspa1, hsc70, and hspa8 clade show ambiguous separation, and could not be used for positive selection analysis. Therefore, we only used data from the other seven hsp70 subclade genes in Japanese flounder to identify signatures of evolution.We identified four genes, hspa4l, hspa9, hspa13, and hyou1, as having signatures of positive selection in the Japanese flounder, with P < 0.05. Among them, hspa4l and hspa13 contained one positively selected site with posterior probabilities values > 0.95, while hspa9 contained two positively selected sites. The sites were as follows: the Cys in the protein sequence of gene hspa4l, which was the 235th amino acid; the 582th and 587th amino acid Thr were present in the protein of hspa9; the His is the 337th amino acid in gene hspa13 (Table S3).
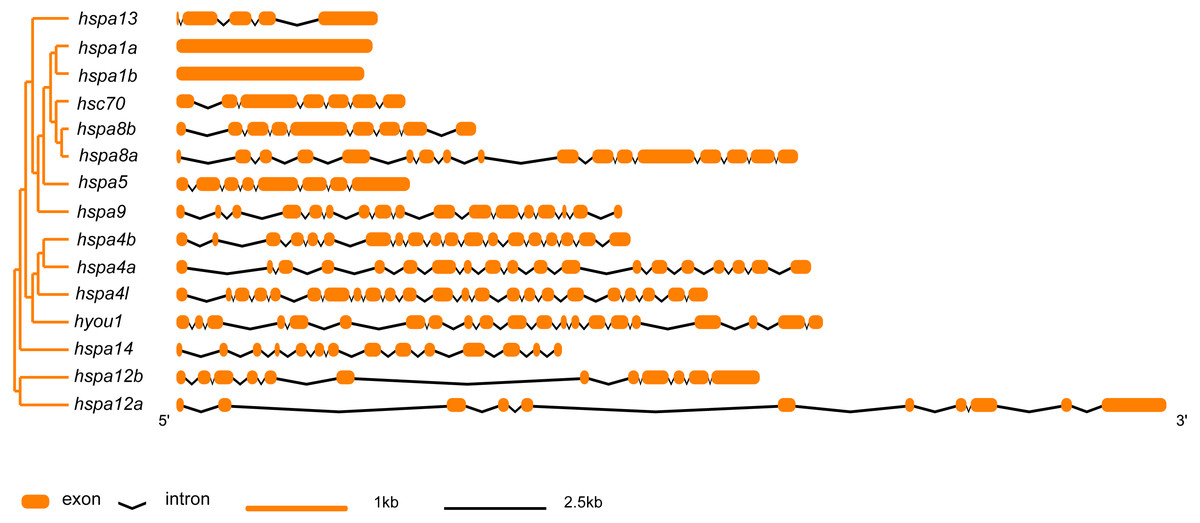
Figure 2: Intron-exon structure of hsp70 genes in flounder.
The phylogenetic tree on the left panel was generated using MEGA7 with the Neighbor-joining (NJ) method and 1,000 bootstrap replicates. The right of the panel shows exon and intron structure of hsp70, where the orange rectangles represent exons, black polylines indicate introns, orange and black line indicates scale.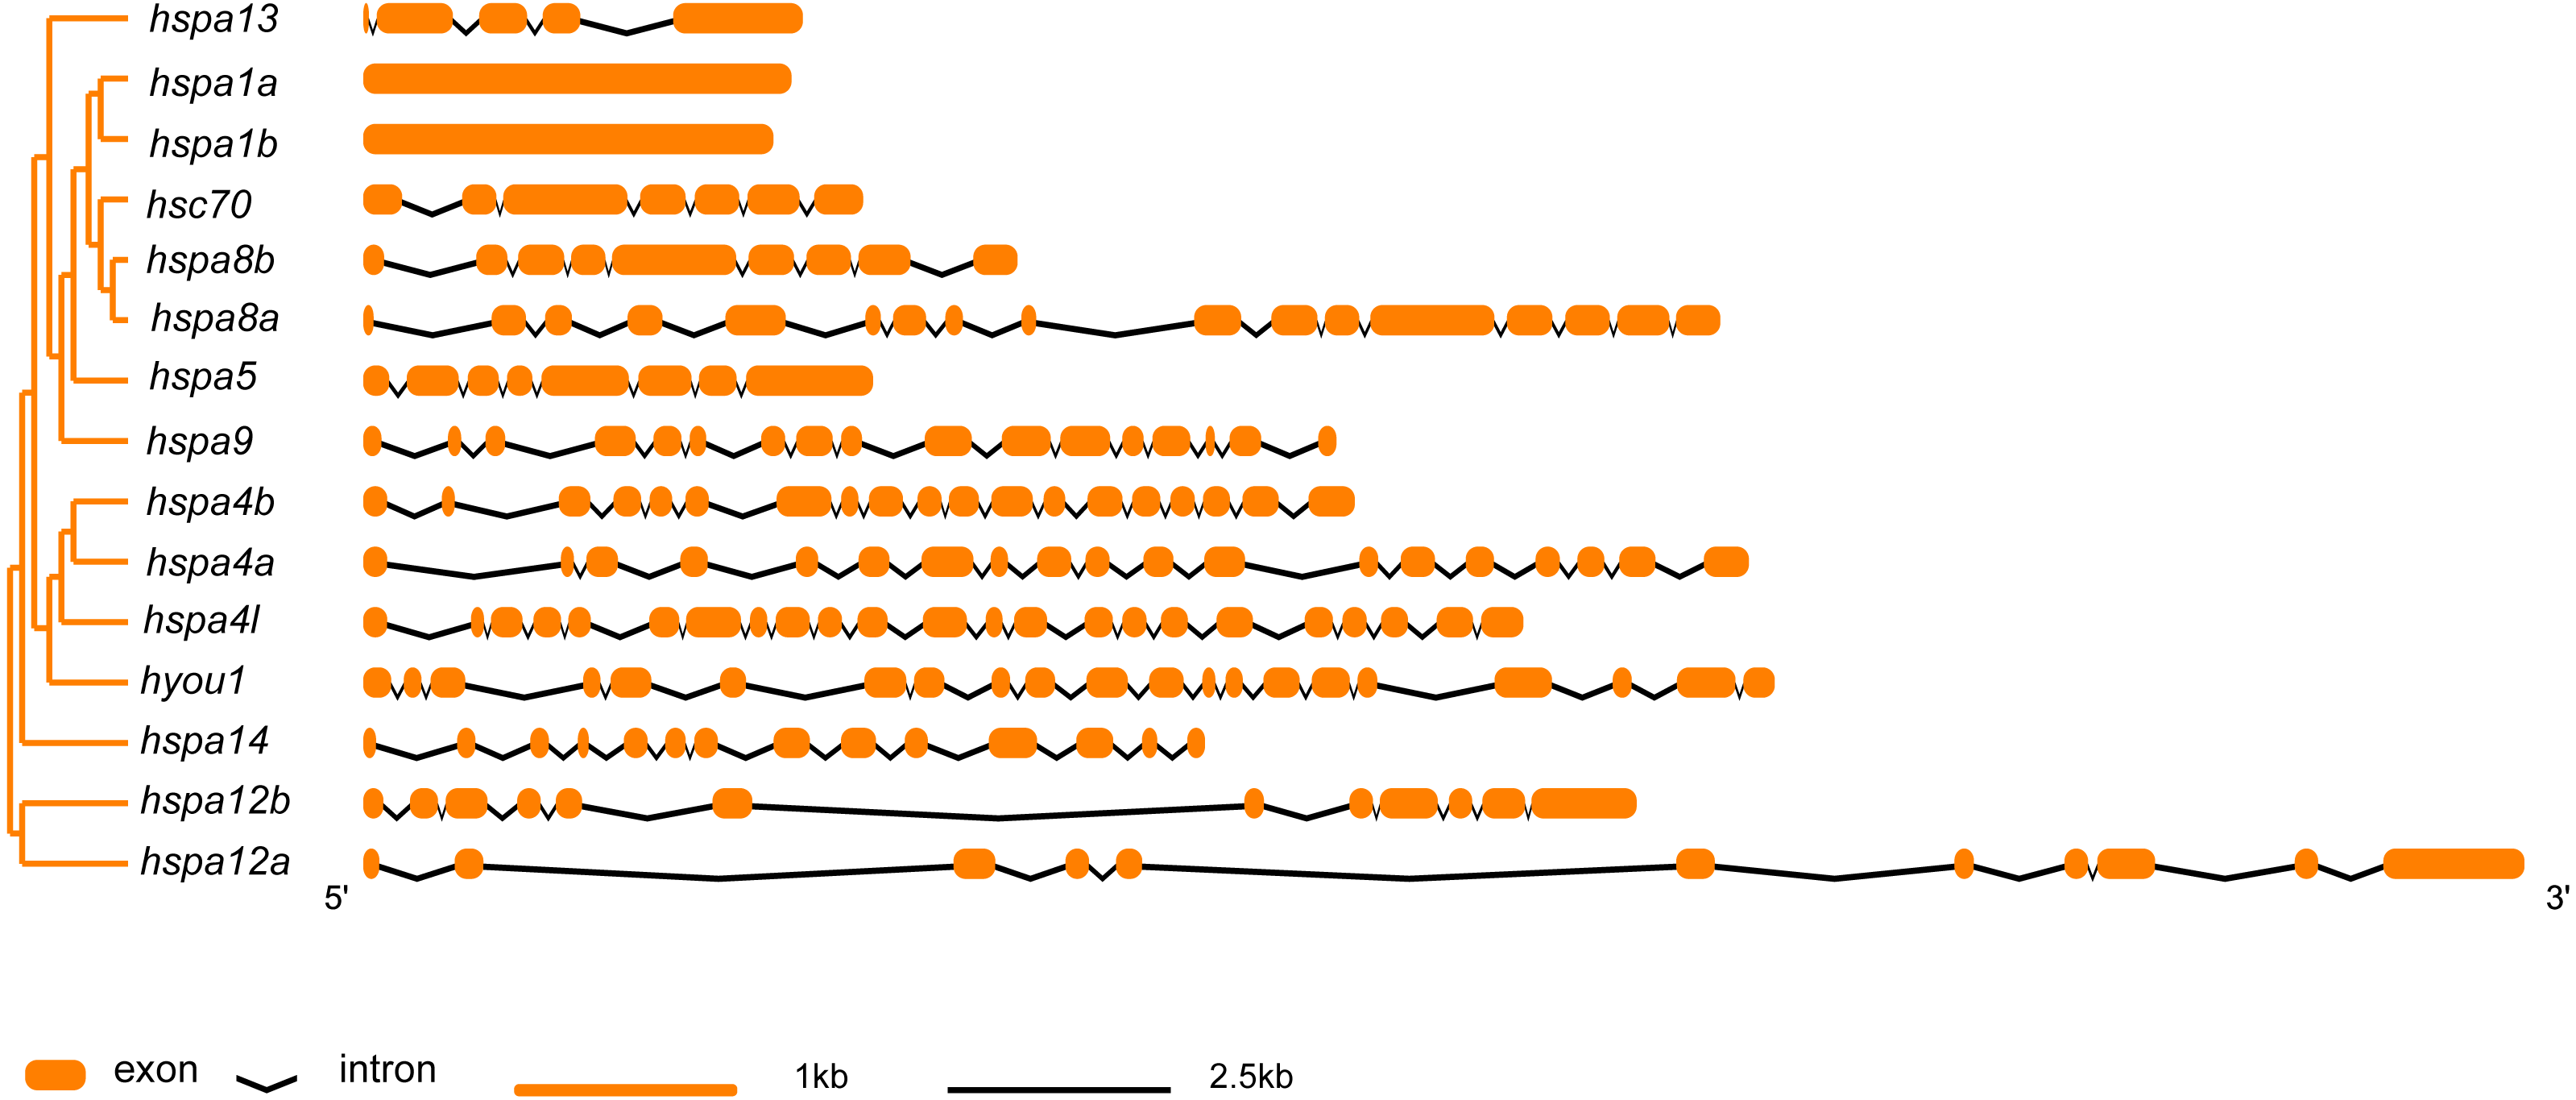

Figure 3: Schematic representation of conserved motifs in HSP70 proteins.
Each colored box represents a motif and boxes in the same color indicate the same motif.
Protein structure of genes under positive selection
Next, we generated three-dimensional protein structures of HSPA4L, HSPA9, HSPA13, and HYOU1 using PHYRE2. However, we were unable to predict the structure of HSPA9 and HYOU1. The site under positive selection in significant level was marked in the predicted proteins of HSPA4L and HSPA13 (Fig. 4). The predicted secondary structure of HSPA4L demonstrates that the Cys under positive selection is located in a α-helix, and the His under positive selection is located in a β-strand in HSPA13 (Fig. 5).
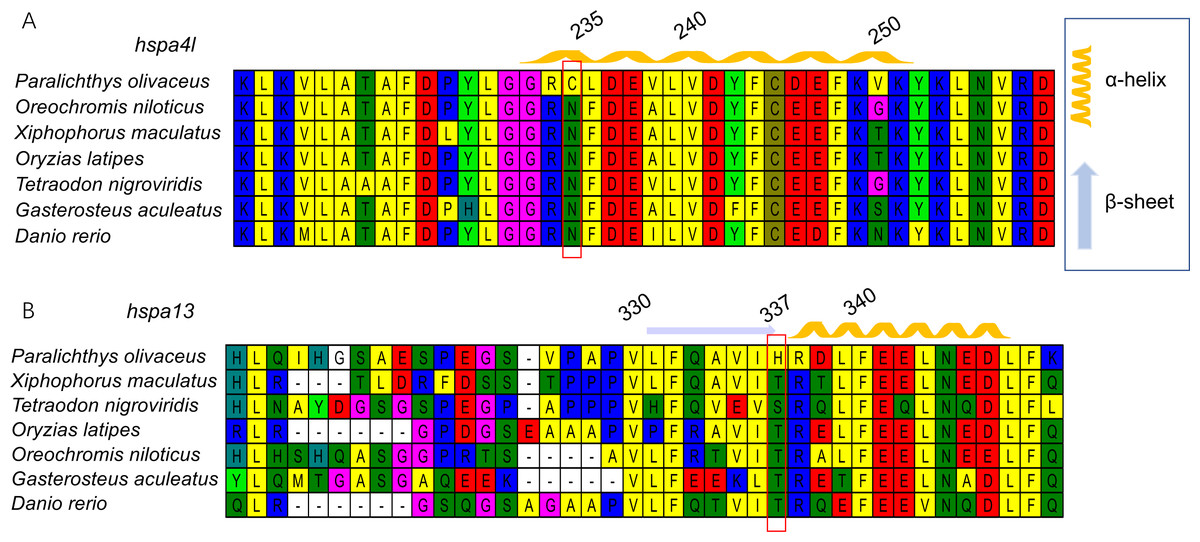
Figure 4: Multiple alignments of positively selected sites in hspa4l (A) and hspa13 (B).
The amino acid residue in the red square represents the positively selective site. The secondary structure was predicted by PHYER2, and α-helixes were indicated in yellow and β-sheets were indicated in blue. The number on the top indicates the position of the amino acid residue in the protein.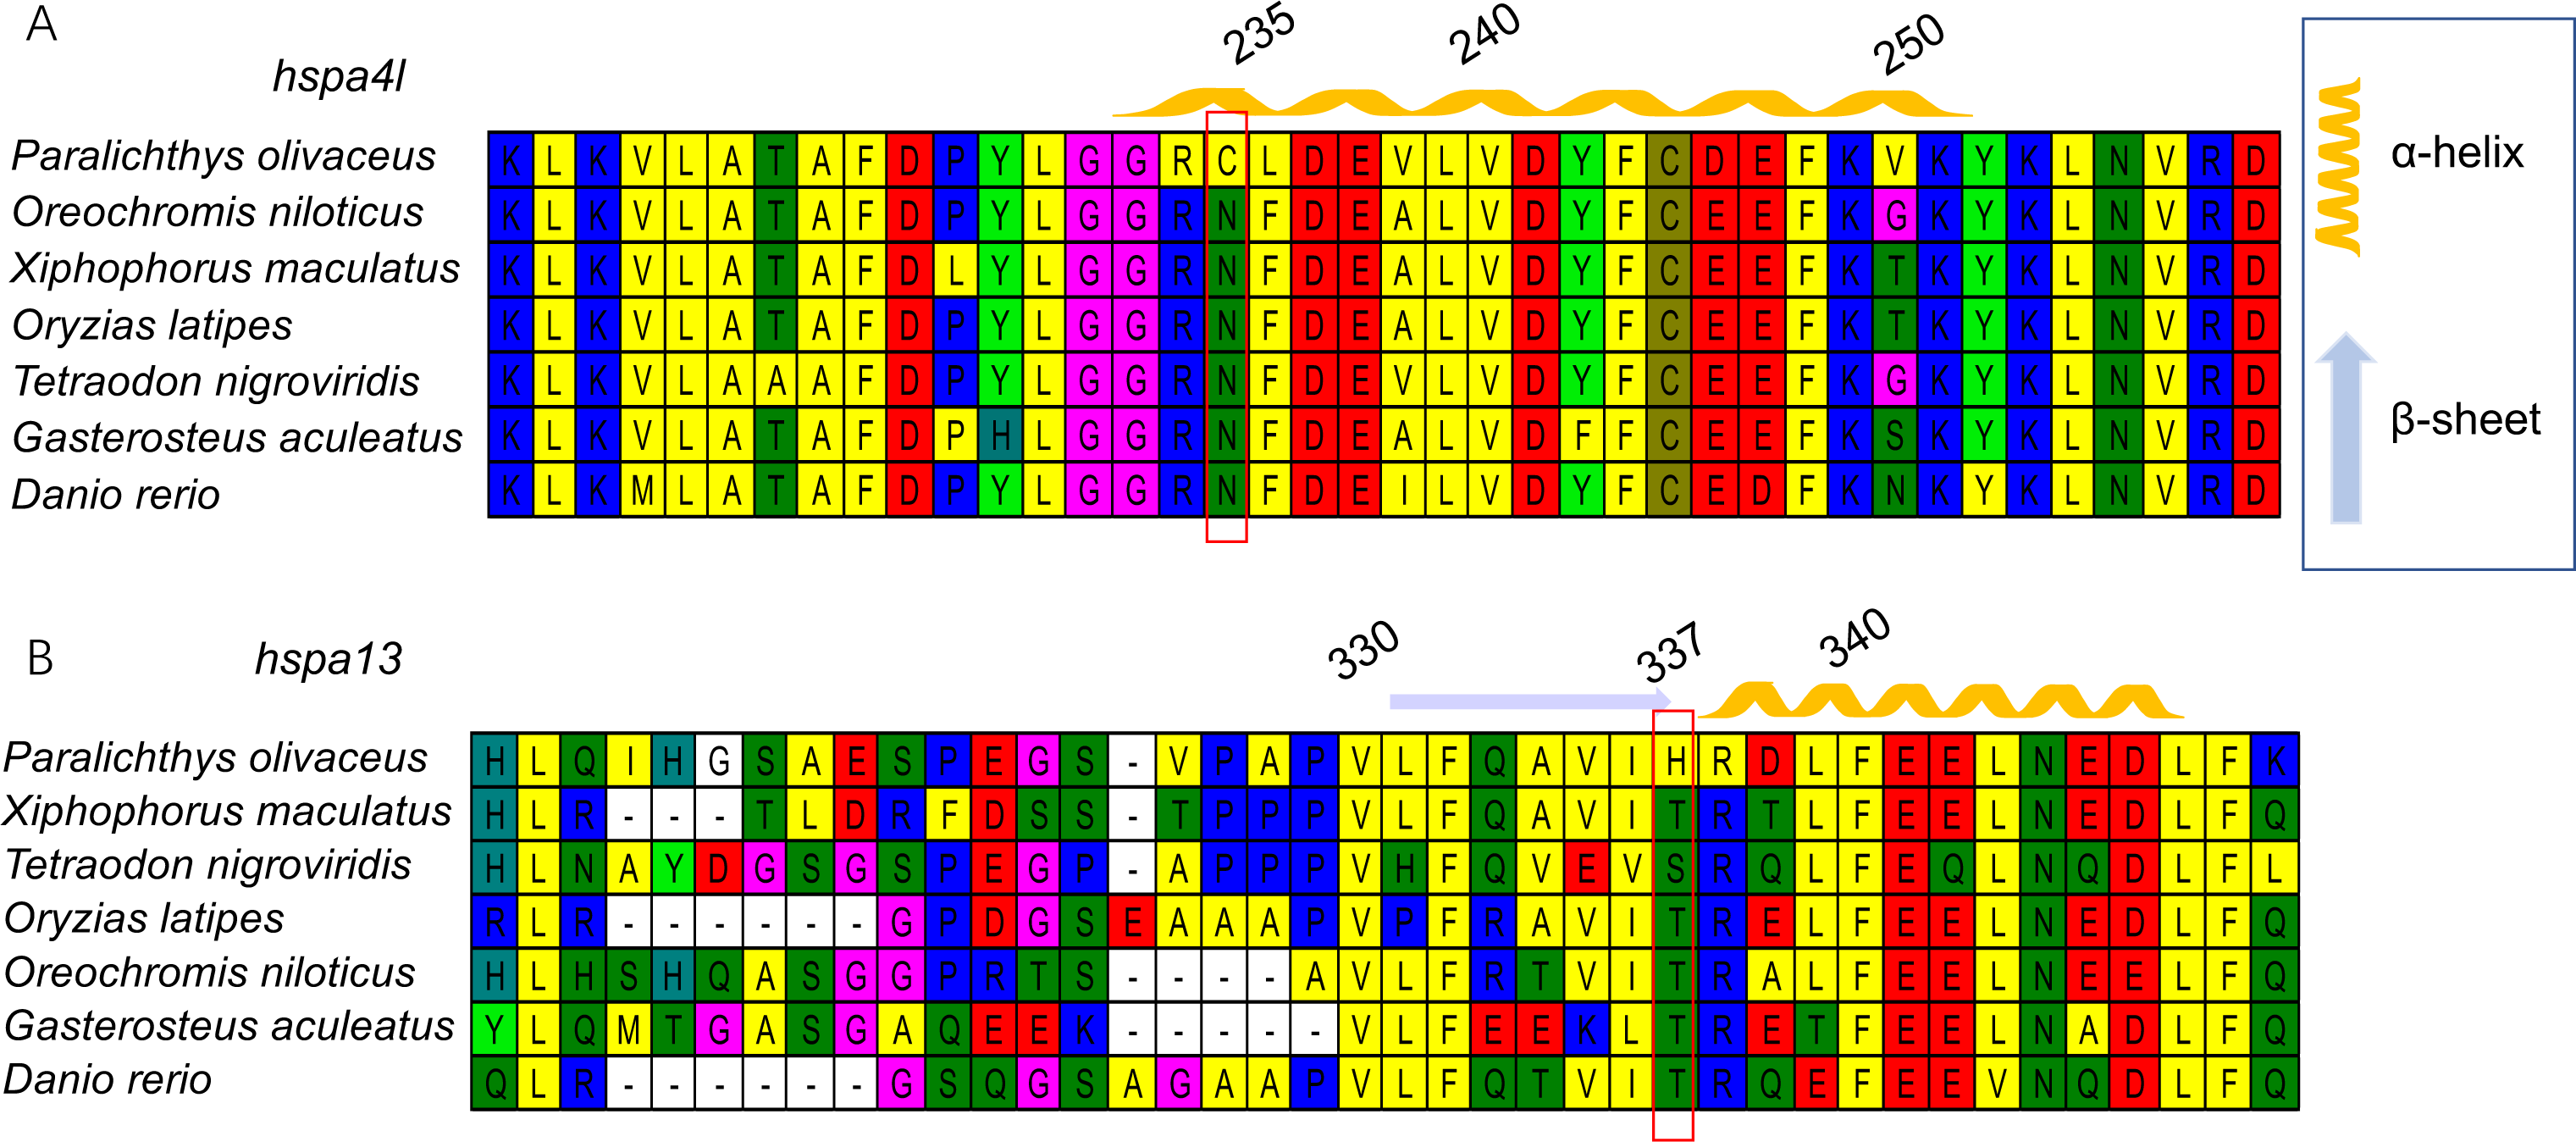

Figure 5: The 3D-structural models of HSPA4L (A) and HSPA13 (B).
The amino acid under positive selection in HSPA4L is indicated in black (Cys 235) and located in an α-helix. The site under positive selection in HSPA13 is indicated in orange(His 337) and located in a β-sheet.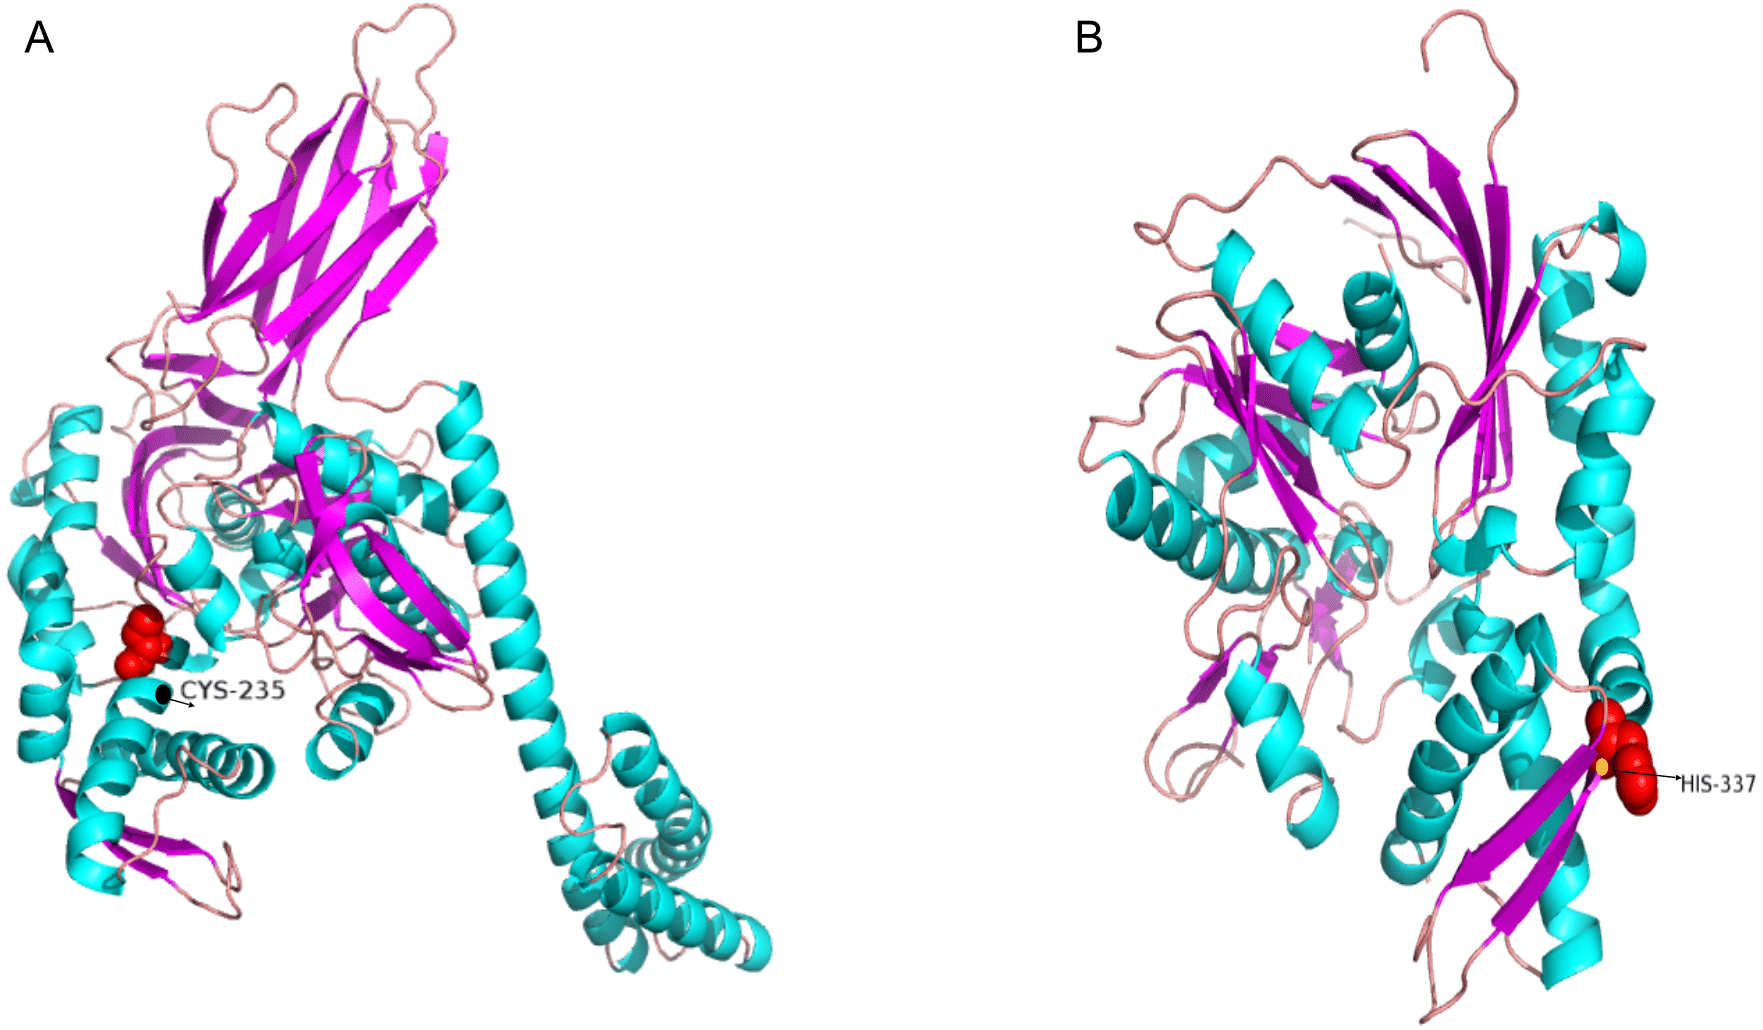
Immune response expression profile of hsp70 genes against Edwardsiella tarda infection in Japanese flounder
To test the role of hsp70 in response to an infection, we analyzed previously generated RNA-seq data of Japanese flounder blood from samples infected with E. tar. Overall, the hsp70 genes showed diverse expression patterns after the E. tar infection. Expression levels of hspa8b, hspa12a, hspa1a, hspa8a, hsc70 and hspa1b decreased after 48 h of treatment with E. tar. Other genes, such as hspa9, hspa12b, hspa4l, hspa13, and hyou1 showed increased levels of expression after treatment for 48 h. Only the expression of hspa4a was similar after 48 h of treatment (Fig. 6). The expression of hspa1a, hspa4a, hspa9, hspa12b, hspa4l, hspa13, and hyou1 was dramatically changed in the samples injected with Ringer’s solution after 8 h, however, the expression of genes hspa12b, hspa13 and hyou1 returned to the original level of expression at 48 h after injection with Ringer’s solution.

Figure 6: Expression patterns hsp70 in Japanese flounder.
Each column represents a time point, and each row represents a gene. The relative expression level is indicated by the color bar on the top right. 0 h represents the blank control group at the beginning of the experiment, C 8 h, and C 48 h indicates Ringer’s solution control group, whereas E 8h and 48 h indicate a bacteria-challenged experimental group.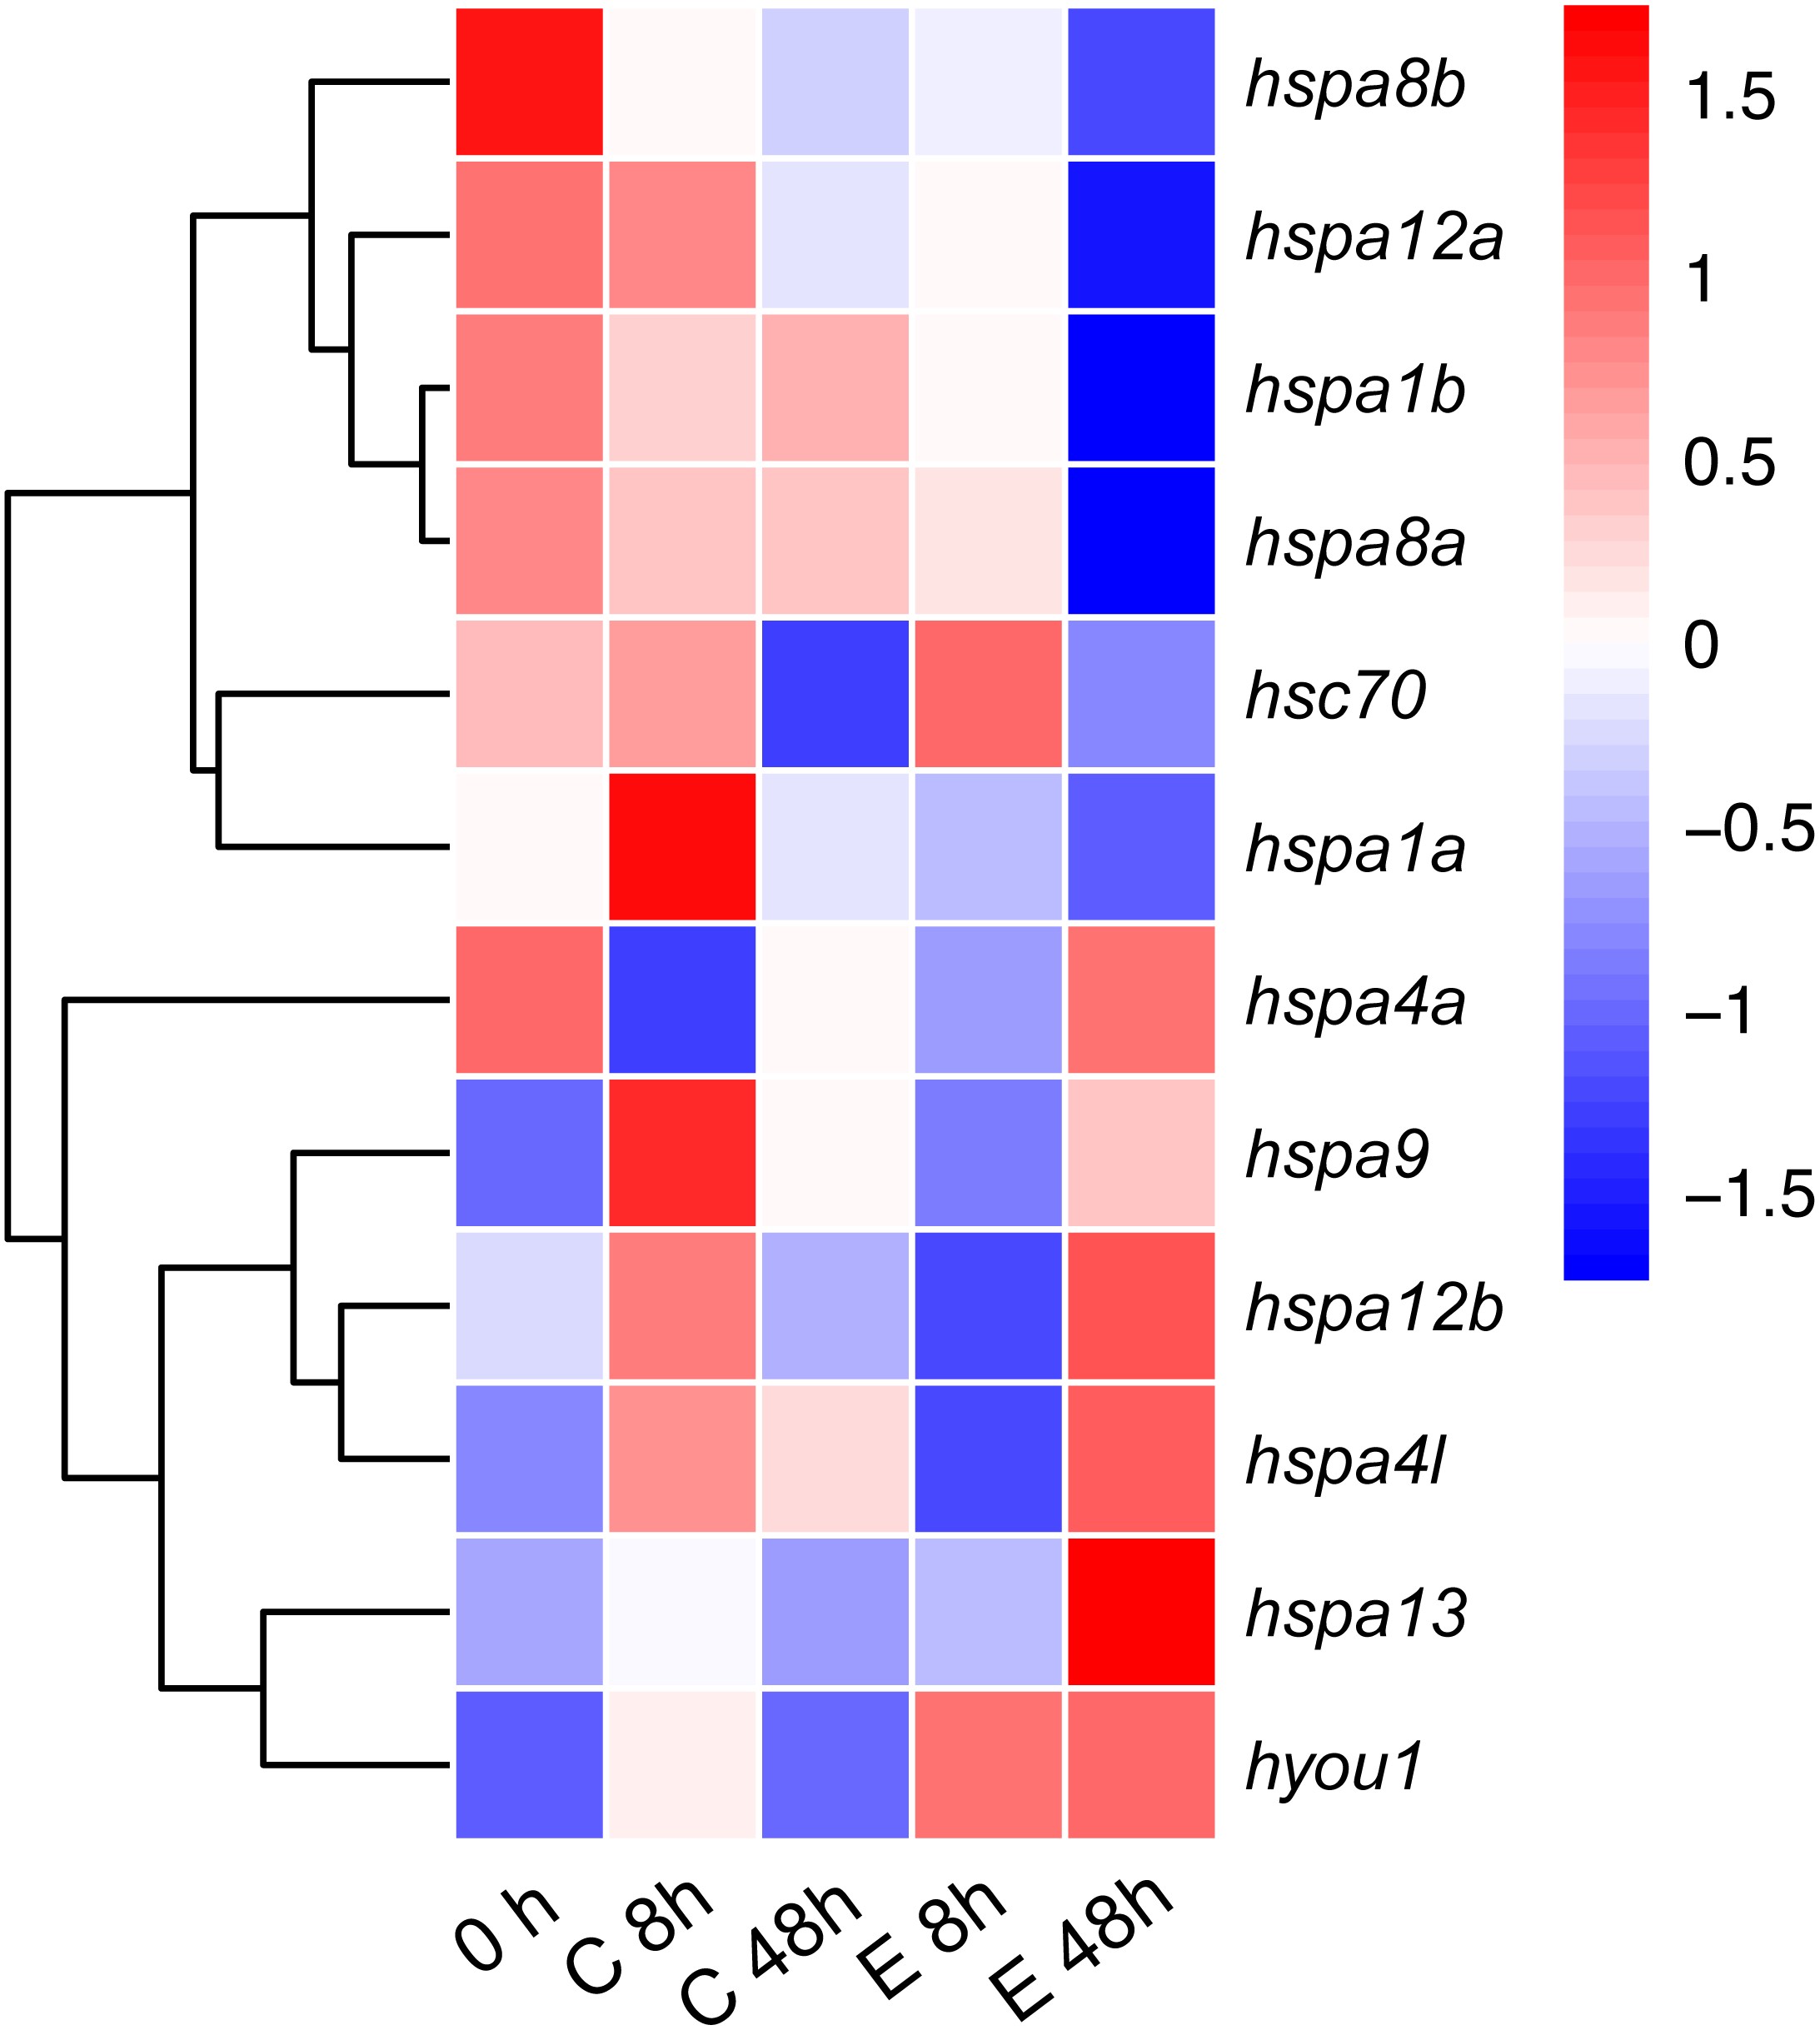
Expression pattern in developmental stages of Japanese flounder
We next investigated the expression profile of hsp70 genes in various developmental stages of the Japanese flounder. We observed significant differences in gene expression based on the developmental stage. Differential expression was observed between oocytes and sperm, where most hsp70 genes, including hspa4l, hspa4a, hspa9, hsc70, and hspa1b in oocytes had higher expression level than the sperm. Comparing expression of hsp70 in sperm and testis, some genes, including hspa4l, hspa4a, hspa9, hspa13, hspa1a and hspa8a had a higher expression level in the testis compared to sperm. When comparing the expression of ovaries and oocytes, some genes, for instance, hspa1a and hspa8a showed higher expression in the ovaries compared to oocytes, while other genes, for example, hspa9, hsc70, and hspa1b showed the opposite. In early embryonic development, from oocyte to high blastula stage, hspa9, hsc70, hspa1b, hspa4l, and hspa4a had high expression. Interestingly, the expression of these genes decreased from the low blastula stage to hatching stage. In contrast, the expression of hspa8b, hspa13, hspa4b, and hspa8a increased during later developmental stages (Fig. 7).
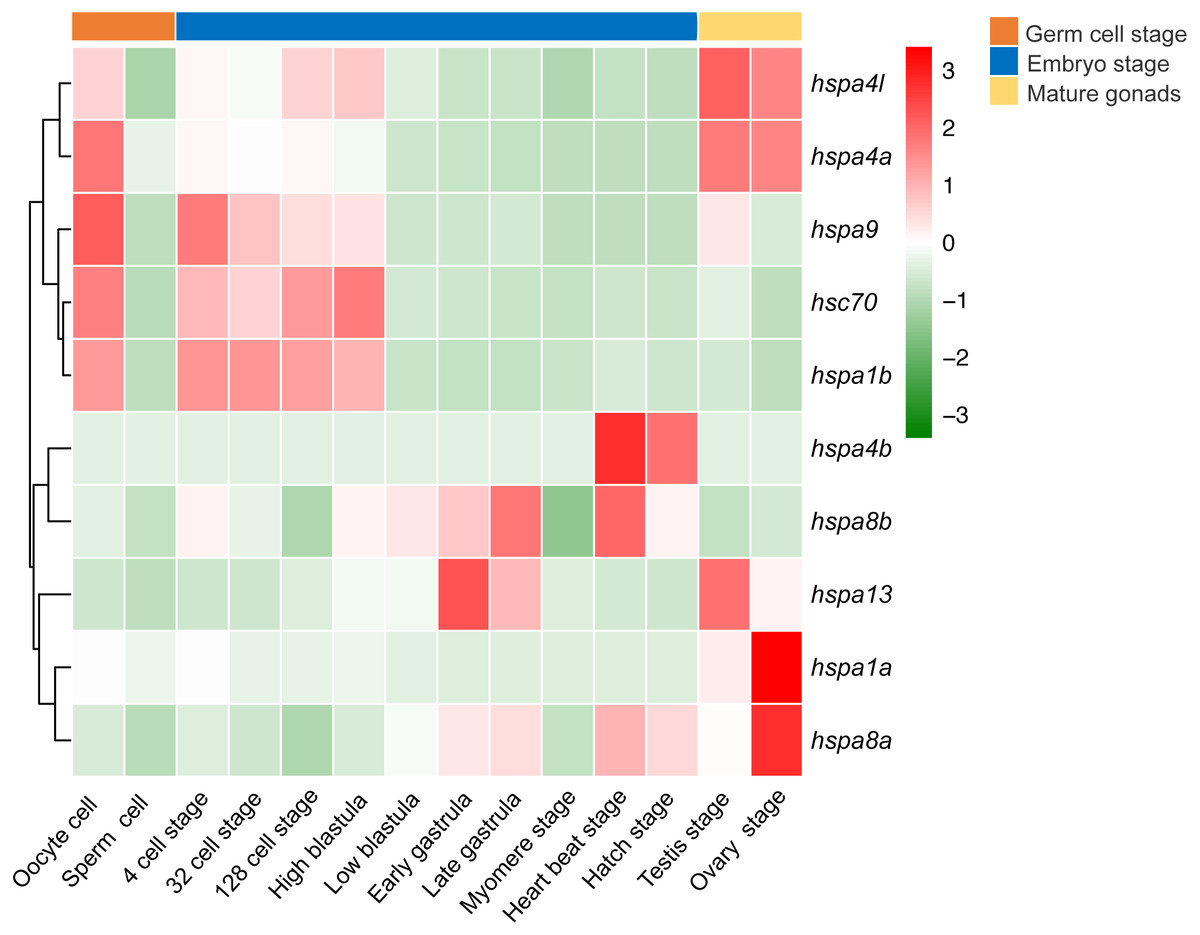
Figure 7: Expression profiles of hspa4l, hsp4a, hspa9, hsc70, hspa1a, hspa8b, hspa13, hspa4b, hsp8a and hspa1b during the life cycle of the Japanese flounder.
The panel is split into three parts by the three bars on the top, from left to right represents the germ cells, embryonic development stages, and mature gonads. The detailed stages are oocyte, sperm cell, 4 cell stage, 32 cell stage, 128 cell stage, high blastula, low blastula, early gastrula, late gastrula, myomere stage, heart beat stage, hatch stage, testis, and ovary stage. The relative expression level is indicated by the color bar on the top right.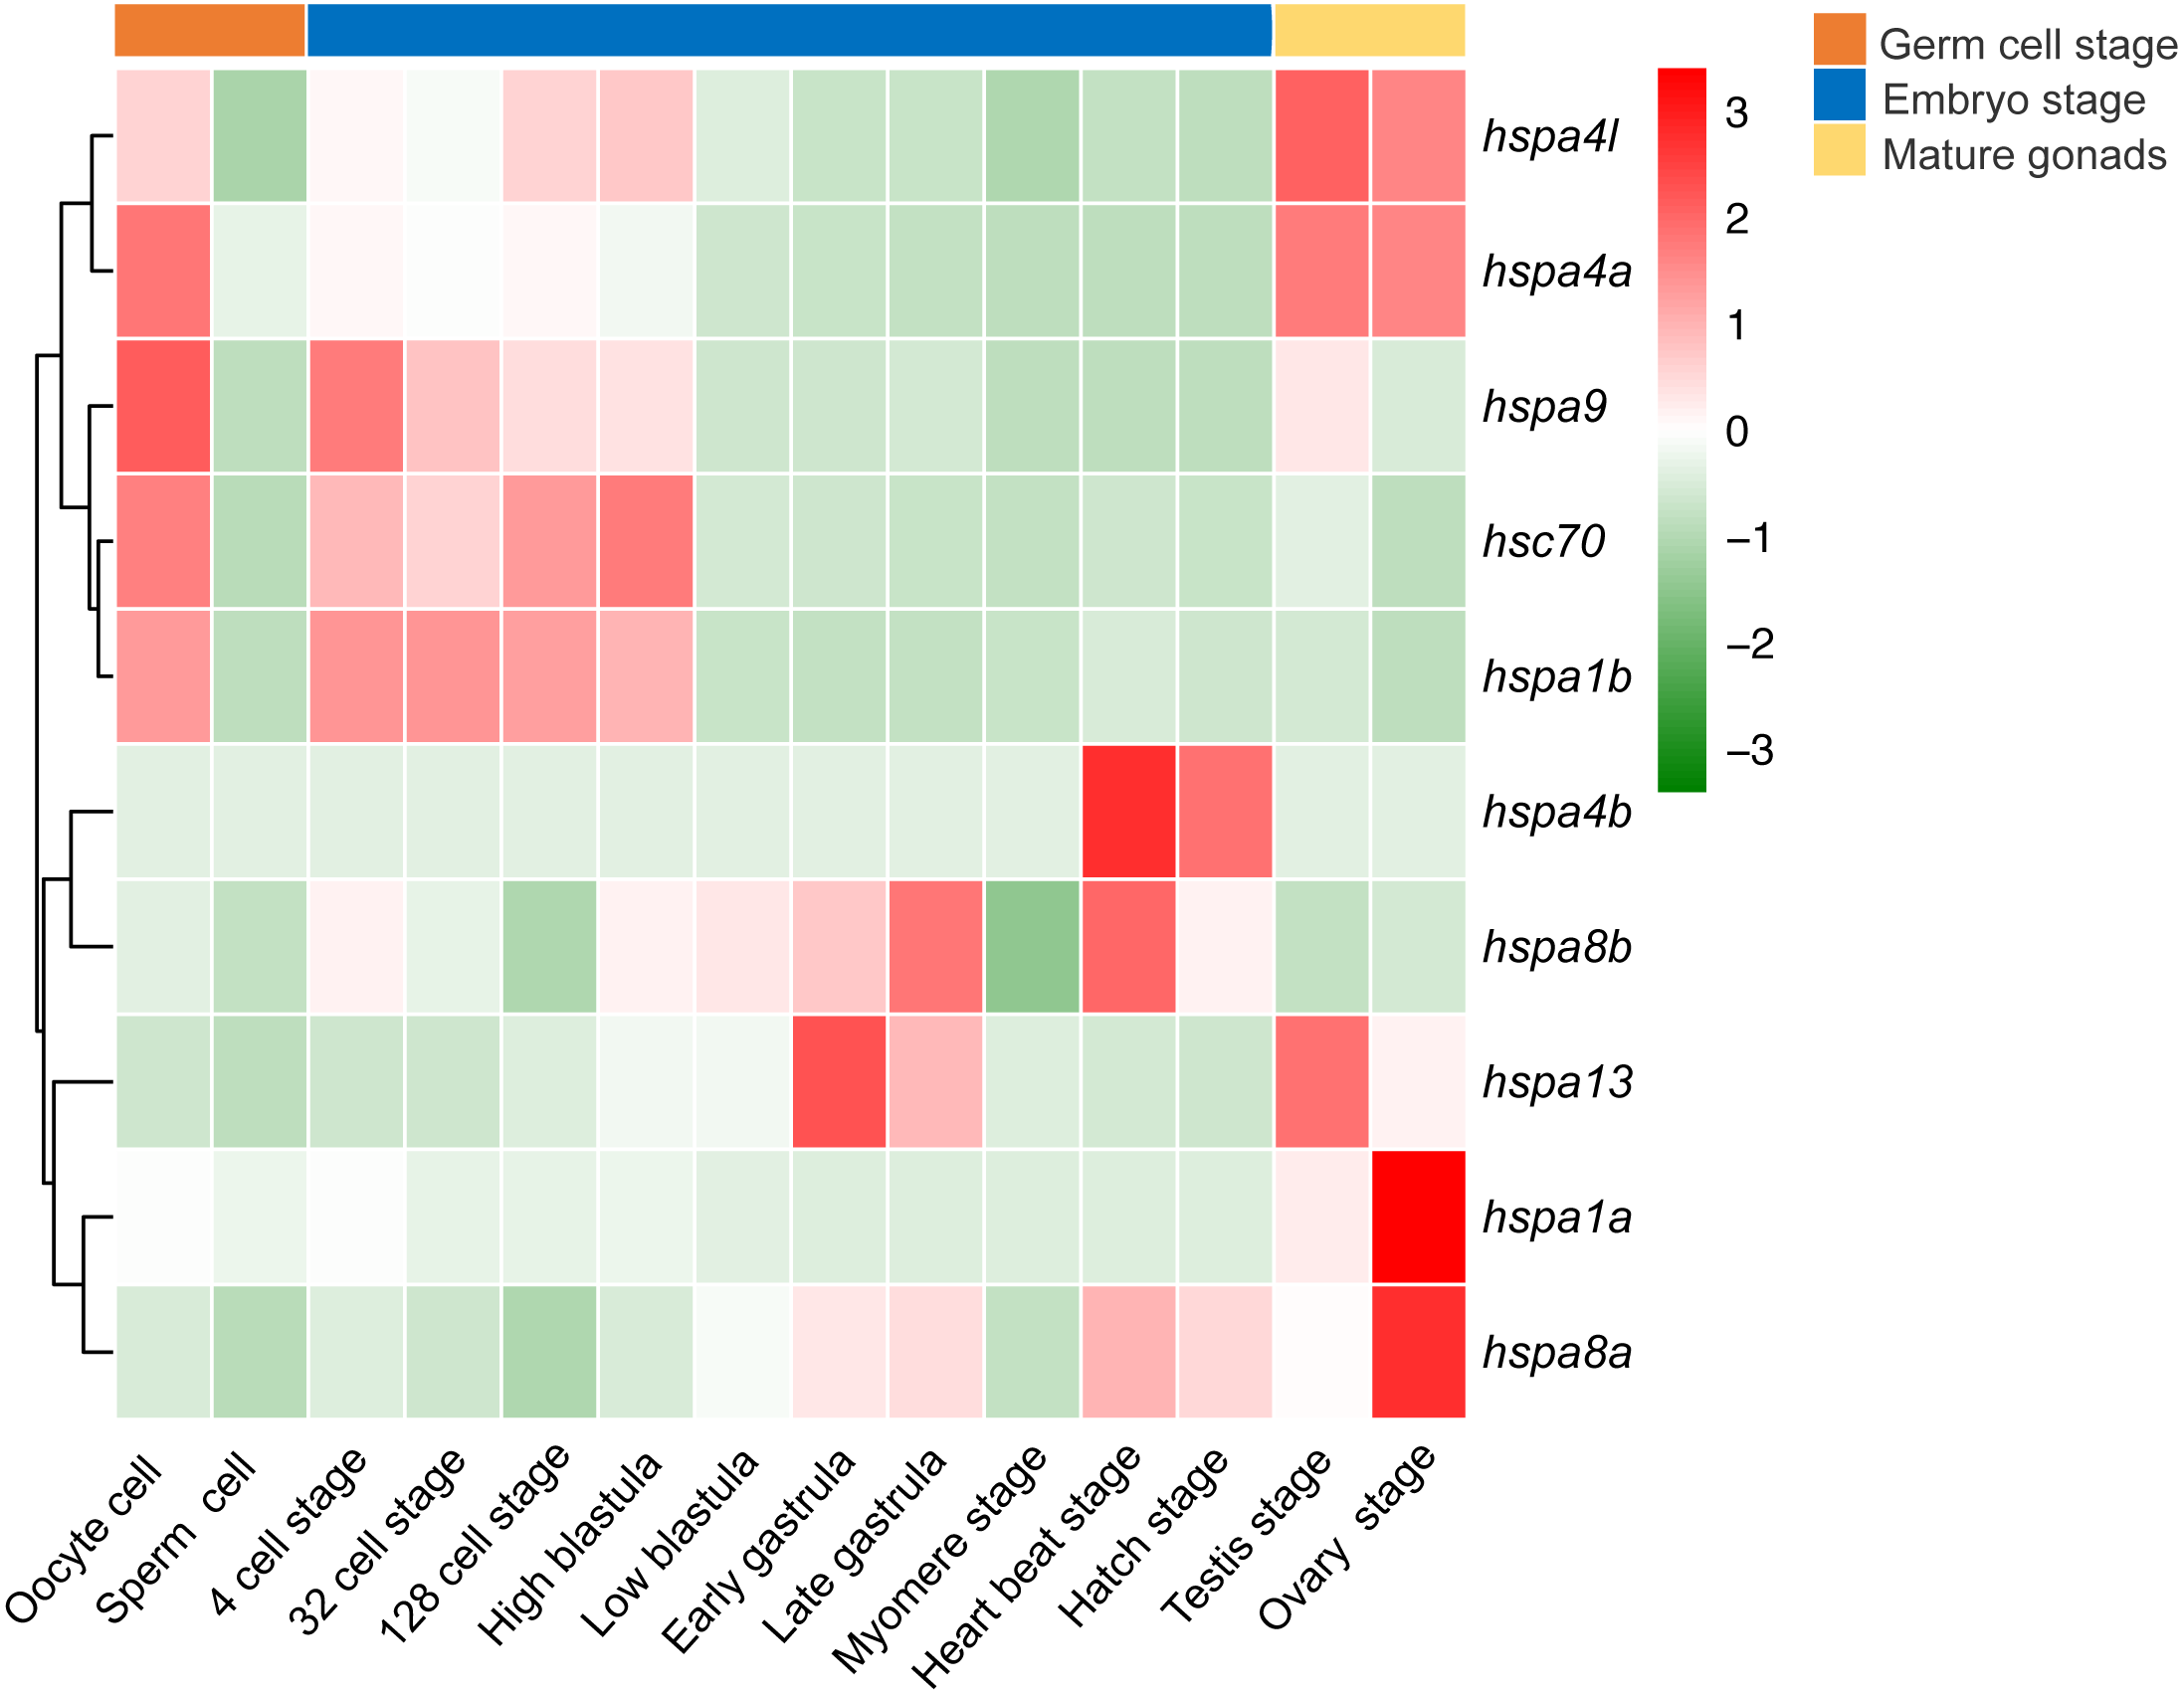
Discussion
Studies on HSPs have mainly focused on model organisms such as zebrafish, mouse, and fruit flies (Rupik et al., 2011). With increasing genomic data available for other organisms, more in-depth studies can be carried out in a variety of species. Here, we identified and characterized HSPs at the genome level, then explored the evolution of HSPs and its divergent functions on the immune response and different development stages of the Japanese flounder.
The hsp70 family genes in Japanese flounder were divided into numbers of branches containing the following genes: hsc70, hspa1, hspa4, hspa5, hspa8, hspa9, hspa12, hspa13, hspa14, and hyou1. The phylogenetic relationship and topology of hsp70 were consistent with previous studies (Daugaard, Rohde & Jäättelä, 2007), indicating the confidence of the retrieved sequences in species that were included in the study. Most hsp70 showed similar intron-exon boundary patterns, suggesting that these genes were highly conserved in fish. However, hspa8a (17) had double the number of exons in the flounder compared to other fish (8), and hspa4l from all the other species had about 19 exons, whereas the flounder had 23 exons. Interestingly, we found signatures of positive selection in hspa4l, further indicating the evolutionary difference of hspa4l between flounder and the other species.
New favorable genetic variants sweep population, which is known as positive seletion. (Wagner, 2007; Darwin, 1912). Genes involved in metabolism, stress response and reproduction tend to be under positive selection (Oliver et al., 2010; Koester, Swanson & Armbrust, 2013). Among the 15 hsp70 identified in Japanese flounder, we found signatures of positive selection in four genes, hspa4l, hspa9, hspa13, and hyou1, using the branch site model in PAML. Genes under positive selection tended to express less than genes subject to neutral or purifying selection, which tended to be expressed in specific tissues or conditions (Hodgins et al., 2016). Purifying and neutral selection tended to affect variants that were deleterious for the organism, and positive selection tended to affect variants that provided an adaptive advantage to the animal (Rocha, 2006). Interestingly, hyou1 was not expressed at any of the developmental stages. These findings were consistent with previous studies that indicated that genes under positive selection had low expression levels.
The functions of hsp70 were determined by their cellular location, and intracellular hsp70 genes protected the cell from stress, while extracellular hsp70 genes were involved in the immune system (De Maio, 2014). For example, hsp70 could be the cross-presenters of immunogenic peptides in MHC antigens or stimulators that induced innate immune responses (Pockley, Muthana & Calderwood, 2008; Asea et al., 2000). Aeromonas hydrophila challenged with Labeorohita showed up-regulation of apg2, hsp90, grp78, grp75, and hsc70, however, hsp70 was down-regulated upon infection (Das, Mohapatra & Sahoo, 2015). Here, we used RNA-seq data of the Japanese flounder injected with E. tarda or Ringer’s solution, and we found similar expression patterns as shown in previously published studies (Li et al., 2018). However, hsc70 expression was decreased in Japanese flounder at 48 h after injection with E. tarda, which was opposite from the expression pattern of A. hydrophila, suggesting a species-specific expression pattern of this gene. Interestingly, some genes were up-regulated shortly after injection with Ringer’s solution, and returned to the baseline expression levels after 48 h. However, samples injected with E. tarda maintained differences in gene expression even at 48 h after injection. Such divergent expression pattern suggested that some hsp70 genes were involved in the response to E. tarda infection.
Recent studies demonstrated that heat shock proteins play an important role in the sperm–egg recognition and embryonic development (Li & Winuthayanon, 2017; Luft & Dix, 1999). In mouse, hsp70 is constitutively expressed from the two-cell to blastocyst stages (Hahnel et al., 1986). In this study, from the four-cell stage to the high blastula stage, five genes, including hspa4l, hspa4a, hspa9, hsc70, and hspa1b, were initially highly expressed, then expression ceased in later stages, besides these five genes also shows highly expression in the oocyte cell. A reasonable conclusion of such a similar expression pattern between the oocyte cell and the early stage of embryonic development is an initial, constitutive burst of hsp70 expression after boosting the zygotic genome from the four cell stage to the high blastula stage. From the low blastula stage, other genes, for example hspa8b, was expressed at a high level, then hspa13 and hspa8a, and hspa4b showed highly expresssion in chronological order. Overall, from the beginning of embryonic development to the sexual maturation stage, different hsp70 genes are highly expressed in various developmental stages. In addition, there is always one or more hsp70 genes expressed at high-level in the different embryonic development stages. This type of expression during embryonic development has proven that hsp70 genes were constitutive expression in embryonic development of the Japanese flounder.
Conclusions
HSP70 constitutes an important group of proteins that respond to stress. Hsp70 in the Japanese flounder are divided into eight clades, similar as in other species. Structure analysis of hsp70 showed that these genes were highly conserved among different species. Four genes were found under positive selection. Genes hspa9, hspa12b, hspa4l, hspa13, and hyou1 were highly expressed in flounders challenged with E. tarda, suggesting that these hsp70 genes were induced to protect cells from stress. Expression analysis during the developmental stages indicated that hsp70 genes were involved in embryonic development of the Japanese flounder in a temporal manner. In conclusion, hsp70 genes play important roles in both the immune response and embryonic development of the Japanese flounder.
Supplemental Information
The transcriptome of Paralichthys olivaceus during the developmental stage
Summary of statistics for detecting selection criteria using the Branch site model
NP, number of estimated parameters. LnL, log likelihood score. LRT P < 0.5 indicates the positive selection gene. Positively selective site > 0.95 indicates positive selection site (significance level: *, 0.05; **, 0.01).
Summary of statistics for detecting selection using Branch site model
Intron-exon structure of hsp70 genes in studied fish including medaka, platyfish, stickleback, tetraodon, tilapia, and zebrafish
Orange rectangles represent exons and black lines indicate introns, black polylines indicate introns, orange, and the black line indicates the scale.