
Mitochondrial unfolded protein response gene CLPP changes mitochondrial dynamics and affects mitochondrial function
- Published
- Accepted
- Received
- Academic Editor
- Carla Fiorentini
- Subject Areas
- Molecular Biology, Internal Medicine
- Keywords
- Caseinolytic peptidase P, Mitochondrial unfolded protein response, Mitochondrial dynamics, Fusion, Fission
- Copyright
- © 2019 Wu et al.
- Licence
- This is an open access article distributed under the terms of the Creative Commons Attribution License, which permits unrestricted use, distribution, reproduction and adaptation in any medium and for any purpose provided that it is properly attributed. For attribution, the original author(s), title, publication source (PeerJ) and either DOI or URL of the article must be cited.
- Cite this article
- 2019. Mitochondrial unfolded protein response gene CLPP changes mitochondrial dynamics and affects mitochondrial function. PeerJ 7:e7209 https://doi.org/10.7717/peerj.7209
Abstract
Mitochondrial dynamics is associated with mitochondrial function, which is associated with diabetes. Although an important indicator of the mitochondrial unfolded protein response, to the best of our knowledge, CLPP and its effects on mitochondrial dynamics in islet cells have not been studied to date. We analyzed the effects of CLPP on mitochondrial dynamics and mitochondrial function in the mice islet β-cell line Min6 under high glucose and high fat conditions. Min6 cells were assigned to: Normal, HG, HG+NC, HG+siCLPP, HF, HF+NC and HF+ siCLPP groups. High glucose and high fat can promote the mRNA and protein expression of CLPP in mitochondria. The increase of mitochondrial fission, the decrese of mitochondrial fusion, and the damage of mintocondrial ultrastructure were significant in the siCLPP cell groups as compared to no-siCLPP treated groups. Meanwhile, mitochondrial functions of MIN6 cells treated with siCLPP were impaired, such as ATP decreased, ROS increased, mitochondrial membrane potential decreased. In addition, cell insulin secretion decreased and cell apoptosis rate increased in siCLPP groups. These results revealed that mitochondrial unfolded protein response geneCLPP alleviated high glucose and high fat-induced mitochondrial dynamics imbalance and mitochondrial dysfunction.
Introduction
Type 2 diabetes mellitus (T2DM) is a growing, worldwide epidemic characterized as abnormal insulin secretion by pancreatic β-cells and peripheral insulin resistance, resulting in high blood glucose. As mitochondria is involved in multiaspect cellular roles (production of energy and regulation of several signaling cascades including the redox state, calcium signaling, substrate metabolism, cell survival, and apoptotic pathways) (Alston et al., 2017; Finkel, 2012; Quiros, Mottis & Auwerx, 2016; Rizzuto et al., 2012; Wang & Youle, 2009), mitochondrial dysfunction is intimately linked to the pathogenesis of pancreatic β-cell damage in T2DM. Accumulating data indicate that mitochondrial dynamic is essential to mitochondrial function. Mitochondria constitutes a dynamic network that undergoes frequent mitochondrial fusion and fission for regulating and maintaining mitochondrial shape, structure, quantity, and function (Mishra & Chan, 2016). Therefore, mitochondria is not a static organelle. Mitochondria exists in a state of dynamic balance between fusion and fission in physiological conditions, and this homeostasis can be changed when the supply and demand of energy is changed, leading to mitochondrial dysfunction and even mitophagy (Green & Kroemer, 2004). Several dynamin-related GTPases constitute the main steps of mitochondrial fusion-fission process. Proteins responsible for fusion are mitofusin-1 (MFN1), mitofusin-2 (MFN2), and optic atrophy (OPA1). Proteins responsible for fission are dynamin-related protein 1 (DRP1) and mitochondrial fission 1 (FIS1) (Chan, 2012; Chen et al., 2003; Cipolat et al., 2004; Ishihara et al., 2006; Mishra & Chan, 2016; Song et al., 2007). Knockout out of OPA1 results in fragmentation of the mitochondrial endoplasmic reticulum, suggesting that the disruption of the mitochondrial organelle can affect mitochondrial morphology (Griparic, Kanazawa & Van der Bliek, 2007; Kushnareva et al., 2013). Similarly, cell lacking MFN1 and MFN2 also showed mitochondrial fragmentation. In MFN2 deficiency, the fusion organelle formed by MFN1 and OPA1 is still available. This suggests that MFN1 and OPA1 are essential for the mitochondrial fusion, while MFN2 is dispensable (Cipolat et al., 2004; Zanna et al., 2008). The regulation of mitochondrial fusion and fission is a complex process involving different proteins that alter expression in response to stress and signals.
Caseinolytic peptidase P (CLPP) is a member of the CLP family (caseinolytic protease, HSP100). It is a highly conserved ATP-dependent protease and is widely distributed from prokaryotic cells to eukaryotic organelles (Baker & Sauer, 2012; Yu & Houry, 2007). CLPP has been extensively studied in prokaryotes, whereas the role of CLPP in mammalian mitochondrial is far less known (Corydon et al., 1998; Rath et al., 2012). CLPP is found to participate in the progress of mitochondrial unfolding protein response (mtUPR) (Al-Furoukh et al., 2015; Voos et al., 2016). In the human embryonic kidney cell line, HEK293T, and mice myoblasts, C2C12, the overexpression of CLPP is correlated with the expression of genes involved in the mtUPR (Al-Furoukh et al., 2015). However, there has been recent research that questions this role of CLPP (Seiferling et al., 2016). Unfolded or misfolded proteins accumulate in the mitochondrial matrix in response to environmental insults (Powers & Balch, 2013; Rath et al., 2012). The mtUPR can hydrolyze protein and reduce the amount of unfolded proteins in the mitochondria to maintain proteostasis and mitochondrial function (Mouchiroud et al., 2013; Quiros, Langer & Lopez-Otin, 2015).
At present, the relationship between CLPP and mitochondrial dynamics under high glucose and high fat conditions in islet endocrine cells has not been reported. In this study, we aimed to uncover the role of CLPP in mitochondrial dynamics and mitochondrial function in the presence of high glucose and high fat.
Materials and Methods
Cell culturezz
Pancreatic Min6 beta cells were purchased from the Cell Bank of the Chinese Academy of Sciences. Min6 cells were routinely cultured in RPMI-1640 (SH30809.01; GE Healthcare, Salt Lake City, UH, USA) supplemented with 20% fetal bovine serum (FBS), 1% glutamine, 1% β-mercaptoethanol, and 10 mM HEPES. Cells were cultured in a 37 °C with 5% CO2 incubator. The medium was refreshed every 24 h. Palmitic acid (P0500, PA; Sigma-Aldrich, Carlsbad, CA, USA) was conjugated with fatty-acid-free bovine serum albumin (BSA) (A8020; Solarbio, Beijing, China) before addition to cell culture. PA was dissolved in 99% ethanol and then mixed with 10% BSA in serum-free DMEM (SH30022.01; GE Healthcare, Salt Lake City, UT, USA) to make a 50 mM PA stock solution. Different concentrations of glucose and palmitic acid were prepared in RPMI-1640 medium. The osmotic pressure was adjusted with D-mannitol (0122; Amresco, Seattle, Washington, USA). Min6 cells were treated with glucose (5.6,16.7 , and 33.3 mmol/l) and palmitic acid (0.2, 0.5, and 1.0 mmol/l) for 24 h, 36 h, and 48 h.
Cell grouping
Part 1: before cell transfection, Min6 Cells were assigned to the normal group (routine culture), the groups with different concentrations of glucose (5.6 mmol/l, 16.7 mmol/l and 33.3 mmol/l) and the groups with different concentrations of palmitic acid (0.2 mmol/l, 0.5 mmol/l and 1.0 mmol/l). Part 2: after cell transfection, Min6 Cells were assigned to the normal group (routine culture), the HG group (treated with 33.3 mmol/l glucose), the HG + NC group (transfected with the CLPP negative sequence and then treated with 33.3 mmol/l glucose), the HG + siCLPP group (transfected with CLPP inhibitor sequence and then treated with 33.3 mmol/l glucose ), the HF group (treated with 0.5 mmol/l fat), the HF +NC group (transfected with the CLPP negative sequence and then treated with 0.5 mmol/l fat), and the HF + siCLPP group (transfected with the CLPP inhibitor sequence and then treated with 0.5 mmol/l fat).
Real-time quantitative PCR (qPCR)
Total RNA was extracted by using the RNAprep Pure Cell/Bacteria Kit (Code No. DP430, Qiagen, Beijing, China). 2 µg RNA was reversed transcribed into cDNA by using the PrimeScript™ RT Reagent Kit (Perfect Real Time) (Code No. RR037A; TaKaRa, Dalian, China). qPCR was performed using TB Green™ Premix Ex Taq™ II (Tli RNaseH Plus) (Code No. RR820A; TaKaRa, Dalian, China). qPCR was carried out as follows: initial denaturation at 95 °C for 30 s; 40 thermal cycles at 95 °C for 5 s; and 60 °C for 30 s. A CFX96™ real-time system (Bio-Rad, Hercules, CA, USA) was used for qRT-PCR analysis. β-actin was used as an internal control. Each group was detected in triplicate, and data were calculated according to the 2−ΔΔCt method and normalized to the control. The primer sequences of genes were shown in Table 1.
| GenBank accession number | Primer | Sequence | Length (bp) |
|---|---|---|---|
| NM_017393 | Clpp (F) | 5′-GCCTTGCCGTGCATTTCTC-3′ | 113 |
| Clpp (R) | 5′-CTCCACCACTATGGGGATGA-3′ | ||
| NM_024200 | Mfn1 (F) | 5′-CCTACTGCTCCTTCTAACCCA-3′ | 86 |
| Mfn1 (R) | 5′-AGGGACGCCAATCCTGTGA-3′ | ||
| NM_133201 | Mfn2 (F) | 5′-AGAACTGGACCCGGTTACCA-3′ | 82 |
| Mfn2 (R) | 5′-CACTTCGCTGATACCCCTGA-3′ | ||
| NM_001199177 | Opa1 (F) | 5′-TGGAAAATGGTTCGAGAGTCAG-3′ | 77 |
| Opa1 (R) | 5′-CATTCCGTCTCTAGGTTAAAGCG-3′ | ||
| NM_001025947 | Drp1 (F) | 5′-TTACGGTTCCCTAAACTTCACG-3′ | 74 |
| Drp1 (R) | 5′-GTCACGGGCAACCTTTTACGA-3′ | ||
| NM_025562 | Fis1 (F) | 5′-AGAGCACGCAATTTGAATATGCC-3′ | 125 |
| Fis1 (R) | 5′-ATAGTCCCGCTGTTCCTCTTT-3′ | ||
| NM_026880 | Pink1 (F) | 5′-TTCTTCCGCCAGTCGGTAG-3′ | 141 |
| Pink1 (R) | 5′-CTGCTTCTCCTCGATCAGCC-3′ | ||
| NM_016694 | Parkin (F) | 5′-TCTTCCAGTGTAACCACCGTC-3′ | 115 |
| Parkin (R) | 5′-GGCAGGGAGTAGCCAAGTT-3′ | ||
| NM_007393 | Actin (F) | 5′-GGCTGTATTCCCCTCCATCG-3′ | 154 |
| Actin (R) | 5′-CCAGTTGGTAACAATGCCATGT-3′ |
Western blotting
Protein was extracted by using RIPA (G2002; Servicebio, Wuhan, China) with 1 mmol/l phenylmethanesulfonyl fluoride (PMSF) (ST505; Beyotime Biotechnology, Shanghai, China) at 4 °C for 30 min and centrifuged at 12,000 rpm for 10 min. The extracted protein was boiled for 15 min. The protein concentration was detected by using an enhanced BCA protein assay kit (Code No. P0010; Beyotime Biotechnology, Shanghai, China). 40 µg protein was separated by 10% sodium dodecyl sulfate polyacrylamide gel electrophoresis (SDS-PAGE) and transferred to polyvinylidene fluoride (PVDF) membranes (IPVH00010, Millipore, USA). The membrane was incubated with 5% defatted milk at 4 °C overnight, and incubated with primary antibodies against CLPP (66271-1-Ig, 1:1000; Proteintech, USA), MFN1 (ab234861, 1:1000; Abcam, USA), MFN2 (CB1020, 1:500; Sigma, Kanagawa, Japan), OPA1 (27733-1-AP, 1:500; Proteintech, USA), DRP1 (12957-1-AP, 1:500, Proteintech, Chicago, IL, USA), FIS1 (ab71498, 1:1000, Abcam, Burlingame, CA, USA) or β-actin (GB12001, 1:3000; Servicebio, Wuhan, China) for 2 h, and then incubated with secondary antibody respectively (GB23303, 1:3000; Servicebio, Wuhan, China) at room temperature for 30 min. The blots were detected using Bio-Rad Molecular Imager ChemiDoc XRS+ (USA).
Cell transfection
The siRNA duplexes used in this study were purchased from Invitrogen (NY, USA) and had the following sequence: 5′-CAGGUGAUCGAGUCAGCAAUGUUGCUGACUCGAUCACCUGUA-3′. Negative Control (Invitrogen, NY, USA) was used as the control. Min6 cells were seeded on 6-well plates. When the cell density reached 70–80%, cells were transfected using Lipofectamine 2000 kit (11668019; Invitrogen, Carlsbad, CA, USA). After 48 h, the culture medium was replaced by complete culture medium to stop transfection. Cells were harvested for the next experiment.
ATP assays
Intracellular ATP content was measured using an enhanced ATP assay kit (Code No. S0026; Beyotime Biotechnology, Shanghai, China) according to the manufacturer’s instructions. In briefly, cells were lysed using ATP lysate buffer and then centrifuged at 12,000× g for 10 min at 4 °C. The supernatant was removed and mixed with dilution buffer containing luciferase. The relative light units were measured by a microplate luminometer according to the manufacturer’s instructions. A fresh standard curve was prepared each time and ATP content was calculated using the curve.
Insulin secretion assay
Secreted insulin was measured using the Mouse Insulin (INS) ELISA Kit (Code No. CSB-E05071 m; Cusabio, Wuhan, China). The Assay Layout Sheet was used as a reference to determine the number of wells to be used. 100 µl of standard or sample per well was then added. After incubation for 2 h at 37 °C, the liquid was removed from each well. 100 µl of Biotin-antibody (1 ×) was added to each well, followed by incubation for 1 h at 37 °C. Each well was aspirated and washed for three times. Then, 100 µl of HRP-avidin (1 ×) was added and incubated for 1 h at 37 °C. 90 µl of TMB substrate was then added and incubation for a further 15–30 min at 37 ° C. 50 µl of stop solution was added to each well. Optical density was determined within 5 min using a microplate reader set to 450 nm.
Measurement of reactive oxygen species (ROS) generation
Cellular ROS contents were measured using the Reactive Oxygen Species Assay Kit (S0033; Beyotime Biotechnology, Shanghai, China) by flow cytometry (Beckman, Brea, CA, USA).Briefly, cell suspensions were transferred into centrifugal tubes with 1,500 rpm centrifugation for 5 min to collect cells. Cells were re-suspended with PBS (pre-cooled at 4 °C) and centrifuged at 1,500 rpm for 5 min. The number of cells was adjusted to 1 ×10⁶–2 ×10⁸ /ml. The probe DCFH-DA (10 µmol/l) was incubated with cell at 37 °C for 20 min to make full contaction. The cells were washed with serum-free medium for three times with to remove the probes that did not enter the cells. Flow cytometry was used to detect the ROS levels with an excitation wavelength of 488 nm and emission wavelength of 525 ± 20 nm. FlowJo software was used to analyze the ROS levels of cells.
Mitochondrial membrane potential measurement
We detected the mitochondrial membrane potential (ΔΨ) with a fluorescent probe, JC-1 (5,5′,6,6′-tetrachloro-1,1′,3,3′-tetraethyl benzimidazolo-carbocyanine iodide). 1 ml JC-1 staining solution (mitochondrial membrane potential assay kit with JC-1; C2006, Beyotime, Shanghai, China) was added to the cell and. incubated for 20 min at 37 °C. Cells were washed twice with JC-1 staining buffer (1X). When JC-1 monomer was detected, the excitation wavelength was set to 490 nm and the emission wavelength was set to 530 nm. When JC-1 polymer was detected, the excitation wavelength was set to 525 nm and the emission wavelength was set to 590 nm. JC-1 was aggregated in the mitochondrial matrix to form a polymer, which produced red fluorescence. JC-1 could not be aggregated in mitochondrial matrix to form a monomer, which produced green fluorescence. The appearance of red fluorescence indicated that mitochondrial membrane potential was normal and the mitochondrial state was normal. Green fluorescence showed that mitochondrial membrane potential was decreased and the mitochondrial state was abnormal. The results were observed under a fluorescence microscope. The ratio of red/green fluorescent densities was calculated with the Image Pro Plus 6.0 software.
Mito-Tracker Red CMXRos Staining
Cells were stained with Mito-Tracker Red CMXRos dye (C1049; Beyotime, Shanghai, China) and DAPI (4′, 6-diamidino-2-phenylindole) (C1002; Beyotime, Shanghai, China). In briefly, when the cell density reached 70–80% in the cell culture plate, the cell culture medium was removed. Mito-Tracker Red CMXRos was added and the cells were incubated for 30 min at 37 °C. Then, Mito-Tracker Red CMXRos was removed and fresh cell culture medium was added. After dyeing, 4% polyformaldehyde (P0099) was added to fix cells at room temperature for 30 min. After fixing, cells were washed 3 times with Hank’s Balanced Salt Solution. The cells were incubated for 5 min at room temperature in DAPI labeling solution. The cells were washed three times in PBS. Nikon fluorescence microscopy (Tokyo, Japan) was used for observation. Integral optical density (IOD) was used for quantitative analysis of red light intensity. Image Pro Plus 6.0 software was used to analyze IOD values.
Flow cytometry detection of cell apoptosis
Cells apoptosis were analyzed using the Annexin V-FITC Apoptosis Detection Kit; C1062S; Beyotime Biotechnology, Shanghai, China by a Beckman CytoFLEX FCM Flow Cytometer (Brea, CA, USA). The green fluorescence of Annexin V-FITC was detected using the FITC channel (FL1), and the red fluorescence of PI was detected using the PI channel (FL2). The parameters of flow cytometry were as follows: excitation wavelength Ex = 488 nm, emission wavelength FL1 (Em = 525 ± 20 nm) and FL2 (Em = 585 ± 21 nm). FlowJo software was used to analyze the proportion and number of different cell states (mainly early apoptosis, late apoptosis, and death).
Transmission electron microscopy (TEM)
TEM was used to observe mitochondria ultra-structural of cells. Cells were fixed with 2.5% glutaraldehyde in a 0.1 M sodium phosphate buffer (pH 7.4, 4 °C, 2 h), post fixed in 2% osmium tetroxide in a 0.1 M phosphate buffer (4 °C, 1.5 h) and dehydrated in a graded series of concentrations of ethanol (30%, 50%, 70%, 90%, 96%, and 4 × 100%, each for 15 min), acetone (2 × 15 min) and embedded in epoxy resin (Epoxy Embedding Medium Kit; Sigma, Carlsbad, CA, USA). Ultra-thin sections (70 nm) were cut on a Leica Ultracut UCT25 ultramicrotome (German). After staining with uranyl acetate and lead citrate (each for 20 min), sections were examined using a TEM (FEI Tecnai G2 20 TWIN; Bionand). The area of mitochondria and the total cell were circled and calculated by AOI tool of Image Pro Plus 6.0 software.
Statistical analysis
Data were expressed as the mean and standard deviation. Student t-tests or one-way analysis of variance (SPSS 18.0) were used to analyze. P < 0.05 was considered to be significant.
Results
High glucose and high fat increased the expression of CLPP in Min6 cells
Different concentrations of glucose and palmitic acid for different durations of treatment were adopted to detect the expression of CLPP in Min6 cells. After 24 h, 36 h and 48 h of treatment, in groups with different concentrations of glucose (5.6 mmol/l, 16.7 mmol/l and 33.3 mmol/l) and different concentrations of palmitic acid (0.2 mmol/l, 0.5 mmol/l and 1.0 mmol/l), the highest expression of CLPP was found in the groups with 33.3 mmol/l glucose or 0.5 mmol/l palmitic acid for 48 h compared with the normal group (p < 0.01) (Fig. 1A) (Raw data is available as Dataset 1). There were time-dependent and dose-dependent effects of glucose and fat on the expression of CLPP, but not in the 1 mmol/l palmitic acid group. CLPP expression was significantly increased at 48 h in the groups with high glucose and high fat compared with the normal group; this was evidenced by a 3.15-fold increase in the HG group and a 4.39-fold increase in the HF group (p < 0.01) (Fig. 1B) (Raw data is available as Dataset 2). Mannitol was used as a control to prove that osmotic pressure had no effect on the experiment. The results showed that high glucose and high fat could increase the expression of CLPP.
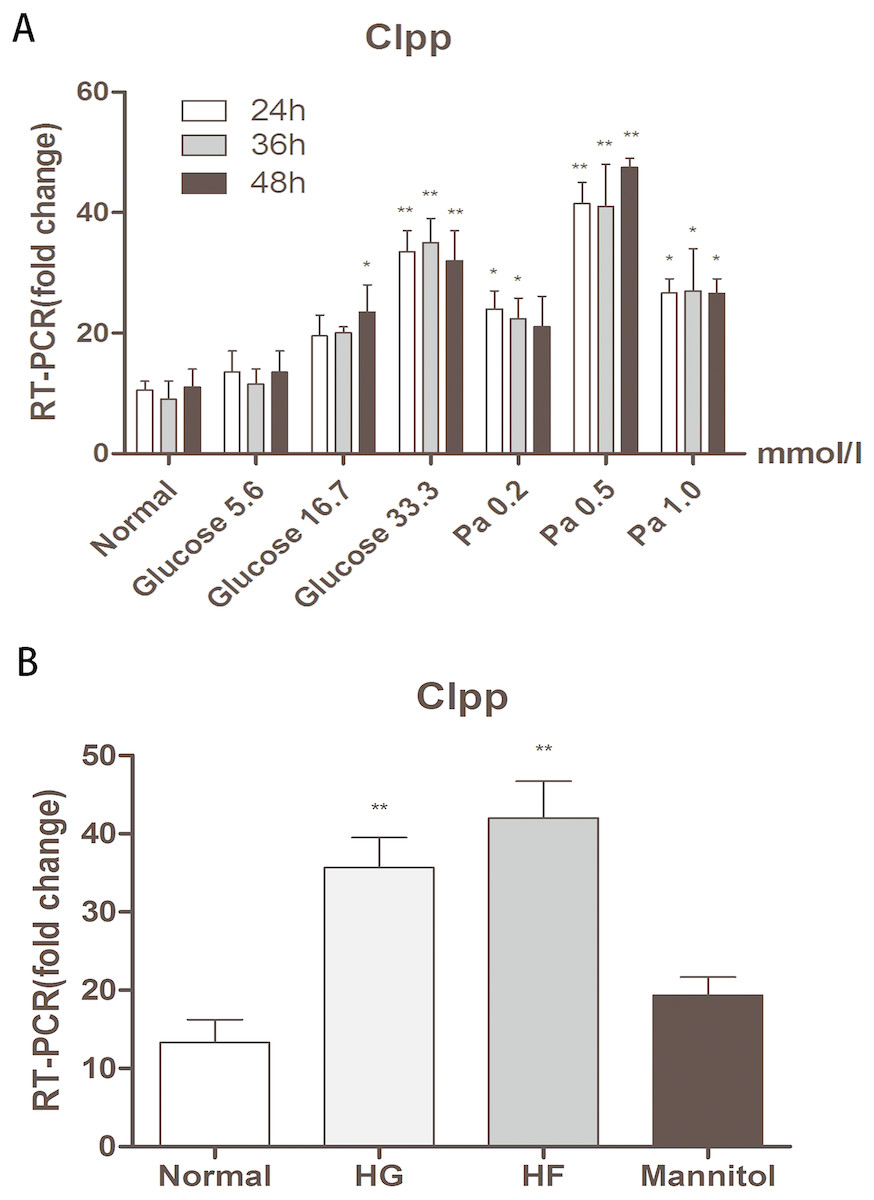
Figure 1: Effects of glucose and fat on the expression of CLPP.
(A) RT-PCR detection of CLPP expression at 24 h, 36 h, 48 h after different concentrations of glucose and palmitic acid. (B) RT-PCR results of high glucose (33.3 mmol/l) and high fat (0.5 mmol/l) treatment for 48 h. *p < 0.05, **p < 0.01 versus normal.
High glucose and high fat inhibited mitochondrial fusion and promoted mitochondrial fission in Min6 cells
The expression of related proteins in mitochondrial fusion and fission after high glucose and high palmitic acid treatment was detected. MFN1 mRNA levels were expressed at lower levels in Min6 cells relative to the normal group in the HG and HF groups (reduced to 47% and 36%, respectively) (p < 0.05) (Fig. 2A) (raw data is available as Dataset 3). In addition, western blot assays showed MFN1 protein levels to be significantly downregulated in the high glucose and high palmitic acid groups (reduced to 49% and 35%, respectively) (p < 0.05) (Figs. 2B, 2C) (raw data is available as Dataset 4). Cells in high glucose and high palmitic acid had significantly higher DRP1 expression than those in the normal groups (the mRNA of DRP1 was upregulated to 4.23-fold in the HG group and 5.06-fold in the HF group, Fig. 2A; the protein of DRP1 was upregulated to 3.18-fold in the HG group and 3.95-fold in the HF group, Figs. 2B, 2F) (Raw data is available as Dataset 3 and Dataset 4) (p < 0.01). No significant changes in MFN2, OPA1 and FIS1, whether mRNA levels or protein levels, were seen in cells with high glucose or high palmitic acid treatment (Figs. 2A, 2B, 2D, 2E, 2G) (raw data is available as Dataset 3 and Dataset 4). The results showed that high glucose and high fat inhibited mitochondrial fusion and promoted mitochondrial fission.
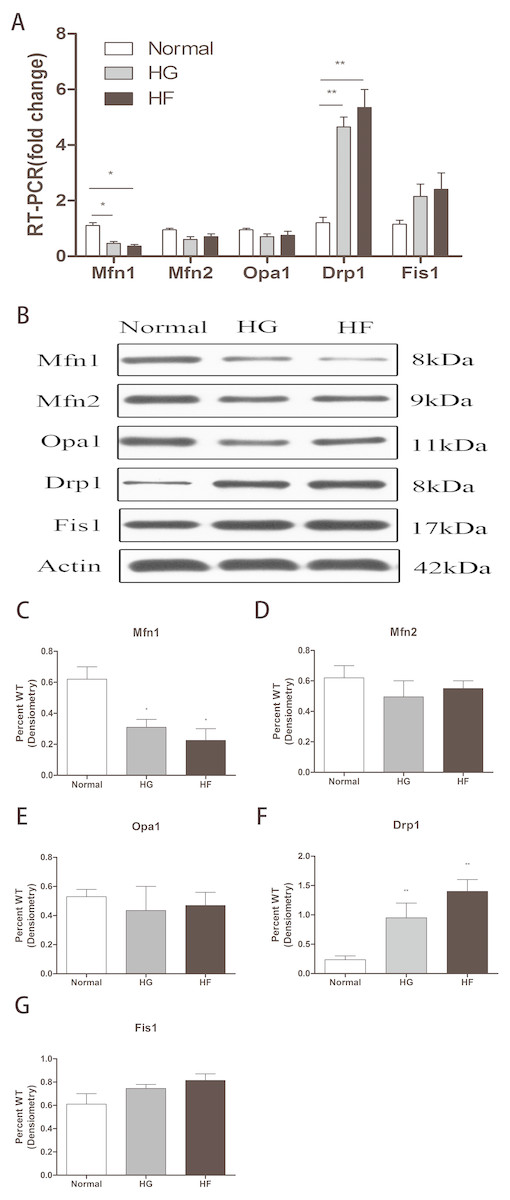
Figure 2: Effects of high glucose and high fat on mitochondrial dynamics-related proteins.
(A) RT-qPCR showed the expression levels of mitochondrial dynamics-related proteins. (B) Western blot showed the protein levels of mitochondrial dynamics. (C–G) Statistical analysis of the expression of mitochondrial dynamics-related proteins detected by western blot in cells as described in B. *p < 0.05, **p < 0.01 versus normal.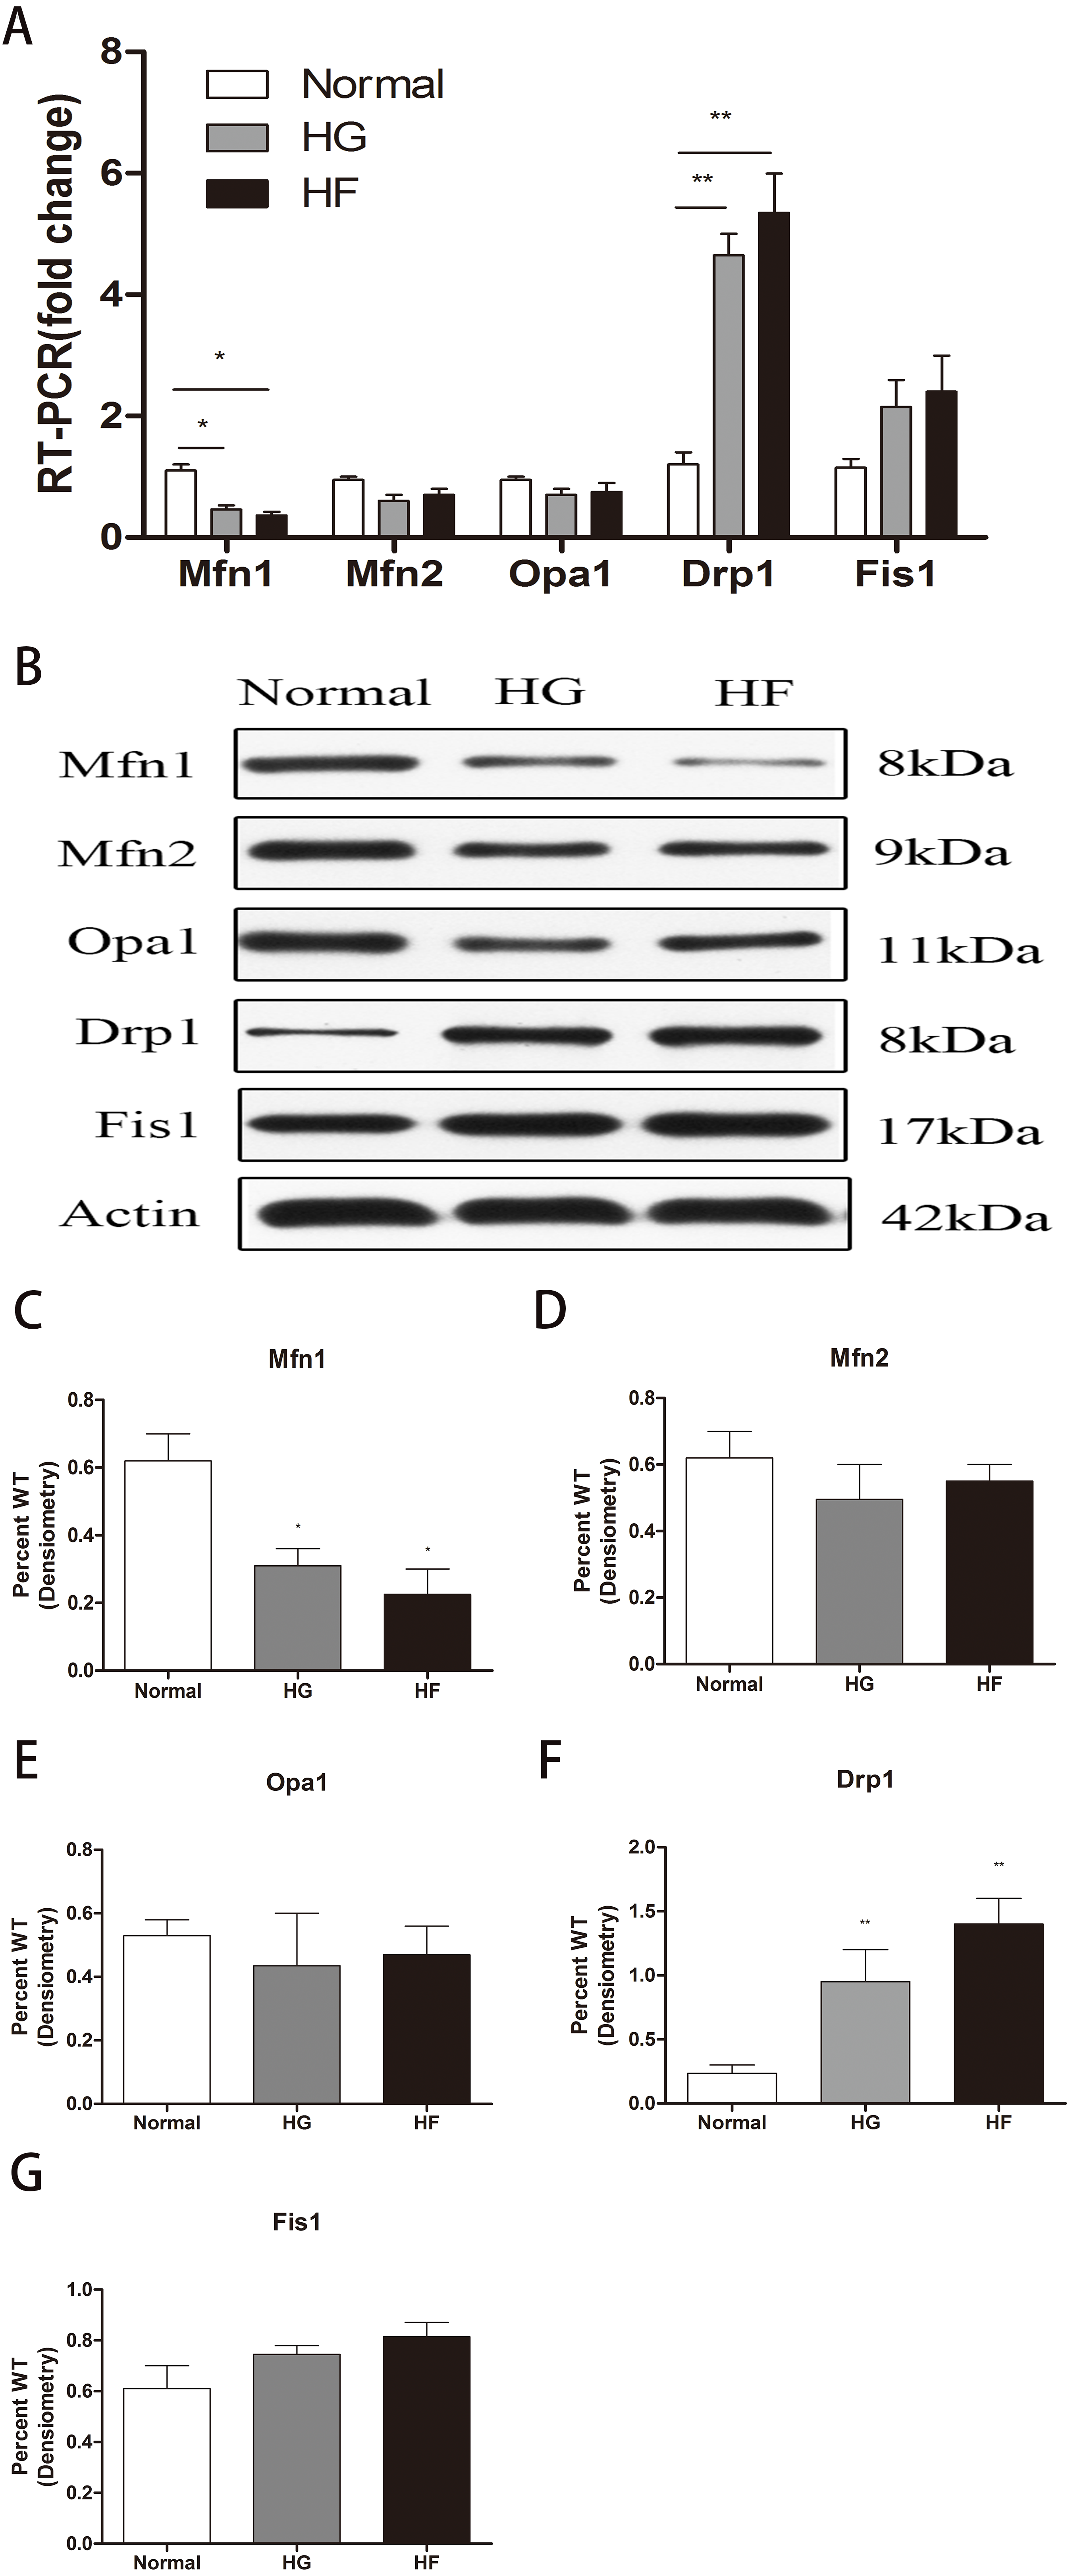
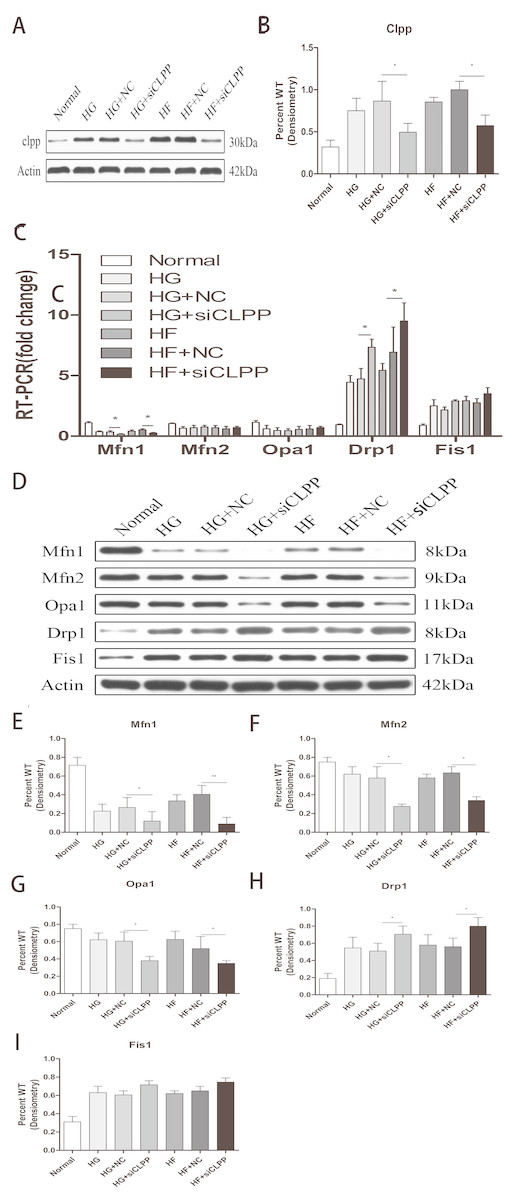
Figure 3: Effect of CLPP siRNA on expression of mitochondrial dynamics-related proteins.
(A) Western blot showed CLPP siRNA reduced the expression of CLPP protein. (B) Statistical analysis of the expression of mitochondrial dynamics-related proteins detected by western blot in cells as described in A. RT-qPCR (C) and western blot (D) were used to detect mitochondrial dynamics-related protein expression after CLPP siRNA treatment. (E–I) Statistical analysis of the expression of mitochondrial dynamics-related proteins detected by western blot in cells as described in D. *p < 0.05, **p < 0.01.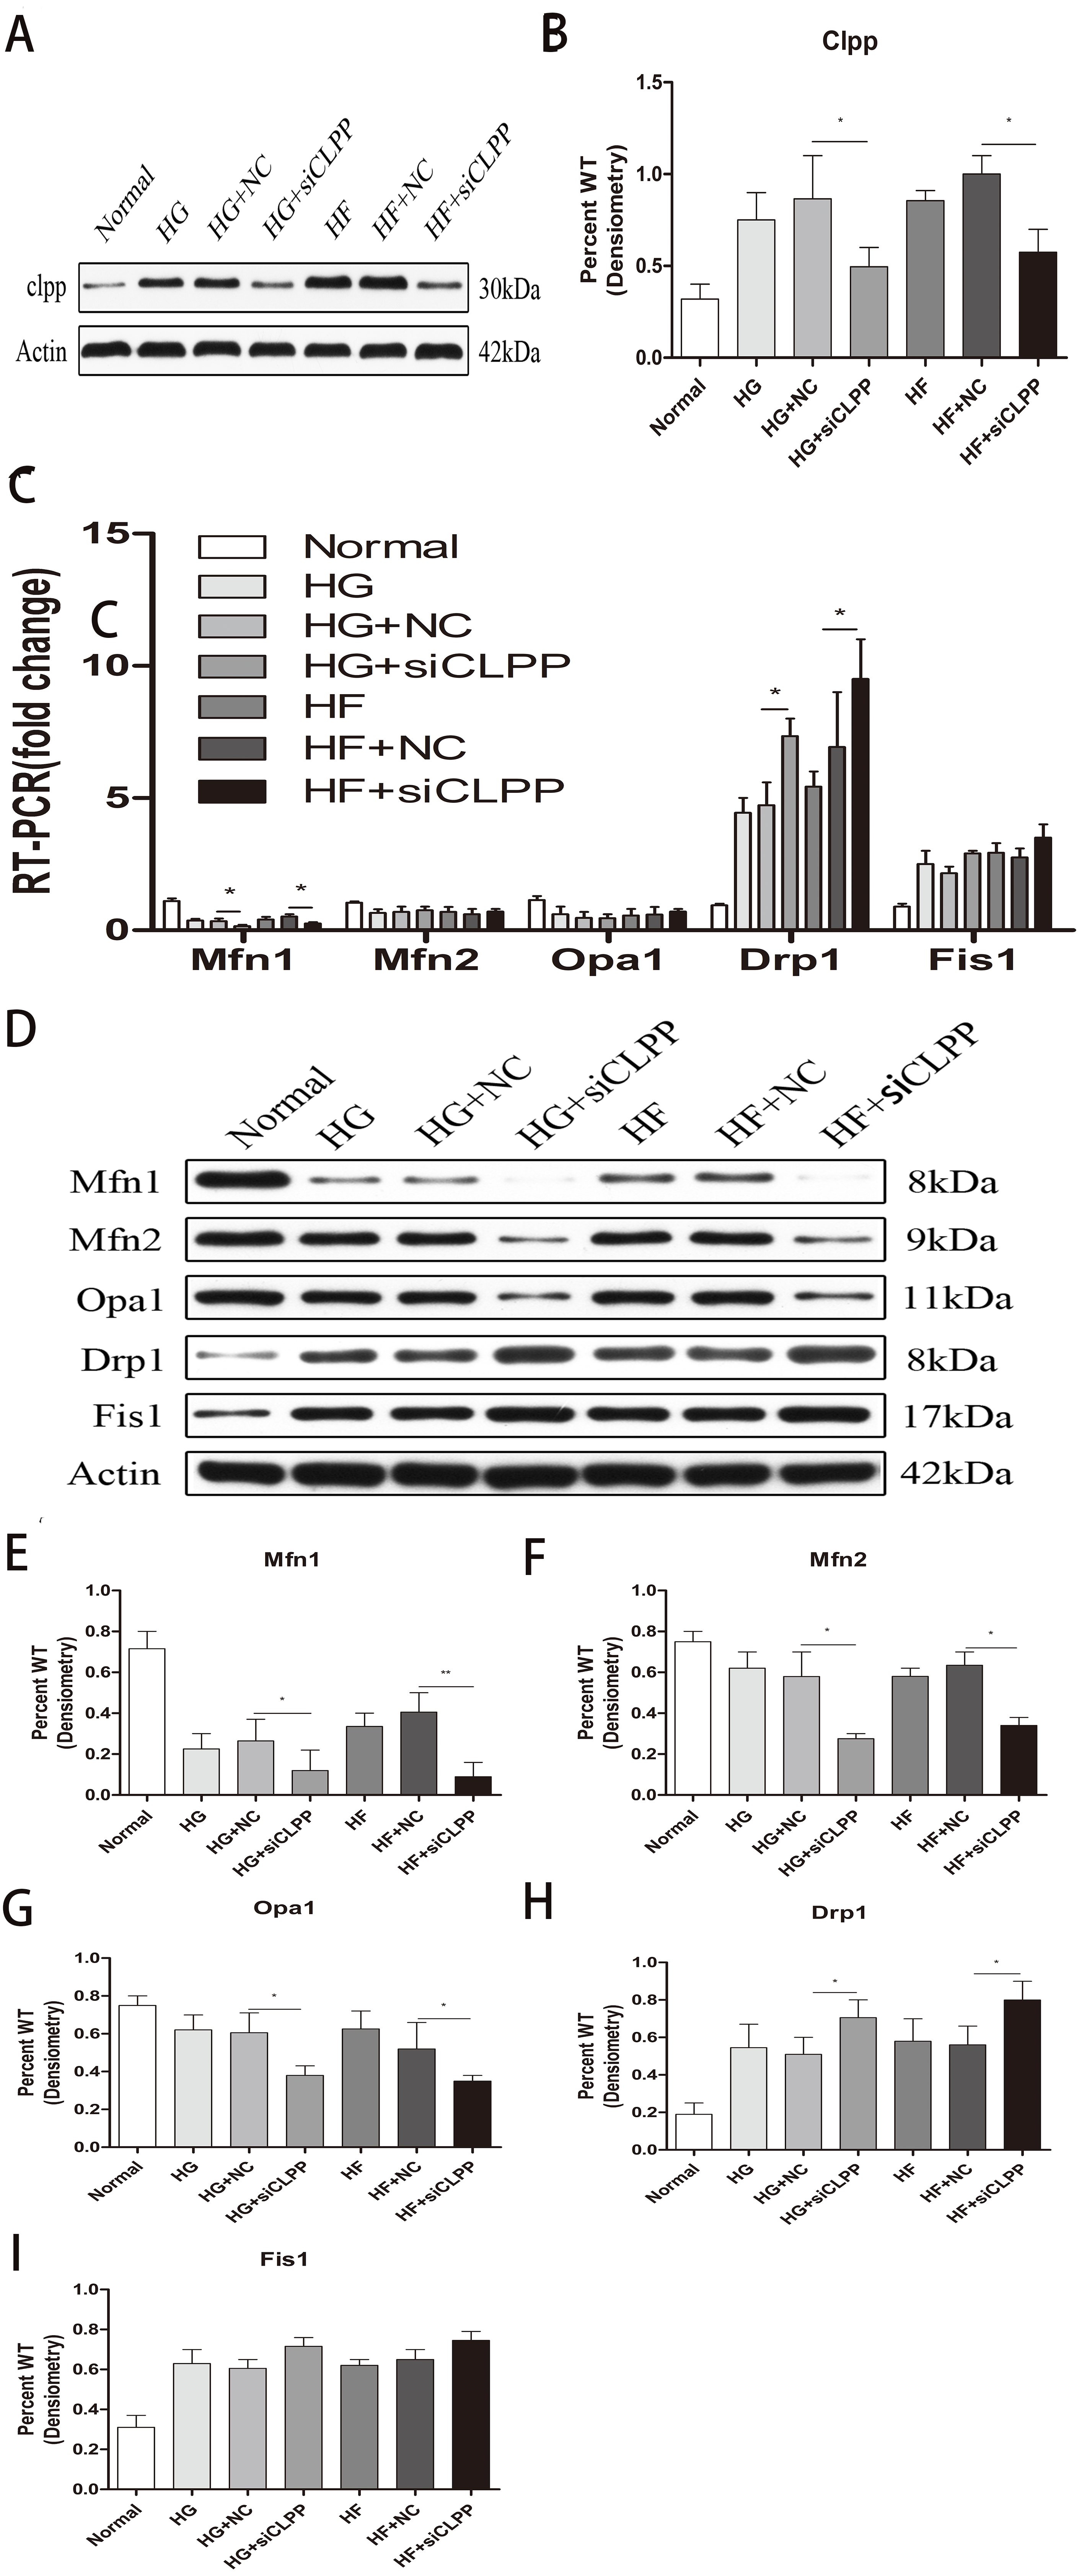
CLPP can alleviate the increase of fission and the decrease of fusion induced by high glucose and high fat
CLPP siRNA reduced the expression of CLPP protein (HG+siCLPP and HF+siCLPP groups compared with HG+NC and HF+NC groups showed a decrease of 38% and 50%, respectively) (p < 0.05) (Figs. 3A, 3B) (raw data is available as Dataset 6). As shown by qRT-PCR analysis, CLPP siRNA suppressed expression of MFN1 (HG+siCLPP and HF+siCLPP groups compared with HG+NC and HF+NC groups showed a decrease of 52% and 37%, respectively), and enhanced expression of DRP1 (HG+siCLPP and HF+siCLPP groups compared with HG+NC and HF+NC groups showed an increase of 68% and 35%, respectively) (p < 0.05) (Fig. 3C) (raw data is available as Dataset 5. No significant changes in MFN2, OPA1 and FIS1 were seen (Fig. 3C) (raw data is available as Dataset 5. As shown by western blotting analysis, MFN1 protein levels were decreased by 54% (HG+siCLPP) and 77% (HF+siCLPP), MFN2 protein levels were decreased by 53% (HG+siCLPP) and 41% (HF+siCLPP), OPA1 protein levels were decreased by 37% (HG+siCLPP) and 32% (HF+siCLPP), and DRP1 protein levels were increased by 38% (HG+siCLPP) and 43% (HF+siCLPP) (p < 0.05) (Figs. 3D, 3E, 3F, 3G, 3H) (raw data is available as Dataset 7). No significant change in FIS1 protein levels was seen (Fig. 3I). As the results showed, CLPP siRNA significantly upregulated expression of proteins in mitochondrial fission and downregulated expression of proteins in mitochondrial fusion in the gene-transfected Min6 cells. This implied that the CLPP pathway can alleviate the increase of mitochondrial fission and the decrease of mitochondrial fusion induced by high glucose and high fat. The CLPP pathway played a role in maintaining the dynamic stability of mitochondrial fusion and fission.
Expression of PINK1 and PARKIN was highly upregulated in the gene-transfected Min6 cells
To verify the effects of CLPP on mitophagy, we used qRT-PCR and western blot analysis to confirm the alteration in expression of PINK1 and PARKIN in the gene-transfected Min6 cells. In the HG+siCLPP and HF+siCLPP groups, the mRNA of PINK1 was upregulated to 1.65-fold and 2.01-fold, respectively, and that of PARKIN was upregulated to 1.78-fold and 1.99-fold, respectively (p < 0.05) (Fig. 4A) (Raw data is available as Dataset 8). In the HG+siCLPP and HF+siCLPP groups, PINK1 protein was upregulated to 1.47-fold and 1.73-fold, respectively, and PARKIN protein was upregulated to 1.58-fold and 1.86-fold, respectively (p < 0.05) (Figs. 4B, 4C, 4D) (Raw data is available as Dataset 7). Our results suggested that CLPP siRNA may significantly increase the expression of PINK1 and PARKIN. The CLPP pathway may alleviate the increase of autophagy induced by high glucose and high fat.
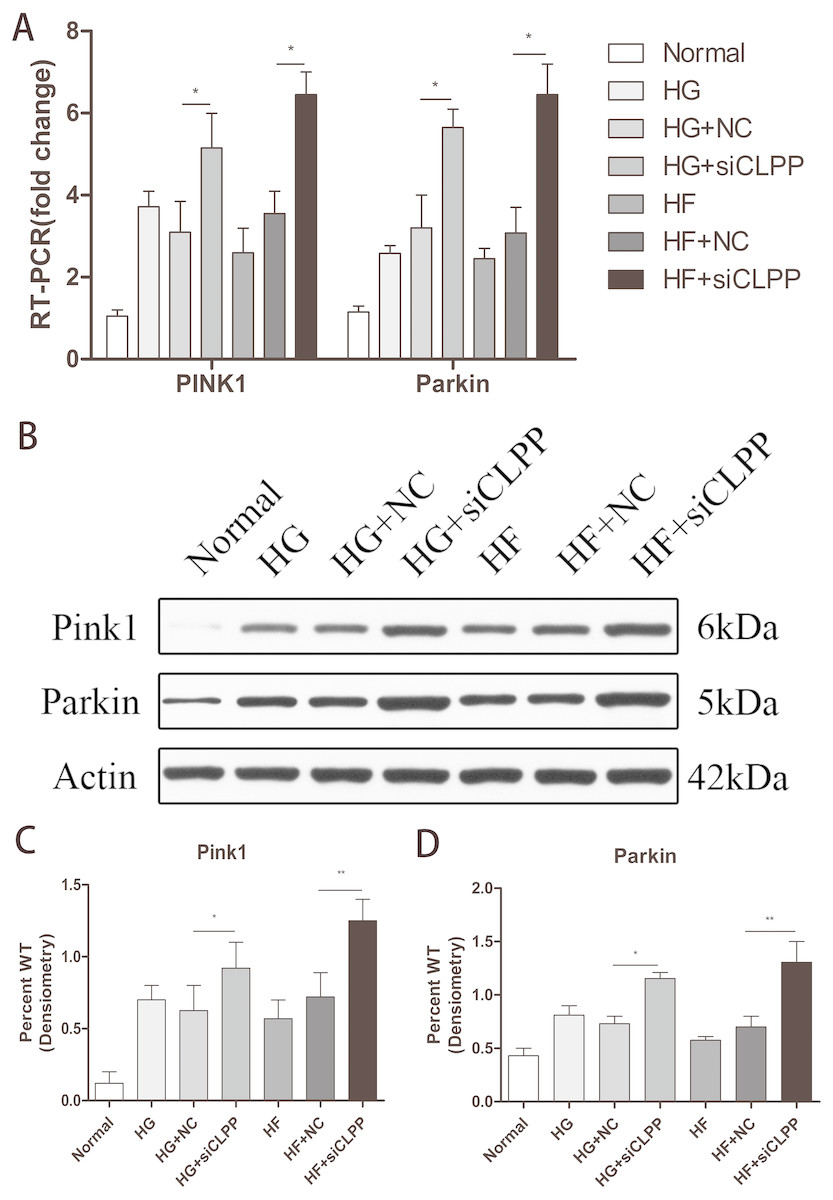
Figure 4: Effect of CLPP siRNA on the expression of mitochondrial autophagy factor PINK1 and PARKIN.
(A) Gene expression levels of PINK1 and PARKIN were detected by RT-qPCR. (B) Protein expression of PINK1 and PARKIN was determined by western blot. (C–D) Statistical analysis of the expression of mitochondrial autophagy factor PINK1 and PARKIN detected by western blot in cells as described in B. *p < 0.05, **p < 0.01.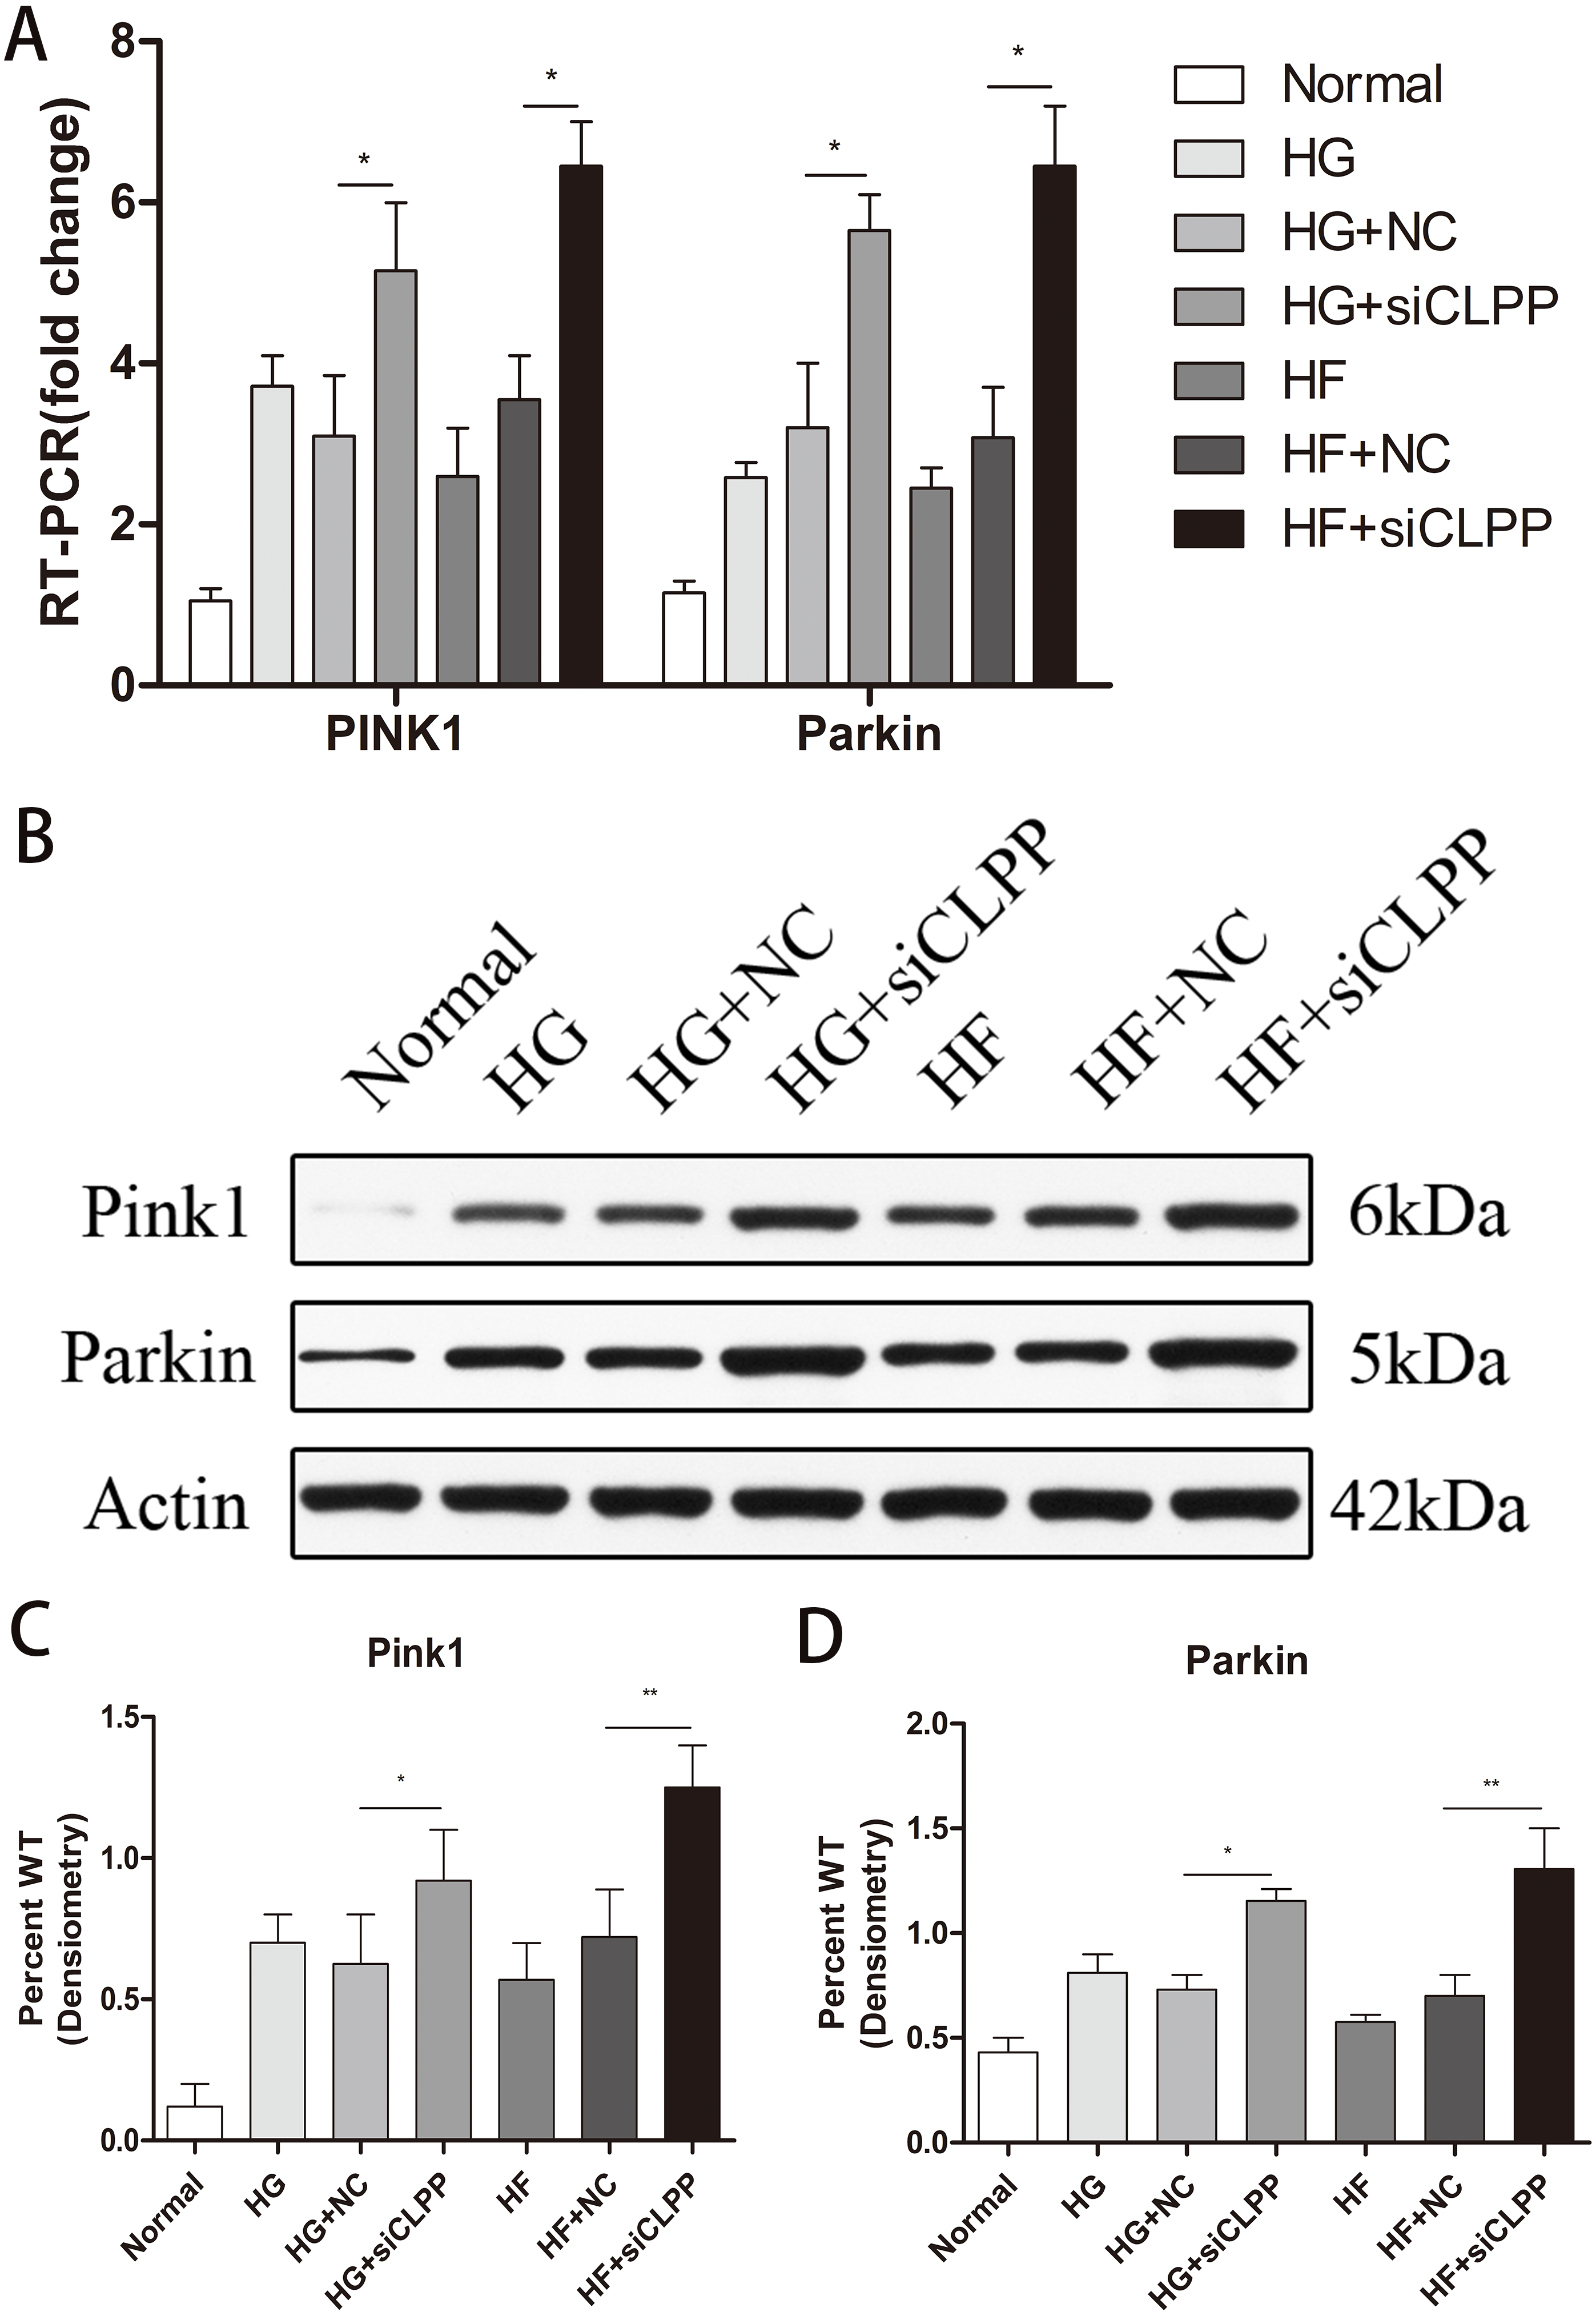
CLPP can alleviate the increase of cell apoptosis induced by high glucose and high fat
Annexin-V-FITC/Propidium Iodide flow cytometry was utilized to evaluate the effect of CLPP siRNA on Min6 cell apoptosis. The apoptosis proportion (both early and late) rose to 21% from 10% in the HG+siCLPP group compared to the HG+NC group. The apoptosis proportion (both early and late) rose to 26% from 14% in the HF+siCLPP group compared with just the HF+NC group, when cells were transfected with siRNA-CLPP (Figs. 5A–5H) (Raw data is available as Dataset 9. Treatment with CLPP siRNA significantly increased apoptosis of Min6 cells. These results showed that CLPP could alleviate the increase of cell apoptosis induced by high glucose and high fat.
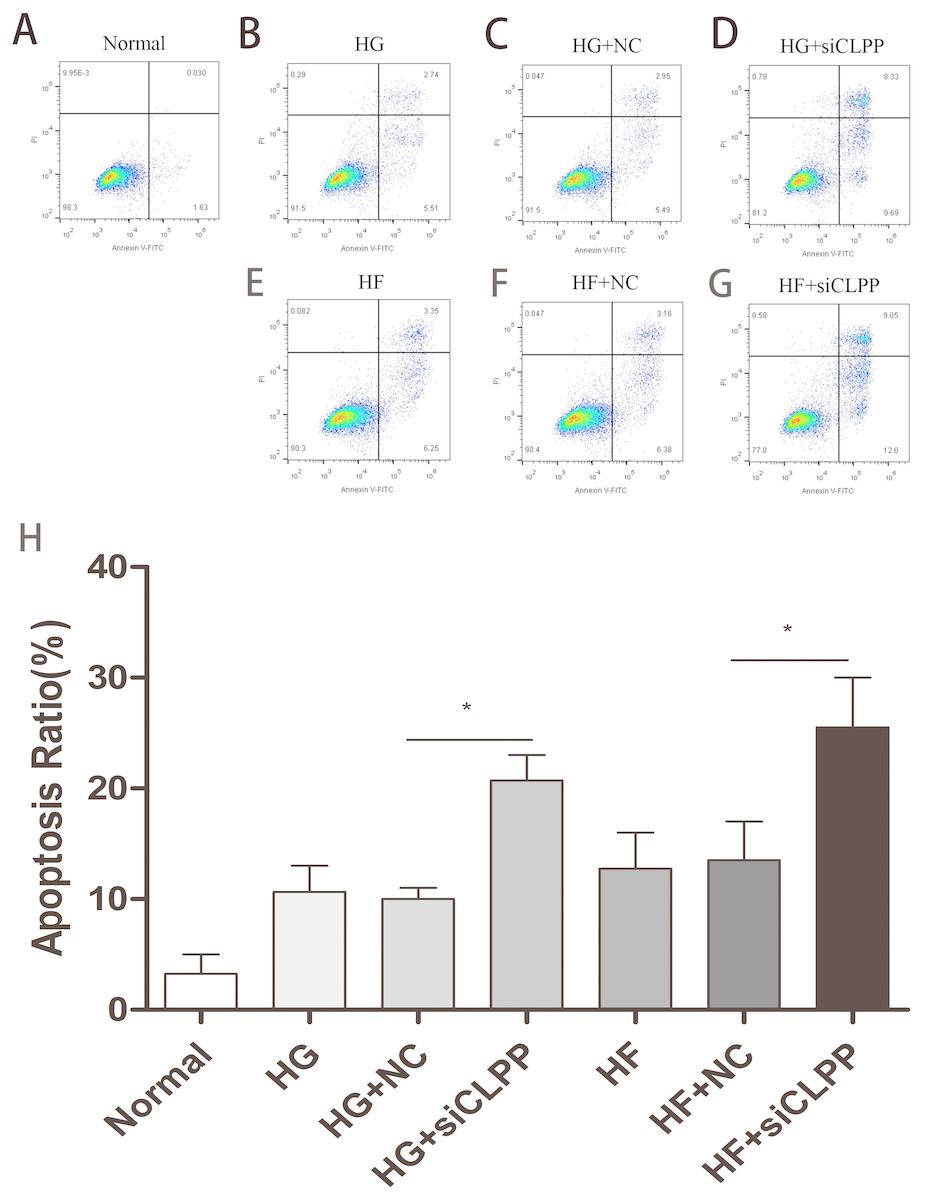
Figure 5: Cell apoptosis was analyzed by Annexin V assays followed by flow cytometry.
(A–G) The representative pictures of apoptosis detected by Flow cytometry with FL-1 and FL-2 filters, respectively. Lower left quadrantlive cells (Annexin V/PI), lower right quadrantearly apoptotic cells (Annexin V+/PI), upper right quadrantlate apoptotic cells (Annexin V+/PI+) and upper left quadrantnecrotic cells (Annexin V/PI+). (H) The summary data of apoptosis ratio. *p < 0.05, **p < 0.01.

Figure 6: Representative TEM images of mitochondrial ultrastructure at the indicated conditions (A–G).
The ultrastructural changes of mitochondria were more obvious in 11,500×images. White arrows indicated mitochondria and black arrows indicated mitophagy. Scale bars of 1,700× indicated 2 µm and scale bars of 11,500× indicated 500 nm.
CLPP may alleviate the structural damage of mitochondria induced by high glucose and high fat
Ultramicrostructure changes of mitochondria were shown in Fig. 6 (Raw data is available as Dataset 10, Dataset 11), as were observed with transmission electron microscopy (TEM). In the Normal group, Min6 cells and mitochondria morphology appeared normal under TEM. The number of mitochondria was more larger (74 mitochondria). The mitochondrion cristae were more and, can be clearly seen along with an intact nuclear membrane. Mitochondria1 matrix was of high density. Swelling mitochondria (the average area of mitochondria was 1.67 ± 0.35 µm2 and the area ratio of mitochondria to cell was 1.60) and vacuoles in the cytoplasm were almost absent. In contrast, after high glucose, high glucose+NC, high palmitic acid and high palmitic acid+NC treatment for 48 h, the number of mitochondria was decreased moderately (33, 42, 36 and 32 mitochondria in four groups, respectively). Moreover, the mitochondria were damaged: a small amount of mitochondria swelled and vacuolized. The average area of mitochondria was 3.98 ± 0.77 µm2, 4.18 ±1.05 µm2, 4.30 ± 0.80 µm2, and 4.73 ± 1.36 µm2, respectively (compared with the Normal group, P < 0.05). The area ratio of mitochondria to cell was3.12, 3.49, 3.66, and 3.97, respectively. The mitochondrial cristae were also broken and less and difficult to identify. Mitochondria1 matrix was of medium density. Fortunately, mitophagy images were captured in HG group and HF group. There were some vacuoles in the cytoplasm. Particularly, in the HG+siCLPP and HF+siCLPP groups, mitochondria were rare (17 and 16 mitochondria in two groups, respectively), and the mitochondria and nuclei were damaged, including missing cristae and a damaged matrix. Swelling mitochondria were obvious. The average area of mitochondria was 9.23 ± 1.58 µm2 and 9.10 ± 1.71 µm2, respectively (compared with the HG+NC and HF+NC groups, P < 0.05). The area ratio of mitochondria to cell was 8.15 and 7.98, respectively. Mitochondria were more pronounced vesicular in cross section. Mitochondria1 matrix was of low density. There were many and obvious vacuoles in the cytoplasm. Fewer mitochondria were observed, suggesting that more mitochondria may be cleared by autophagy after fission. CLPP siRNA aggravated mitochondrial damage induced by high glucose and high fat. These results suggested that the CLPP pathway may play a protective role in mitochondrial damage induced by stress (e.g., high glucose and high fat).
Figure 7: Evaluation of mitochondrial function (Part 1).
(A) Effect of CLPP siRNA on mitochondrial secretion of insulin. (B) Effect of CLPP siRNA on mitochondrial ATP production. (C) The representative pictures of ROS detected by Flow cytometry. (D) Comparison of fluorescence intensity of ROS in Flow cytometry. (E) The ratio of red/green fluorescent densities was calculated to evaluate the change of relative mitochondrial membrane potential. (F) Mitochondrial membrane potential fluorescence images visualized by a fluorescence microscope (200×). In cultured MIN6 cells after different treatments, representative images of JC-1 staining were shown CLPP siRNA reduced mitochondrial membrane potential. The green color indicated decreased membrane potential and the red color indicated normal membrane potential.
Insulin secretion was decreased by knocking down CLPP
To study a potential function of CLPP in regulating insulin secretion, we assessed the effects of CLPP siRNA on insulin secretion in Min6 cells. Our analysis revealed that insulin secretion levels were lower in the HG+siCLPP and HF+siCLPP groups compared to those of the HG+NC and HF+NC groups (decreased by 43% and 49%, respectively) (p < 0.05) (Fig. 7A) (Raw data is available as Dataset 12). The CLPP pathway was involved in the regulation of insulin secretion.
Knocking down CLPP reduced ATP secretion
The results showed that CLPP siRNA can cause less ATP to be released by Min6 cells in the HG+siCLPP and HF+siCLPP groups compared with the HG+NC and HF+NC groups (decreased by 38% and 57%, respectively) (p < 0.05) (Fig. 7B) (Raw data is available as Dataset 13). This indicated that CLPP affected mitochondrial function and further interfered with the ATP pathway in mitochondria.
ROS generation was increased by knocking down CLPP
We then tested the effect of siCLPP on high glucose and high fat-induced ROS generation. As shown in Figs. 7C, 7D (Raw data is available as Dataset 14), siCLPP increased the high glucose and high fat-induced ROS generation in Min6 cells by 15% and 25%, respectively. These findings suggested that CLPP may be a regulator of mitochondrial ROS generation.
CLPP was beneficial to maintaining mitochondrial membrane potential
We examined the effect of CLPP siRNA on mitochondrial membrane potential in Min6 cells using JC-1 loading. Figure 7E showed that the density of red color in the Normal group was more higher, indicating that mitochondrial membrane potential was more larger. The density of red color was decreased and the density of green color was increased in the HG and HF groups, which meant that mitochondrial membrane potential was decreased. In the HG+siCLPP and HF+siCLPP groups, green fluorescence became markedly stronger and red fluorescence was obviously reduced, which meant that mitochondrial membrane potential was more smaller. Similarly, in Fig. 7F the results showed the red/green ratio was more higher in the Normal group, indicating that the mitochondrial membrane potential was more larger, and the middle in HG, HF groups, which meant that the mitochondrial membrane potential was decreased, and more lower in HG+si CLPP, HF+si CLPP groups compared with HG, HF groups, which meant that the mitochondrial membrane potential was more smaller (red/green ratio was decreased by 75% and 69%, respectively) (p < 0.05) (Fig. 7F) (raw data is available as Dataset 15).
Mito-Tracker Red CMXRos Staining
The number of mitochondria with more detailed statistics for the various treatment groups was determined using Mito-Tracker Red CMXRos staining. Intracellular mitochondria were stained red and nucleus were blue (Fig. 8A) (raw data is available as Dataset 16). The intensity of red light correlated with the number of bioactive mitochondria. After Mito-Tracker Red CMXRos staining, the stronger the intensity of red light, the more the number of bioactive mitochondria. Results showed that the number of bioactive mitochondria were fewer in the HG+siCLPP and HF+siCLPP groups compared to those in the HG and HF groups. IOD values reflecting red light intensity were lower in the HG+siCLPP and HF+siCLPP groups than in the HG and HF groups (IOD values were decreased by 53% and 86%, respectively) (p < 0.05) (Fig. 8B).
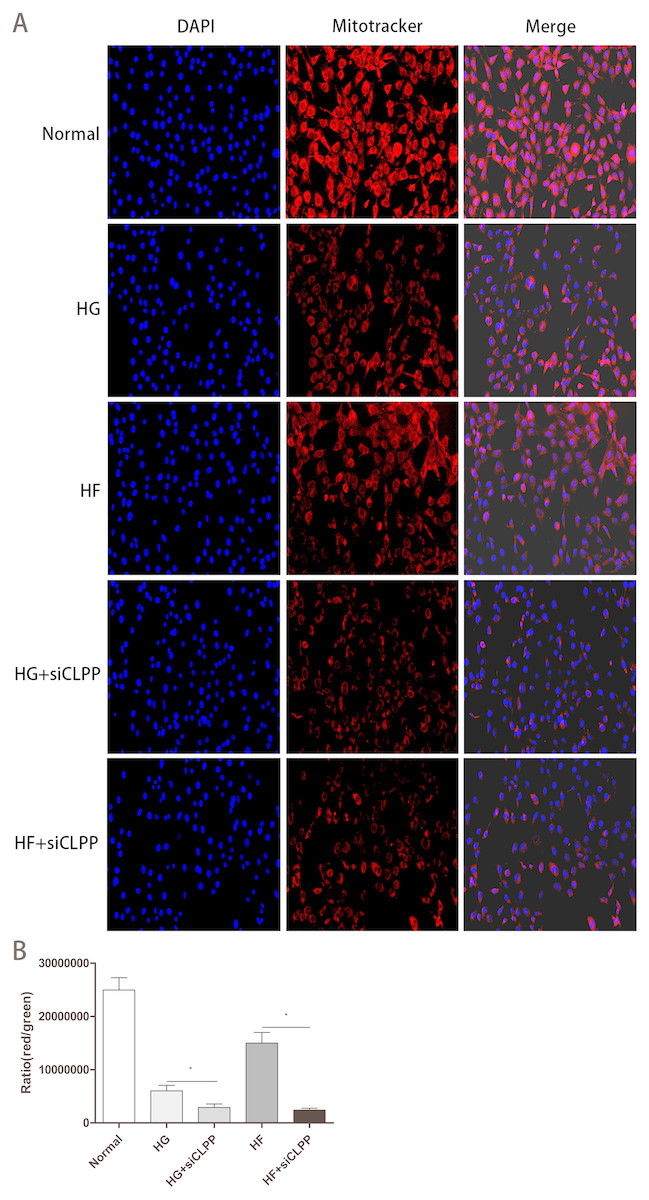
Figure 8: Evaluation of mitochondrial function (Part 2).
(A) The fluorescence intensity of bioactive mitochondria was observed by fluorescence microscopy (200×) after Mito-Tracker Red CMXRos staining. Blue color: nuclus stained with DAPI, red color: mitochondria stained with Mito-Tracker Red CMXRos. (B) IOD value of red light intensity was calculated after Mito-Tracker Red CMXRos staining. *p < 0.05, **p < 0.01.
Discussion
Our data demonstrated that treating cells with high glucose and high fat for 48 h caused upregulation of the mitochondrial protease, CLPP. Furthermore, the association between high glucose or high fat and upregulation of CLPP was found to be time and dose dependent. However, the expression of CLPP was insignificant between 1 mmol/l palmitic acid group and 0.5 mmol/l palmitic acid group at all-time points. This may be associated with a significant increase in Min6 cell death after 1 mmol/l palmitic acid treatment as compared to 0.5 mmol/l palmitic acid treatment, which results in a decrease of CLPP production. Time and dose dependence indicated that the activation of the mtUPR requires relatively intense environmental stress. In worms, for example, the activation of CLPP genes require sustained perturbation of mitochondrial protein-folding homeostasis over 3 days (Haynes et al., 2007). Upon environmental insults (for example, nutrient excess), mitochondria harbor a large set of proteases involved in quality control, including CLPP (Becker et al., 2018). High glucose and high fat may cause the increase and accumulation of unfolded and misfolded proteins in mitochondria, which further can result in a mito-nuclear protein imbalance, activating the mtUPR.
CLPP plays a critical role in high-fat stress conditions (Becker et al., 2018). Mammalian CLPP substrates include several metabolic enzymes involved in fatty acid β-oxidation (FAO) (Szczepanowska et al., 2016). It can be speculated that the expression of CLPP in the mitochondrial CLPP-FAO pathway increases as a result of higher concentrations and longer periods of high fat treatment given, so that CLPP can participate more effectively in fatty acid metabolism. It should be noted that different types of fatty acids have different effects on CLPP. Palmitic acid, as a saturated fatty acid, increase the expression of CLPP in our experiments, whereas in white adipose tissue, expression of CLPP is induced by unsaturated fatty acids, with saturated fatty acids reducing the expression of CLPP (Bhaskaran et al., 2017). The effects of fatty acids on CLPP may be tissue specific.
CLPP is involved in the process of glucose metabolism. Knockdown of CLPP can lead to the improvement of glucose metabolism, which could be attributed to the increased expression of GLUT4 in different tissues of CLPP-deficient mice. In skeletal muscle, the increase of GLUT4 level likely relates to the activation of AMPK (Kurth-Kraczek et al., 1999). High glucose concentration in Min6 cells mimicks hyperglycemia in vivo for inducing UPR signaling (Wang et al., 2015). In our research, high glucose can induce an increase of CLPP expression. However, to address whether this is achieved through the participation of CLPP in the process of glucose metabolism requires further research and experimentation.
In our experiments, after cells were treated with high glucose and high fat, mitochondrial fusion-related protein MFN1 was decreased and mitochondrial fission-related protein DRP1 was increased, indicating that mitochondrial fusion was decreased, and mitochondrial fission was increased under stress. However, this phenomenon was not obvious after 24 h of high glucose and high fat treatment. Our findings generally agreed with previous studies on the strong relationship between energy demand and supply balance and mitochondrial morphology (Gomes, Di Benedetto & Scorrano, 2011; Molina et al., 2009). However, there are inconsistent conclusions about the specific changes of mitochondrial dynamics-related protein expression after high glucose and high fat treatment. It seems likely that different cell types harness these processes in distinct ways which are best suited to their cellular stress. A high glucose culture is induced to undergo mitochondrial fission in cultured primary neonatal rat cardiomyocytes by decreasing the expression of MFN1 and OPA1 and increasing the expression of MFN2, FIS1, and DRP1 (Yu et al., 2017). In INS1 cells incubated with 20 mmol/l glucose, expression of proteins (MFN1, MFN2, OPA1, FIS1, and DRP1) is significantly reduced, with the greatest reduction for FIS1 (Schultz et al., 2016). High glucose induces an increase in DRP1 in podocytes (Ma et al., 2016). High glucose and high palmitate increase expression of FIS1 and p-DRP1/DRP1 and decrease expression of MFN2 (Liu et al., 2017). In animal experiments, MFN2, OPA1, and FIS1 demonstrate significant differences between a high-fat diet group and a normal diet group (Chen et al., 2018). The mechanisms underlying high glucose and high fat-induced alterations in mitochondrial fusion and fission related proteins are still not fully understood.
The duration of mitochondrial fusion and fission is very short. Fusion takes between 15.0 and 17.5 s, while mitochondrial fission takes between 35.0 and 67.5 s (Bereiter-Hahn & Voth, 1994; Haynes et al., 2007). Therefore, it is difficult to capture instantaneous images of mitochondrial fusion and fission through electron microscopy. The overall trend of mitochondrial fusion and fission can be reflected by the difference in the number of mitochondria and microstructure of mitochondria between different groups. Transmission electron microscopy analysis revealed that the morphological changes of mitochondria fit with the trend of the expression of mitochondrial dynamics-related proteins in the case of environmental stress. After high glucose and high fat treatment, the number of mitochondria and cristae was decreased, suggesting that the balance between fusion and fission was broken (i.e., fission was increased, and fusion was decreased), and indicating that mitochondria showed a distinct pattern of damage under cellular stress.
The role of CLPP in mitochondrial dynamics changes mediated by high glucose and high fat has not yet been reported. Wang et al. examined whether an environment (H2O2 treatment) with impaired energy metabolism affects mitochondrial dynamics in CLPP−/− mice oocytes. Findings revealed that fusion related proteins (MFN1, MFN2, OPA1) were decreased, while the expression of DRP1, which mediates fission, was unchanged. Mitochondrial dynamics seem to be severely affected in CLPP−/− oocytes. Morphometric analysis using electron microscopy found that CLPP−/− oocytes had shorter and smaller mitochondria, suggesting decreased fusion (Wang et al., 2018; Westermann, 2010). In our study, we sought to understand the role of CLPP in the effects of high glucose and high fat on mitochondrial dynamics. To achieve this, we knocked down the expression of CLPP. It is likely that the consequent reduced expression of CLPP contributed to the downregulation of transcripts coding for fusion proteins and the increase of fission-related proteins. These findings highlighted the importance of CLPPs proteolytic activity in mitochondrial dynamics. A possible mechanism is that knockdown of CLPP interferes with the mtUPR. Under high glucose and high fat stress, unfolded and misfolded proteins cannot be cleared by the mtUPR and accumulate in the mitochondria, resulting in mitochondrial fission increasing and fusion decreasing. This effect is manifested not only in the expression of mitochondrial dynamics-related proteins but also in the number and ultrastructure of mitochondria analyzed by electron microscopy. Due to increased fission and reduced fusion, the number of mitochondria is decreased. In addition, with the decrease in the number of mitochondria, mitochondrial damage in CLPP knock-down cells is more evident, including mitochondrial edema and cristae disappearance. The trend in the changes of mitochondrial dynamics-related proteins was the same as that of mitochondrial morphology by electron microscopy analysis. It may be considered that CLPP affects mitochondrial dynamics by affecting the mtUPR. CLPP-1 (RNAi) can perturb mitochondrial morphology, a finding consistent with higher level of the mtUPR in the mitochondria of animals with CLPP deficiency (Haynes et al., 2007). An important question posed by the research is, regarding the impact of CLPP on mitochondrial dynamics, which is the main influencer? Fusion or fission? At present, fission is considered more important. The mtUPR can induce mitochondrial fission (Aldridge, Horibe & Hoogenraad, 2007). In C2C12 cells lacking CLPP, the increase in the presence of DRP1 was related to reduction in mitochondrial size (Deepa et al., 2016). However, it is not clear whether CLPP directly controls mitochondrial dynamics. What are the specific intermediate links between CLPP and mitochondrial dynamics-related proteins? Future studies in this area will, again, help clarify any potential impact.
The mtUPR affects multiple mitochondrial functions including mitophagy. In the case of an accumulation of damaged polypeptides, if the damage is too severe and dysfunctional mitochondria accumulate, the cell will specifically remove these organelles by mitophagy. The pathway regulating mitophagy mediated by PINK1 and PARKIN is present in many metazoans (Eiyama & Okamoto, 2015). Our experiment showed that the expression of PINK and PARKIN was increased after knockdown of CLPP in the conditions of high glucose and high fat. This means that the mtUPR acts as a protective factor, and if this process is impaired, such as by knocking down CLPP, damage to the mitochondria increases and eventually mitophagy increases.
CLPP also affects mitochondrial function. Knocking down CLPP leads to a further decrease in mitochondrial synthesis of ATP, a further reduction of insulin secretion in cells and a further increase in ROS synthesis. These results also show that mtUPR is closely related to mitochondrial function. Several previous studies supported a role for CLPP in the maintenance of mitochondrial function. For example, shRNA-mediated CLPP silencing in OCIAML2 cell lines showed increased generation of ROS (Bhaskaran et al., 2018). CLPP-deficient cells had increased mitochondrial ROS levels (Deepa et al., 2016). Decline in CLPP in C2C12 cells resulted in elevated production of ROS (Deepa et al., 2016). The ROS levels were increased in gWAT of CLPP−∕− mice (Fisler & Warden, 2006).
The most outstanding feature of min6 cell (mice pancreatic β-cell line) is that they produce a large amount of insulin. ATP is an important signalling molecule, which regulates a production of insulin in min6 cell (Kowal, Yegutkin & Novak, 2015). When the lack of protease CLPP in mitochondria leads to the increase of unfolded and misfolded proteins, ATP generation is interfered and then reduced, and the production of insulin in min6 cells will be reduced accordingly. Whether CLPP affects insulin production through ATP pathway and whether CLPP affects ATP production by affecting the respiratory chain in mitochondria need further study to confirm. Studies by Bhaskaran et al. found circulating levels of insulin were reduced by 68% in CLPP−∕− mice compared to WT mice (Bhaskaran et al., 2018). However, some experiments showed conflicting results. CLPP−∕− mice had elevated insulin sensitivity and did not exhibit lower circulating insulin levels (Becker et al., 2018). The effect of CLPP on insulin needs further experimental confirmation.
Conclusions
As an important protease in the mtUPR, CLPP plays an important role in the morphology and function of mitochondria under cellular stress (such as high glucose and high fat conditions). There is a very close relationship among the mtUPR, mitochondrial dynamics, mitochondrial morphology, and mitochondrial function.