
Reference genes for qRT-PCR normalisation in different tissues, developmental stages, and stress conditions of Hypericum perforatum
- Published
- Accepted
- Received
- Academic Editor
- Axel Tiessen
- Subject Areas
- Bioinformatics, Molecular Biology, Plant Science, Data Mining and Machine Learning, Data Science
- Keywords
- Reference genes, Hypericum perforatum L., qRT-PCR, Normalization, Gene expression
- Copyright
- © 2019 Zhou et al.
- Licence
- This is an open access article distributed under the terms of the Creative Commons Attribution License, which permits unrestricted use, distribution, reproduction and adaptation in any medium and for any purpose provided that it is properly attributed. For attribution, the original author(s), title, publication source (PeerJ) and either DOI or URL of the article must be cited.
- Cite this article
- 2019. Reference genes for qRT-PCR normalisation in different tissues, developmental stages, and stress conditions of Hypericum perforatum. PeerJ 7:e7133 https://doi.org/10.7717/peerj.7133
Abstract
Hypericum perforatum L. is a widely known medicinal herb used mostly as a remedy for depression because it contains high levels of naphthodianthrones, phloroglucinols, alkaloids, and some other secondary metabolites. Quantitative real-time PCR (qRT-PCR) is an optimized method for the efficient and reliable quantification of gene expression studies. In general, reference genes are used in qRT-PCR analysis because of their known or suspected housekeeping roles. However, their expression level cannot be assumed to remain stable under all possible experimental conditions. Thus, the identification of high quality reference genes is essential for the interpretation of qRT-PCR data. In this study, we investigated the expression of 14 candidate genes, including nine housekeeping genes (HKGs) (ACT2, ACT3, ACT7, CYP1, EF1-α, GAPDH, TUB-α, TUB-β, and UBC2) and five potential candidate genes (GSA, PKS1, PP2A, RPL13, and SAND). Three programs—GeNorm, NormFinder, and BestKeeper—were applied to evaluate the gene expression stability across four different plant tissues, four developmental stages and a set of abiotic stress and hormonal treatments. Integrating all of the algorithms and evaluations revealed that ACT2 and TUB-β were the most stable combination in different developmental stages samples and all of the experimental samples. ACT2, TUB-β, and EF1-α were identified as the three most applicable reference genes in different tissues and stress-treated samples. The majority of the conventional HKGs performed better than the potential reference genes. The obtained results will aid in improving the credibility of the standardization and quantification of transcription levels in future expression studies on H. perforatum.
Introduction
An increasing number of studies on the gene expression levels in plants are being carried out to better understand the signaling and metabolic pathways underlying the developmental processes involved in plant development and growth, as well as plant responses to biotic and abiotic stresses (Moreno-Risueno et al., 2010; Yamaguchi et al., 2010; Wang et al., 2011). Methods for assessing gene expression include northern blot, gene chips, semi-PCR, RNase protection analysis, and Quantitative real-time PCR (qRT-PCR). qRT-PCR has become a very popular and effective method for detecting and quantifying gene transcription levels because of its high sensitivity, specificity, reproducibility, and accuracy (Nolan, Hands & Bustin, 2006). Reliable quantification of gene expression levels using qRT-PCR analysis requires the standardization and fine-tuning of several parameters, such as the amount of initial sample, RNA recovery and integrity, enzymatic efficiency of cDNA synthesis and PCR amplification, and the overall transcriptional activity of the tissues or cells analyzed (Nolan, Hands & Bustin, 2006; Udvardi & Scheible, 2008). The expression stability of frequently used reference genes also cannot be neglected. Therefore, the normalization of the transcript levels of test genes is essential for minimizing technical differences that arise in different samples and experimental conditions (Udvardi & Scheible, 2008). More importantly, the selection of stable reference genes must be done before qRT-PCR analysis.
An appropriate reference gene is not affected by the experimental conditions and remains at an invariable level among samples (Bustin & Mueller, 2005). However, the transcription levels of the traditional reference genes and even some housekeeping genes (HKGs) can vary between different types of tissue and under different treatment conditions (Leal et al., 2015). Therefore, a growing number of studies have been published on the analysis and evaluation of the stability of internal reference genes in plant tissues under different conditions. Consequently, different reference genes should be applied for different experimental materials and conditions. In addition, the use of reference genes with lower stability may lead to an erroneous understanding of the qRT-PCR results and mask the true nature of gene expression (Brattelid & Levy, 2011; Bustin & Nolan, 2004).
Hypericum perforatum L. (commonly known as St. John’s wort) is a widely known medicinal herb used mostly as a remedy for depression (Veronika, 2003). Pure essential compounds isolated from H. perforatum, namely naphthodianthrones and phloroglucinols, have been shown to possess anti-depressive, anti-cancer, anti-viral, anti-inflammatory, and other activities (Birt et al., 2009; Filippo et al., 2011). Xanthones and flavonoids have also been identified in extracts from this plan (Schröder, 1997). To date, a limited number of qRT-PCR studies focusing on H. perforatum have been published. Velada et al. (2014) studied the stability of 11 candidate reference genes analyzed in H. perforatum plants subjected to only cold and heat stresses, and TUB was found to be the most stable gene under both experimental conditions. Therefore, it is essential to screen suitable reference genes in different tissues of H. perforatum under different experimental conditions. Ribosomal RNA and some HKGs are usually used as reference genes, such as actin (ACT), tubulin (TUB), glyceraldehyde-3-phosphate dehydrogenase (GAPDH), and polyubiquitin (UBQ) (Costa et al., 2015; Goulao, Fortunato & Ramalho, 2012; Llanos, François & Parrou, 2015; Willems, Leyns & Vandesompele, 2008), whereas many studies have revealed that the most commonly used HKGs are not always reliable among different experimental samples. Thus, an evaluation to screen the optimal HKGs in different species is urgently needed (Ohl et al., 2005; Selvey et al., 2001; Thellin et al., 1999).
This study aimed to assess the expression stabilities of 14 reference genes in 15 experimental samples using qRT-PCR, including nine traditional HKGs and five potential reference genes: GAPDH, actin (ACT2, ACT3, and ACT7), ubiquitin-conjugating (UBC2), elongation factor (EF1-a), tubulin (TUB-α and TUB-β), cyclophilin (CYP1), polyketide synthase (PKS1), glutamate semialdehyde aminomutase (GSA), SAND family protein (SAND), ribosomal protein L (RPL13) and protein phosphatase 2A (PP2A). These genes were selected from the H. perforatum genome sequencing data obtained in our lab. In this study, we evaluated the transcriptional stability of these genes in different tissues, developmental stages and under different stress conditions to determine the most stable reference genes.
Materials and Methods
Plant materials
H. perforatum seeds (2n = 2× = 16) were germinated on a seedling bed in the glasshouse (25 ± 2 °C, natural lighting, 60–80% humidity). Whole plant tissues were collected at the one-month-old (1M), two-month-old (2M), three-month-old (3M), and six-month-old (6M) stages. Samples of different tissues (leaf, flower, stem, and root) were taken from two-year-old plants (2n = 2× = 16). 3M seedlings were subjected to abiotic stresses and hormonal treatments, including 10 μM salicylic acid (SA), 200 μM methyl jasmonate (MeJA), 100 μM abscisic acid (ABA), one mM AgNO3 (Ag), 200 μM CuSO4 (Cu), 100 mM NaCl (Na), low temperature (4 °C) and wounding (W). The stress-treated samples were each collected 6 h after the corresponding treatments, and the control groups were collected following non-treatment. All samples were collected in three replicates, frozen in liquid nitrogen immediately, and then stored at −80 °C.
Total RNA isolation and cDNA synthesis
Total RNA was extracted using the Polysaccharide and Polyphenols Plant Quick RNA Isolation Kit (centrifugal column type; Waryong, Beijing, China). The genomic DNA was digested with RNase-free DNase I (TaKaRa, Kusatsu, Japan). The total RNA was quantified using the absorbance at A260/A280 and A260/A230 nm measured with a NanoDrop 2000c spectrophotometer (Thermo Scientific, Waltham, MA, USA). A 1% (p/v) agarose gel was run to visualize the integrity of the RNA. Only RNA samples with an A260/A280 wavelength ratio between 1.9 and 2.1 and an A260/A230 ratio close to 2.0 were used for cDNA synthesis. Then, 1.0 μg DNA-free total RNA was used to synthesize first-strand cDNAs with a PrimeScript RT Reagent Kit (TaKaRa, Kusatsu, China) in a 20 μL volume. All cDNA samples were diluted (1:40) with DNase/RNase-free deionized water for qRT-PCR.
Selection of reference genes and primer design
We performed genomic sequencing of H. perforatum using Illumina paired-end, 10× Genomics linked reads and PacBio SMART (GenBank accession numbers: MK054303, MK106356–MK106365). The transcriptome sequencing of H. perforatum for the roots, stems, leaves, and flowers assisted annotation. The 14 candidate genes, including nine traditional HKGs (ACT2, ACT3, ACT7, CYP1, EF1-α, GAPDH, TUB-α, TUB-β, and UBC2) and five potential reference genes (PKS1, GSA, RPL13, SAND, and PP2A) which have been used as candidate genes in other studies (He et al., 2016; Li et al., 2017; Velada et al., 2014), were selected for the assessment of the most stably expressed reference genes (Table S1). To ensure the accuracy of the reference gene predictions, we first screened the candidate genes according to the genome annotation of each, which was assigned based on the best match of the alignments using Blastp to SwissProt, KEGG, NR, and TrEMBL databases. Then the coding sequences of the 14 selected genes were used as queries for BLAST orderly through the TAIR database (http://www.arabidopsis.org/) to further ensuring accuracy. The sequences with the highest homology with Arabidopsis are shown in Table 1. The primers of all the genes were designed using GenScript (https://www.genscript.com) with a melting temperature between 59 and 61 °C, a primer length of 20–25 bp, and an amplicon length of 70–180 bp. The descriptions of the candidate reference genes, primer sequences, and qRT-PCR amplification efficiencies are presented in Table 1.
| Gene symbol | Gene name | Accession No. | Amplicon size (bp) | Primer sequence U/L (5′–3′) | Tm (°C) | Efficiency (%) |
|---|---|---|---|---|---|---|
| ACT2 | Actin 2 | MK054303 | 101 | Fw: AGGAGTCCCTCCACGACCAC | 83.6 | 97.6 |
| Rv: GCCGTTGTGTACCGGGTAGG | ||||||
| ACT3 | Actin 3 | MK106364 | 139 | Fw: ATCCTTCCCACGGTGGTTGC | 88.2 | 102.9 |
| Rv: CAATCGCCTCGTCGCCTACA | ||||||
| ACT7 | Actin 7 | MK106365 | 131 | Fw: GAGCAGCAGCAGGTCGACAA | 83.0 | 107.6 |
| Rv: ACCCACTCGAGCCCAGTGTA | ||||||
| CYP1 | Cyclophilin | MK106359 | 163 | Fw: AGGGATCCAGCTTCCACCGT | 87.8 | 96.2 |
| Rv: GCGTTGGCCATGGAGAGGAT | ||||||
| EF1-α | Elongation factor 1-alpha | MK106356 | 121 | Fw: TGGAGGCTCTCCCTGGTGAC | 85.8 | 105.6 |
| Rv: AAGTTGGCAGCCTCCTTGGC | ||||||
| GAPDH | Glyceraldehyde-3-phosphate dehydrogenase A subunit | EU301783 | 76 | Fw: AGGCCTCCCACCTCCTCAAG | 84.7 | 105.1 |
| Rv: GGTTGACAGGGTTGCGGTCA | ||||||
| TUB-α | Alpha tubulin | MK106362 | 132 | Fw: TGCTGCGGTTGCCACCATTA | 84.8 | 109.5 |
| Rv: CGCTGCACCTTTGCAAGATCG | ||||||
| TUB-β | Beta tubulin | MK106361 | 170 | Fw: CGACGGGAGTGACAGCCTTG | 86.5 | 108.6 |
| Rv: CGACCACATCGCTCGTCTCC | ||||||
| UBC2 | Ubiquitin-conjugating enzyme 2 | MK106357 | 103 | Fw: AGGAGGAGGCGCCTTTGAGA | 84.5 | 98.2 |
| Rv: CGCAAGAGCCGGTCCATTCA | ||||||
| GSA | Glutamate-1-semialdehyde 2,1-aminomutase | KJ624985 | 78 | Fw: GGTGTCAGGATGGCGGTGTC | 85 | 94.4 |
| Rv: GGGCTGGCCACCAACTGATT | ||||||
| PKS1 | Polyketide synthase 1 | EF186675 | 76 | Fw: ACGGACGCTGCCATCAA | 82.5 | 98.3 |
| Rv:ACATAACCGTGTACCTTGTC | ||||||
| PP2A | Protein phosphatase 2A | MK106360 | 93 | Fw: GGCAAGTGCCCAGACACCAA | 81.2 | 95.5 |
| Rv: CAGCGCCACTAGCAGCGTAA | ||||||
| RPL13 | Ribosomal protein L | MK106363 | 151 | Fw: CAGCGCTGGATGTTCGAGGA | 84.5 | 92.5 |
| Rv: TGGTGGAAGCCAACCTCCCA | ||||||
| SAND | SAND family protein | MK106358 | 111 | Fw: CTCCCTCGCACTGGGACAAC | 83.2 | 97.1 |
| Rv: AAGACCAGCAGGACCACCCA |
qRT-PCR conditions and analysis
PCR reactions were performed on the Roche LightCycler 96 system using SYBR® Master Mix. Reactions were performed in triplicate in 20 μL volumes containing five μL 30-fold diluted synthesized cDNA, 10 μL SYBR® Master Mix, 0.4 μL 10 mM forward primer, 0.4 μL 10 mM reverse primer and 4.2 μL DNase/RNase-free deionized water. The cycling conditions were 95 °C for 30 s, 45 cycles of 95 °C for 5 s, and 60 °C for 30 s, and a final melting curve analysis. Each reaction was set up with a negative control group and triple technical replicates were performed in each of three biological samples. To calculate the amplification efficiency from 10-fold continuous dilutions of the cDNA (100, 10−1, 10−2, and 10−3) for each gene, standard curves were constructed to obtain the correlation coefficients (R2) and slope values. Using these standard curves, the corresponding PCR amplification efficiencies (E) were calculated (E = (10−1/slope −1) × 100) (Aleksandar et al., 2004).
Assessment of expression stability
The expression stability of the genes was analyzed using three different Visual Basic applets, GeNorm (Schlotter et al., 2009), NormFinder (Obrero et al., 2011; Zhang et al., 2016), and BestKeeper (Rhinn et al., 2008; Rotenberg et al., 2006). GeNorm derives a stability measure (M-value) via the stepwise exclusion of the least stable gene, and creates a stability ranking (Hu et al., 2009). Genes with M < 1.5 are generally considered stable reference genes (Tong et al., 2009). This measure is based on the principle that the expression ratio of two ideal control genes should be identical in all samples; thus, genes with the lowest M-value are the most stably expressed (Dekkers et al., 2012). The GeNorm pairwise variation (V) values between ranked genes (Vn/Vn+1) were determined for the optimal number of reference genes to be used in the quantitative analysis experiments. A cut-off of 0.15 (Vn value) is usually applied (Vandesompele et al., 2002). NormFinder uses an ANOVA-based model to estimate intra- and intergroup variation within tissues or treatments (“groups” in NormFinder terminology) to assess the expression stability (Marchal et al., 2013). For GeNorm and NormFinder, the raw Ct values need to be converted to relative quantities (Q) using the formula Q = 2−ΔCt, in which ΔCt = each average Ct value−minimum Ct value (Yang et al., 2015). In BestKeeper, the coefficient of variance (CV) and the standard deviation (SD) were calculated using the Ct values, with lower CV and SD values indicating higher stability (Migocka & Papierniak, 2011). The mean standard error and level of statistical significance were calculated using GraphPad Prism 6.0, and the level of statistical significance was assessed using ∗P < 0.05, ∗∗P < 0.01, and ∗∗∗P < 0.001.
Validation of reference gene stability
The relative expression of the HpHYP1 gene in different tissues was measured and standardized by using the most stable and unstable candidate genes as internal references to verify the reliability of the selected genes according to the 2−ΔΔCt method (Kumar et al., 2011). Three technical replicates were performed for each biological sample.
Results
Primer specificity and expression level analysis of candidate reference genes
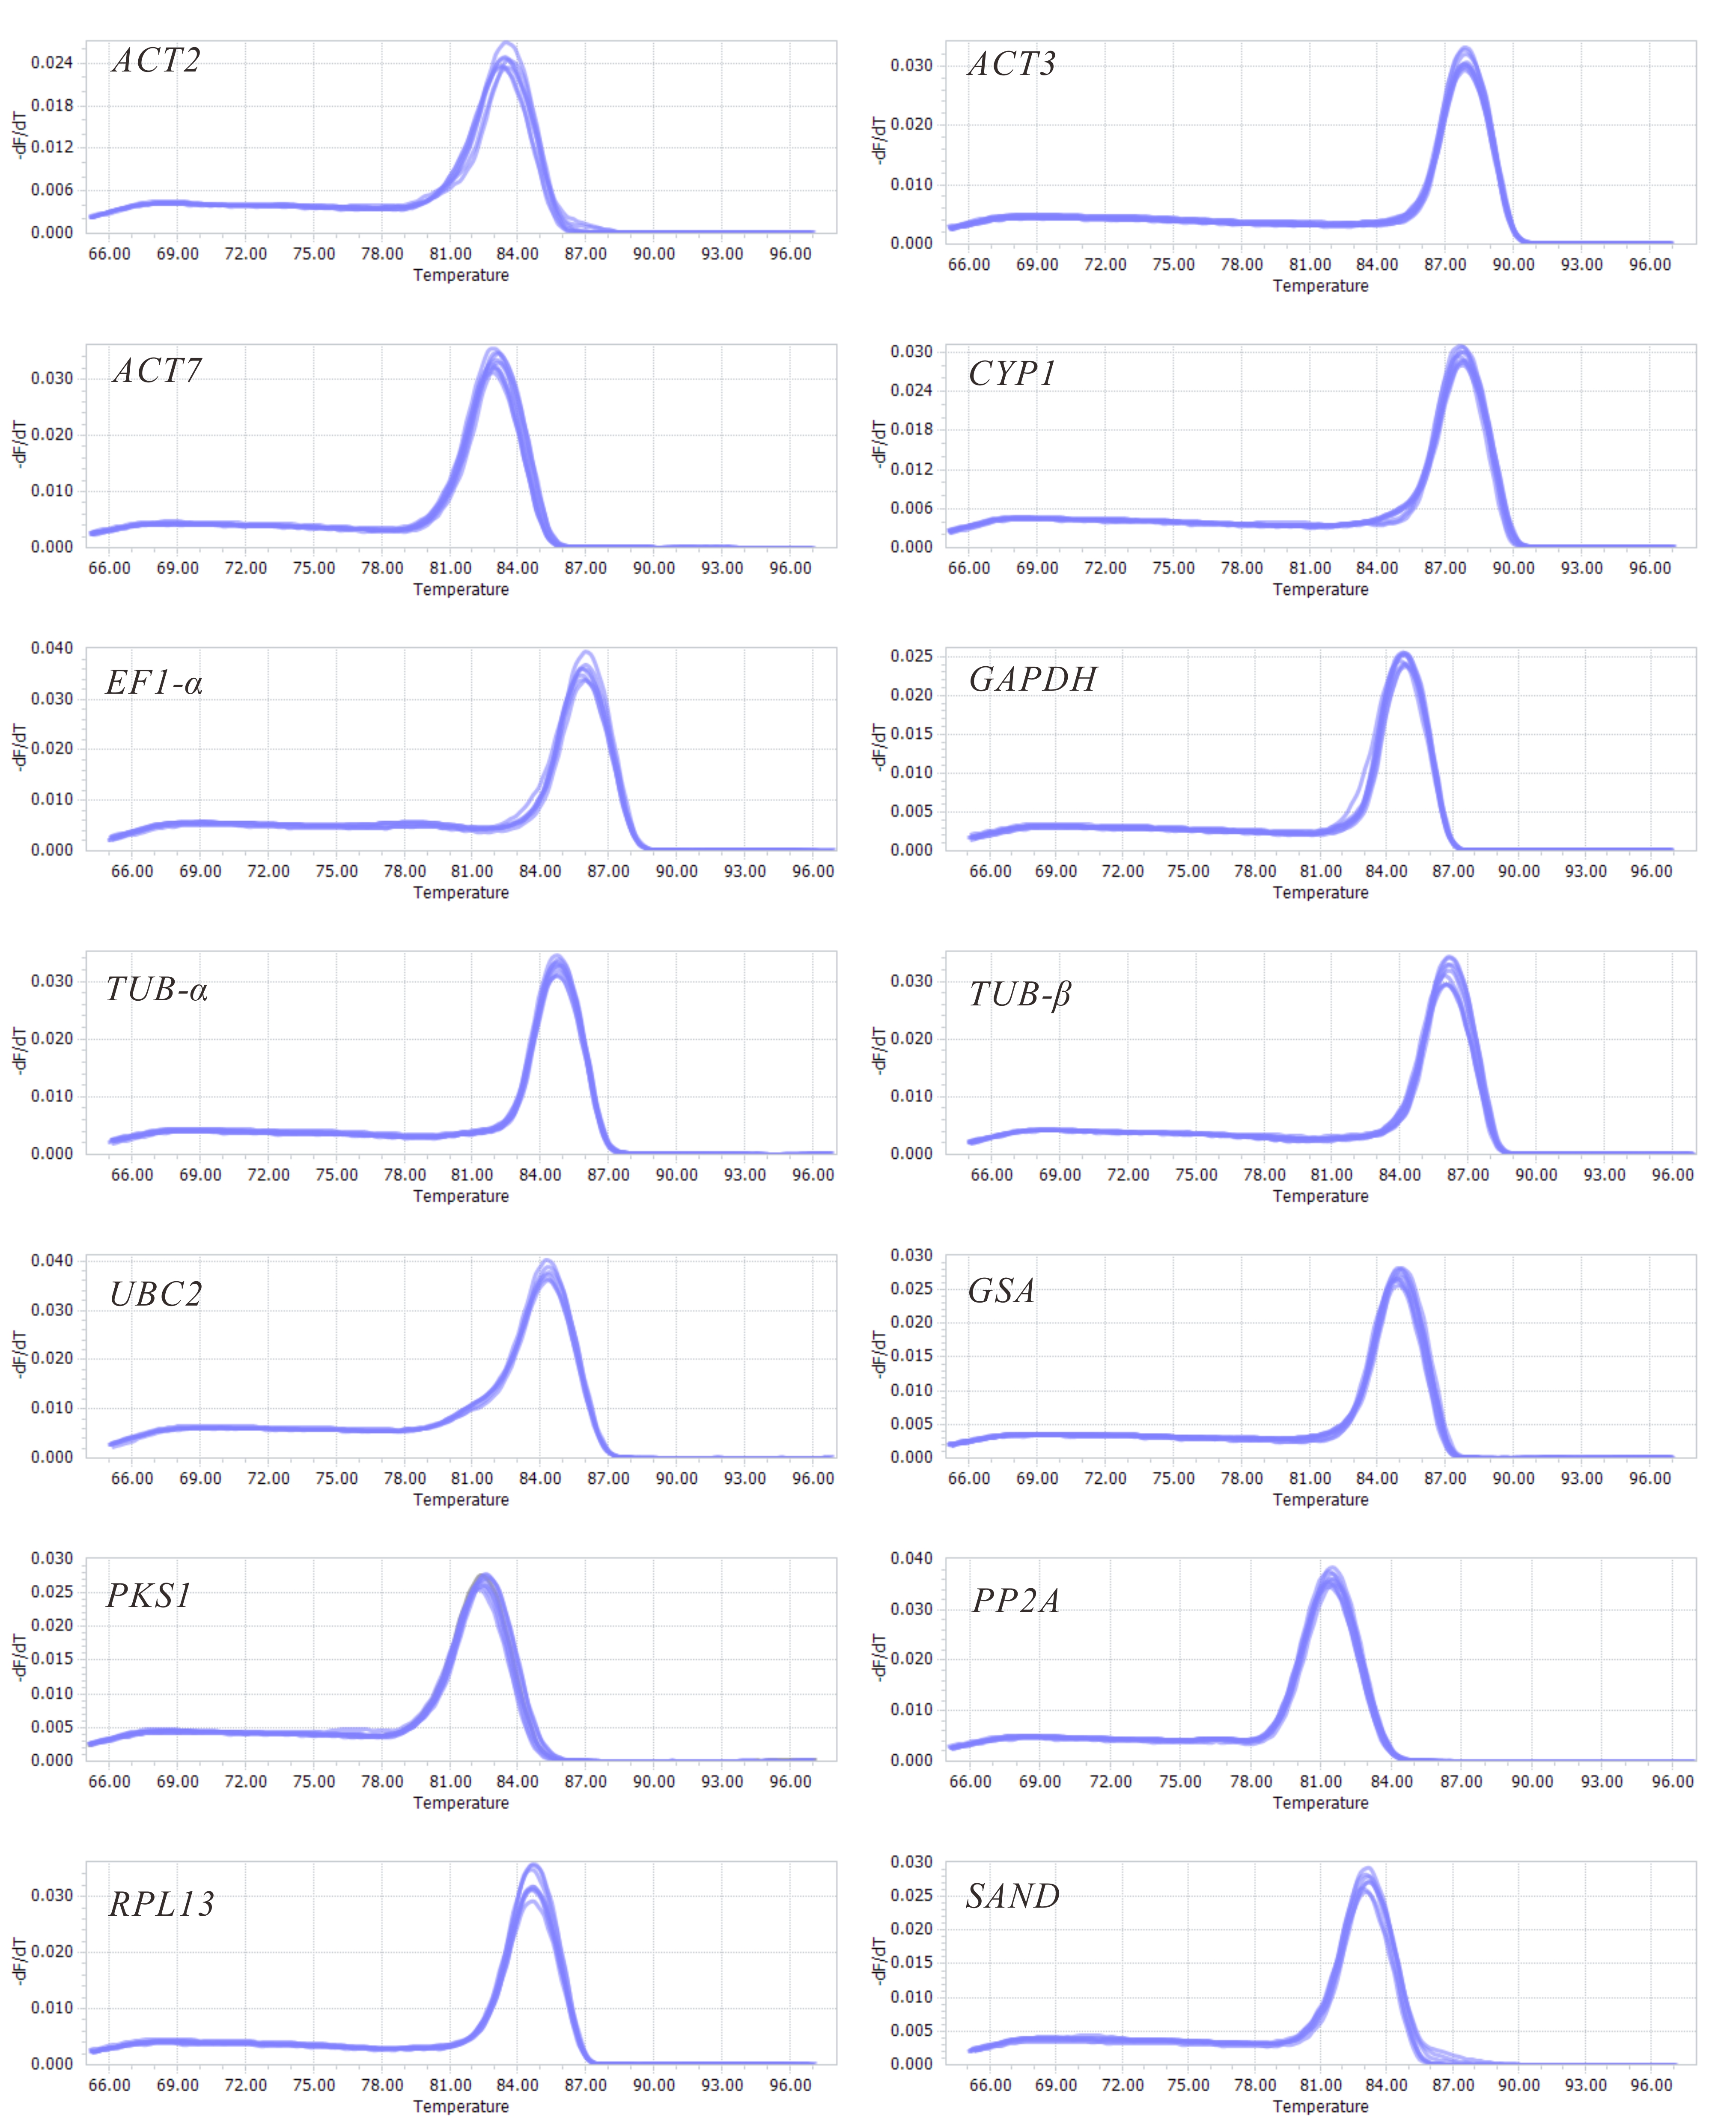
The gene names and abbreviations, accession numbers, primer sequences, amplification efficiencies, amplicon sizes, Tm values, and molecular functions are listed in Table 1 and Table S1. The amplification efficiencies listed in Table S2 ranged from 92.5% (RPL13) to 109.5% (TUB-α), the Tm values varied from 81.2 °C (PP2A) to 87.8 °C (CYP1), and the amplicon sizes were between 76 (GAPDH and PKS1) and 170 bp (TUB-β). Furthermore, primer specificities were determined using melting curves (Fig. S1) and triple technical replicates were performed for each of the three biological samples. A single band indicated the correct size of each pair. The average raw CT values of different genes ranged from 18.15 to 32.32 (Table S3). Data were analyzed within experiments and divided into four groups: tissues from two-year-old plants (TS: R, S, L, and F), seedling developmental stages (SG: 1M, 2M, 3M, and 6M), 3M seedlings exposed to abiotic stresses (ST: SA, MeJA, ABA, Cu, Ag, Na, 4 °C and W) and a combination of all experimental conditions (TT). The expression levels of the 14 selected genes in the four groups are shown in Fig. 1. Among them, UBC2 (TS) had the highest Ct value, but GAPDH (SG) had the lowest, indicating their levels of expression.
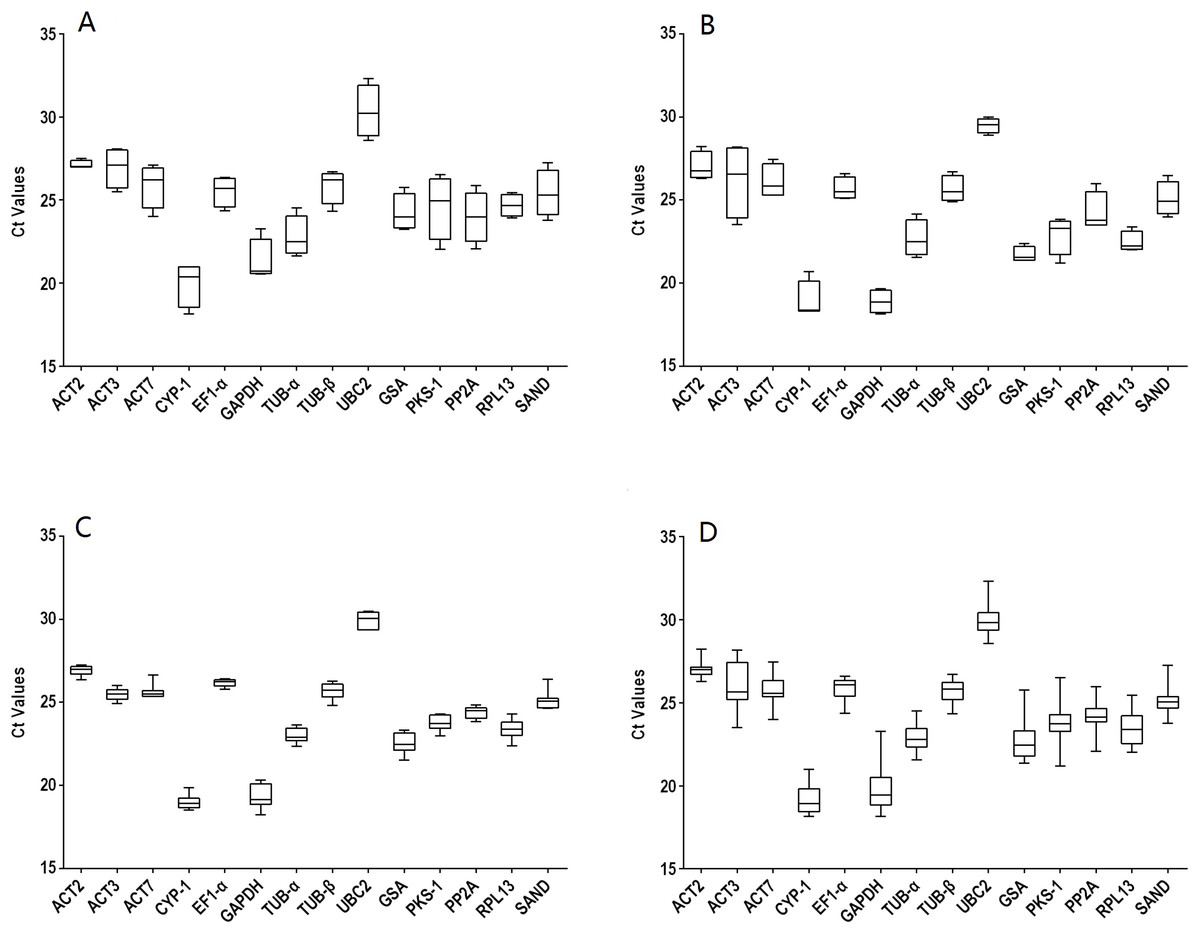
Figure 1: Distribution overview of the expression profiles of 14 candidate genes.
(A) different tissues, (B) developmental stage seedlings, (C) stress-treated seedlings, (D) data from all experimental conditions combined. The line across the box is the median. The box indicates the 25th and 75th percentiles; whisker caps indicate the maximum and minimum values; and dots indicate outliers.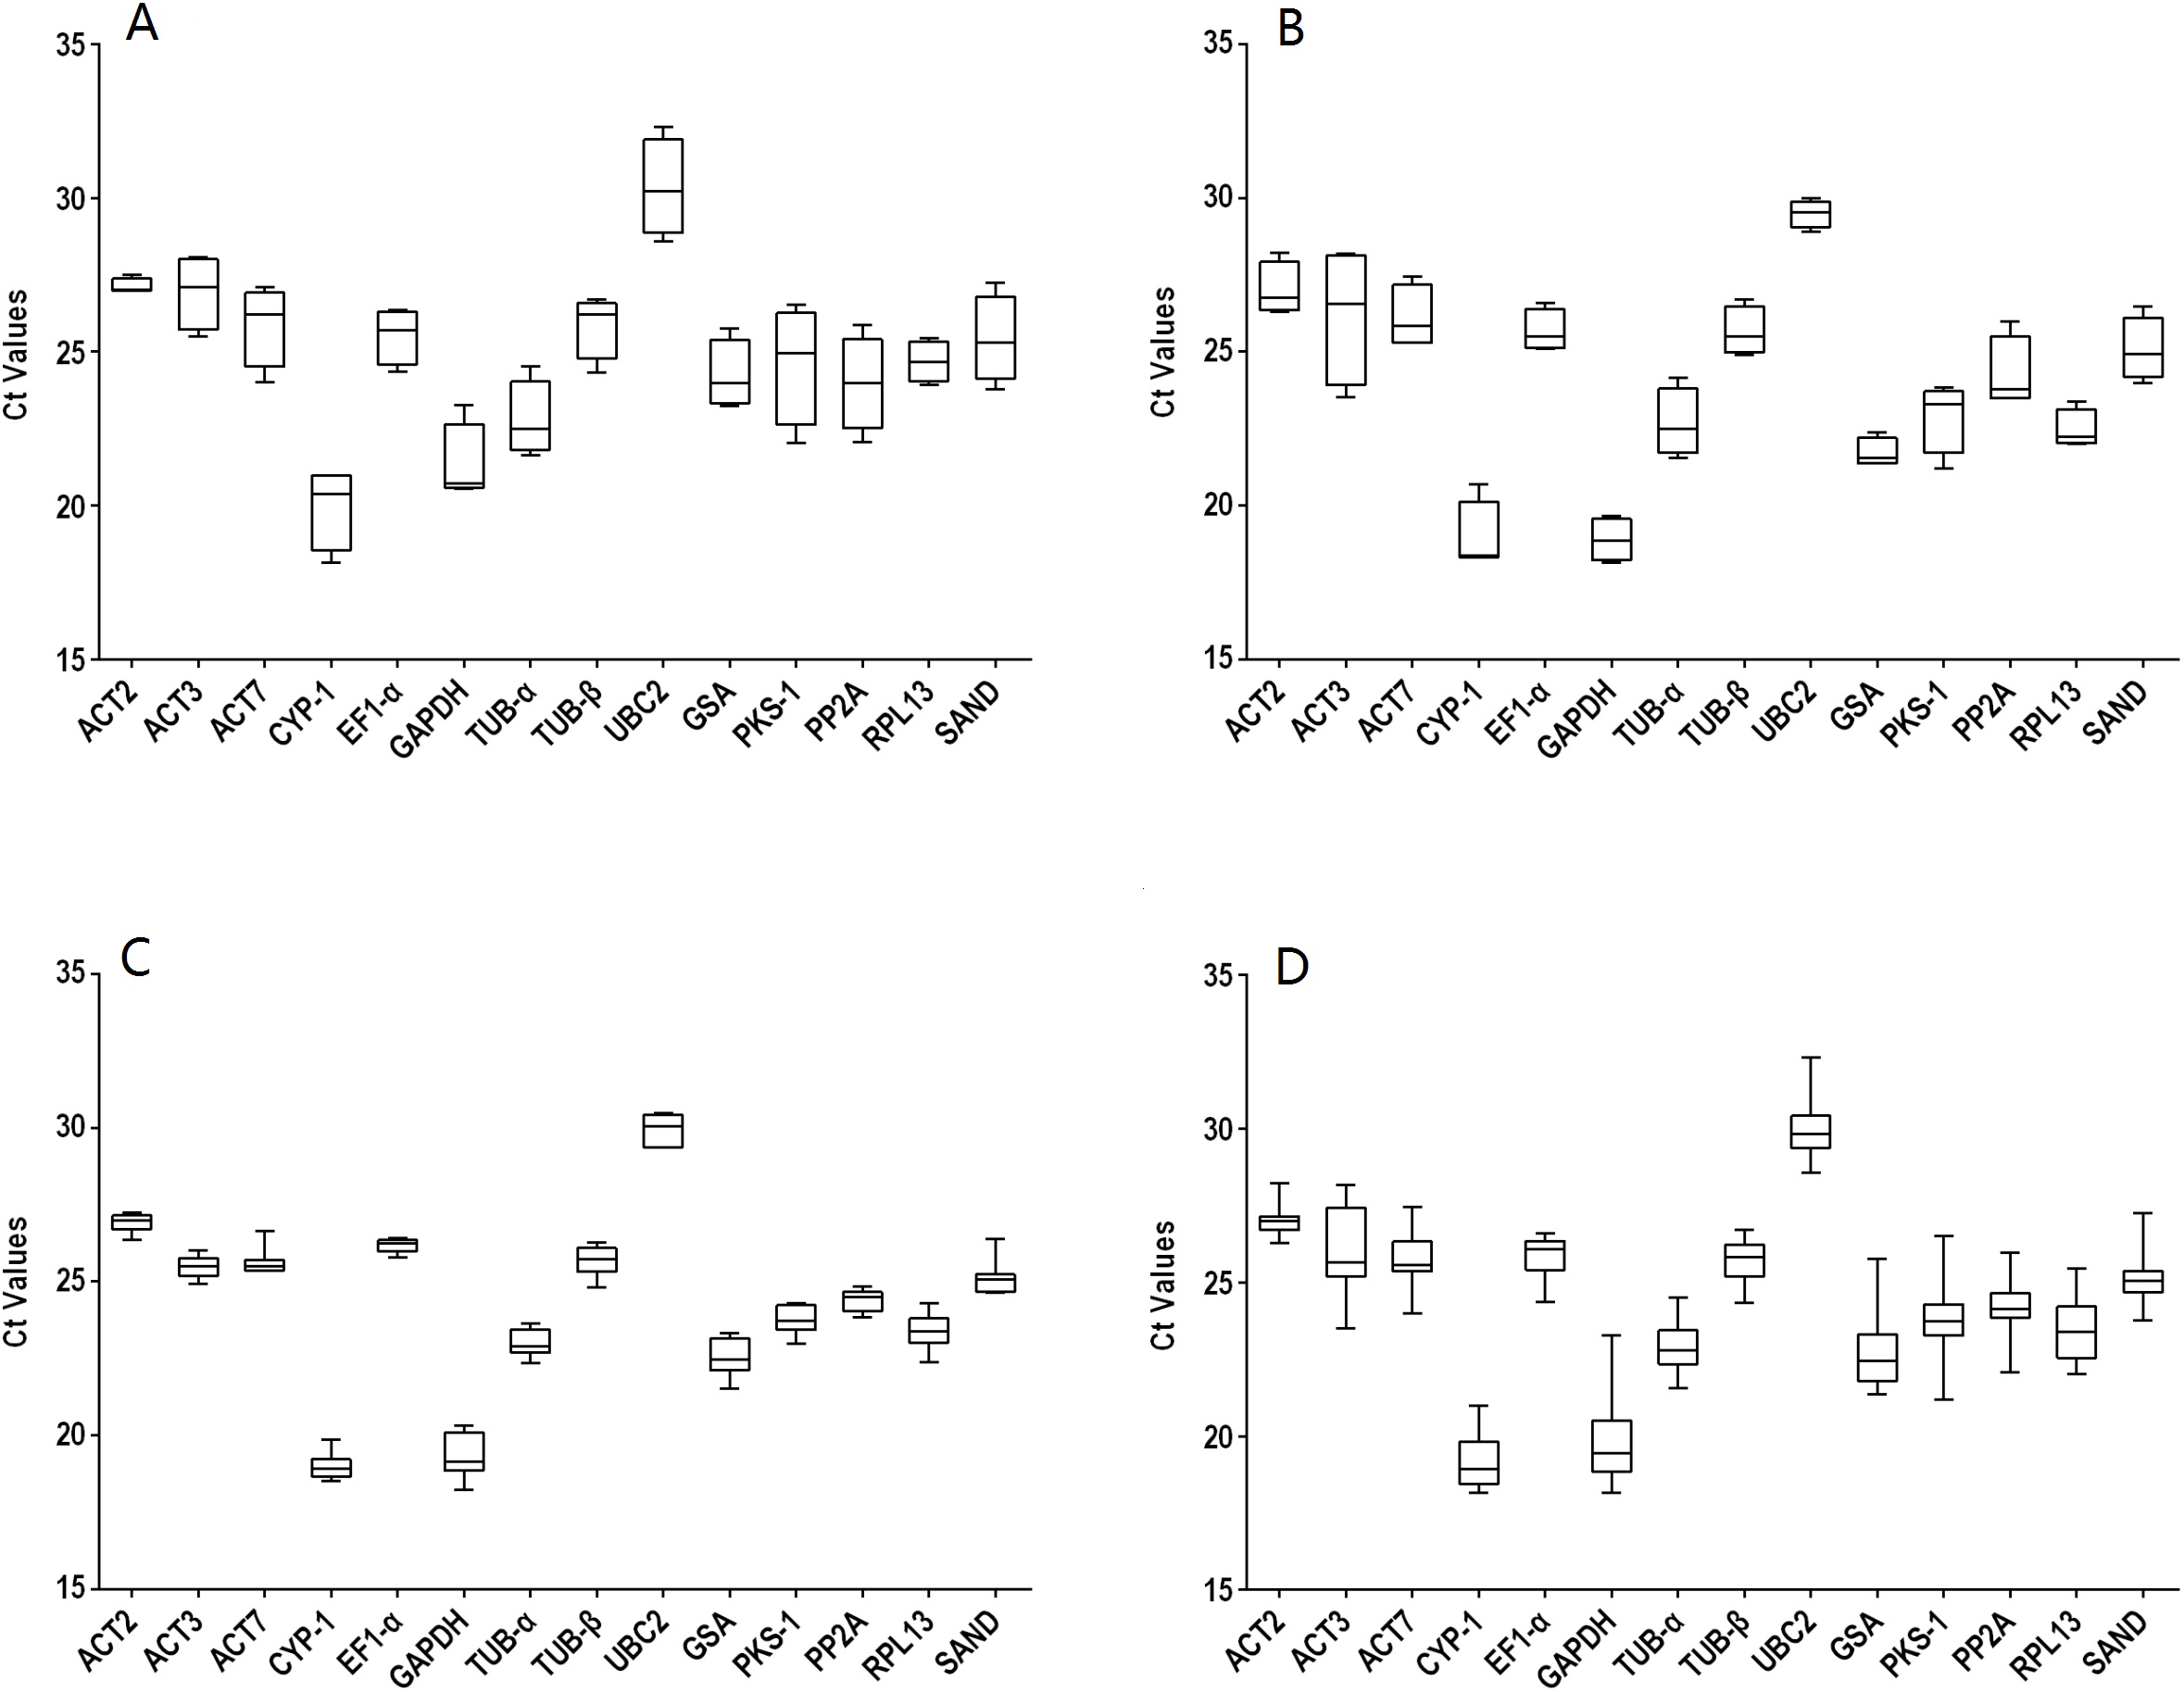
Stability of candidate reference genes
GeNorm was used to calculate the normalization factor from the geometric mean of the genes to identify the most stably expressed gene. The M-value is defined as the average pairwise variation of a particular gene with all other potential reference genes. The expression stability ranking of the 14 reference genes in the TT samples was arranged as follows: TUB-β > ACT2 > CYP1 > EF1-α > TUB-α > SAND > UBC2 > ACT7 > PP2A > GSA > PKS1 > RPL13 > GAPDH > ACT3. Except for in the TT group, ACT2 and ACT3 were the genes with the lowest and highest M-values, respectively, (Fig. 2; Table S4). The V2/3 values for almost all of the experimental sets in H. perforatum were lower than the cut-off threshold of 0.15 (Fig. 3), which indicated that the combination of two reference genes (ACT2 and TUB-β, or ACT2 and EF1-a) can accurately standardize these samples. For the TT group, V2/3 was 0.2039, which indicated that the top three reference genes (ACT2, TUB-β, and CYP1) were required for accurate normalization.

Figure 2: Average expression stability (M-value) of the 14 candidate reference genes calculated using GeNorm.
(A) different tissues, (B) developmental stage seedlings, (C) stress-treated seedlings, and (D) data from all experimental groups combined. Lower average expression stability (M-value) indicates more stable expression.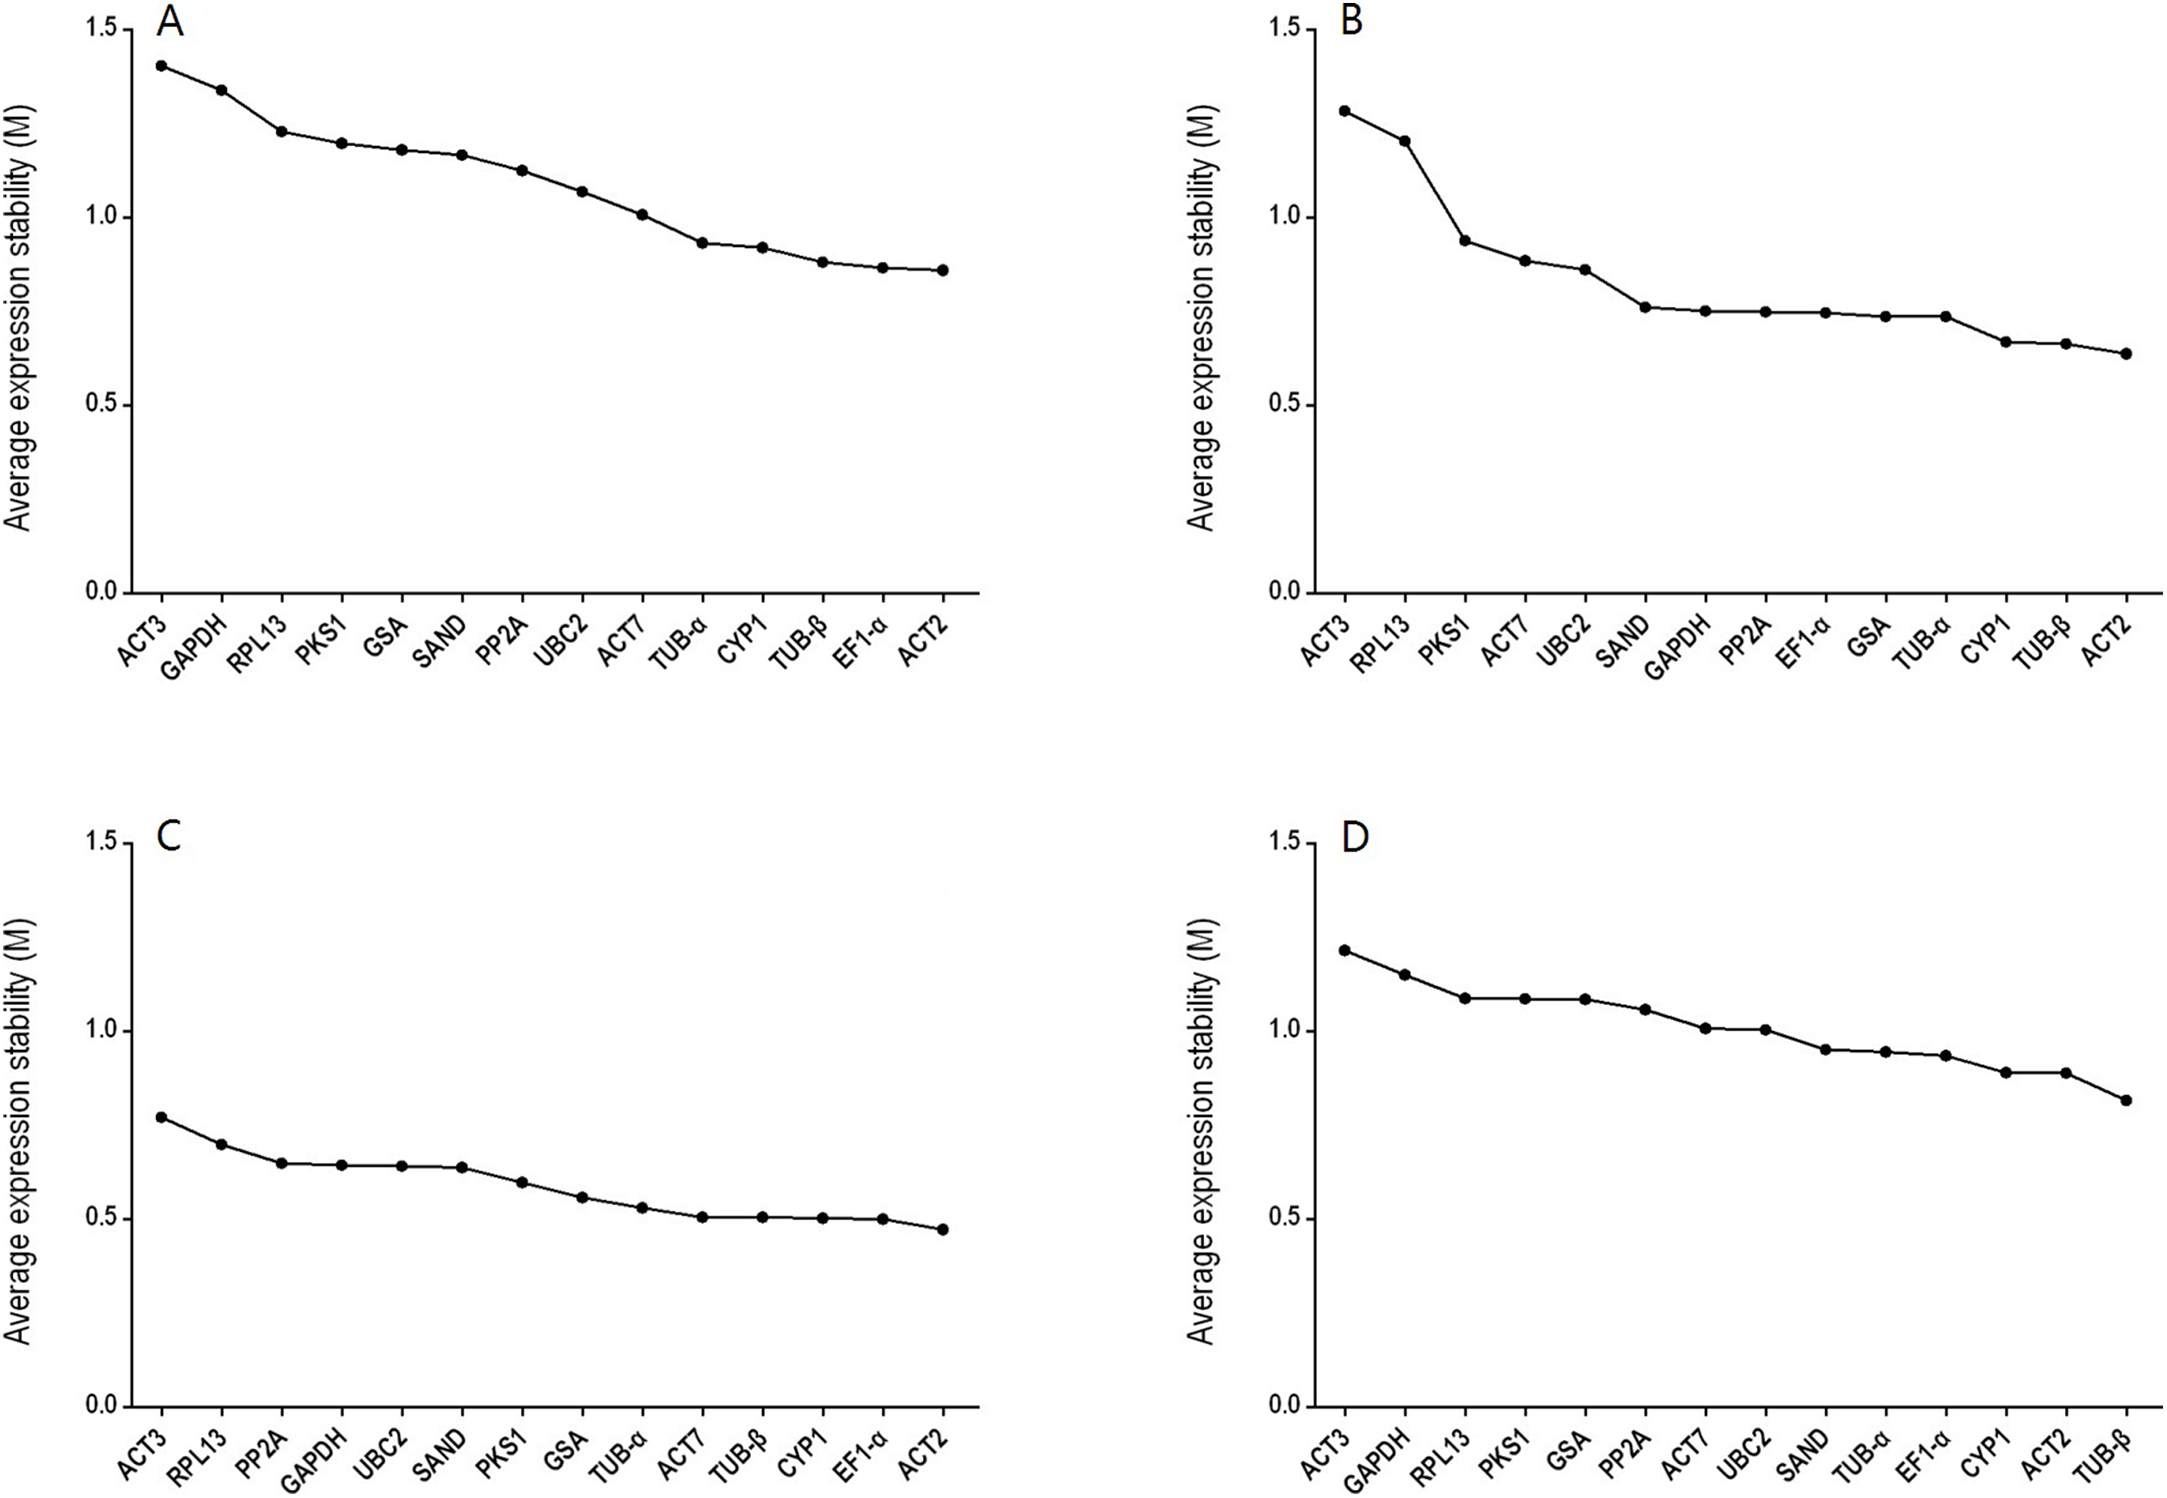
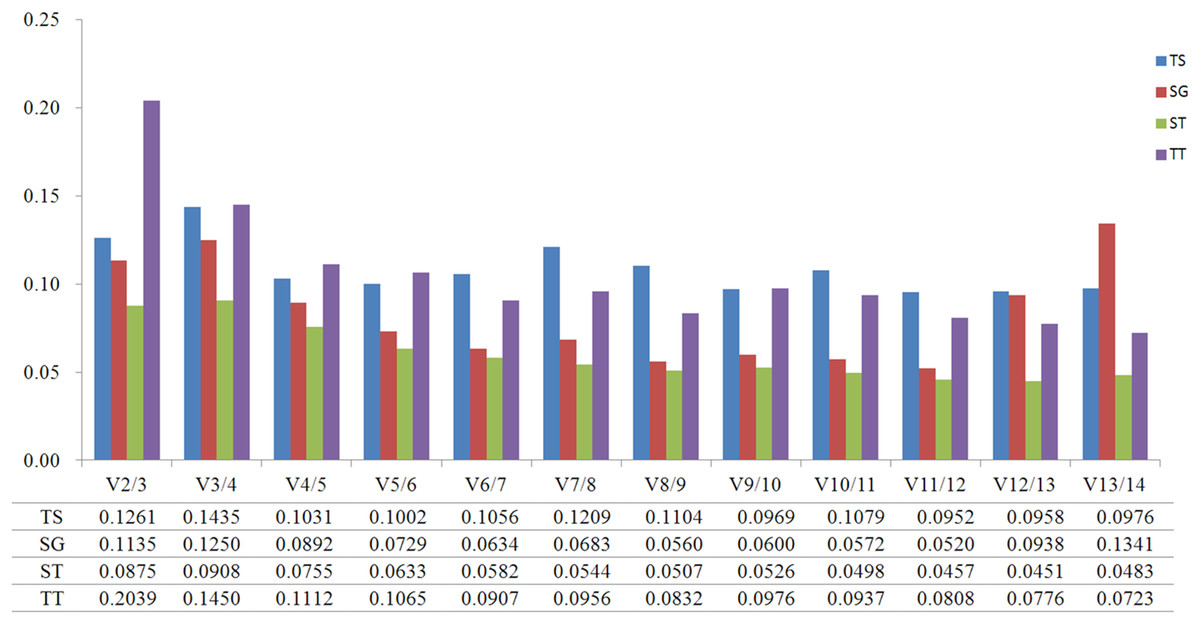
Figure 3: Pairwise variation (V) calculated using GeNorm to determine the optimal number of reference genes.
(TS) different tissues, (SG) developmental stage seedlings, (ST) stress-treated seedlings, and (TT) data from all experimental groups combined. The average pairwise variations Vn/Vn+1 were analyzed between the normalization factors NFn and NFn+1 to indicate the optimal number of reference genes in different samples.
NormFinder with lower values indicating higher stability is another Excel application that ranks the candidate genes based on their minimal combined inter- and intragroup variation of expression. The results (Table 2) indicated that ACT2 was the most stable gene in the SG and ST groups. EF1-α and TUB-β ranked first in the TS and TT groups respectively. ACT3 was at the end of the rankings in all groups calculated using NormFinder. The stability order of the candidate genes calculated using NormFinder was nearly the same as that calculated using GeNorm, although there was a small difference. For example, ACT2 was identified as the most stable reference gene in the TS group with the GeNorm analysis, while its stability rankings placed it third within the NormFinder analysis.
| Rank | TS | SG | ST | TT | ||||
|---|---|---|---|---|---|---|---|---|
| Gene | Stability value | Gene | Stability value | Gene | Stability value | Gene | Stability value | |
| 1 | EF1-α | 0.090 | ACT2 | 0.048 | ACT2 | 0.141 | TUB-β | 0.246 |
| 2 | TUB-β | 0.248 | TUB-β | 0.048 | ACT7 | 0.179 | ACT2 | 0.332 |
| 3 | ACT2 | 0.323 | TUB-α | 0.190 | EF1-α | 0.194 | CYP1 | 0.346 |
| 4 | CYP1 | 0.371 | EF1-α | 0.205 | TUB | 0.195 | EF1-α | 0.398 |
| 5 | ACT7 | 0.462 | CYP1 | 0.251 | CYP1 | 0.205 | TUB-α | 0.445 |
| 6 | UBC2 | 0.521 | GSA | 0.304 | TUA | 0.247 | SAND | 0.453 |
| 7 | GSA | 0.620 | GAPDH | 0.308 | GSA | 0.262 | ACT7 | 0.511 |
| 8 | PP2A | 0.644 | PP2A | 0.325 | PKS1 | 0.311 | UBC2 | 0.532 |
| 9 | GAPDH | 0.653 | SAND | 0.337 | SAND | 0.335 | PKS1 | 0.562 |
| 10 | PKS1 | 0.663 | UBC2 | 0.487 | UBC2 | 0.341 | PP2A | 0.586 |
| 11 | SAND | 0.687 | RPL13 | 0.491 | RPL13 | 0.353 | RPL13 | 0.594 |
| 12 | TUB-α | 0.710 | ACT7 | 0.540 | GAPDH | 0.375 | GSA | 0.602 |
| 13 | RPL13 | 0.789 | PKS1 | 0.771 | PP2A | 0.401 | GAPDH | 0.668 |
| 14 | ACT3 | 0.934 | ACT3 | 1.297 | ACT3 | 0.462 | ACT3 | 0.688 |
Note:
(TS) Different tissues, (SG) developmental stage seedlings, (ST) stress-treated seedlings, and (TT) data from all experimental conditions combined.
BestKeeper is another Excel-based program and is able to compare the expression levels of up to 10 target genes, each in up to 100 biological samples. The CV and SD values of the 14 candidate genes computed using BestKeeper are represented in Table 3. The smaller the SD and the CV values are, the better the stability of the internal reference genes. The expression of the reference gene was unstable when SD value is greater than one. The results revealed that ACT2 was the most stable genes for the ST and TT samples, while TUB-β ranked first in the TS and SG samples.
| Rank | TS | SG | ST | TT | ||||||||
|---|---|---|---|---|---|---|---|---|---|---|---|---|
| Gene | SD | CV | Gene | SD | CV | Gene | SD | CV | Gene | SD | CV | |
| 1 | TUB-β | 0.184 | 0.677 | TUB-β | 0.294 | 0.996 | ACT2 | 0.181 | 0.692 | ACT2 | 0.303 | 1.121 |
| 2 | RPL13 | 0.520 | 2.106 | ACT2 | 0.329 | 1.514 | EF1-α | 0.231 | 0.857 | TUB-β | 0.551 | 2.145 |
| 3 | CYP-1 | 0.766 | 2.963 | GSA | 0.454 | 2.020 | CYP-1 | 0.274 | 1.070 | CYP1 | 0.597 | 2.308 |
| 4 | TUB-α | 0.798 | 3.291 | RPL13 | 0.585 | 3.098 | TUB-β | 0.281 | 1.103 | TUB-α | 0.606 | 2.650 |
| 5 | SAND | 0.870 | 3.819 | GAPDH | 0.610 | 2.258 | RPL13 | 0.285 | 1.167 | RPL13 | 0.610 | 2.423 |
| 6 | ACT7 | 0.925 | 3.640 | EF1-α | 0.610 | 2.378 | PKS-1 | 0.319 | 1.678 | EF1-α | 0.628 | 2.099 |
| 7 | ACT2 | 0.943 | 3.641 | SAND | 0.695 | 2.771 | TUB-α | 0.356 | 1.499 | ACT7 | 0.633 | 2.452 |
| 8 | EF1-α | 0.958 | 3.787 | CYP1 | 0.793 | 3.036 | SAND | 0.357 | 1.550 | PP2A | 0.644 | 2.655 |
| 9 | GAPDH | 0.976 | 4.580 | TUB-α | 0.803 | 3.540 | ACT3 | 0.362 | 1.440 | SAND | 0.763 | 3.248 |
| 10 | ACT3 | 0.985 | 3.656 | UBC2 | 0.833 | 3.211 | PP2A | 0.378 | 1.471 | UBC2 | 0.770 | 4.005 |
| 11 | PP2A | 0.995 | 4.151 | PKS-1 | 0.855 | 3.732 | ACT7 | 0.399 | 1.705 | PKS1 | 0.831 | 3.498 |
| 12 | GSA | 1.013 | 5.071 | PP2A | 0.859 | 3.539 | UBC2 | 0.436 | 1.457 | GSA | 0.893 | 3.928 |
| 13 | UBC2 | 1.165 | 3.841 | ACT7 | 0.873 | 4.605 | GSA | 0.471 | 2.090 | GAPDH | 0.947 | 4.803 |
| 14 | PKS-1 | 1.393 | 5.655 | ACT3 | 1.888 | 7.201 | GAPDH | 0.562 | 2.909 | ACT3 | 1.039 | 3.989 |
Note:
(TS) Different tissues, (SG) developmental stage seedlings, (ST) stress-treated seedlings, and (TT) data from all experimental conditions combined.
Reference gene validation
To test the reliability of the results, the relative expression patterns of the target gene HpHYP1, which belongs to the PR-10 family and is associated with stress control, were evaluated using different internal control genes in the roots, stems, leaves, and flowers. Based on the results of the present study, the top two stable genes (ACT2 and TUB-β) and the most unstable gene (ACT3) were chosen as internal controls. As shown in Fig. 4, when normalized using ACT2 as the reference genes, the transcript abundance of HpHYP1 was upregulated compared with the results in the root samples. When ACT2 and TUB-β (as identified using GeNorm) were used as the internal references, the expression patterns were similar to those obtain with ACT2. When normalization was based on TUB-β alone, the expression level of HpHYP1 was still up-regulated. The only difference was that the expression level in stems was lower than that in leaves, although the difference was not significant. In general, when stable reference genes, including ACT2, TUB-β, and their combination, were used as internal parameters, HpHYP1 had the highest expression level in flowers. When normalized using the less stable gene ACT3, the target genes in all tissues were expressed at lower levels but showed significantly up-regulation (P < 0.001). Thus, the selection of inappropriate reference genes can lead to over- or under-estimation of the relative transcript level, which might lead to a biased result.
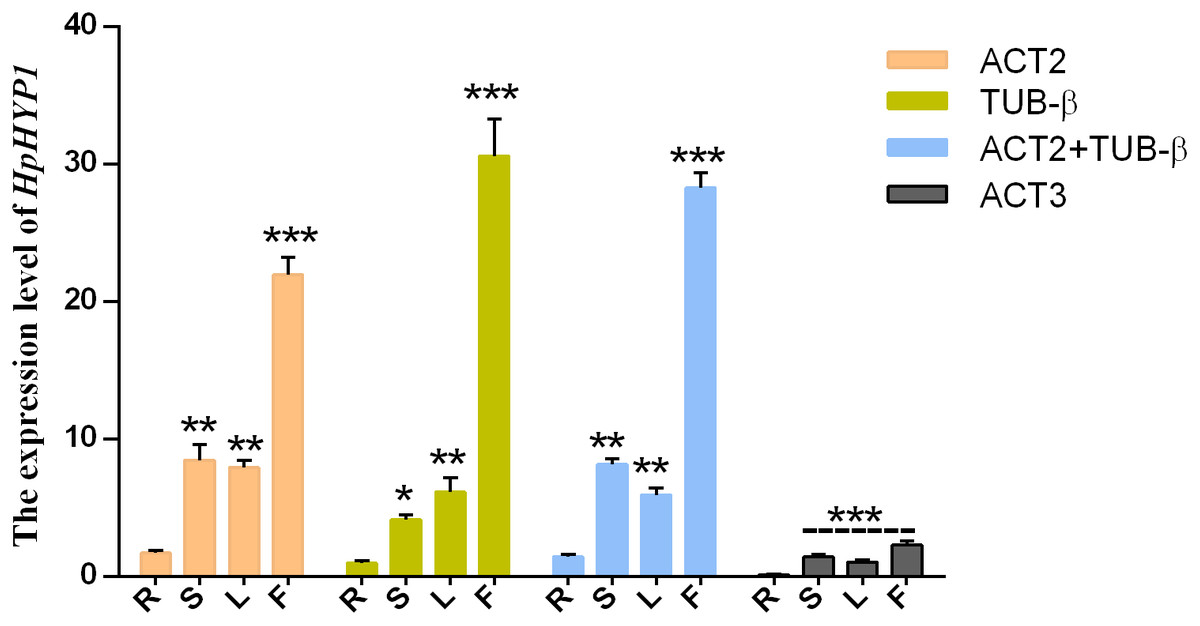
Figure 4: Relative expression levels of HpHYP1 in (R) root, (S) stem, (L) leaf, and (F) flower used for normalization using the most stable reference genes or a combination and the least stable genes.
Error bars indicate the mean standard error calculated from three biological replicates. The statistical level was according to ∗P < 0.05, ∗∗P < 0.01, and ∗∗∗P < 0.001.
Discussion
The reliability of qRT-PCR data will be greatly improved by the inclusion of a reference gene with a transcription level that is invariable across different experimental conditions. Numerous published studies have verified some common reference genes, especially the HKGs, in many species, such as in Arabidopsis thaliana (Dekkers et al., 2012), Salvia miltiorrhiza (Espinosa et al., 2015), Cucumis sativus (Yi et al., 2004), Gentiana macrophylla (Aleksandar et al., 2004), and Isatis indigotica (Li et al., 2017). In G. macrophylla (He et al., 2016), SAND1 and EF1-α4 were found to be the most suitable overall; GAPC2 and SAND1 were identified as the best reference genes for the roots under abiotic stresses, while SAND1 and EF1-α4 were found to be the best for stressed leaves. For the tung tree, ACT7, UBQ, GAPDH, and EF1-α were the four optimal reference genes in all samples and developing seeds. ACT7, EF1-β, GAPDH, and TEF1 were the top four candidate genes for different tissues. However, the appropriate reference genes for H. perforatum under different experimental conditions had not yet been identified, possibly because there is very limited genomic information for H. perforatum in the NCBI database. With the rapid development of whole-genome sequencing technology, deciphering the genomes of medicinal herbs is a vital step in understanding and improving their medicinal value. For that reason, we assembled the first high-quality sequence of the H. perforatum genome. Therefore, the reported literature on H. perforatum (Velada et al., 2014; Yao, 2011) combined with the obtained genomic data provided the foundation for selecting reference genes. Additionally, the HpHYP1 gene, belonging to the PR-10 family associated with stress control, was used for validation of the candidate reference genes.
Housekeeping genes like those that participated in cell structure maintenance (ACT and TUB) or basic cellular processes (UBC and CYP) remain widely applied, but their expression can vary between different types of tissue (normal and pathological samples) and under different treatment conditions (drugs and chemicals) (Thorrez et al., 2008; Robinson, Sutherland & Sutherland, 2007). Thus, normalization with multiple reference genes is becoming a popular and standard practice in plant research (Pfaffl et al., 2004). In this work, 14 reference genes were chosen, including nine traditional HKGs and five potential reference genes. We assessed the expression patterns of these genes in different tissues, in different developmental stages, and under various abiotic stress treatments to identify the most stable HKGs for qRT-PCR analyses. As shown in Fig. 2, no one gene had a constant CT value, demonstrating how important it is to identify the most suitable reference gene for normalizing expression under all detection conditions in H. perforatum.
The analytical procedures applied in our research based on statistical algorithms to assess the stability of reference genes are commonly used by researchers to select the best reference genes (Haller et al., 2004; Jarošová & Kundu, 2010; De Kok et al., 2005; Szabo et al., 2004; Vandesompele et al., 2002). The three algorithms produced different results for the ranking of the 14 candidate reference genes, indicating the importance of using multiple types of software to obtain the best results. Furthermore, a comparison of the results of different algorithms used to assess reference genes results in a better evaluation and reduces the risk of the artificial selection of co-regulated transcripts (Ayers et al., 2007). NormFinder and GeNorm use almost the same arithmetic, but GeNorm is used to determine not only the most stable reference genes but also the optimal number of gene combinations. In the present study, when the data were combined to determine the optimal number of reference genes, the pairwise variation of V2/3 values for all of the experimental sets was lower than the cut- off threshold of 0.15 except for the TT group (Fig. 4). Thus, these results indicate that the best combination (ACT2 and TUB-β, or ACT2 and EF1-a) should be used to improve the accuracy of the quantitative expression analysis of H. perforatum. For the TT group, V2/3 was higher than 0.15, which indicated that the top three reference genes (ACT2, TUB-β, and CYP1) were required for accurate normalization.
In our research, GeNorm and NormFinder produced similar rankings for stability values, while BestKeeper always produced different rankings. Specifically, ACT2 was identified as the most stable gene for the SG and ST groups, and TUB-β was the most stable gene in the TT group according to NormFinder and GeNorm. The difference was that TUB-β was ranked first in the TS and SG groups and that ACT2 was ranked first in the ST and TT groups by BestKeeper. RPL13 was given a relative top ranking in all groups. In contrast, the expression stability value of RPL13 according to GeNorm and NormFinder was very low. Other previous studies have also reported similar differences between BestKeeper and other methods (Rapacz, Stępień & Skorupa, 2012). This variation in the results may be explained by the difference in the algorithms implemented by the three software packages. Homologous genes are widely used as reference genes for gene expression analysis. For example, ACT6, ACT8, and ACT7 were selected as internal controls for stress treatments in Fortunella crassifolia (Pfaffl et al., 2004); UBC19, UBC22, and UBC29 were selected as reference genes in the context of the relevant experimental conditions in I. indigotica (Li et al., 2017); and EF1A2a, EF1A2b, and EF1A1a1 were identified as the best reference genes under all tested conditions in Glycine max (Raman et al., 2015). Nevertheless, as can be seen in our results, the three homologous genes (ACT2, ACT3, and ACT7) exhibited totally different expression levels when used for the normalization of qRT-PCR, especially ACT2 and ACT3 (Tables 2–3; Fig. 3). Therefore, although the paralogous genes have similar structures, their expression levels are entirely different in terms of gene expression quantification.
In summary, our results indicate that the selection of reference genes has a significant impact on the normalized gene expression data in qRT-PCR experiments. We investigated the expression of 14 candidate reference genes across a large number of H. perforatum samples to identify the most stable genes for normalizing gene expression. The results of this study will provide useful information for future genomics and transcriptomics studies on this valuable medicinal plant.
Conclusion
Based on the gene stability analysis, we identified that ACT2 and TUB-β were the most stable combination in different developmental stages samples and all of the experimental samples. ACT2, TUB-β, and EF1-α were considered to be the three most applicable reference genes in different tissues and stress-treated samples. In conclusion, the reference genes identified in this study provides basic background information for qRT-PCR studies in H. perforatum. It will contribute to accurate and consistent expression analysis for functional genomic research.
Supplemental Information
Primer specificity.
Melting curves for the fourteen candidate genes show single peaks. For each sub-graph, temperature is displayed in the x axis, the derivative reporter signal is displayed in the y axis.
Primer efficiency based on standard graphs between target DNA dilutions vs. Ct values of fourteen reference genes.
(A) average Ct values and (B) 2-ΔCt values of fourteen candidate reference genes of Hypericum perforatum in all samples.
M-values of the candidate reference genes calculated by GeNorm.
(TS) Different tissues, (SG) developmental stage seedlings, (ST) stress-treated seedlings, and (TT) data from all experimental conditions combined. Samples with lowest M value show the most stable reference genes and highest M value represents least stable genes.