
The origin of the lower fourth molar in canids, inferred by individual variation
- Published
- Accepted
- Received
- Academic Editor
- Mathew Wedel
- Subject Areas
- Evolutionary Studies, Zoology
- Keywords
- Supernumerary molar, Dental anomaly, Dental formula, Inhibitory cascade
- Copyright
- © 2016 Asahara
- Licence
- This is an open access article distributed under the terms of the Creative Commons Attribution License, which permits unrestricted use, distribution, reproduction and adaptation in any medium and for any purpose provided that it is properly attributed. For attribution, the original author(s), title, publication source (PeerJ) and either DOI or URL of the article must be cited.
- Cite this article
- 2016. The origin of the lower fourth molar in canids, inferred by individual variation. PeerJ 4:e2689 https://doi.org/10.7717/peerj.2689
Abstract
Background
An increase in tooth number is an exception during mammalian evolution. The acquisition of the lower fourth molar in the bat-eared fox (Otocyon megalotis, Canidae, Carnivora, Mammalia) is one example; however, its developmental origin is not clear. In some canids (Canidae), individual variation exist as supernumerary molar M4. This study focuses on the acquisition of the lower fourth molar in canids and proposes that the inhibitory cascade model can explain its origin.
Methods
Occlusal view projected area of lower molars was determined from 740 mandibles obtained from Canis latrans, Nyctereutes procyonoides, and Urocyon cinereoargenteus museum specimens. For each molar, relative sizes of molars (M2/M1 and M3/M1 scores) affected by inhibition/activation dynamics during development, were compared between individuals with and without supernumerary molar (M4).
Results
Possession of a supernumerary molar was associated with significantly larger M2/M1 score in Canis latrans, M3/M1 score in Nyctereutes procyonoides, and M2/M1 and M3/M1 scores in Urocyon cinereoargenteus compared to individuals of these species that lacked supernumerary molars.
Discussion
We propose that, in canids, the supernumerary fourth molar is attributable to reduced inhibition and greater activation during molar development. In the bat-eared fox, altered inhibition and activation dynamics of dental development during omnivorous-insectivorous adaptation may be a contributing factor in the origin of the lower fourth molar.
Introduction
During the evolution of mammalian dentition, the number of teeth usually declines (Davit-Béal, Tucker & Sire, 2009; Ungar, 2010; Jernvall & Thesleff, 2012). While there are possible examples of secondary acquisition of recently lost teeth (M3 in callitrichine monkey: Scott, 2015), increased tooth number is a rare evolutionary event. Only whales (Cetacea), armadillos (Cingulata) and the bat-eared fox (Otocyon megalotis, Canidae, Carnivora) have evolved to increase the number of permanent teeth beyond the ancestral eutherian basic dental formula (I 3/3, C1/1, P 4/4 M 3/3) (Ungar, 2010). Some species, such as the manatee (Trichechus, Trichechidae, Sirenia), pigmy rock wallaby (Petrogale concinna, Macropodidae, Marsupialia), and silvery mole-rat (Heliophobius argenteocinereus, Bathyergidae, Rodentia), exhibit continuous horizontal replacement of teeth (Ungar, 2010; Gomes Rodrigues et al., 2011). However, only the bat-eared fox (O. megalotis) has shown an increase in tooth number, accompanied by neither morphological simplification nor continuous horizontal replacement. The dental formula in the bat-eared fox is I 3/3, C1/1, P 4/4 M 3–4/4–5, with these animal usually possessing an upper M3 and lower M4 that ancestral Canidae lacked (Sillero-Zubiri, 2009; Ungar, 2010), and this is considered a rare case of increased functional teeth number beyond that of the extant eutherian basic dental formula (Sillero-Zubiri, 2009; Ungar, 2010).
Bat-eared foxes are primarily insectivorous (Sillero-Zubiri, 2009), with a molar morphology comprising an undeveloped carnassial blade, equally sized molars (in relation to the other canids) and increased number of molars, which are attributable to an adaptation to an insectivorous diet (Wang & Tedford, 2008; Asahara, 2013; Asahara et al., 2016). It has been proposed that this dentition is suitable to a diet of insects that are small relative to the body size of the bat-eared fox, with a larger molar row grinding surface that enables greater chewing efficiency (Asahara, 2013; Asahara et al., 2016). However, this does not explain the presence of the fourth molar, the developmental origin of which remains unclear.
Individual variations in tooth number (supernumerary and missing teeth) have been reported in many mammals (e.g. Miles & Grigson, 1990). In some cases, as discussed by Asahara, Kryukov & Motokawa (2012), individual variations may underpin evolution, that is, fixation of the variation could initiate a new dental formula. In the present study, the source of the M4 in the bat-eared fox was investigated based on examination of supernumerary teeth in related species.
There are several reports of supernumerary molars in Canidae, including M3 and M4 along the normally aligned tooth row in coyote (Canis latrans) (Hall, 1940; Paradiso, 1966) and gray fox (Urocyon cinereoargenteus) (Hall, 1940). Wolsan (1984) categorized two types of supernumerary tooth generation: (1) creation of additional tooth germ and (2) splitting of a tooth germ. Type 1 can explain most of the supernumerary teeth that appear in positions where the ancestor possessed teeth, whereas type 2 can explain the eruption of supernumerary teeth that possess abnormal morphology relative to adjacent teeth. While the M3 in the coyote can be regarded as type 1 and “atavistic,” M4 is not readily explained in this manner. Although ancestral caniforms possessed M3 (Wang, 1994; Tomiya, 2011), the last ancestor possessing a functional M4 may be as early as the Mesozoic period, since the common ancestor of Placentalia possessed only three lower molars (O’Leary et al., 2013).
A previous experimental study established a developmental model termed the inhibitory cascade model (IC model) to explain relative molar size among three lower molars in mammals as resulting from the balance of inhibition and activation molecules during dental development (Kavanagh, Evans & Jernvall, 2007). In this model, activation molecules from the mesenchyme stimulate the formation of distal molars (M2 and M3), which makes them larger in relation to M1, whereas inhibition molecules secreted from M1 suppress distal molars growth (M2 and M3) (Kavanagh, Evans & Jernvall, 2007). According to the balance of these two factors, the relative size of M1, M2, and M3 (typically shown numerically as M2/M1 and M3/M1 size ratios; the size is defined as projected tooth area from occlusal view) result in a pattern of M1 > M2 > M3, M1 = M2 = M3, or M1 < M2 < M3 (Kavanagh, Evans & Jernvall, 2007). This model has previously been applied to explain dental variation in Carnivora (Polly, 2007; Halliday & Goswami, 2013; Asahara, 2013; Asahara et al., 2016).
The IC model can also explain the loss of M3 during murine evolution, such that greater inhibition and lower activation in experimental mice organs resulted in the disappearance of M3, coinciding with changes in the M2/M1 and M3/M1 ratios. This corresponds to the dentition of the murine species Hydromys chrysogaster, which lacks the M3 (Kavanagh, Evans & Jernvall, 2007). Asahara (2013) reported the relationship between dental anomalies (M3 loss) and the IC model in canids, in which M2/M1 scores of individuals that lost M3 were lower (indicating higher inhibition and lower activation) than the scores in normal individuals in local populations of raccoon dog (Nyctereutes procyonoides) and arctic fox (Vulpes lagopus) (Asahara, 2013). Evolutionary loss of M3 in murines and canids is thus considered attributable to inhibition/activation dynamics of dental development. Conversely, Kavanagh, Evans & Jernvall (2007) reported one case in which a supernumerary molar (M4) appeared in mice following suppression of inhibition molecules, indicative of an increase in molar number and altered inhibition/activation dynamics.
The working hypothesis for this study is that the fourth lower molars in the bat-eared fox and the supernumerary molar in some other canid species are generated by reduced inhibition and greater activation during dental development. This was tested by comparing the relative size of molars in locations of three canid species with some individuals possessing a supernumerary molar (M4).
Materials and Methods
Mandible specimens (dentary bones and molars) of 451 Canis latrans (from the United States National Museum of Natural History), 153 Nyctereutes procyonoides (from the Primate Research Institute, Kyoto University, Japan), and 136 Urocyon cinereoargenteus (from the United States National Museum of Natural History) were examined. The collection of C. latrans was chosen based on an earlier study using the U.S. collection, which reported the presence of a supernumerary molar M4 in some specimens (Paradiso, 1966). Presence of the supernumerary molar was determined by macroscopic observation. Photographs were taken of the occlusal view of the molar row with scales. Projected areas of M1, M2, and M3 were manually measured using Image J software (NIH, Bethesda, MD, USA). The projected area is defined as molar size, as described by (Kavanagh, Evans & Jernvall, 2007; Asahara, 2013; Asahara, 2014). For specimens of N. procyonoides, most data were derived from Asahara (2014). The ratio of M2 to M1 size (M2/M1) and that of M3 to M1 size (M3/M1) were calculated to compare relative sizes among molars. According to the IC model (Kavanagh, Evans & Jernvall, 2007), lower inhibition and higher activation results in higher M2/M1 and M3/M1 scores, whereas increased inhibition and reduced activation lowers the M2/M1 and M3/M1 scores. M1 size and M2/M1 and M3/M1 scores of individuals with normal dentition, without M3, and with M4 were compared by U-test. Comparisons were performed separately for each species and sample location (as defined by collection source), with analyses performed using Minitab 14 statistical software (Minitab Inc., PA, USA). For data of the bat-eared fox Otocyon megalotis in Fig. 2 is cited from Asahara (2013).
Results
Twelve individuals of C. latrans (2.66% of total 451 individuals), four individuals of N. procyonoides (2.61% of total 153 individuals), and five individuals of U. cinereoargenteus (3.68% of total 136 individuals) possessed an M4 in the normally aligned molar row (Fig. 1), with occurrences differing according to species and specimen location (Table 1). Data relating to M1 size and M2/M1 and M3/M1 scores are presented in Table 1 and Fig. 2. The distribution of specimens with normal dentition represented a typical pattern of interspecific variation among canids (Asahara, 2013) (Fig. 2). M2/M1 and M3/M1 scores per location and per species are also presented (Figs. 3–5).
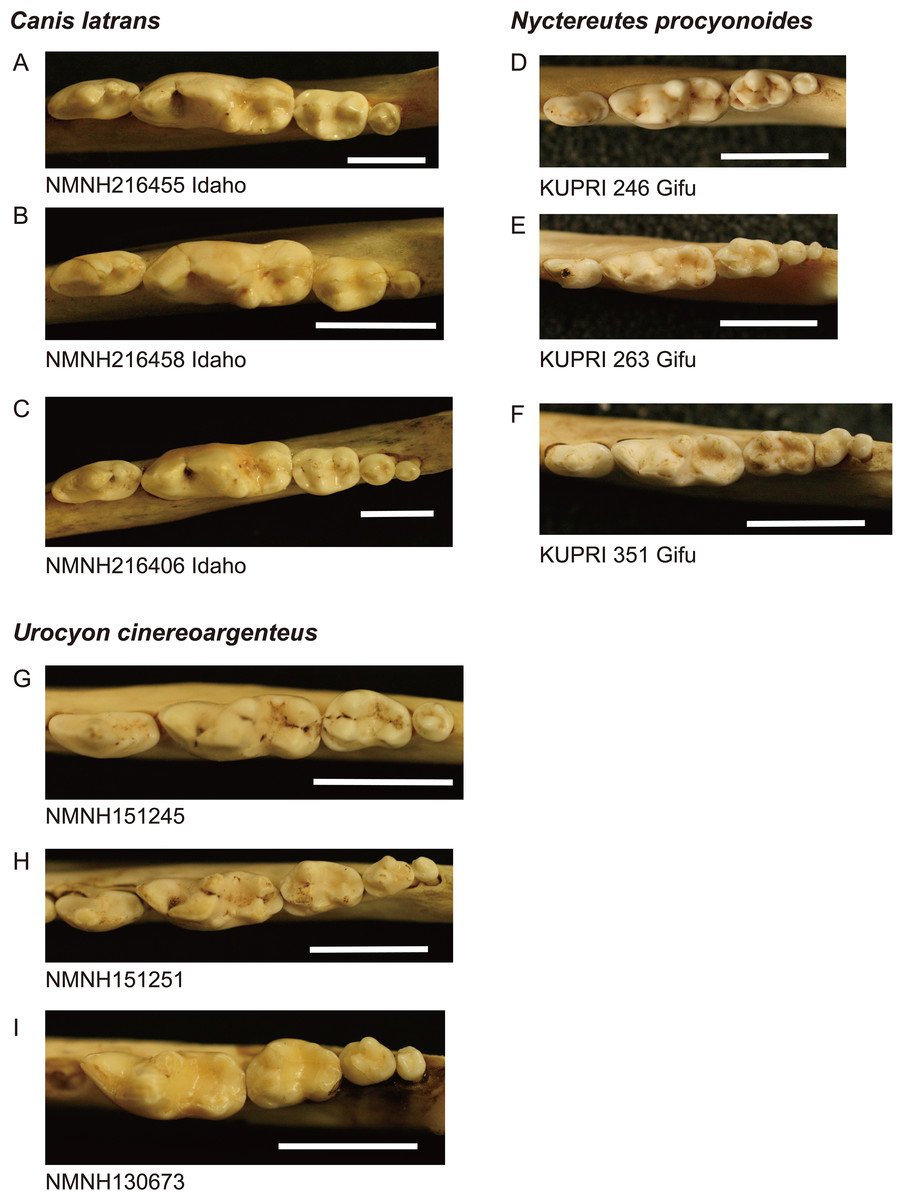
Figure 1: Images of lower molar rows (P4 to M3 or M4) from the occlusal view in the three species examined.
(A–C): coyote Canis latrans, (D–F): raccoon dog Nyctereutes procyonoides, (G–I): gray fox Urocyon cinereoargenteus. Specimens A, B, D, and G possess normal dentition and specimens C, E, F, H, and I possess a supernumerary molar M4. Specimen numbers are depicted below the images. NMNH, the United States National Museum of Natural History, KUPRI, Primate Research Institute, Kyoto University. Scale: 10 mm.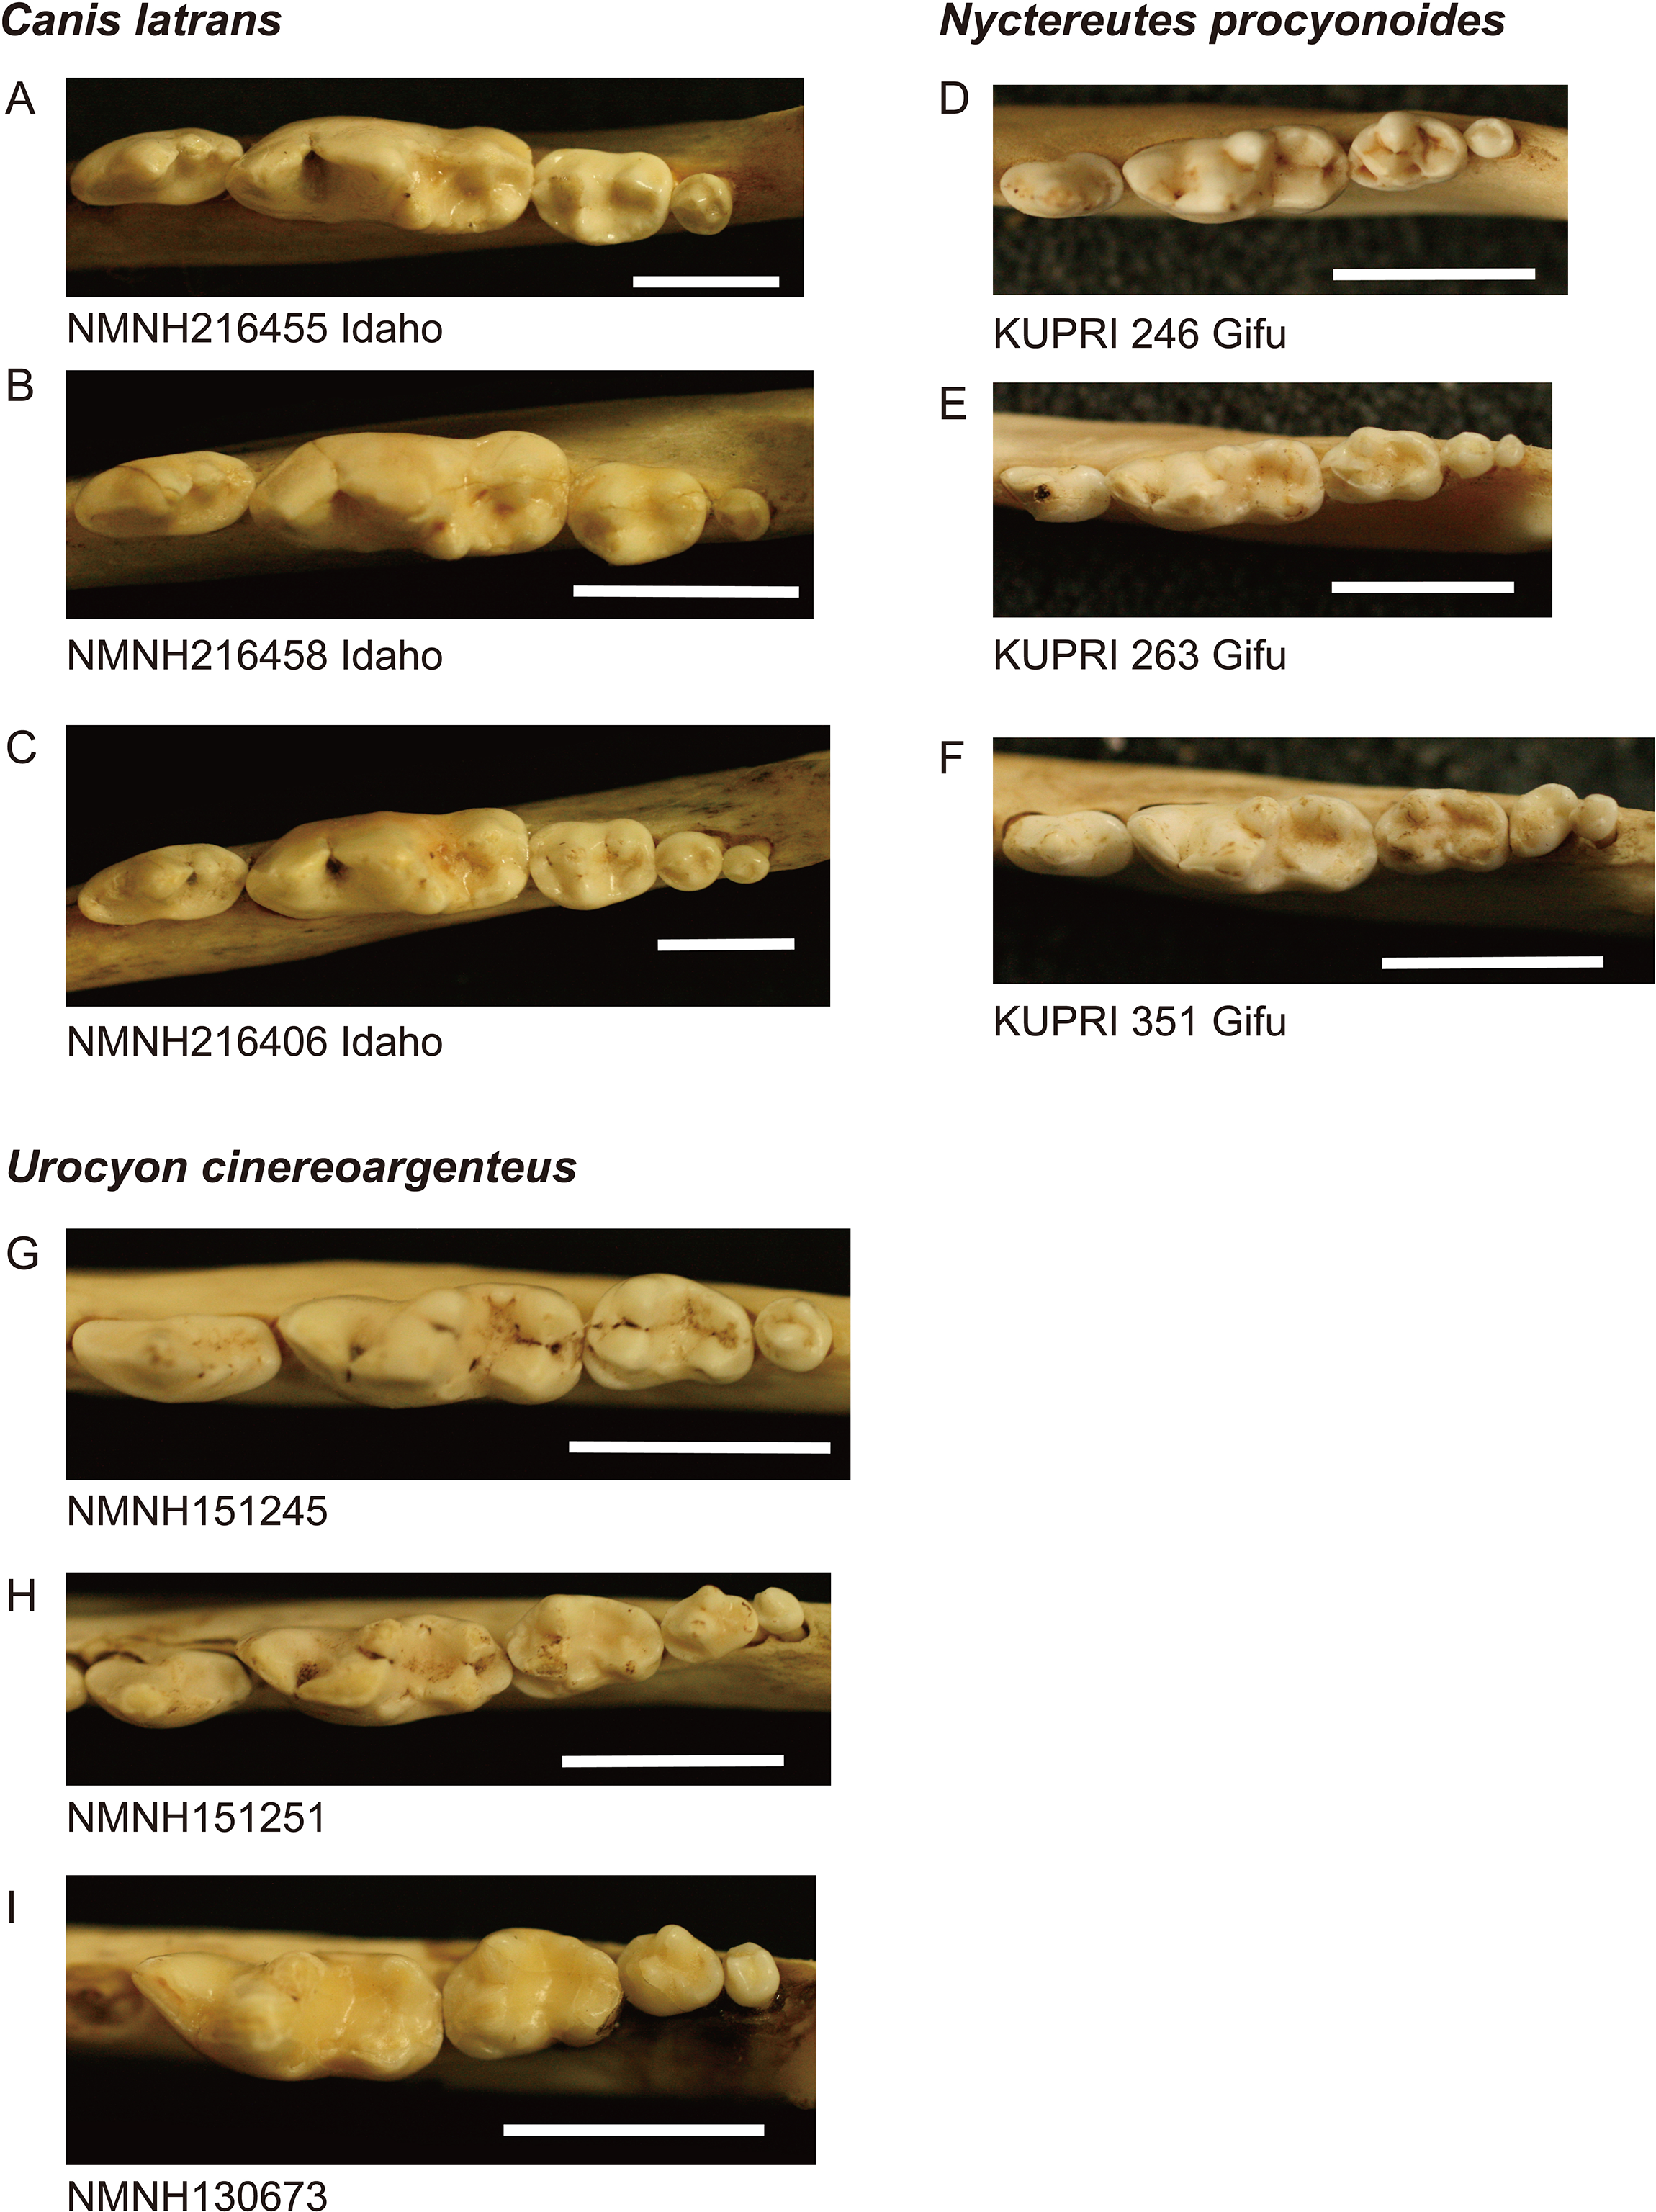
| Species | Location | Dental anomaly | M1 size ± SD | U-test | M2/M1 ± SD | U-test | M3/M1 ± SD | U-test | N | % |
|---|---|---|---|---|---|---|---|---|---|---|
| Canis latrans | Nevada | Normal | 141.00 ± 12.76 | 0.377 ± 0.032 | 0.108 ± 0.019 | 32 | ||||
| M4 present | 138.17 ± 6.13 | 0.742 | 0.414 ± 0.053 | 0.200 | 0.134 ± 0.022 | 0.085 | 2 | 5.88 | ||
| Utah | M3 missing | 136.03 ± | 0.416 ± | ± | 1 | 1.04 | ||||
| Normal | 148.34 ± 14.56 | 0.364 ± 0.031 | 0.113 ± 0.033 | 91 | ||||||
| M4 present | 135.16 ± 15.08 | 0.117 | 0.381 ± 0.044 | 0.442 | 0.113 ± 0.033 | 0.746 | 4 | 4.17 | ||
| Oregon | Normal | 133.94 ± 8.33 | 0.356 ± 0.036 | 0.098 ± 0.017 | 8 | |||||
| M4 present | 126.23 ± | 0.386 ± | 0.125 ± | 1 | 11.11 | |||||
| Idaho | Normal | 146.55 ± 12.50 | 0.372 ± 0.030 | 0.102 ± 0.018 | 77 | |||||
| M4 present | 149.54 ± 15.61 | 0.791 | 0.383 ± 0.003 | 0.585 | 0.112 ± 0.005 | 0.255 | 2 | 2.53 | ||
| Colorado | M3 missing | 167.94 ± 5.76 | 0.008 | 0.342 ± 0.032 | 0.149 | ± | 4 | 1.97 | ||
| Normal | 149.02 ± 13.51 | 0.366 ± 0.029 | 0.102 ± 0.015 | 196 | ||||||
| M4 present | 156.08 ± 22.90 | 0.617 | 0.376 ± 0.015 | 0.483 | 0.097 ± 0.021 | 0.452 | 3 | 1.48 | ||
| California | Normal | 135.38 ± 12.51 | 0.364 ± 0.024 | 0.106 ± 0.016 | 30 | |||||
| M4 present | ± | ± | ± | 0 | 0.00 | |||||
| Total | M3 missing | 161.56 ± 15.12 | 0.030 | 0.357 ± 0.043 | 0.497 | ± | 5 | 1.10 | ||
| Normal | 146.63 ± 13.98 | 0.367 ± 0.030 | 0.103 ± 0.017 | 434 | ||||||
| M4 present | 142.54 ± 17.01 | 0.233 | 0.386 ± 0.032 | 0.045 | 0.113 ± 0.024 | 0.139 | 12 | 2.66 | ||
| Nyctereutes procyonoides | Gifu | M3 missing | 44.32 ± 3.12 | 0.495 | 0.466 ± 0.049 | 0.022 | ± | 13 | 8.50 | |
| Normal | 43.79 ± 3.36 | 0.495 ± 0.040 | 0.118 ± 0.040 | 136 | ||||||
| M4 present | 44.20 ± 1.52 | 0.648 | 0.492 ± 0.019 | 0.840 | 0.153 ± 0.029 | 0.022 | 4 | 2.61 | ||
| Urocyon cinereoargenteus | Arizona | Normal | 46.54 ± 4.31 | 0.522 ± 0.050 | 0.138 ± 0.036 | 28 | ||||
| M4 present | 39.88 ± | 0.628 ± | 0.181 ± | 1 | 3.45 | |||||
| New Mexico | Normal | 47.05 ± 3.53 | 0.518 ± 0.046 | 0.152 ± 0.022 | 103 | |||||
| M4 present | 47.48 ± 1.52 | 0.634 | 0.552 ± 0.023 | 0.075 | 0.205 ± 0.025 | 0.002 | 4 | 3.74 | ||
| Total | Normal | 46.94 ± 3.70 | 0.519 ± 0.047 | 0.149 ± 0.026 | 131 | |||||
| M4 present | 45.96 ± 3.64 | 0.777 | 0.567 ± 0.039 | 0.022 | 0.200 ± 0.024 | 0.001 | 5 | 3.68 | ||
| Otocyon megalotis | M4 present (normal) | 18.81 ± 1.44 | 0.979 ± 0.057 | 0.828 ± 0.065 | 7 |
Note:
Boldface types indicate significance.

Figure 2: Bivariate plots of M2/M1 and M3/M1 scores of all specimens examined in this study and of the bat-eared fox Otocyon megalotis (Asahara, 2013).
Specimens that do and do not possess M4 are depicted separately. The blue line indicates the molar ratio predicted by the inhibitory cascade model, as proposed by Kavanagh, Evans & Jernvall (2007), indicating variability found in molars of different murine species and experimentally generated mice. The red line indicates the trend of the molar ratio among canid species (Asahara, 2013).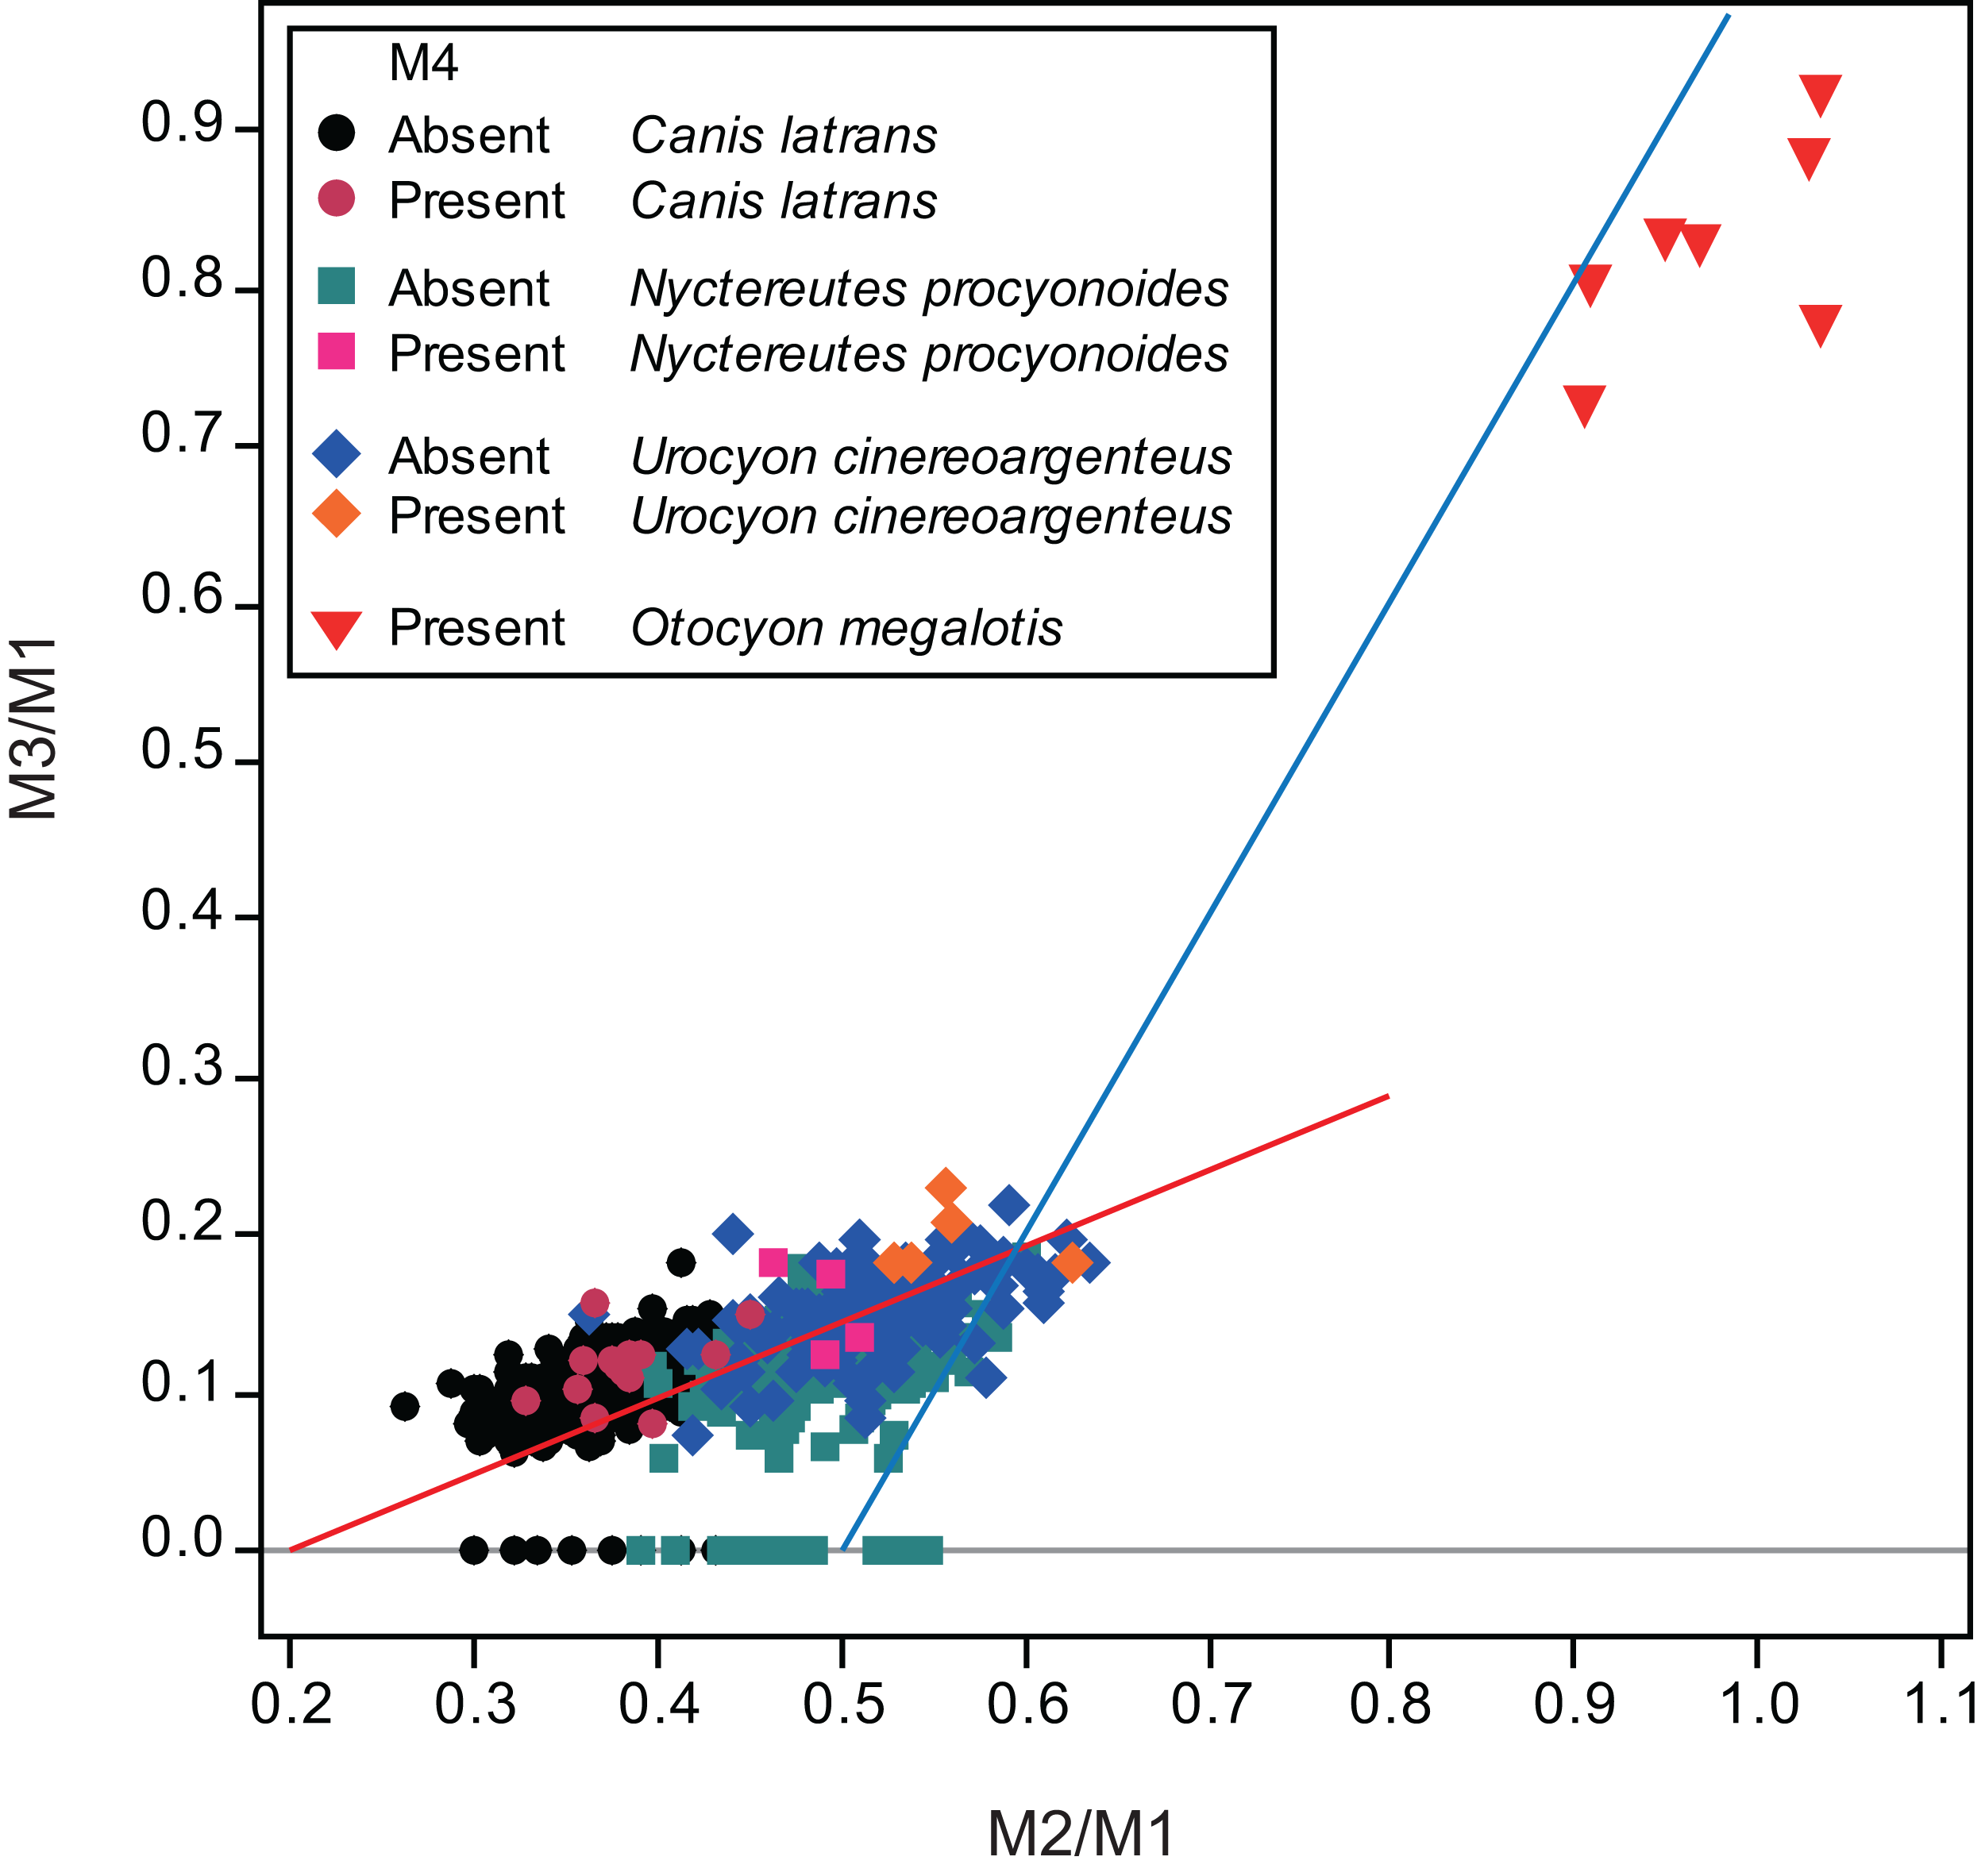
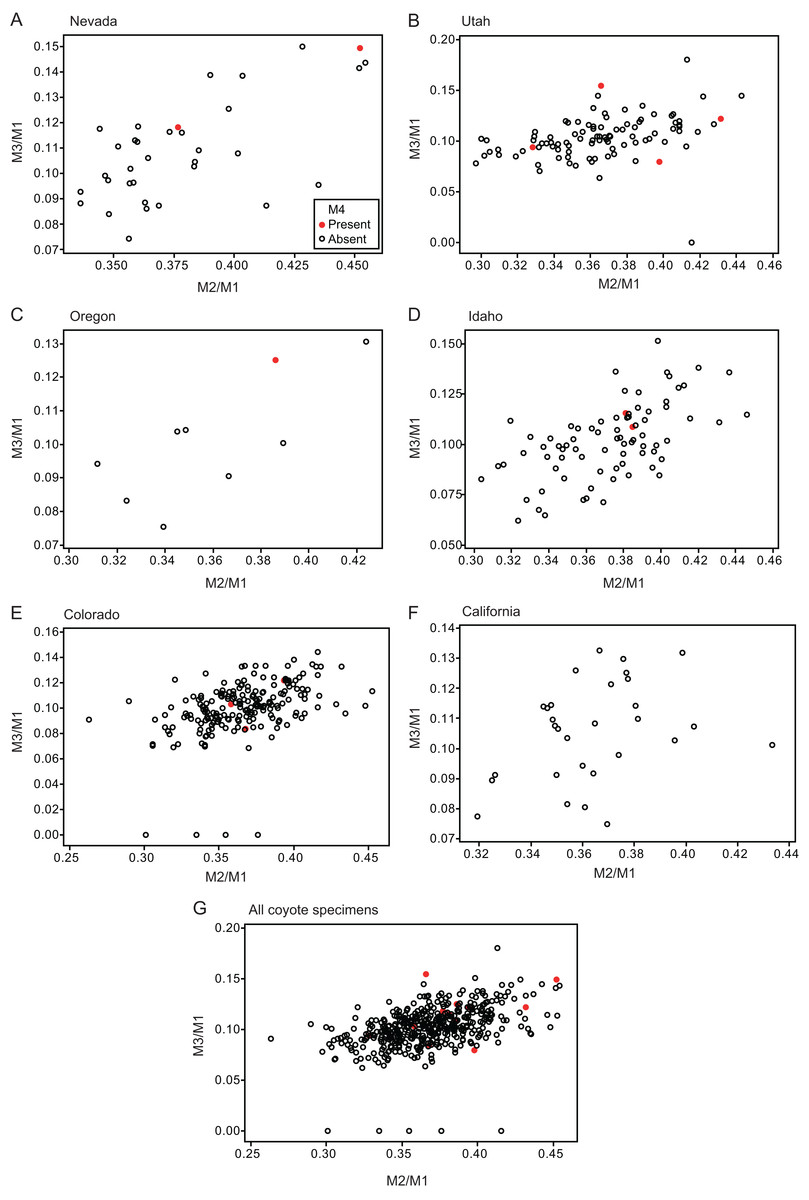
Figure 3: Bivariate plots of M2/M1 and M3/M1 scores among specimens of coyote Canis latrans.
Specimens possessing M4 (red circle) and those lacking M4 (black circle) are shown separately.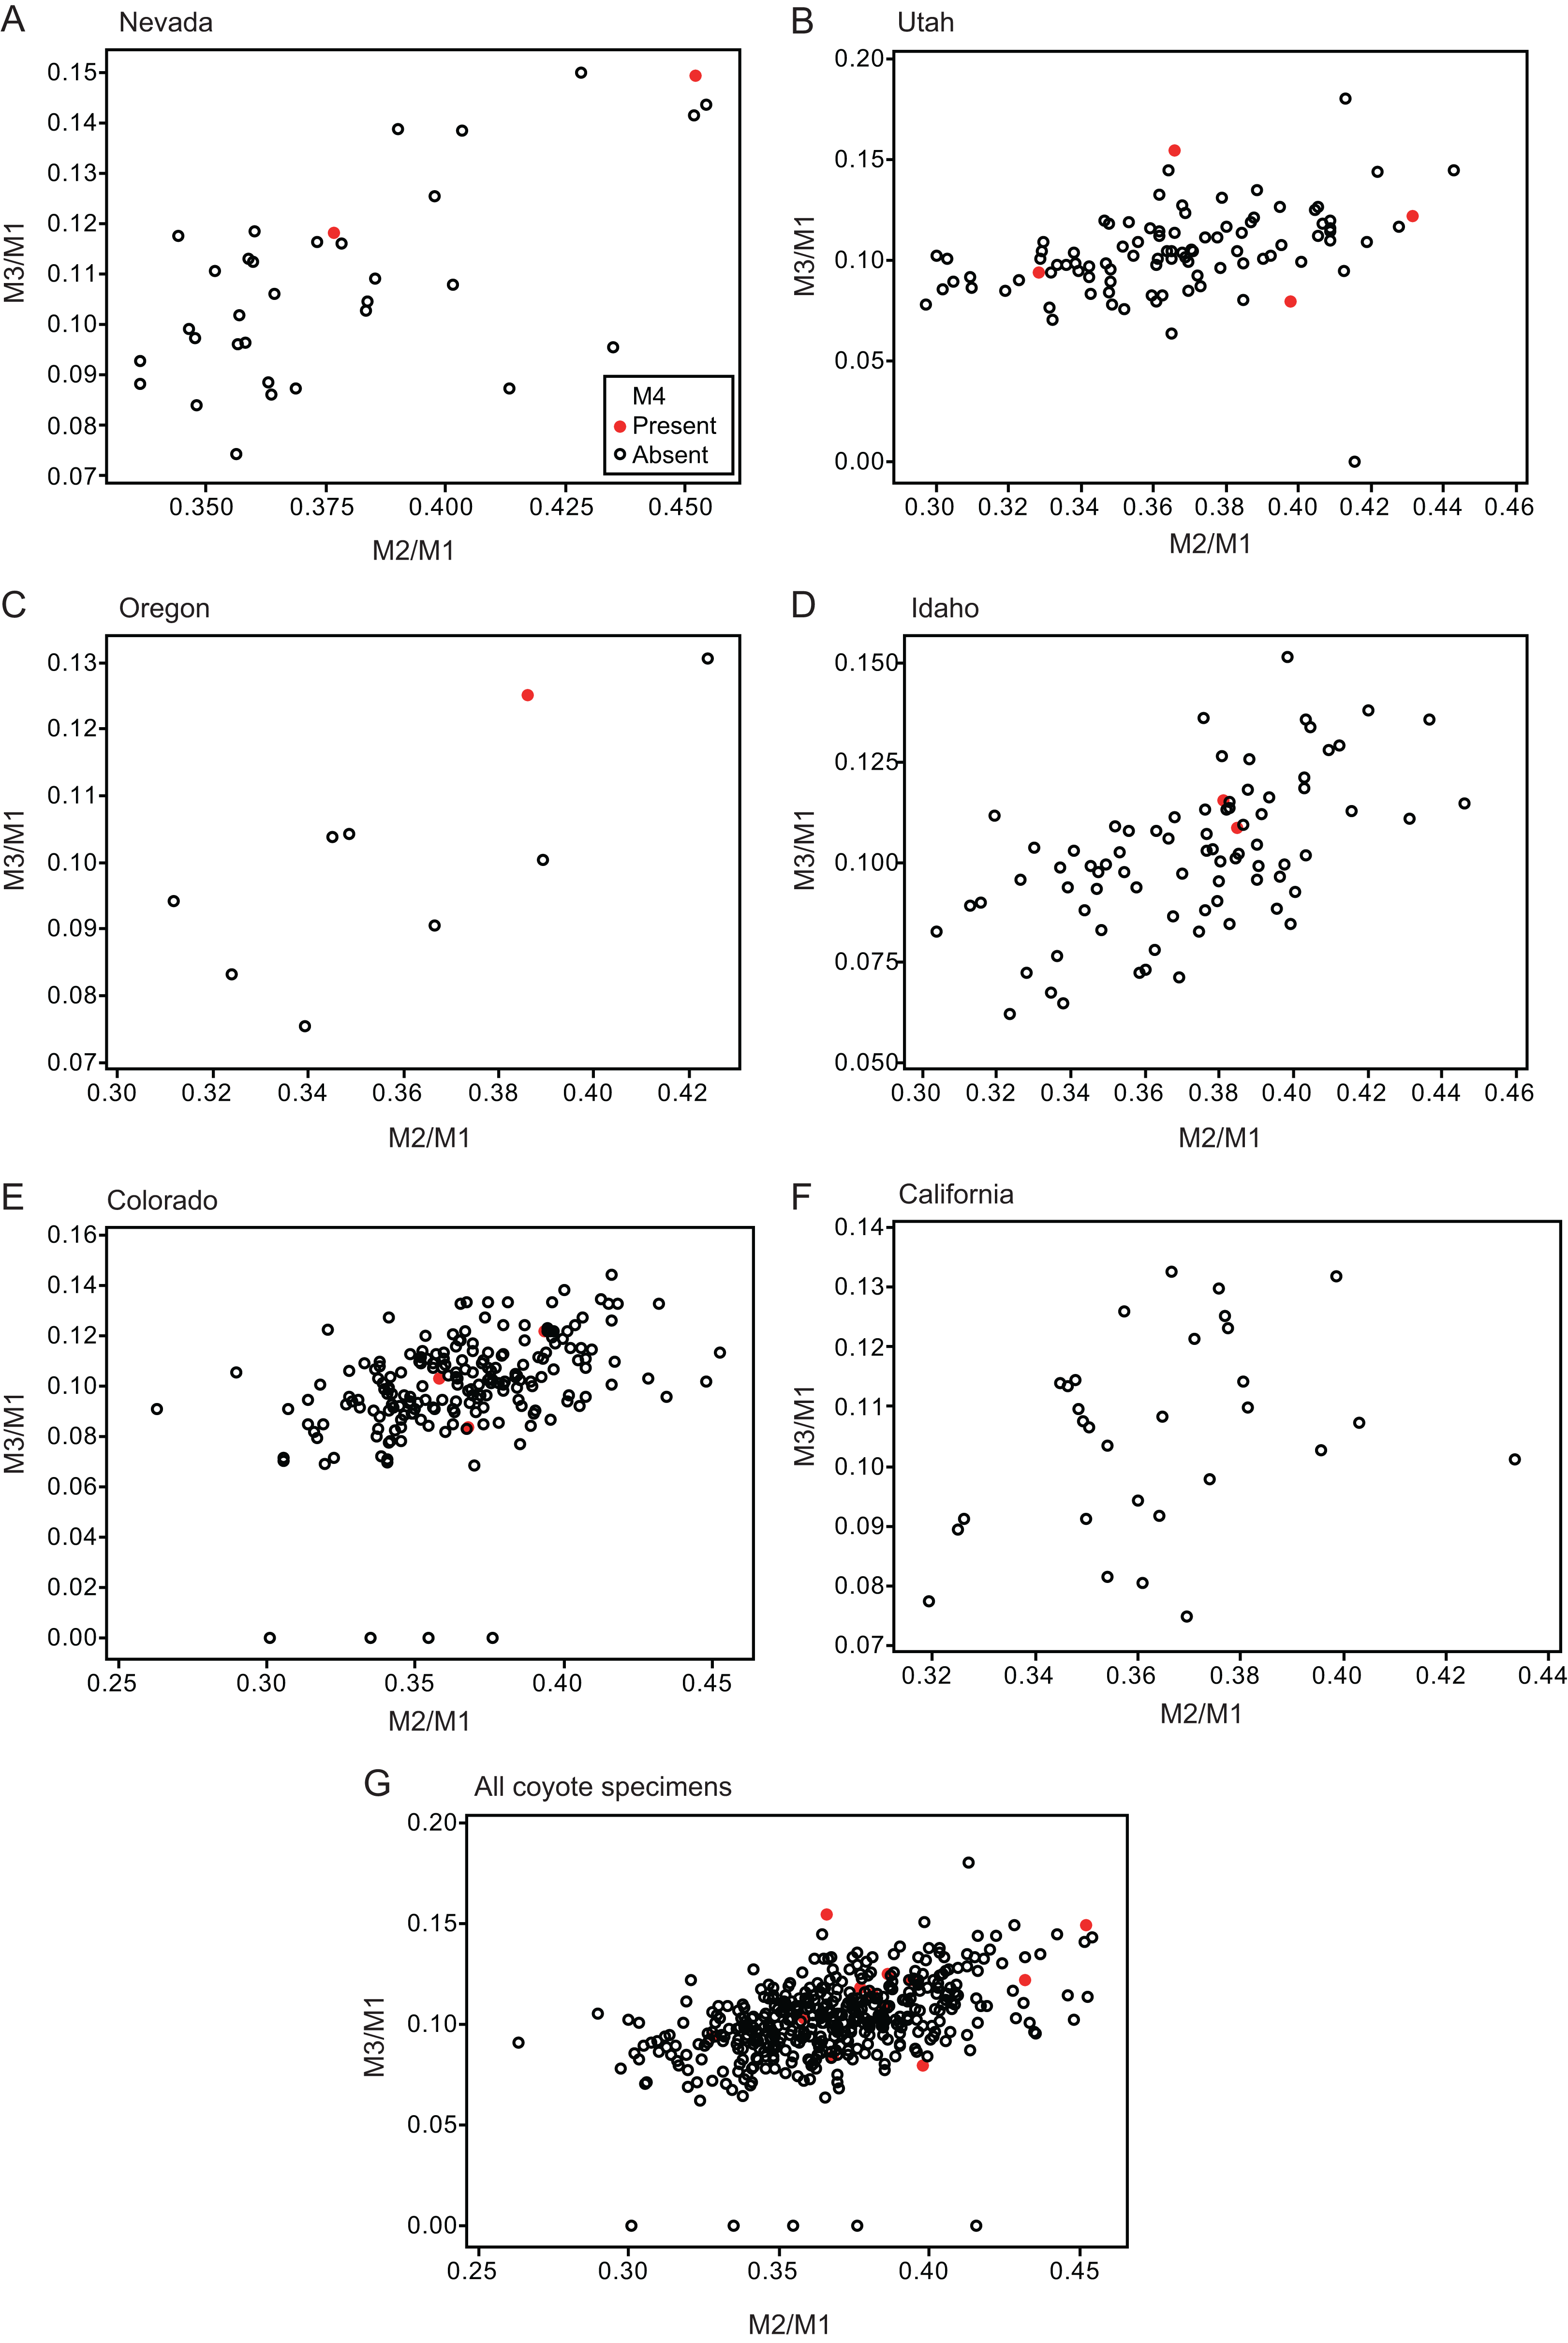

Figure 4: Bivariate plots of M2/M1 and M3/M1 scores among specimens of raccoon dog Nyctereutes procyonoides.
Specimens possessing M4 (red square) and those lacking M4 (black square) are shown separately.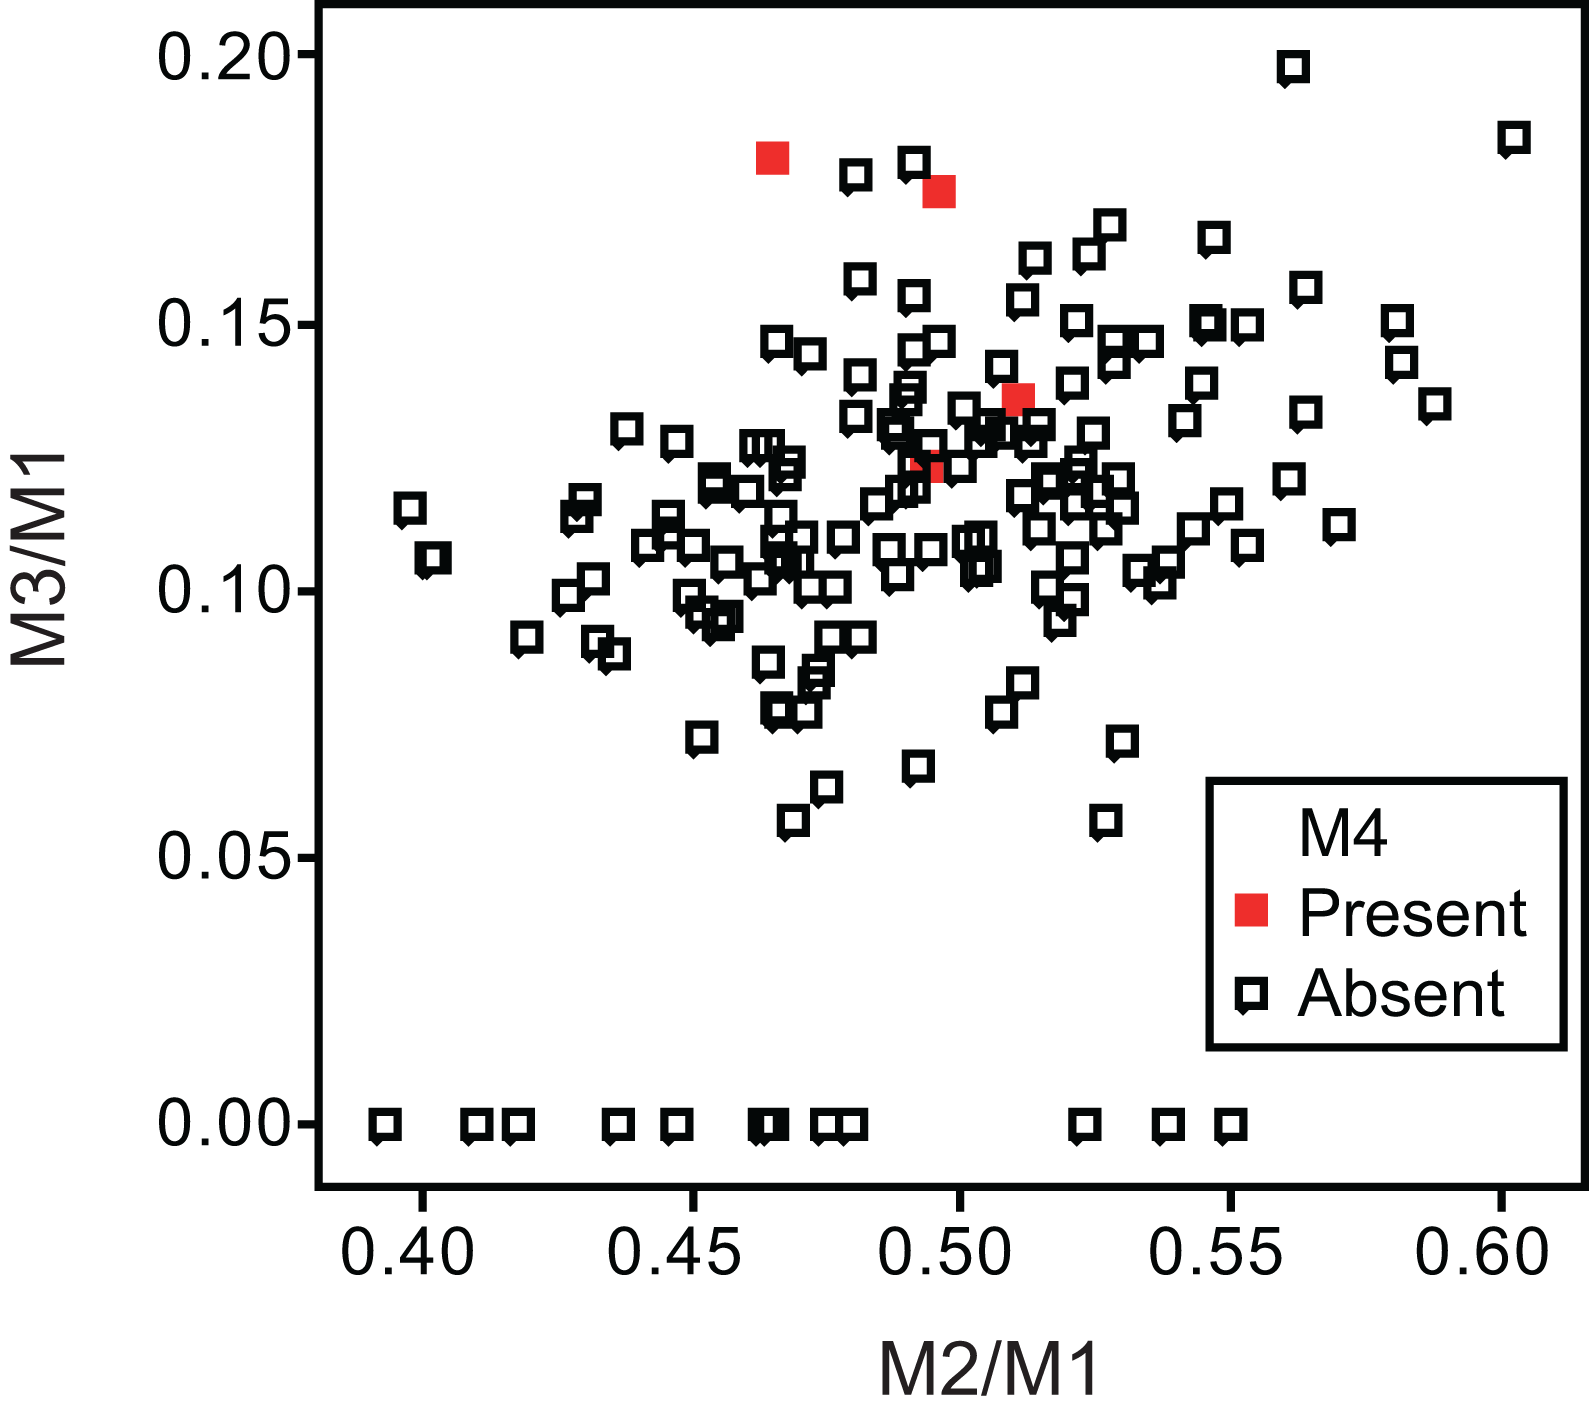

Figure 5: Bivariate plots of M2/M1 and M3/M1 scores among specimens of gray fox Urocyon cinereoargenteus.
Specimens possessing M4 (red diamond) and those lacking M4 (black diamond) were shown separately.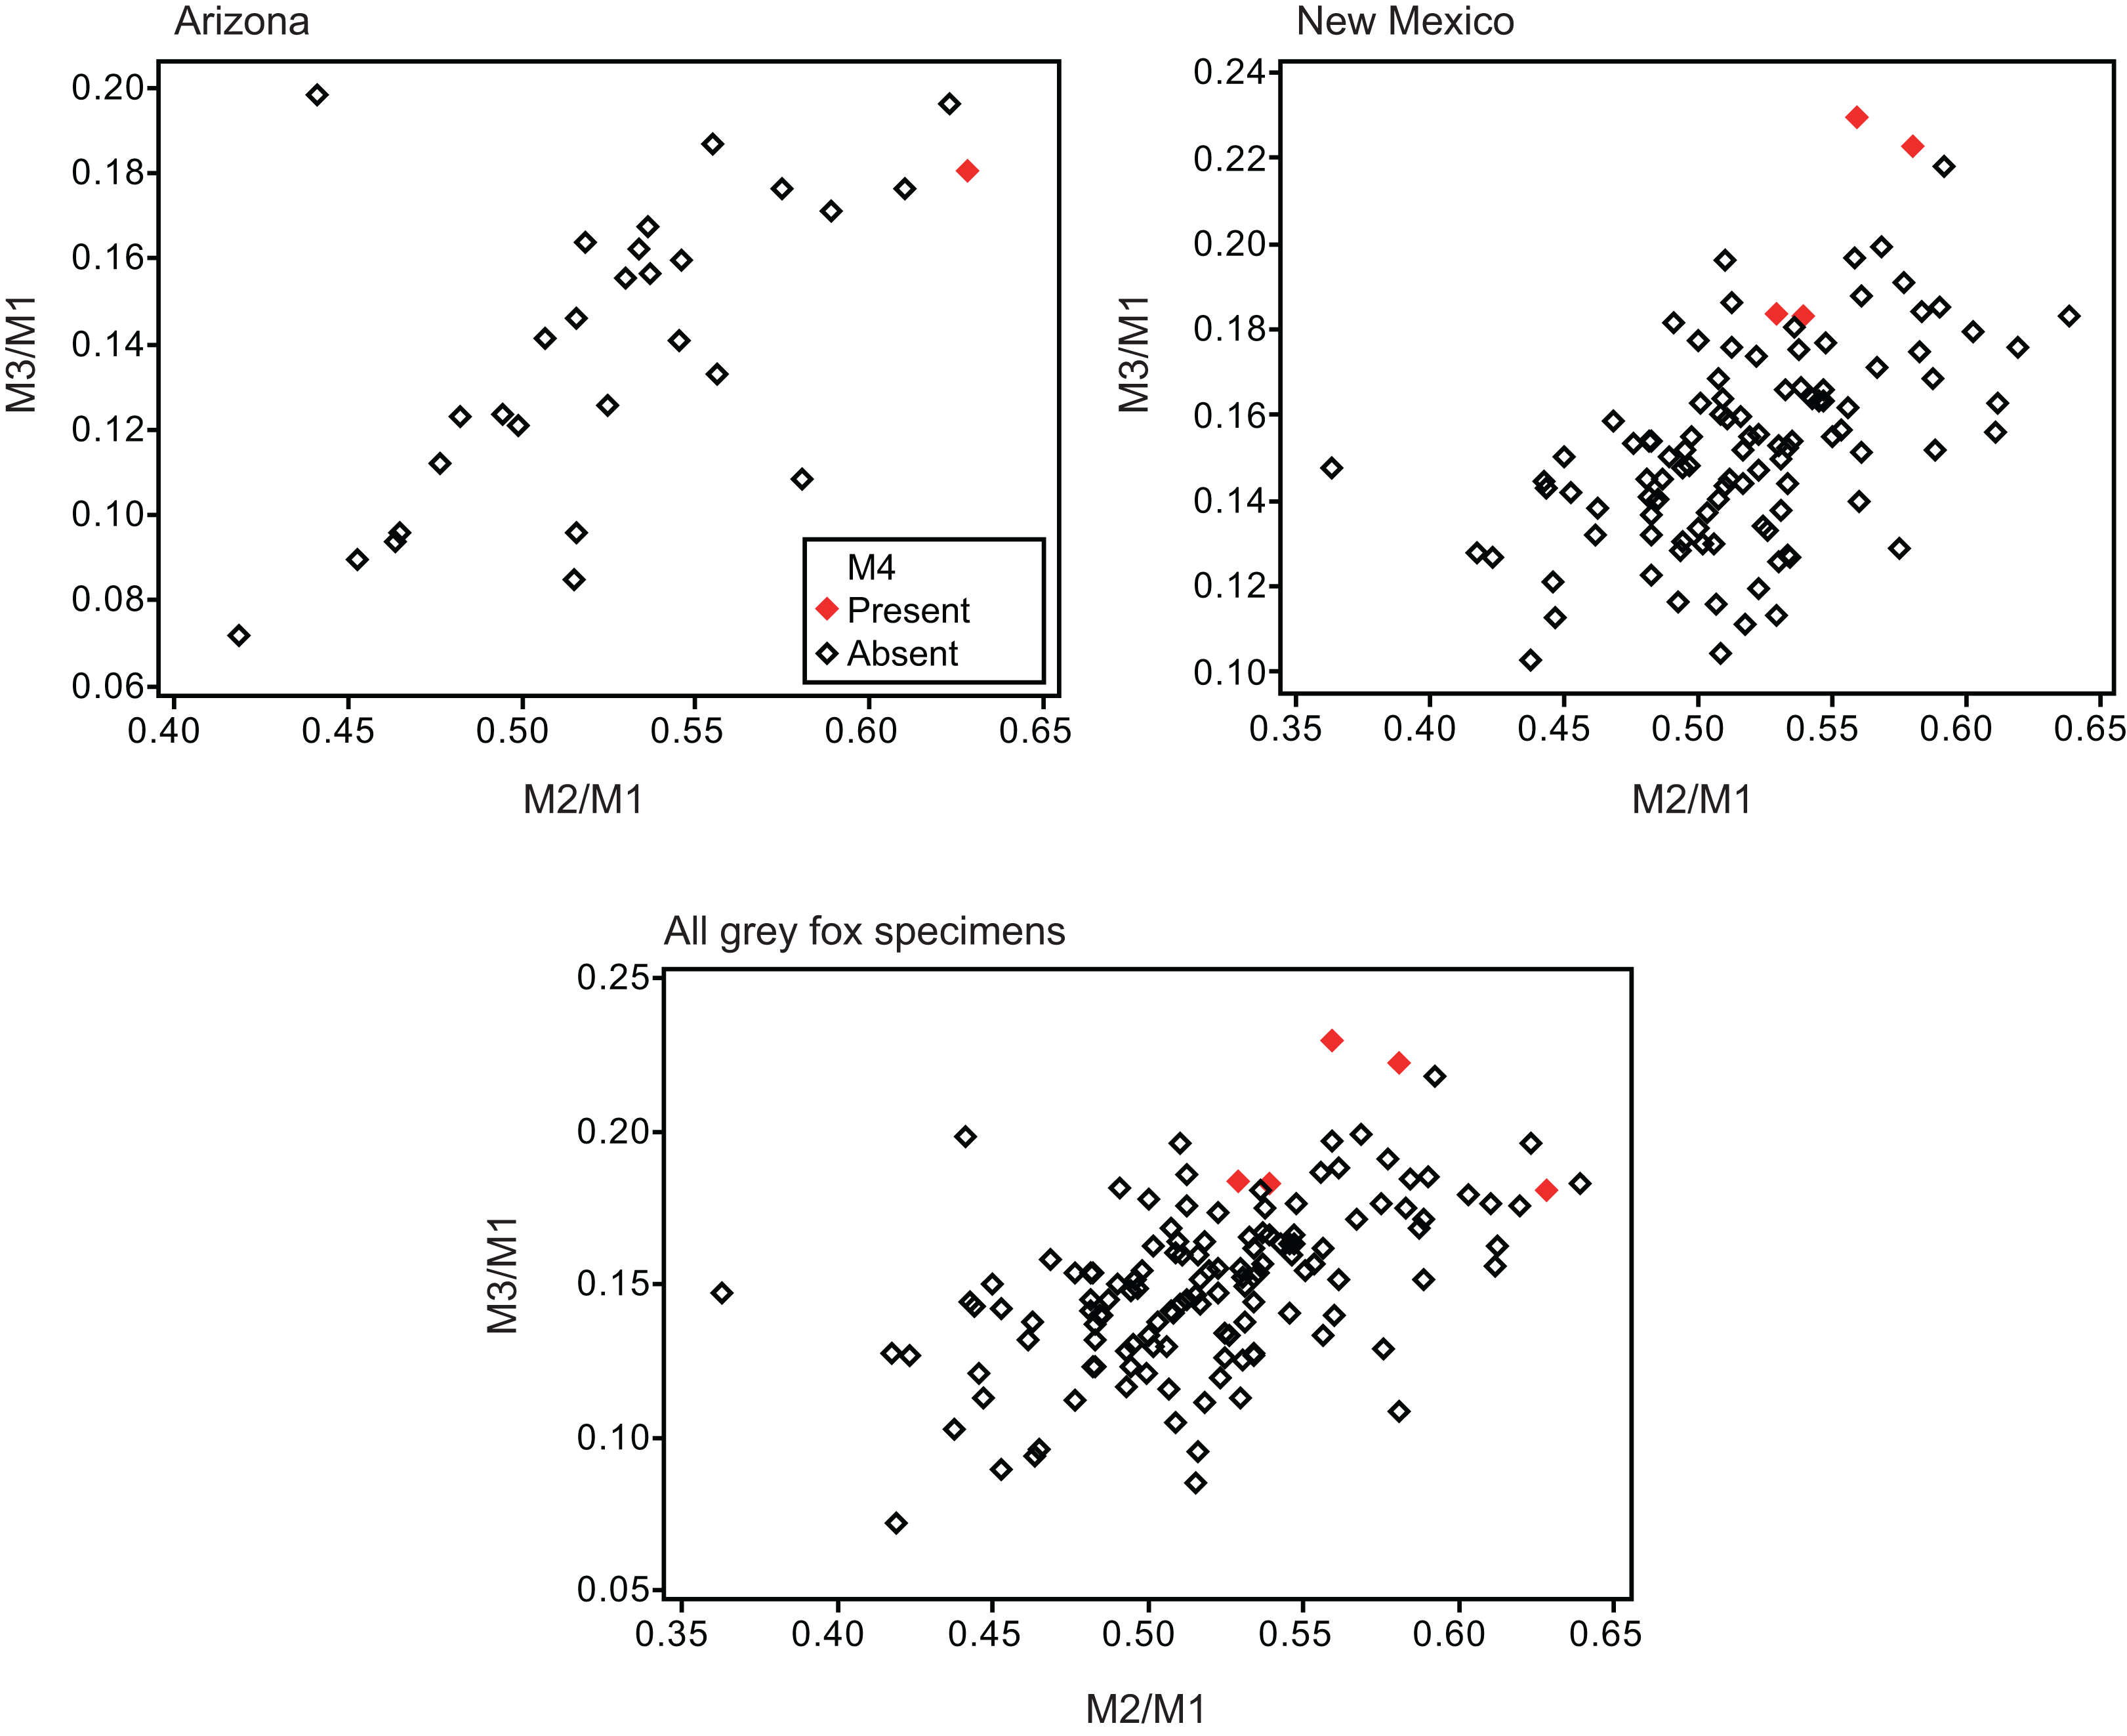
No relationship was found between mean M1 size and presence or absence of M4 (Table 1). When specimens of all locations were combined, mean M2/M1 and M3/M1 scores were typically larger in individuals with M4 than those with normal dentition (without M4), with the exception of M2/M1 scores in the Gifu samples of N. procyonoides (Table 1). When each location was analyzed separately, no significant difference in M2/M1 scores existed between individuals with M4 and with normal dentition; however, when all locations were pooled, individuals with M4 showed significantly higher M2/M1 scores than individuals with normal dentition in C. latrans and U. cinereoargenteus (Table 1). M3/M1 scores of individuals with M4 were significantly higher than those of individuals with normal dentition in the Gifu samples of N. procyonoides and the New Mexico samples of U. cinereoargenteus (Table 1). For the pooled samples of U. cinereoargenteus, M3/M1 scores of individuals with M4 were significantly higher than those of individuals with normal dentition (Table 1).
Five individuals of C. latrans and thirteen individuals of N. procyonoides lacked M3 (Table 1). M1 size of individuals without M3 is significantly larger than that of individuals with normal dentition in C. latrans. M2/M1 scores of individuals without M3 were significantly smaller than those of individuals with normal dentition in N. procyonoides.
Discussions
The lack of a relationship between M1 size and individuals with M4 versus those with normal dentition indicates that absolute M1 size does not affect the generation of the M4. However, individuals with high M2/M1 and M3/M1 scores (and thus with relatively large M2s and M3s) did tend to possess a supernumerary molar M4 (Table 1; Figs. 2–5). While these scores did not differ significantly in most within-location analysis except for M3/M1 scores in the Gifu samples of N. procyonoides and the New Mexico samples of U. cinereoargenteus (Table 1), these results could be affected by the low number of samples that possessed M4. To overcome this limitation, analysis of combined sample-locations did establish that M2/M1 scores were larger in individuals with M4 than those with normal dentition in C. latrans and U. cinereoargenteus (Table 1). These results support the hypothesis that altered inhibition/activation dynamics (i.e. lower inhibition and higher activation) is likely to direct the formation of the M4 in these species.
Geographic variation can affect M2/M1 scores of pooled locations, such that locations with higher M4 incidence simply have a larger M2/M1 score. This appears not to be an issue in this study, for two reasons. Firstly, a larger M2/M1 score in a location is indicative of a genetic background supporting lower inhibition and higher activation during molar development. Secondly, the ranges of mean M2/M1 and M3/M1 scores among locations were not larger than the difference between mean scores of individuals possessing or lacking the M4 (Table 1). The data considered herein supports a causal relationship between inhibition and activation dynamics and the occurrence of M4.
While the existence of M4 correlates with high M2/M1 and M3/M1 scores, there were many individuals that exhibited high M2/M1 or M3/M1 scores but whose mandible did not possess M4 (Figs. 1–5), indicating that inhibition/activation dynamics are likely to be only one of the causes of generating an extra molar. This interpretation is supported by the experimental suppression of inhibition in a mouse model resulting in only one case of the appearance of an extra molar (Kavanagh, Evans & Jernvall, 2007). Acquisition of M4 is rare during evolution of placental mammals (Sillero-Zubiri, 2009; Ungar, 2010), and it is logical that several barriers to M4 generation exist. Furthermore, occasional occurrence of M4, albeit at a low rate, suggests that canids may possibly possess a genetic background that favors the generation of the M4, and this may explain the evolution of an additional molar in the bat-eared fox O. megalotis.
M2/M1 scores were larger in individuals without M3 than those with normal dentition in N. procyonoides (Table 1). The result accords with the proposed relationship between dental anomalies (M3 loss) and the IC model reported by Asahara (2013). Significant differences in M1 size found in C. latrans (Table 1) could be affected by the low number of samples including a large individual that lacked M3.
Consistent with Paradiso (1966), this study found that the presence or absence of M4 differed among locations of C. latrans. Furthermore, Gisburne & Feldhamer (2005) reported that M4 was not observed among 510 specimens of Illinois U. cinereoargenteus, contrasting with the finding from this study of the presence of M4 in a low proportion of Arizona and New Mexico gray foxes. Most studies of raccoon dog (N. procyonoides) have reported no M4 molar in Japanese samples (Hata, 1972; Harada et al., 1989; Asahi & Mori, 1980; Nozaki, 1984; collectively 664 individuals), with a notable exception published by Machida & Saito (1986), who reported an M4 in just one of 137 raccoon dogs from Saitama prefecture in Japan. Therefore, the presence of M4 in the three canid species examined in this study is considered a rare anomaly.
Asahara (2013) and Asahara et al. (2016) reported that the relative molar size was reflective of the diet among species of canids. The more carnivorous canid species (such as Canis lupus) possess low M2/M1 scores and the more omnivorous species (such as N. procyonoides or U. cinereoargenteus) have higher scores (Asahara, 2013; Asahara et al., 2016). In addition, the insectivorous hoary fox Lycalopex vetulus has higher M2/M1 and M3/M1 scores than almost all other omnivorous species, and the insectivorous bat-eared fox O. megalotis has higher M2/M1 and M3/M1 scores than all other canids, indicating very low inhibition and high activation during molar development (Asahara, 2013). According to this pattern, the evolution of the insectivorous diet is associated with molars that are of more equal size (between M1, M2, and M3) than the carnivorous or omnivorous species, with higher M2/M1 and M3/M1 scores reflecting low inhibition and high activation during molar development. The present study is consistent with the hypothesis that low inhibition and high activation is a cause of M4 generation. Therefore, M4 is considered to be an adaptive trait providing a larger total occlusal surface area to enable the canid to digest a large amount of insects, as discussed by Asahara (2013) and Asahara et al. (2016). It is hypothesized that the ancestral species began to consume an insectivorous diet, and it followed that a pattern of low inhibition and high activation during molar development evolved to generate more equally sized molars (between M1, M2, and M3) than its ancestor, providing an evolutionary force supporting this adaptation to the insectivorous diet. Then, the inhibition/activation pattern generates M4 by chance. M4 is also an adaptive trait for insectivorous diet providing larger occlusal surface area and greater grinding function, therefore, presence of M4 is naturally selected and fixed in the ancestral lineage of the bat-eared fox. While no fossil canid species has been to found to possess an M4, several cases of a small supernumerary M3 has been reported in an individual of the Prototocyon genus (Petter, 1964; Petter, 1973), which may be closely related to (or belong to) Otocyon (Van Valen, 1964; Petter, 1964; Petter, 1973; Wang & Tedford, 2008; Tedford, Wang & Taylor, 2009; Werdelin & Peigne, 2010). This supports the argument that this genus was a transitional stage in which molar number increased. Further discoveries from the fossil record will be important in revealing the evolutionary history of the fourth molar.
Conclusions
The presence of a supernumerary molar M4 observed in several canid species is influenced by low inhibition and high activation during molar development, with the presence of M4 in the bat-eared fox O. megalotis originating from low inhibition and high activation due to evolutionary pressure relating to an insectivorous diet.