

An integrated pipeline for next generation sequencing and annotation of the complete mitochondrial genome of the giant intestinal fluke, Fasciolopsis buski (Lankester, 1857) Looss, 1899
- Published
- Accepted
- Received
- Academic Editor
- Kenta Nakai
- Subject Areas
- Bioinformatics, Evolutionary Studies, Genomics, Parasitology, Zoology
- Keywords
- Fasciolopsis buski , Mitochondria, Next generation sequencing, Contigs
- Copyright
- © 2013 Biswal et al.
- Licence
- This is an open access article distributed under the terms of the Creative Commons Attribution License, which permits unrestricted use, distribution, and reproduction in any medium, provided the original author and source are credited.
- Cite this article
- 2013. An integrated pipeline for next generation sequencing and annotation of the complete mitochondrial genome of the giant intestinal fluke, Fasciolopsis buski (Lankester, 1857) Looss, 1899. PeerJ 1:e207 https://doi.org/10.7717/peerj.207
Abstract
Helminths include both parasitic nematodes (roundworms) and platyhelminths (trematode and cestode flatworms) that are abundant, and are of clinical importance. The genetic characterization of parasitic flatworms using advanced molecular tools is central to the diagnosis and control of infections. Although the nuclear genome houses suitable genetic markers (e.g., in ribosomal (r) DNA) for species identification and molecular characterization, the mitochondrial (mt) genome consistently provides a rich source of novel markers for informative systematics and epidemiological studies. In the last decade, there have been some important advances in mtDNA genomics of helminths, especially lung flukes, liver flukes and intestinal flukes. Fasciolopsis buski, often called the giant intestinal fluke, is one of the largest digenean trematodes infecting humans and found primarily in Asia, in particular the Indian subcontinent. Next-generation sequencing (NGS) technologies now provide opportunities for high throughput sequencing, assembly and annotation within a short span of time. Herein, we describe a high-throughput sequencing and bioinformatics pipeline for mt genomics for F. buski that emphasizes the utility of short read NGS platforms such as Ion Torrent and Illumina in successfully sequencing and assembling the mt genome using innovative approaches for PCR primer design as well as assembly. We took advantage of our NGS whole genome sequence data (unpublished so far) for F. buski and its comparison with available data for the Fasciola hepatica mtDNA as the reference genome for design of precise and specific primers for amplification of mt genome sequences from F. buski. A long-range PCR was carried out to create an NGS library enriched in mt DNA sequences. Two different NGS platforms were employed for complete sequencing, assembly and annotation of the F. buski mt genome. The complete mt genome sequences of the intestinal fluke comprise 14,118 bp and is thus the shortest trematode mitochondrial genome sequenced to date. The noncoding control regions are separated into two parts by the tRNA-Gly gene and don’t contain either tandem repeats or secondary structures, which are typical for trematode control regions. The gene content and arrangement are identical to that of F. hepatica. The F. buski mtDNA genome has a close resemblance with F. hepatica and has a similar gene order tallying with that of other trematodes. The mtDNA for the intestinal fluke is reported herein for the first time by our group that would help investigate Fasciolidae taxonomy and systematics with the aid of mtDNA NGS data. More so, it would serve as a resource for comparative mitochondrial genomics and systematic studies of trematode parasites.
Introduction
Fasciolopsis buski, often called the giant intestinal fluke, is one of the largest digenean trematode flatworms infecting humans and found primarily in Asia and the Indian subcontinent, also occurring in Taiwan, Thailand, Laos, Bangladesh, India, and Vietnam. The trematode predominates in areas where pigs are raised, they being the most important reservoirs for the organism and where underwater vegetables viz. water chestnut, lotus, caltrop and bamboo are consumed. It is an etiological agent of fasciolopsiasis, a disease that causes ulceration, haemorrhage and abscess of the intestinal wall, diarrhoea, and even death if not treated properly. Interestingly, most infections are asymptomatic with high rates of infection (up to 60%) in India and the mainland China (Le et al., 2004). Among animals, pigs are the main reservoir of F. buski infection. In India, the parasite has been reported from different regions including the Northeast and variations in the morphology of the fluke have been observed from different geographical regions (Roy & Tandon, 1993). F. buski occurs in places with warm, moist weather and is the only single species in the genus found in aquatic environments. The complex life cycle combined with the specific immune evasion traits of parasites make research and drug or vaccine programs for intestinal flukes very difficult; consequently, new methods to control this parasite are required. Being one of the most important intestinal flukes from an epidemiological point of view, F. buski seeks considerable attention from the scientific community and the available gene sequences for the organism on the public domain remain scarce thereby restricting research avenues. Therefore, fasciopsiasis has become a public health issue and is of major socioeconomic significance in endemic areas.
Metazoan mitochondrial (mt) genomes, ranging in size from 14 to 18 kb, are typically circular and usually encode 36–37 genes including 12–13 protein-coding genes, without introns and with short intergenic regions (Wolstenholme, 1992). Due to their maternal inheritance, faster evolutionary rate change, lack of recombination, and comparatively conserved genome structures mitochondrial DNA (mtDNA) sequences have been extensively used as molecular markers for studying the taxonomy, systematics, and population genetics of animals (Li et al., 2008; Catanese, Manchado & Infante, 2010). At the time of writing this manuscript, quite a number of complete metazoan mt genomes are already deposited in GenBank (Benson et al., 2005) and other public domain databases viz. Mitozoa (D’Onorio de Meo et al., 2011), mainly for Arthropoda, Mollusca, Platyhelminthes, Nematoda, and Chordata (Chen et al., 2009). Presently, the class Trematoda comprises about 18,000 nominal species, and the majority of them can parasitize mammals including humans as their definitive host (Olson et al., 2003). Despite their medical and economical significance, most of them still remain poorly understood at the molecular level. In particular, the complete mt genomes of the species belonging to the family Fasciolidae are not at all available in the public domain. Complete or near-complete mt genomes are now available for 15 odd species or strains of parasitic flatworms belonging to the classes Trematoda and Cestoda. To date, a PCR-based molecular characterization using ITS1&2 molecular markers for F. buski have been carried out (Prasad et al., 2007). However, further datasets generated by high-throughput sequencing and comparative transcriptome analysis could bring a more comprehensive understanding of the parasite biology for studying parasite-host interactions and disease as well as parasite development and reproduction, with a view towards establishing new methods of prevention, treatment or control.
Until quite recently, sequencing of mt genomes was somewhat challenging and a daunting task. It has been approached using the conventional strategy of combining long-range PCR with subsequent primer walking. The paradigm shift caused by the third generation sequencing technologies have paved the way for Next-Generation Sequencing (NGS) technologies, which encourages proposals for more straightforward integrated pipelines for sequencing complete mt genomes (Jex, Littlewood & Gasser, 2010) that are more cost effective and less time consuming.
Here in, we present a straightforward approach for reconstructing novel mt genomes directly from NGS data generated from total genomic DNA extracts. We took advantage of the whole genome sequence data for F. buski (DK Biswal, S Ghatani, JA Shylla, R Sahu, N Mullapudi, A Bhattacharya, V Tandon, unpublished data), generated by NGS and its comparison with the existing data for the F. hepatica mt genome sequence to design precise and specific primers for amplification of mt genome sequences of F. buski. We then carried out long-range PCR to create a NGS library enriched in mt DNA sequences. We utilized two different next generation sequencing platforms to completely sequence the mitochondrial genome, and applied innovative approaches to assemble the mitochondrial genome in silico and annotate it. When verifying one region of the assembly by Sanger sequencing it was found to match our assembly results. The purpose of the present study was to sequence the mt genome of F. buski for the first time with a novel strategy, compare its sequences and gene organization, identify any adaptive mutations in the 12 protein-coding genes of the intestinal parasite species, and to reconstruct the phylogenetic relationships of several species of Trematoda and Cestoda in the Phylum Platyhelminthes, using mtDNA sequences available in GenBank.
Materials & Methods
Parasite material and DNA extraction
Live adult F. buski were obtained from the intestine of freshly slaughtered pig, Sus scrofa domestica at local abattoirs meant for normal meat consumption and not specifically for this design of study. The worms recovered from these hosts represented the geographical isolates from Shillong (coordinates 25.57°N 91.88°E) area in the state of Meghalaya, Northeast India. Eggs were obtained from mature adult flukes by squeezing between two glass slides. For the purpose of DNA extraction, adult flukes collected from different host animals were processed singly; eggs recovered from each of these specimens were also processed separately. The adult flukes were first immersed in digestion extraction buffer [containing 1% sodium dodecyl sulfate (SDS), 25 mg Proteinase K] at 37°C for overnight. DNA was then extracted from lysed individual worms by standard ethanol precipitation technique (Sambrook, Fitsch & Maniatis, 1989) and also extracted from the eggs on FTA cards using Whatman’s FTA Purification Reagent. DNA was subjected to a series of enzymatic reactions that repair frayed ends, phosphorylate the fragments, and add a single nucleotide ‘A’ overhang and ligate adaptors (Illumina’s TruSeq DNA sample preparation kit). Sample cleanup was done using Ampure XP SPRI beads. After ligation, ∼300–350 bp fragment for short insert libraries and ∼500–550 bp fragment for long insert libraries were size selected by gel electrophoresis, gel extracted and purified using Minelute columns (Qiagen). The libraries were amplified using 10 cycles of PCR for enrichment of adapter-ligated fragments. The prepared libraries were quantified using Nanodrop and validated for quality by running an aliquot on High Sensitivity Bioanalyzer Chip (Agilent). 2X KapaHiFiHotstart PCR ready mix (Kapa Biosystems Inc., Woburn, MA) reagent was used for PCR. The Ion torrent library was made using Ion Plus Fragment library preparation kit (Life Technologies, Carlsbad, US) and the Illumina library was constructed using TruSeqTM DNA Sample Preparation Kit (Illumina, Inc., US) reagents for library prep and TruSeq PE Cluster kit v2 along withTruSeq SBS kit v5 36 cycle sequencing kit (Illumina, Inc., US) for sequencing.
Primer design strategy and Polymerase Chain Reaction (PCR)
∼16 million 100 base-paired end reads were available for F. buski as a part of an independent attempt towards whole genome sequencing of F. buski. In order to recover mtDNA coding sequences from this data, Fasciola hepatica mt genome with accession AF216697.1 was retrieved from GenBank as a reference mt Genome and alignment using Bowtie (v2-2.0.0-beta6/bowtie2 –end-to-end –very-sensitive –no-mixed –phred64) (Langmead et al., 2009). In all, 1625 paired end reads were obtained, which were aligned to different intervals in the F. hepatica mt genome, covering ∼3 kb of the 14 kb F. hepatica mt genome. Accordingly, primers were designed at these regions, using sequence information from F. buski to ensure optimum primer designing as shown in Table 1. Long-range PCR was carried out using 10 ng of genomic DNA from F. buski and the following PCR conditions: 10 ng of FD-2 DNA with 10 µM Primer mix in 10 µl reaction PCR cycling conditions −98°C for 3 min, 35 cycles of 98°C for 30 s, 60 for 30 s, 72 for 2 min 30 s, final extension 72°C for 3 min and 4°C hold. The bands were gel-eluted corresponding to different products and pooled for NGS library construction (Fig. 1).
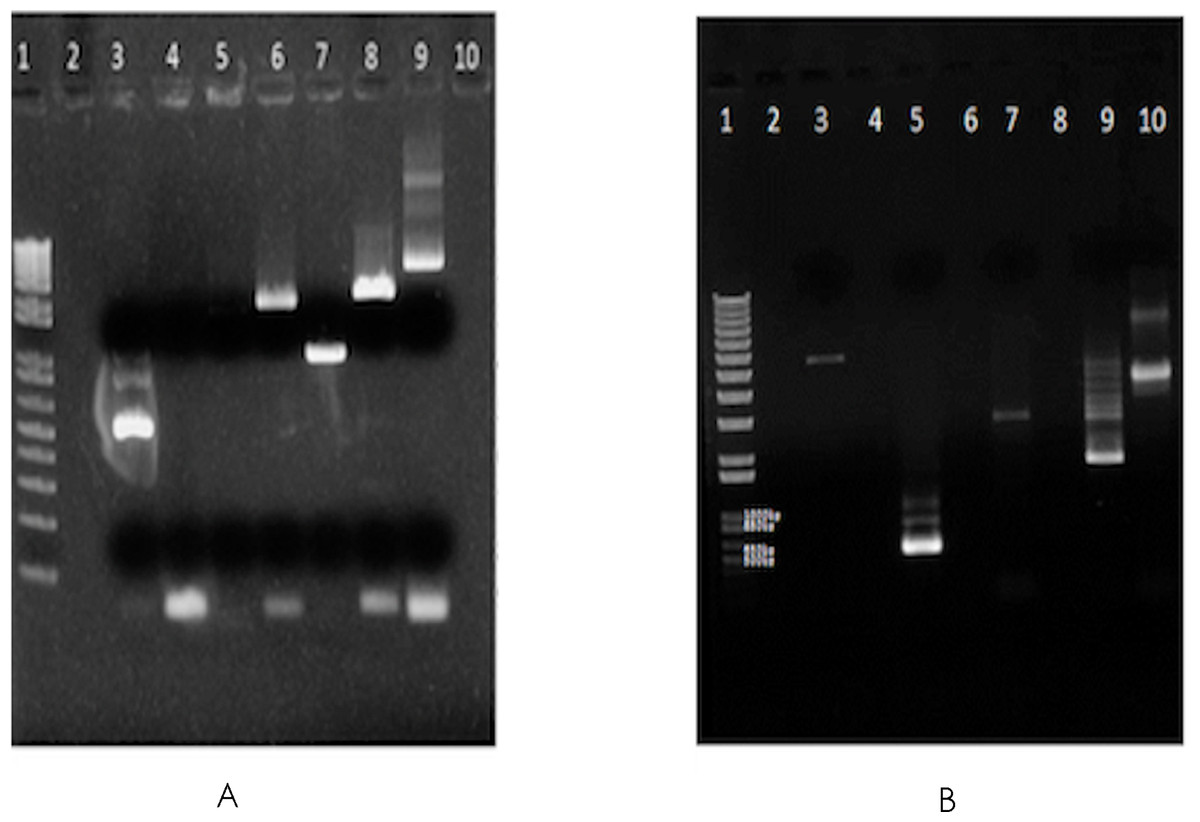
Figure 1: Gel images of the long range PCR products.
Long-range PCR carried out using 10 ng of genomic DNA from F. buski (FD2 and FD3 samples). Gel-eluted bands corresponding to different products that were pooled for NGS library construction are shown. (A) SO_1625_mt gel (elution). Lane Order: Lane 1-1 kb plus ladder, Lane 2-Blank, Lane 3-P1 primer pair, Lane 4-P2 primer pair, Lane 5-P3 primer pair, Lane 6-P4 primer pair, Lane 7-P5 primer pair, Lane 8-P6 primer pair, Lane 9-P7 primer pair, Lane10-Blank. Lanes 3, 5, 6, 7, 8, and 9 (both bands) were taken for Ion Torrent Library Prep. (B) SO_1625_mt gel (elution). Lane Order: Lane 1-1 kb plus ladder, Lane 2-Blank, Lane 3-P7 + P2 primer pair, Lane 4-Blank, Lane 5-P1 primer pair, Lane 6-Blank, Lane 7-P2 primer pair, Lane 8-Blank, Lane 9-P3 primer pair, Lane 10-P7 primer pair. Lanes 3, 5 (all bands), 7, 9 (bright band) and Lane 10 (both bands) were taken for Ion Torrent Library Prep.
| Primer name | Primer sequence |
Product | Expected length |
Observed length (bp) |
|---|---|---|---|---|
| F1 | TACATGCGGATCCTATGG | P1 | 1525 | 500, 700, 1000 |
| F2 | AAAGACATACAAACAACAAC | |||
| F3 | TCTTTAGTGTATTCTTTGGGTCATG | P2 | 2660 | 3000 |
| F4 | AACAACCCCAACCTACCCT | |||
| F5 | GTTTGTTGAGGGTAGGTTGGGG | P3 | 1623 | 1600 |
| F6 | CAAATCATTAATGCGAGG | |||
| F7 | CTTTTTGATGCCTGTGTTCATAG | P4 | 2010 | 2000 |
| F8 | ACCTTTCAAACAATCCCCCA | |||
| F9 | CGGATTTATAGATGGTAGTGCCTG | P5 | 1037 | 1000 |
| F10 | CCGGATATACACTAACAAACATAATTAAG | |||
| F11 | GTTTGTTAGTGTATATCCGGTTGAAG | P6 | 2361 | 2200 |
| F12 | GGCAGCAACCAAAGTAGAAGA | |||
| F13 | TATTTCTTGGTTGTTGGAGGCTAT | P7 | 3783 | 4000, 8000 |
| F14 | TCTATAGAACGCAACATAGCATAAAAG |
NGS library construction, sequencing and assembly
The pooled PCR products were sheared to smaller sizes using Bioruptor. One of each of the Ion Torrent and Illumina library was constructed per manufacturers’ protocols. Briefly, PCR products were sonicated, adapter ligated and amplified for x cycles to generate a library. The libraries were sequenced to generate 14k reads of an average of 150 nt SE reads on Ion Torrent, and 1.3 million reads of 72 nt SE reads on Illumina GAIIx. High quality and vector filtered reads from Ion Torrent and Illumina sequencing were assembled (hybrid-assembly) using Mira-3.9.15 (http://sourceforge.net/apps/mediawiki/mira-assembler). The hybrid assembly generated 776 contigs. All 776 contigs were then used as input for CAP3 assembler which generated 38 contigs. The contigs were further filtered to remove short and duplicate contigs. Finally, only 14 contigs were retained and ORF prediction was carried out using ORF Finder (Open Reading Frame Finder) (http://www.ncbi.nlm.nih.gov/gorf/gorf.html). The schematic outline of the assembly is depicted in Fig. 2.
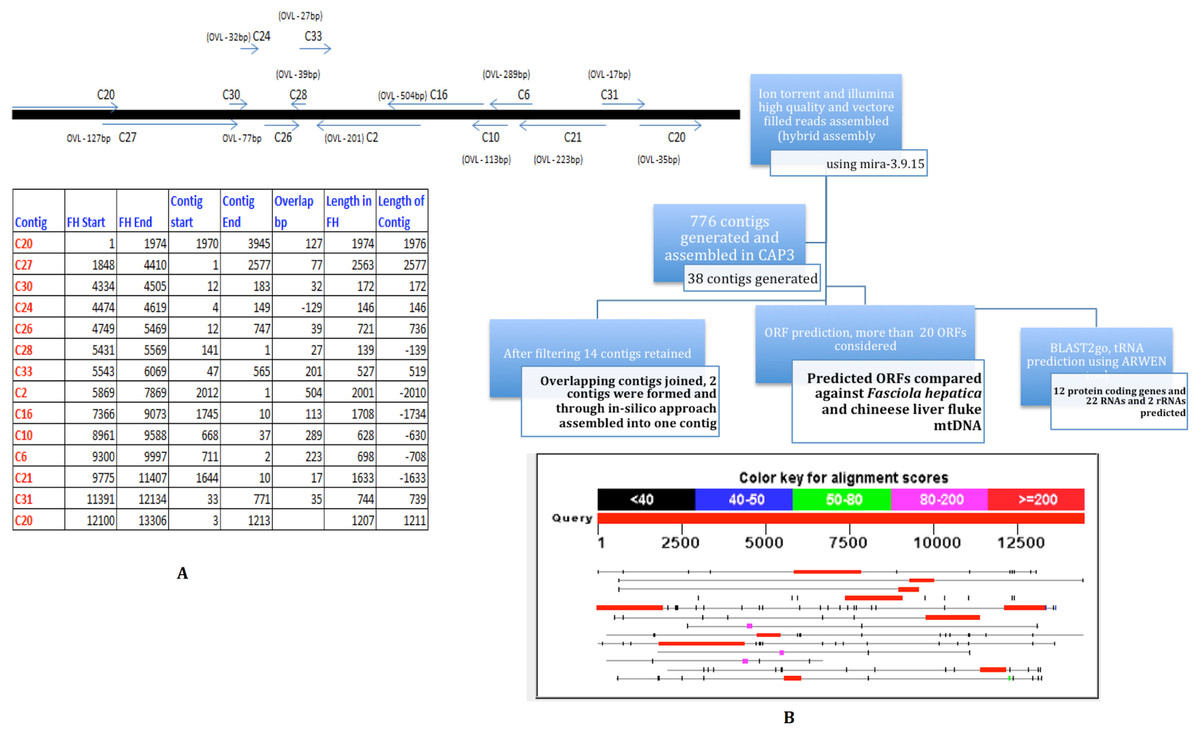
Figure 2: Strategy for MIRA and CAP3 Assembly for mtDNA NGS data.
Ion Torrent and Illumina High quality and vector filtered reads assembled (hybrid assembly) using mira-3.9.15. 776 contigs were generated from the hybrid assembly. All the 776 contigs were fed in CAP3 assembler. Post filtering 14 contigs were retained. From 14 contigs overlapping contigs were joined and 2 contigs were formed, which were finally joined as one with the addition of couple of Ns. Predicted ORFs were compared against F. hepatica coding regions. Region 1 is a ∼500 nt overlapping region between C2 and C16. Region 2 was sequenced using one primer in C24 and the second primer in C26.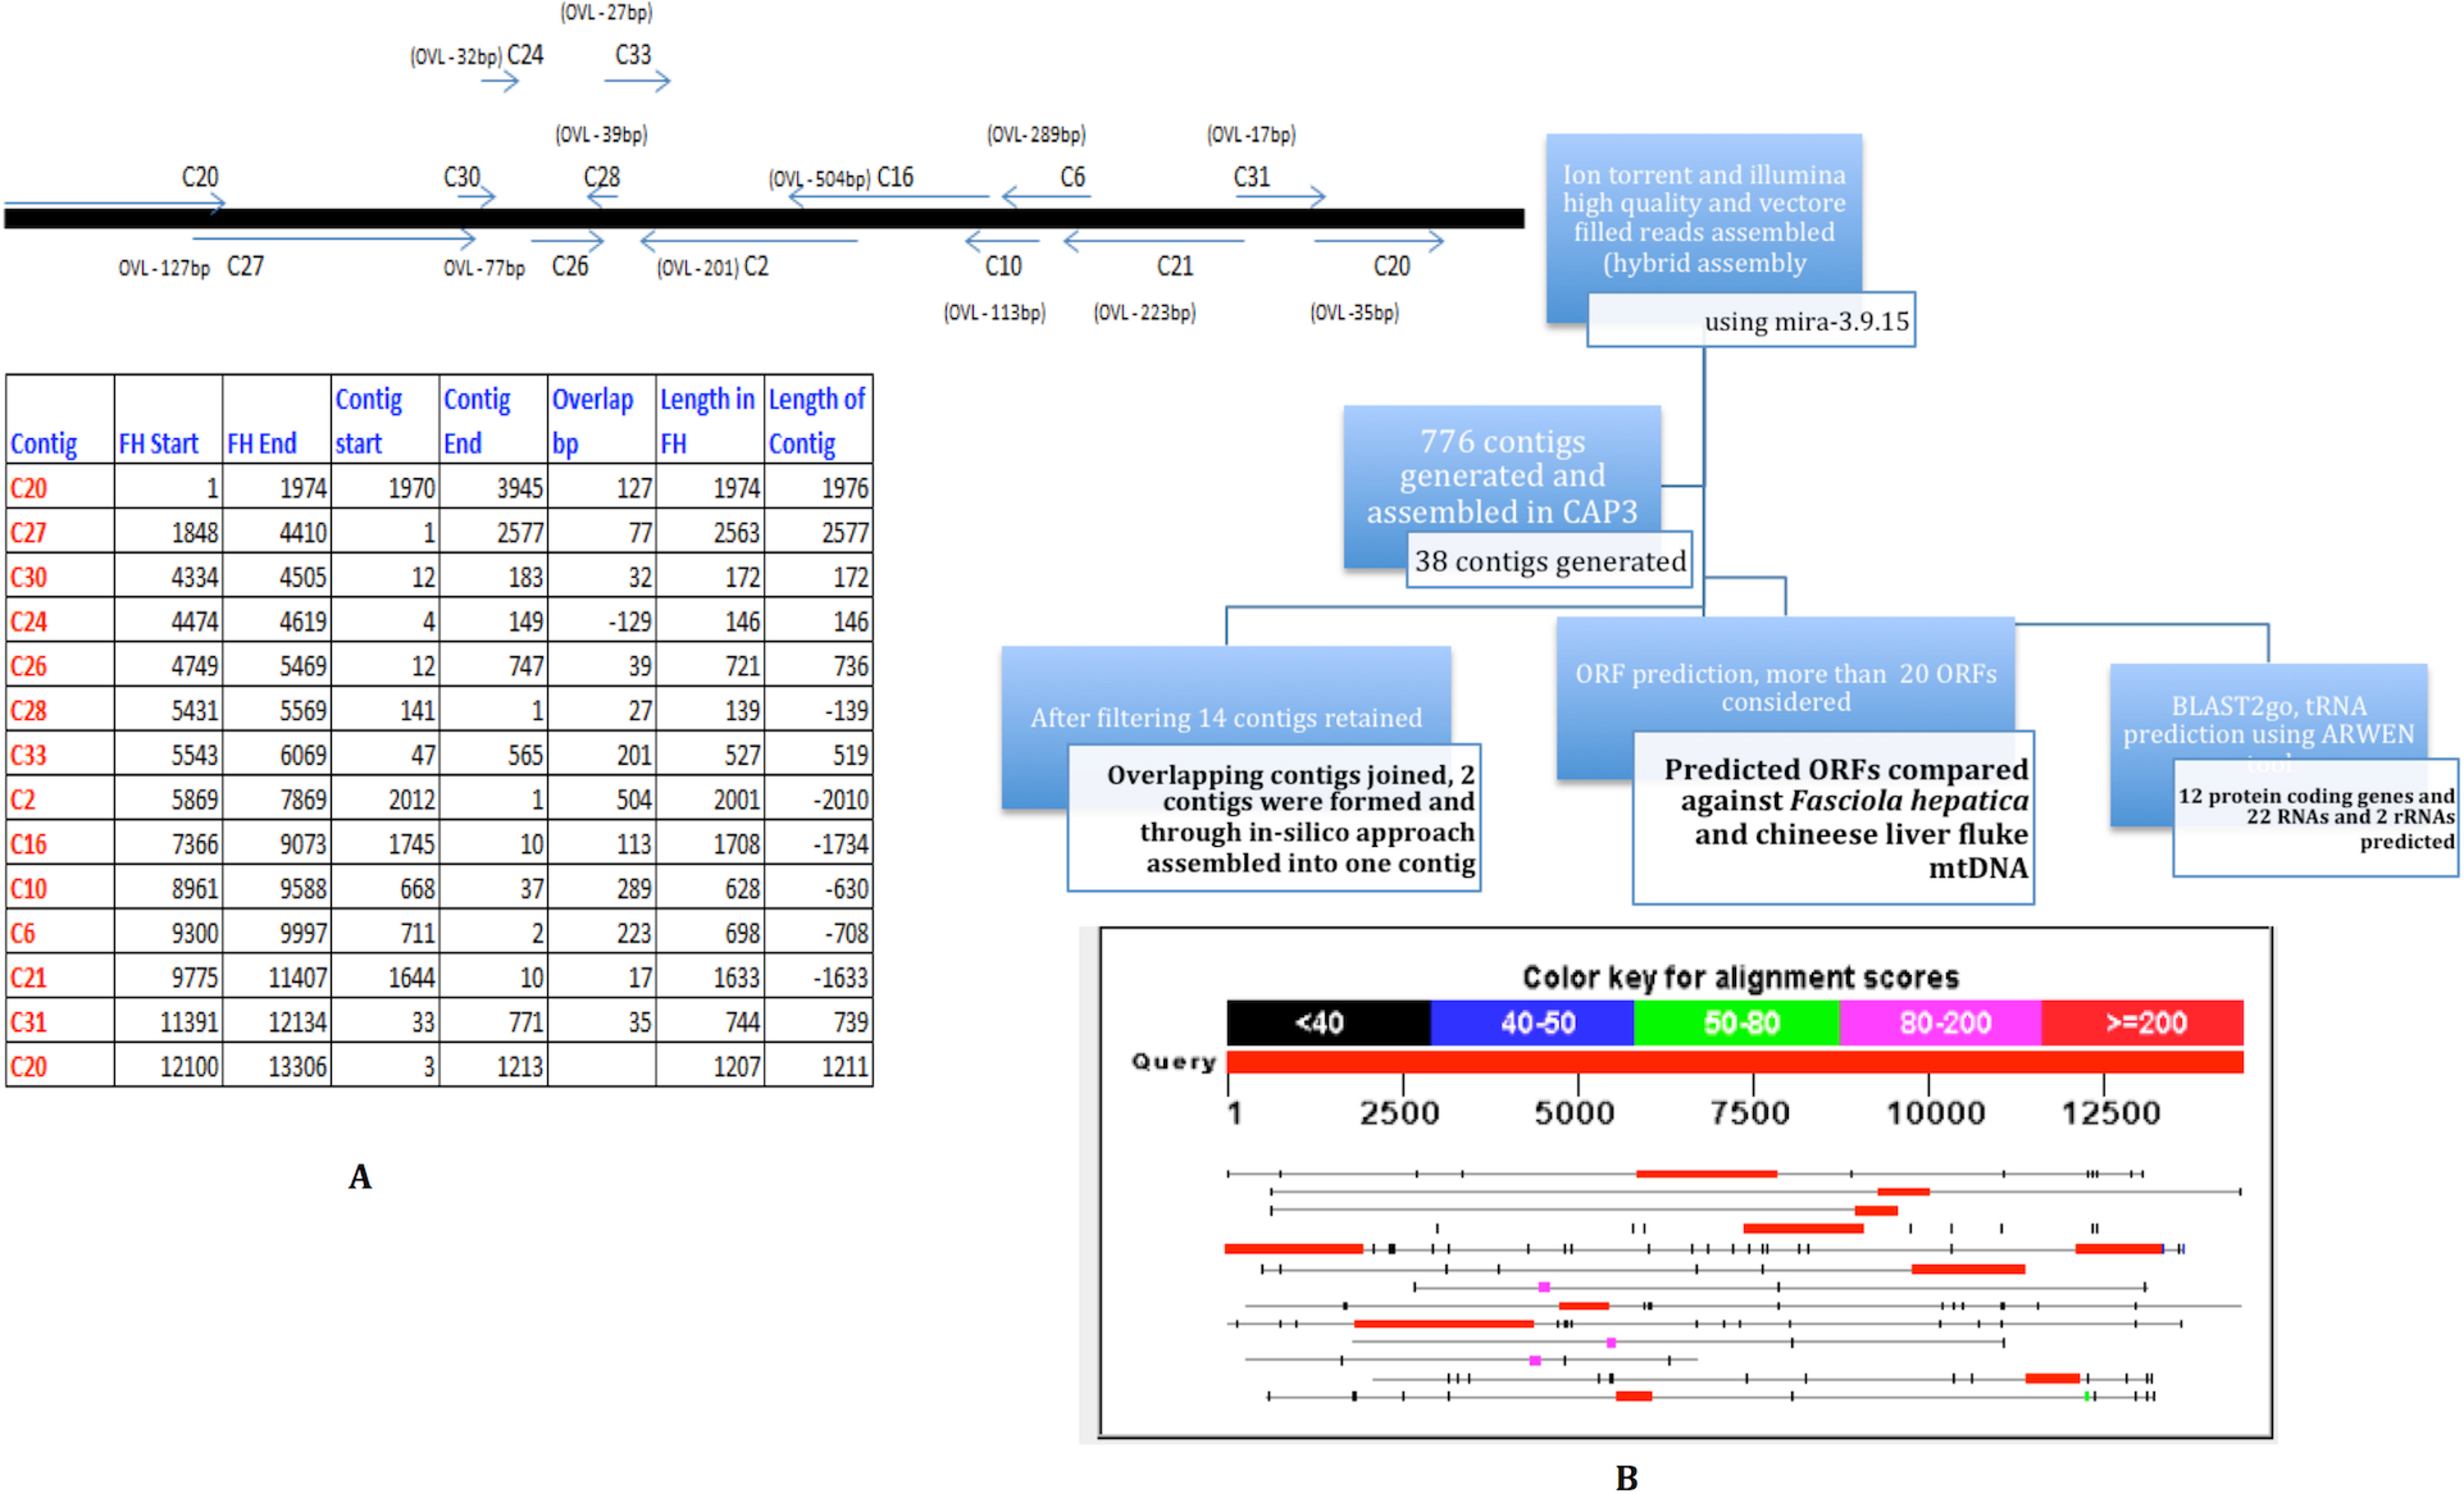
A manual examination of the 14 contigs revealed overlaps amongst all of them (except C30) (Fig. 2) and in collinear arrangement when compared with the F. hepatica mitochondrial sequence. The 14 contigs were manually joined wherever overlaps (minimum overlap >5) were found and that resulted in two individual contigs which, in turn, were assembled into one single contig with the addition of a couple of Ns. To resolve the remaining gaps between the two contigs as well as to confirm the assembly both the regions were amplified and Sanger sequenced. The Sanger sequencing was carried out by designing two primers for both the contigs flanking the Ns to resolve this gap and to verify the assembly as well as closure of the gap that was remaining after joining the contigs manually. The Sanger data in two regions was used to replace the NGS assembly-derived data to refine the assembly and obtain one single contig with no gaps. Region 1 was a ∼500 nt overlapping region between C2 and C16. Region 2 was sequenced using one primer in C24 and the second primer in C26. Considering the finished mitochondrial genome, i.e., from position 1 to 14118, two primer pairs were designed as detailed below:
Set 1: fw primer position # 7395–7414 (Length = 20)
FORWARD PRIMER: TGGTTATTCTGGTTGGGGAG
rev primer position # 8137–8159 (Length = 23)
REVERSE PRIMER: AACCCTCCTATAAGAACCCAAAG (RC = ) CTTTGGGTTCTTATAGGAGGGTT
The Sanger sequence data and NGS assembly aligned to each other with 94% identity. Twenty-nine out of 494 positions showed discordance between the Sanger sequencing and NGS-derived sequencing for this region (Fig. 3). These discordances consist of 19 gaps and 10 mismatches that can be introduced by either the sequencing chemistry (for e.g., homopolymeric stretches in Ion Torrent) or an assembly artifact (e.g., Ns). Overall, the Sanger sequencing confirmed the assembly pipeline and also corrected errors that are commonly observed in NGS pipelines.
Figure 3: Assembly confirmation of the ∼500 nucleotide region between C2–C16.
Primers spanning the 500 bp overlap junction between contig 2 and contig 16 are marked in green. Sanger sequenced region (query) and NGS assembly (subject) were aligned with 94% identity with strong supportive E-values (0.0). Twenty nine out of 494 positions showed discordance between the Sanger sequencing and NGS-derived sequencing consisting of 19 gaps and 10 mismatches that may be introduced by either sequencing chemistry (e.g., homopolymeric stretches in Ion Torrent) or an assembly artifact (e.g., Ns).
Set 2: fw primer position # 4634–4655 (Length = 22),
FORWARD PRIMER: TAGGGTTATTGGTGTTAACCGG
reverse primer position #4961–4937 (Length = 25)
REVERSE PRIMER: CAACAAACCAACAACTATACATCCC
REV PRIMER RC:- GGGATGTATAGTTGTTGGTTTGTTG
The region between contigs C24 and C26 did not show any overlap. The forward primer was 94 bp inward from the junction on C24 and the reverse primer was 112 bp outward from the junction on C26. The expected region based on assembly for contigs 24 and 26 and the Sanger results are shown in Fig. 4. The bases in brown colour within brackets are the bases that fill the gap between C24 and C26. Sanger sequencing of the region between C24 and C26 enabled gap-filling of a region that was not sequenced/assembled by the NGS approach and enabled assembly of the mitochondrial genome into one single draft genome.
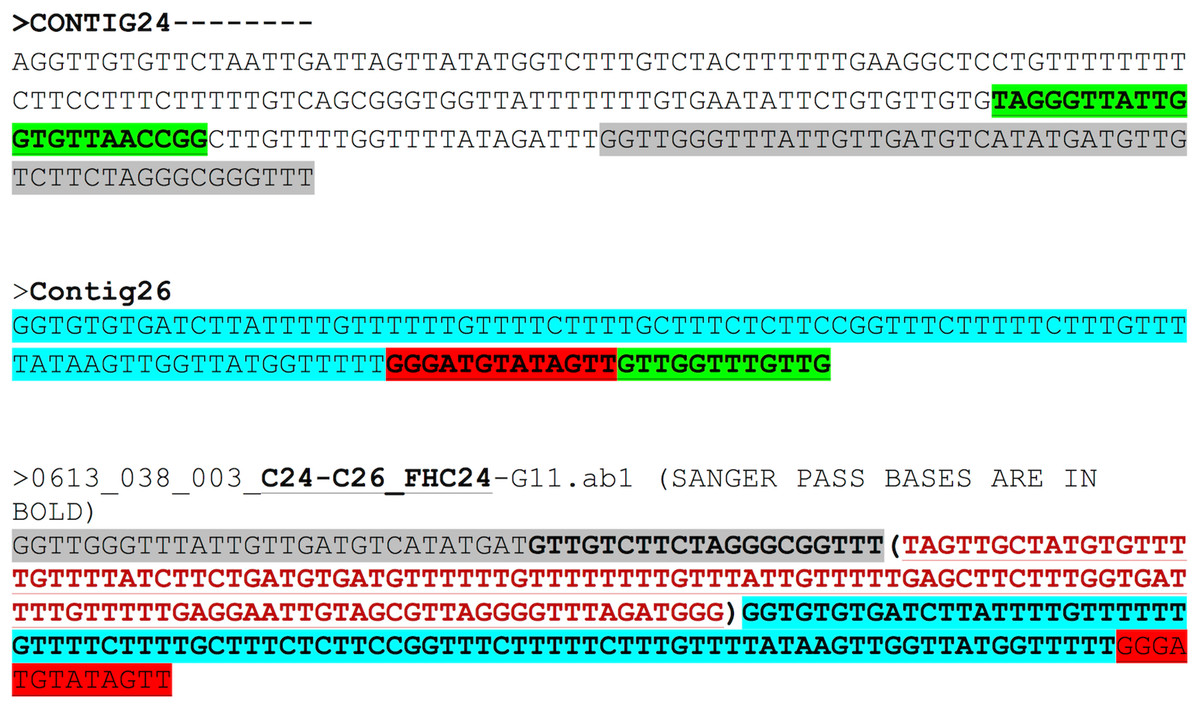
Figure 4: Assembly confirmation for the C24–C26 region.
Region between contigs C24 and C26 showing no overlap regions. Forward primer is 94 bp inward from the junction on C24 and the reverse primer 112 bp outward from the junction on C26. The bases in brown colour in brackets are those that fill the gap between C24 and C26.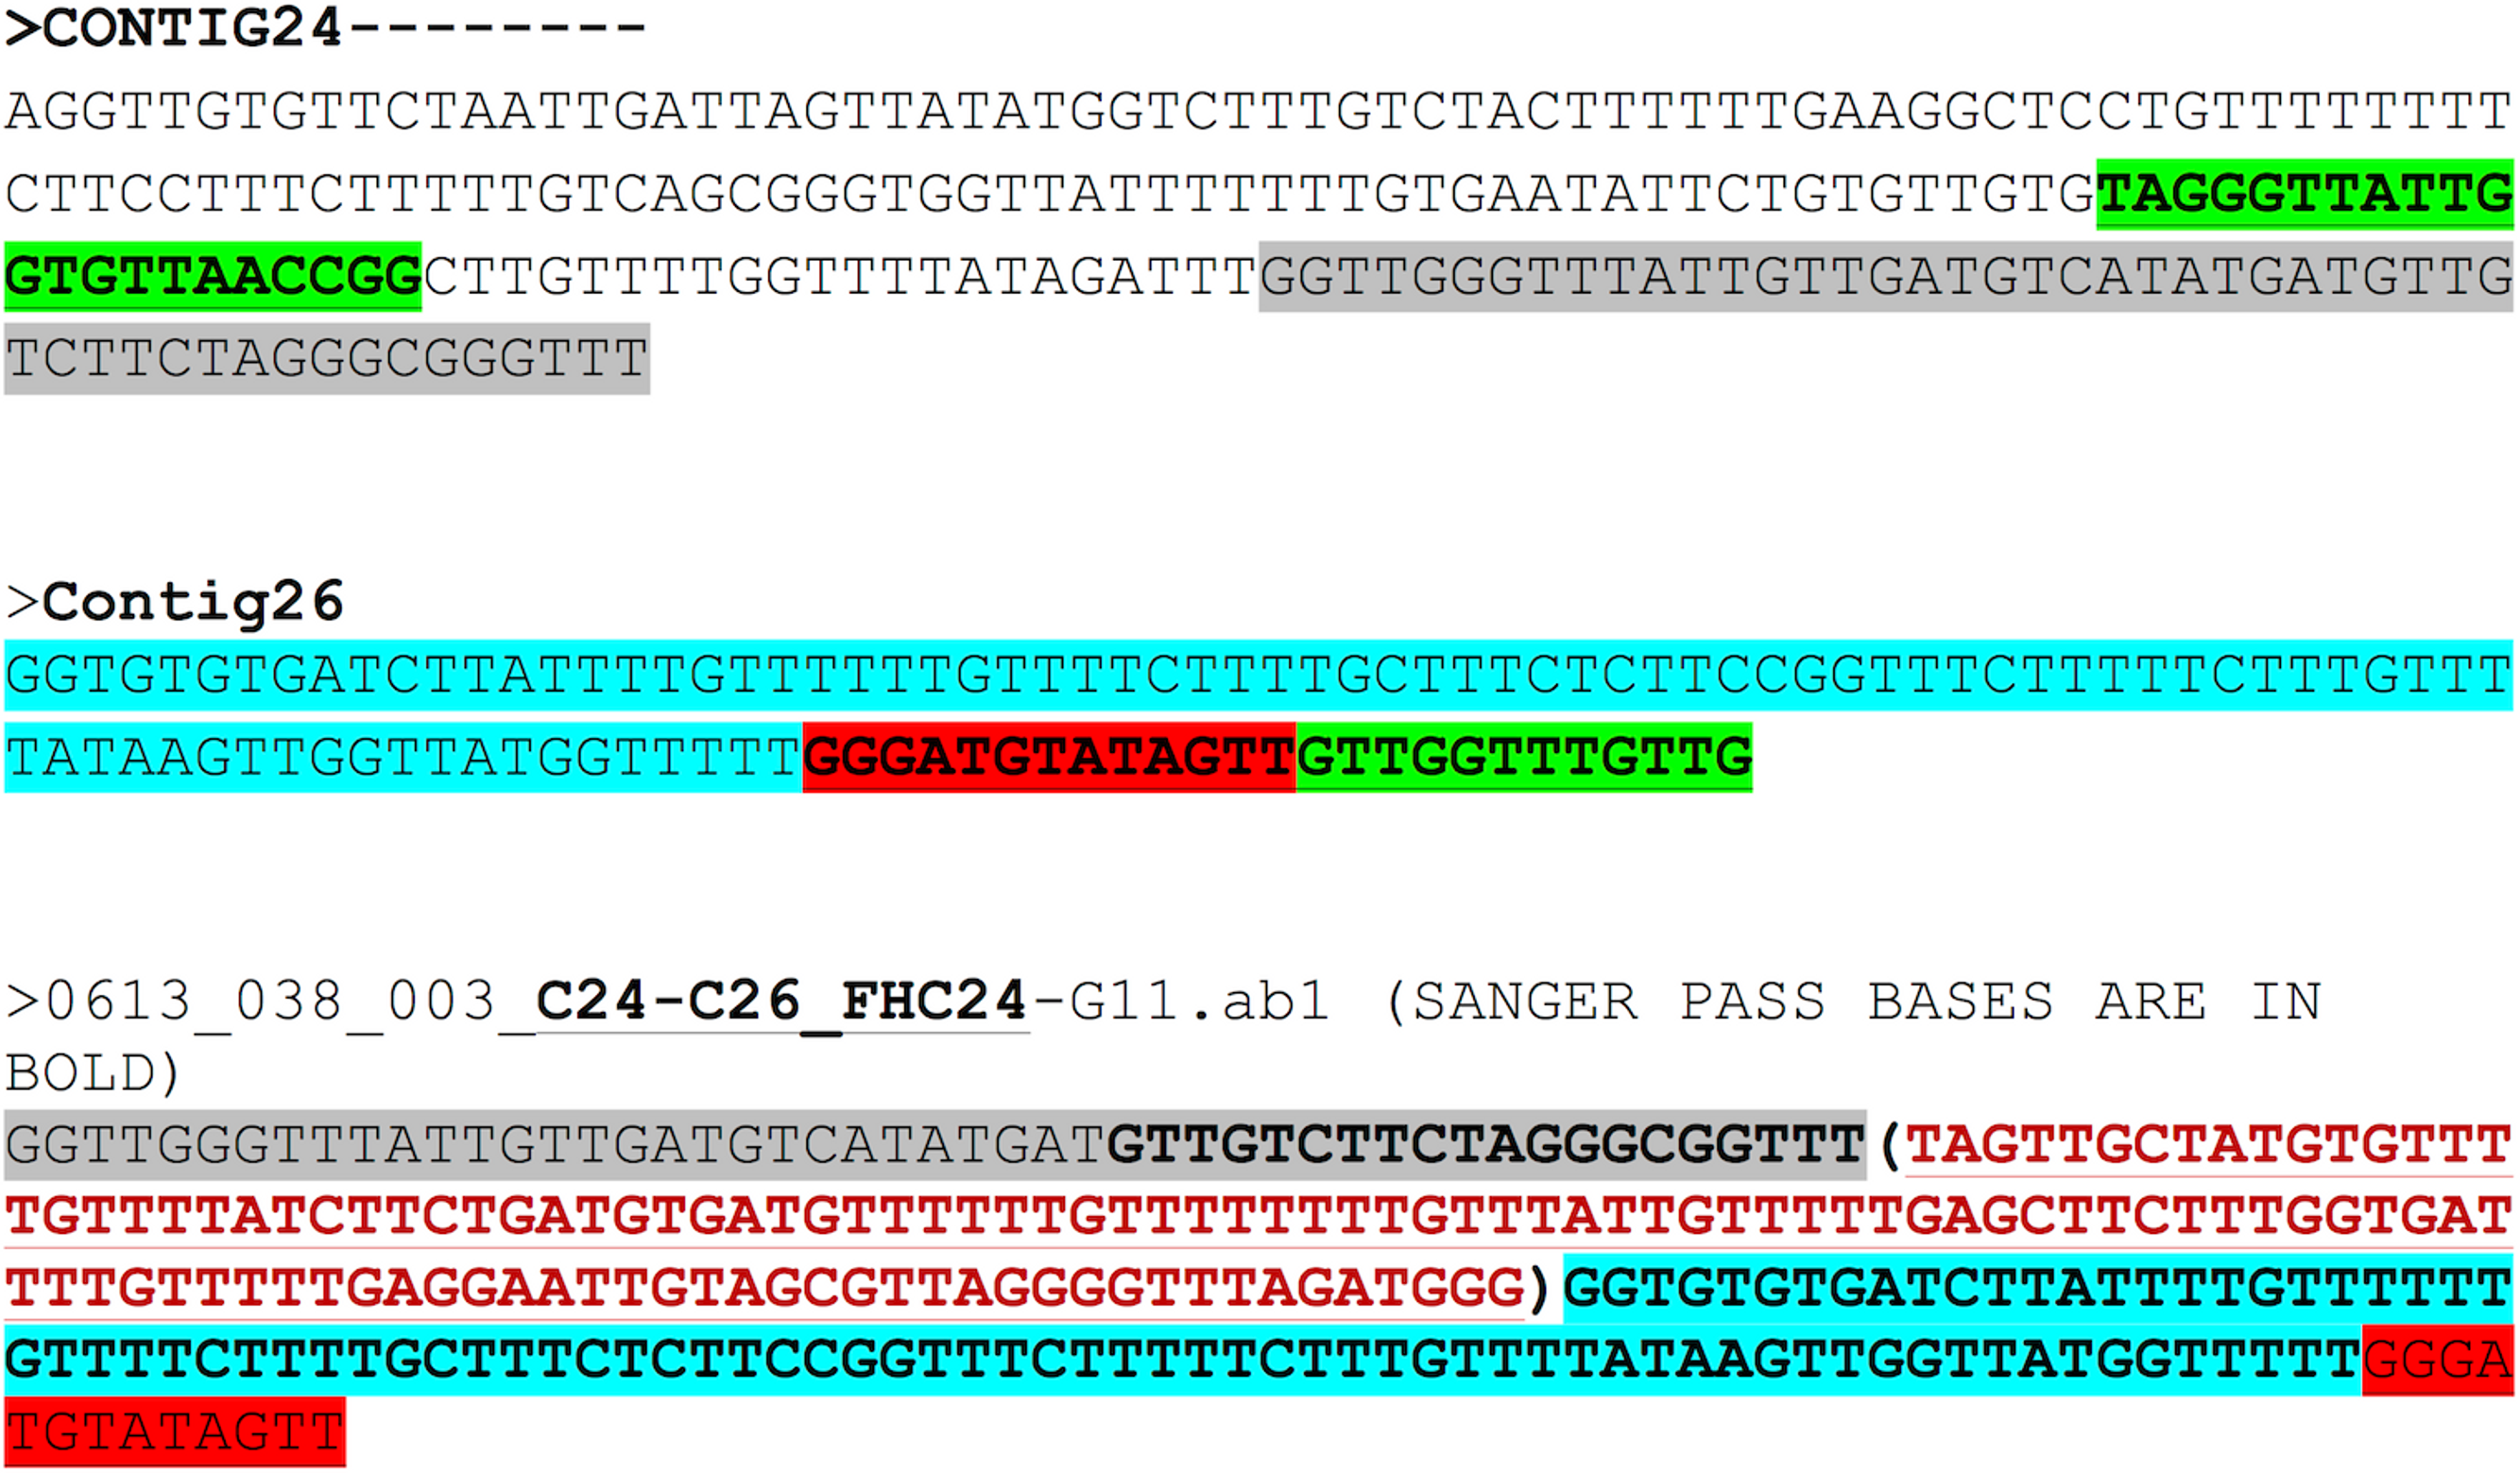
To confirm our findings reported herein, whole genomic DNA from an independent F. buski sample replicate (Sample FD3) was used and Sanger sequencing was performed on two separate regions (Sample FD3-Region C24–C26 and Sample FD3-Region C2–C16) as described above. The regions from two independent biological sample replicates (FD2 and FD3) by Sanger sequencing exhibited 98–99% identity and thus validated our results (Fig. 5).
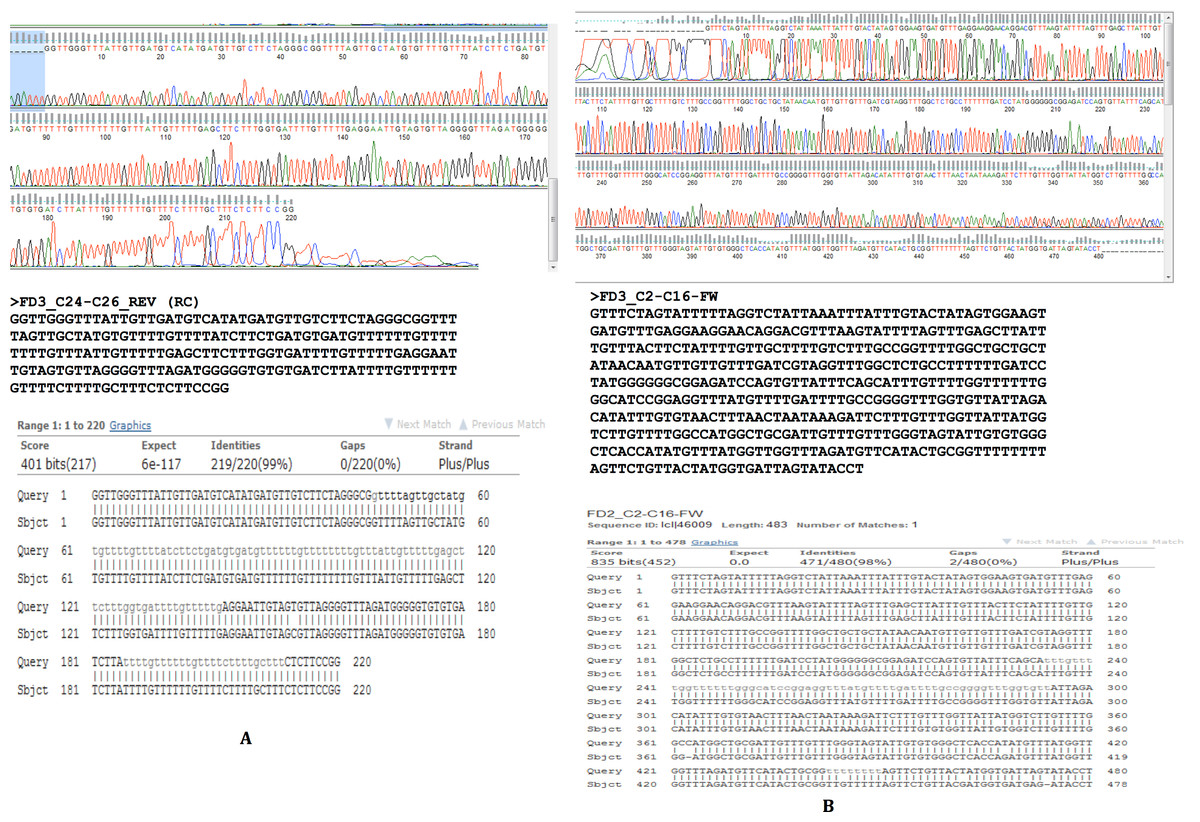
Figure 5: Sanger sequencing confirmatory results for FD2 and FD3 replicate samples.
Two separate regions from two independent biological samples sequenced by Sanger methods showing 98–99% identity between samples FD2 (subject) and FD3 (query) in the regions C2–C16 and C24–C26.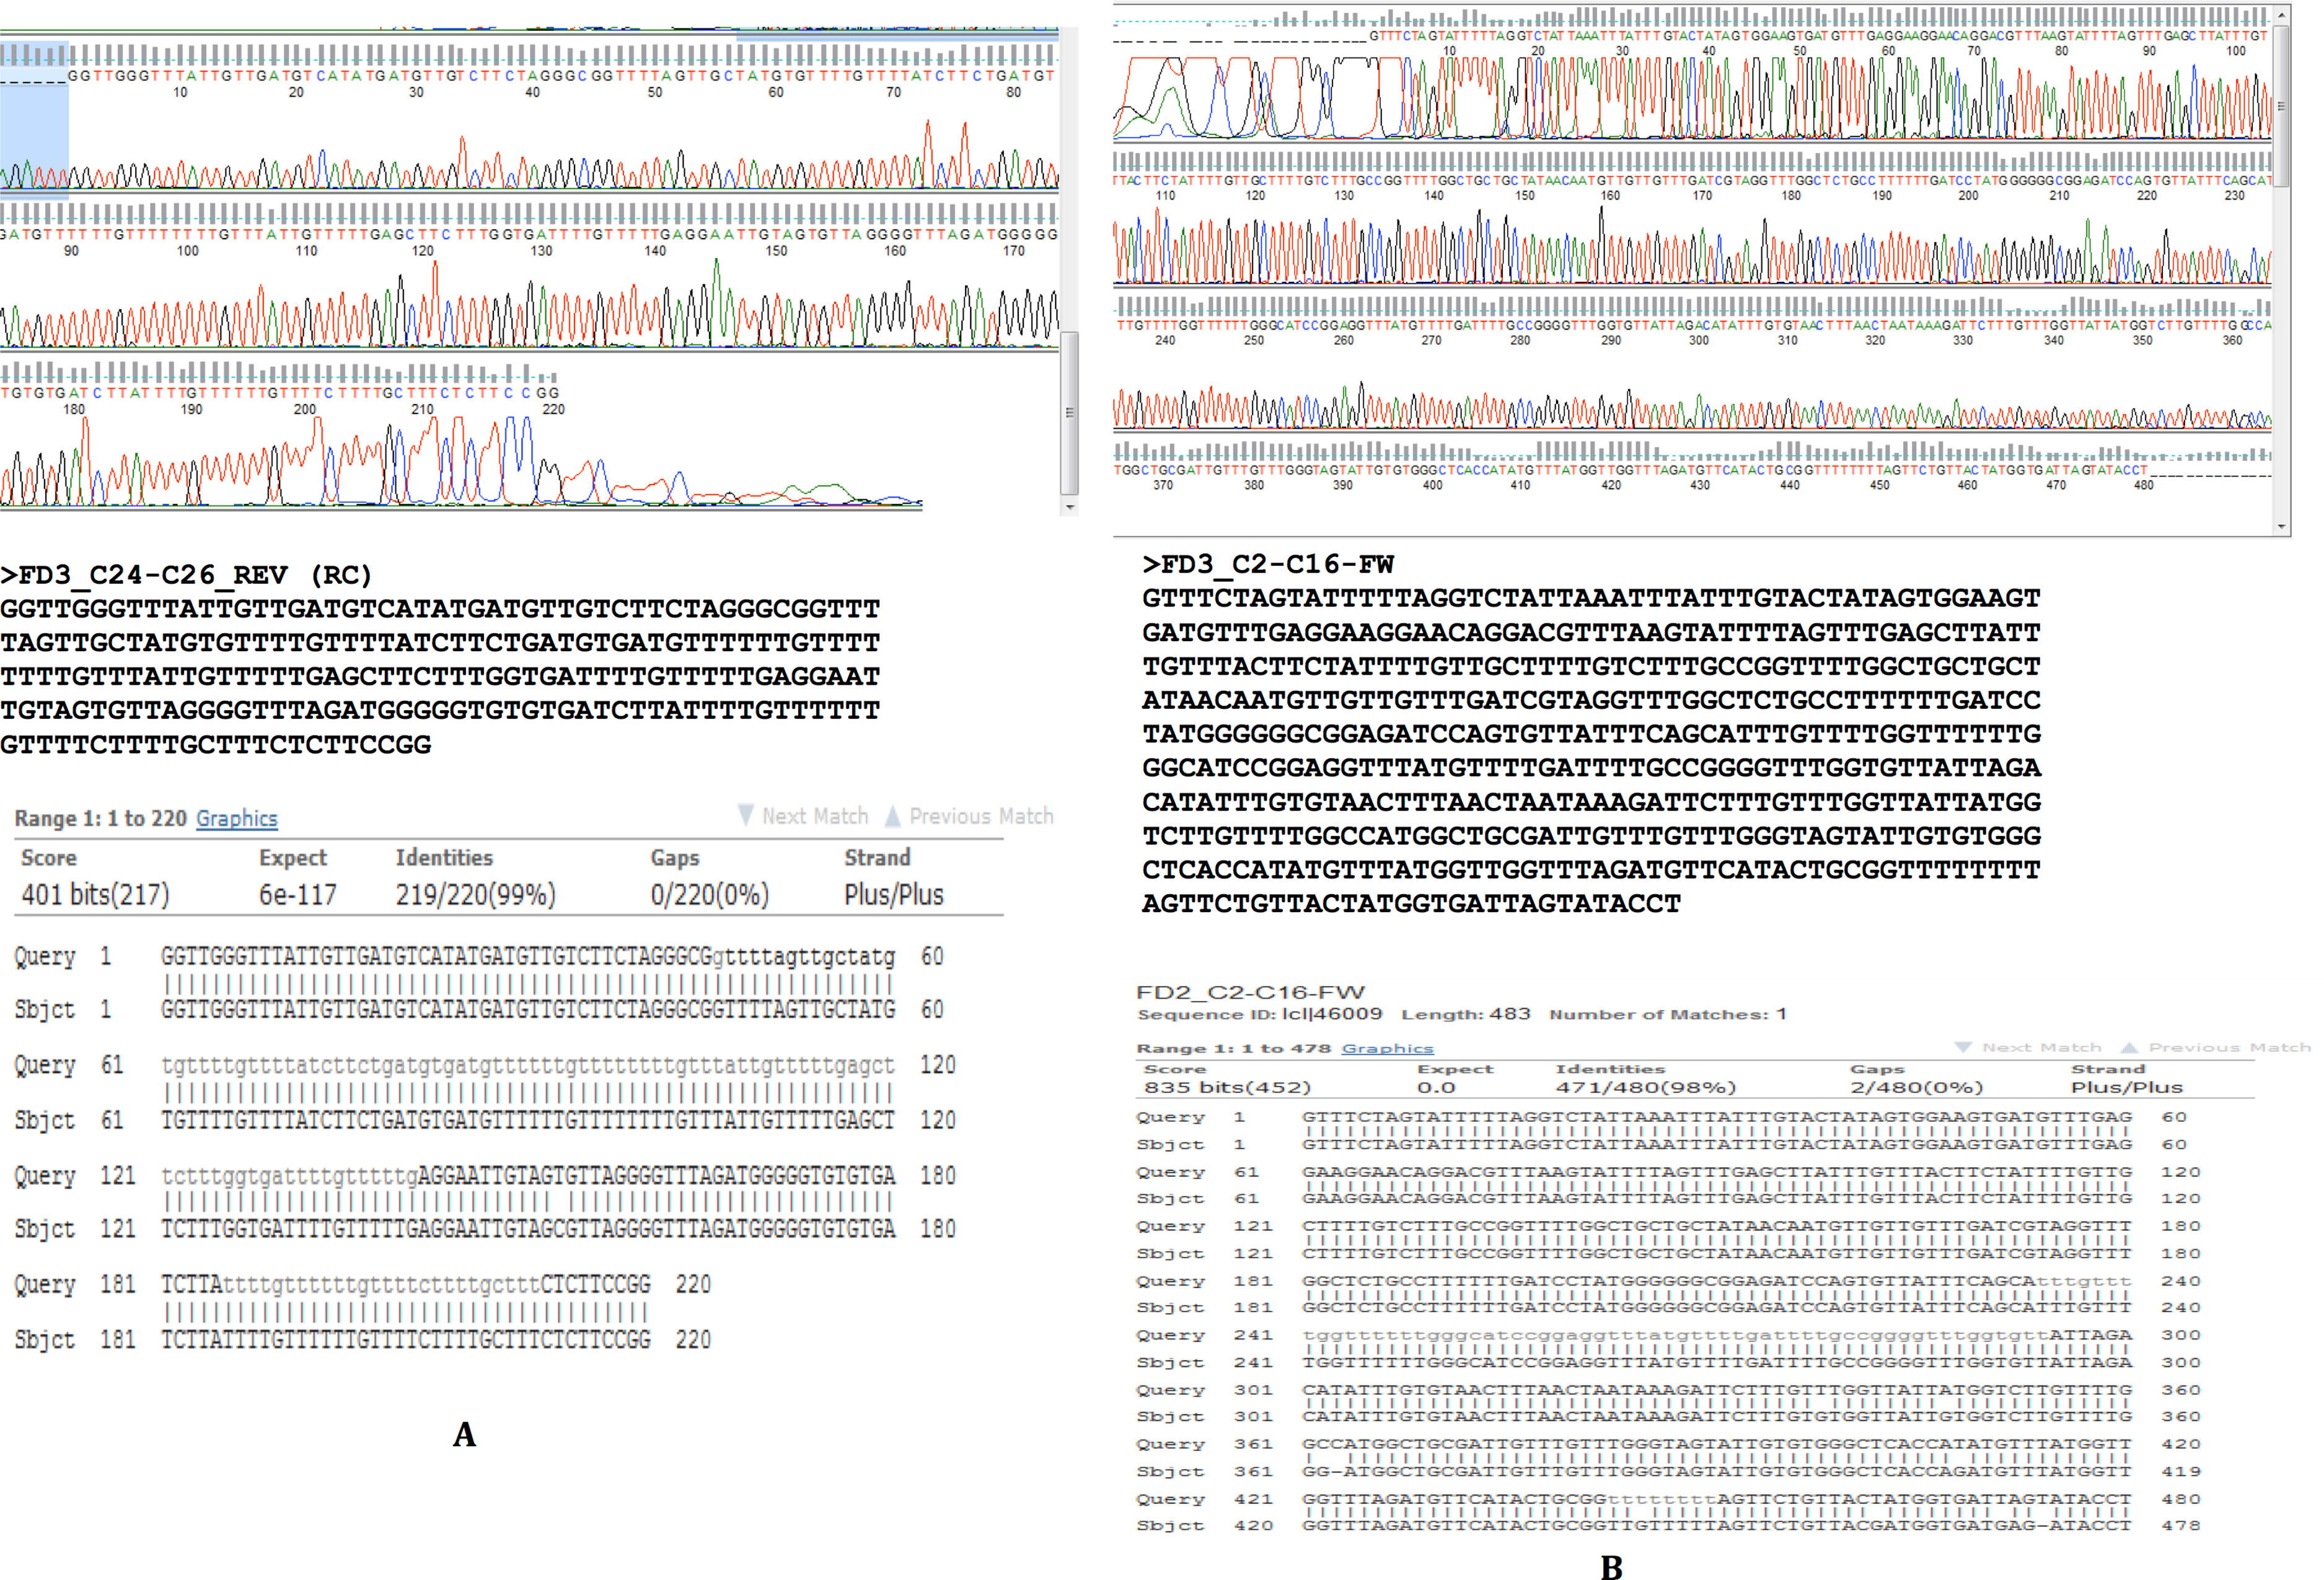
The data pertaining to this study is available in the National Centre for Biotechnology Information (NCBI) Bioproject database with Accession: PRJNA210017and ID: 210017. The contig assembly files are deposited in NCBI Sequence Read Archive (SRA) with Accession: SRR924085.
In silico analysis for nucleotide sequence statistics, protein coding genes (PCGs) prediction, annotation and tRNA prediction
Sequences were assembled and edited both manually and using CLC Genome Workbench V.6.02 with comparison to published flatworm genomes. The platyhelminth genetic code (Telford et al., 2000) was used for translation of reading frames. Protein-coding genes were identified by similarity of inferred amino acid sequences to those of other platyhelminth mtDNAs available in GenBank. Boundaries of rRNA genes both large (rrnL) and small (rrnS) were determined by comparing alignments and secondary structures with other known flatworm sequences. The program ARWEN (Laslett & Canbäck, 2008) was used to identify the tRNA genes (trns). To find all tRNAs, searches were modified to find secondary structures occasionally with very low Cove scores (<0.5) and, where necessary, also by restricting searches to find tRNAs lacking DHU arms (using the nematode tRNA option). Nucleotide codon usage for each protein-encoding gene was determined using the program Codon Usage) at http://www.bioinformatics.org/sms2/codon_usage.html. The ORFs and codon usage profiles of PCGs were analyzed. Gene annotation, genome organization, translation initiation, translation termination codons, and the boundaries between protein-coding genes of mt genomes of the two fasciolid flukes were identified based on comparison with mt genomes of other trematodes reported previously (Le et al., 2002). The mtDNA genome of F. buski was annotated taking F. hepatica as a reference genome using several open source tools viz. Dual Organellar Genome Annotator (DOGMA) (Wyman, Jansen & Boore, 2004), Organellar Genome Retrieval System (OGRe) (Jameson et al., 2003) and Mitozoa database (D’Onorio de Meo et al., 2011). The newly sequenced and assembled F. buski mtDNA was sketched with GenomeVX at http://wolfe.ucd.ie/GenomeVx/ with annotation files from DOGMA (Wyman, Jansen & Boore, 2004).
Phylogenetic analysis
The 12 PCGs were concatenated and a super matrix was created in Mesquite (Maddison & Maddison, 2001) and run in MrBayes (Ronquist & Huelsenbeck, 2003). Phylogenetic analyses of concatenated nucleotide sequence datasets for all 12 PCGs were performed using Bayesian inference [BI]). MrBayes was executed using four MCMC chains and 106 generations, sampled every 1,000 generations. Each of the 12 genes was treated as a separate unlinked data partition. Bayesian posterior probability (BPP) values were determined after discarding the initial 200 trees (the first 2 × 10⁵ generations) as burn-in. Using the phylogeny estimated from the nuclear ribosomal DNA data set, pictograms of full mitochondrial genes indicating the gene order were aligned next to the individual ‘leaves’ of the tree (Fig. 6).
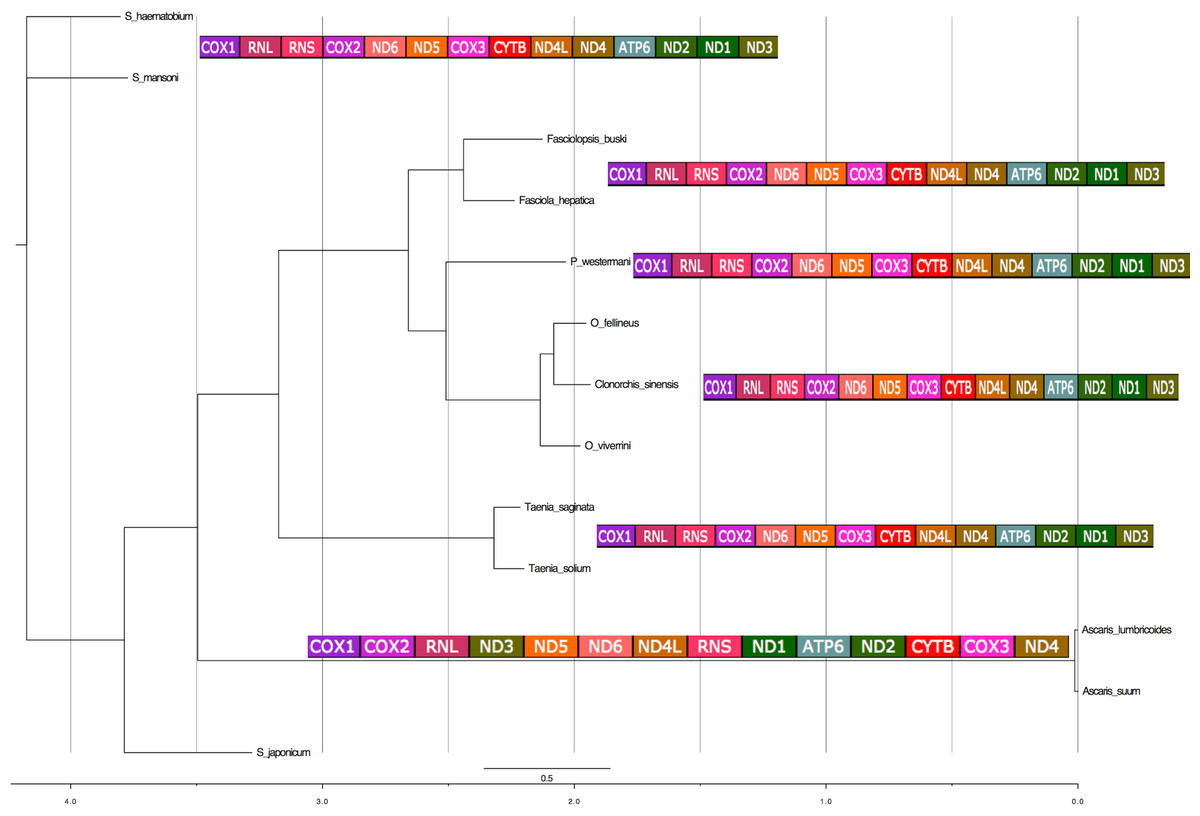
Figure 6: Phylogenetic analysis of the concatenated 12 protein coding genes from the platyhelminth mtDNA.
Differences in the gene order in the mitochondrial genomes of parasitic flatworms from the Trematoda and Cestoda and taking Nematoda (Ascaridida) as an outgroup. Phylogenetic analyses of concatenated nucleotide sequence datasets for all 12 PCGs were performed using Bayesian Inference using four MCMC chains and 106 generations, sampled every 1,000 generations. Bayesian posterior probability (BPP) values were determined after discarding the initial 200 trees (the first 2 × 10⁵ generations) as burn-in. Using the phylogeny estimated from the nuclear ribosomal DNA data set, pictograms of full mitochondrial genes are indicated next to the individual leaves of the tree. x-axis represents substitution rates per unit.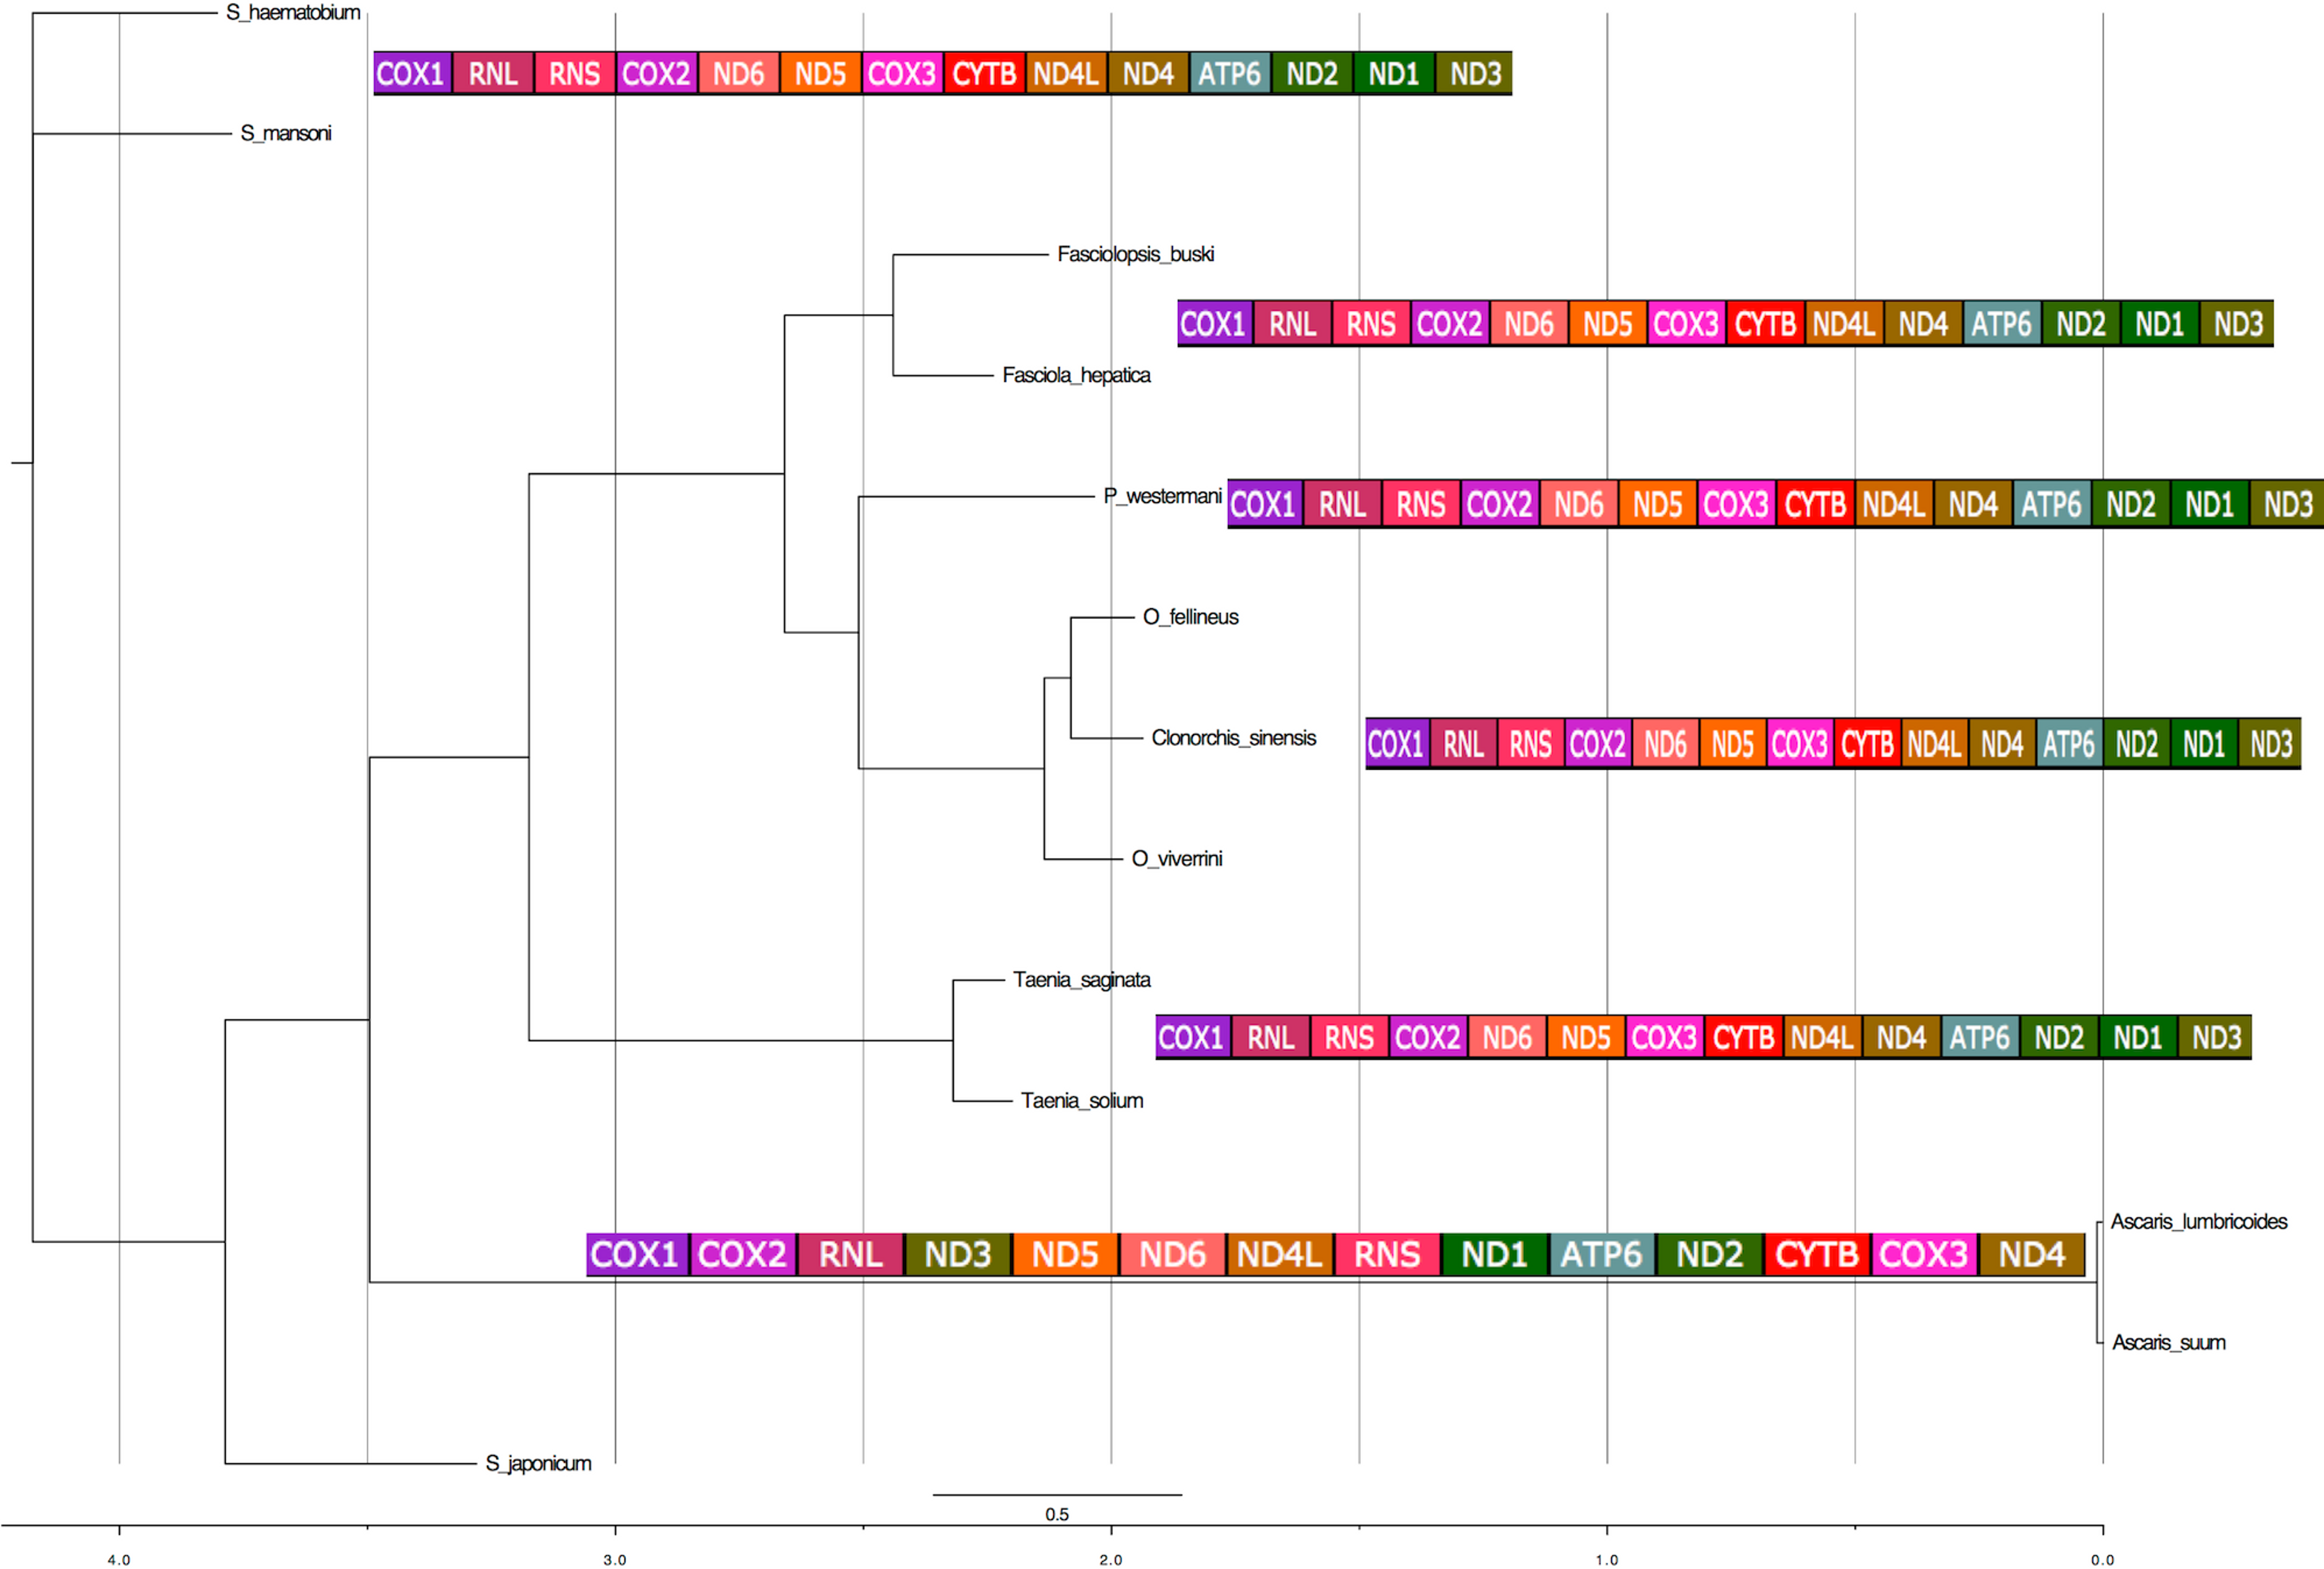
Results and Discussion
Gene contents and organization
The intestinal fluke F. buski has a mt genome typical of most platyhelminths (Fig. 7A). The circular genome consists of 14118 nt bp and is almost similar to that of Fasciola hepatica (Fig. 7B). The 12 protein-coding genes fall into the following categories: nicotinamide dehydrogenase complex (nad1–nad6 and nad4L subunits); cytochrome c oxidase complex (cox1–cox3 subunits); cytochrome b (cob) and adenosine triphosphatase subunit 6 (atp6). Two genes encoding ribosomal RNA subunits are present: the large subunit (rrnL or 16S) and small subunit (rrnS or 12S), which are separated by trnC, encoding the transfer RNA (tRNA) for cysteine. As in other mt genomes, there are 22 tRNA genes, denoted in the figure by the one-letter code for the amino acid they encode. Leu and Ser are each specified by two different tRNAs, reflecting the number and base composition of the relevant codons. As in other flatworms, all genes are transcribed in the same direction (Fig. 7). Genes lack introns and are usually adjacent to one another or separated by only a few nucleotides. However, some genes overlap, most notably nad4, nad4L and with regions of the long non coding region, which is almost 500 nt length.

Figure 7: Circular genome map of Fasciola hepatica and Fasciolopsis buski.
The manual and in silico annotations with appropriate regions for F. buski (7A) and annotated GenBank flat file for F. hepatica (7B) were drawn into a circular graph in GenomeVX depicting the 12 PCGs and 22tRNAs.
Nucleotide composition and codon usage
Invertebrate mt genomes tend to be AT-rich (Malakhov, 1994), which is a notable feature in PCGs of several parasitic flatworms. However, nucleotide composition is not uniform among the species (Table 2). Values for >70% AT are seen in all Schistosoma spp. except for S. mansoni (68.7%), whereas F. buski and Fasciola hepatica are 60% AT rich and Paragonimus westermani, only 50% AT rich. Cytosine is poorly represented in F. buski. The annotation and nucleotide sequence statistics are enumerated in Tables 2–5. The gene content and arrangement are identical to those of F. hepatica. ATG and GTG are used as the start-codons and TAG and TAA, the stop-codons.
| Sequence type | DNA | DNA | DNA | DNA | DNA | DNA | DNA | DNA | DNA | DNA | DNA | DNA | DNA |
|---|---|---|---|---|---|---|---|---|---|---|---|---|---|
| Length | 14,118 bp circular |
14,462 bp circular |
14,965 bp circular |
14,277 bp circular |
13,510 bp | 13,875 bp circular |
15,003 bp circular |
14,415 bp circular |
14,085 bp circular |
13,670 bp circular |
13,709 bp circular |
14,281 bp circular |
14,284 bp circular |
| Organism name |
Fasciolopsis
buski |
Fasciola
hepatica |
Paragonimus
westermani |
Opisthorchis
felineus |
Opisthorchis
viverrini |
Clonorchis
sinensis |
Schistosoma
haematobium |
Schistosoma
mansoni |
Schistosoma
japonicum |
Taenia
saginata |
Taenia
solium |
Ascaris
lumbricoides |
Ascaris
suum |
| Accession | Submitted to GenBank |
NC_002546 | NC_002354 | EU921260 | JF739555 | FJ381664 | NC_008074 | NC_002545 | NC_002544 | NC_009938 | NC_004022 | JN801161 | NC_001327 |
| Modification date | submitted | 01-FEB- 2010 |
01-FEB- 2010 |
18-AUG- 2010 |
05-APR- 2012 |
01-JUL- 2010 |
14-APR- 2009 |
14-APR- 2009 |
01-FEB- 2010 |
14-APR- 2009 |
01-FEB- 2010 |
01-DEC- 2011 |
11-MAR- 2010 |
| Weight (single-stranded) |
4396.507 | 4,499.496 kDa |
4,652.101 kDa |
4,437.683 kDa |
4,197.397 kDa |
4,311.834 kDa |
4,658.966 kDa |
4,482.165 kDa |
4,371.002 kDa |
4,242.425 kDa |
4,251.992 kDa |
4,428.619 kDa |
4,429.981 kDa |
| Weight (double-stranded) |
8721.667 | 8,934.244 kDa |
9,246.535 kDa |
8,820.283 kDa |
8,346.532 kDa |
8,571.888 kDa |
9,266.949 kDa |
8,904.302 kDa |
8,700.11 kDa |
8,443.711 kDa |
8,467.723 kDa |
8,443.711 kDa |
8,822.899 kDa |
| Annotation table | |||||||||||||
| Feature type | Count | Count | Count | Count | Count | Count | Count | Count | Count | Count | Count | Count | |
| CDS | 12 | 12 | 12 | 12 | 12 | 12 | 12 | 12 | 12 | 12 | 12 | 12 | 12 |
| Gene | 12 | 12 | 12 | 12 | 12 | 12 | 12 | 12 | 12 | 12 | 12 | 12 | 12 |
| Misc. feature | 1 | 1 | - | - | - | - | 1 | 1 | - | - | 1 | 2 | |
| rRNA | 2 | 2 | 1 | 2 | 2 | 2 | 2 | 2 | 2 | 2 | 2 | 2 | 2 |
| tRNA | 22 | 22 | 23 | 22 | 20 | 22 | 22 | 23 | 23 | 22 | 22 | 22 | 22 |
| Atom | Count | Frequency | Nucleotide | Count | Frequency |
|---|---|---|---|---|---|
| As single stranded | Adenine (A) | 2509 | 0.178 | ||
| Hydrogen (H) | 174924 | 0.376 | Cytosine (C) | 1281 | 0.091 |
| Carbon (C) | 139209 | 0.299 | Guanine (G) | 3925 | 0.278 |
| Nitrogen (N) | 48681 | 0.105 | Thymine (T) | 6334 | 0.449 |
| Oxygen (O) | 88120 | 0.19 | Purine (R) | 0 | 0 |
| Phosphorus (P) | 14049 | 0.03 | Pyrimidine (Y) | 0 | 0 |
| As double stranded | Adenine or cytosine (M) | 0 | 0 | ||
| Hydrogen (H) | 346023 | 0.375 | Guanine or thymine (K) | 0 | 0 |
| Carbon (C) | 275774 | 0.299 | Cytosine or guanine (S) | 0 | 0 |
| Nitrogen (N) | 103549 | 0.112 | Adenine or thymine (W) | 0 | 0 |
| Oxygen (O) | 168590 | 0.183 | Not adenine (B) | 0 | 0 |
| Phosphorus (P) | 28098 | 0.03 | Not cytosine (D) | 0 | 0 |
| Not guanine (H) | 0 | 0 | |||
| Not thymine (V) | 0 | 0 | |||
| Any nucleotide (N) | 69 | 0.005 | |||
| C + G | 5206 | 0.369 | |||
| A + T | 8843 | 0.626 | |||
| AmAcid | Codon | Number | /1000 | Fraction |
|---|---|---|---|---|
| Ala | GCG | 22.00 | 4.74 | 0.20 |
| Ala | GCA | 26.00 | 5.60 | 0.24 |
| Ala | GCT | 46.00 | 9.91 | 0.43 |
| Ala | GCC | 14.00 | 3.02 | 0.13 |
| Cys | TGT | 239.00 | 51.49 | 0.80 |
| Cys | TGC | 58.00 | 12.49 | 0.20 |
| Asp | GAT | 90.00 | 19.39 | 0.85 |
| Asp | GAC | 16.00 | 3.45 | 0.15 |
| Glu | GAG | 63.00 | 13.57 | 0.68 |
| Glu | GAA | 30.00 | 6.46 | 0.32 |
| Phe | TTT | 442.00 | 95.22 | 0.85 |
| Phe | TTC | 79.00 | 17.02 | 0.15 |
| Gly | GGG | 119.00 | 25.64 | 0.28 |
| Gly | GGA | 67.00 | 14.43 | 0.16 |
| Gly | GGT | 201.00 | 43.30 | 0.48 |
| Gly | GGC | 31.00 | 6.68 | 0.07 |
| His | CAT | 19.00 | 4.09 | 0.73 |
| His | CAC | 7.00 | 1.51 | 0.27 |
| Ile | ATT | 168.00 | 36.19 | 0.86 |
| Ile | ATC | 28.00 | 6.03 | 0.14 |
| Lys | AAG | 42.00 | 9.05 | 1.00 |
| Leu | TTG | 263.00 | 56.66 | 0.36 |
| Leu | TTA | 193.00 | 41.58 | 0.27 |
| Leu | CTG | 70.00 | 15.08 | 0.10 |
| Leu | CTA | 53.00 | 11.42 | 0.07 |
| Leu | CTT | 117.00 | 25.20 | 0.16 |
| Leu | CTC | 26.00 | 5.60 | 0.04 |
| Met | ATG | 101.00 | 21.76 | 0.58 |
| Met | ATA | 72.00 | 15.51 | 0.42 |
| Asn | AAA | 39.00 | 8.40 | 0.34 |
| Asn | AAT | 64.00 | 13.79 | 0.56 |
| Asn | AAC | 11.00 | 2.37 | 0.10 |
| Pro | CCG | 16.00 | 3.45 | 0.27 |
| Pro | CCA | 10.00 | 2.15 | 0.17 |
| Pro | CCT | 27.00 | 5.82 | 0.45 |
| Pro | CCC | 7.00 | 1.51 | 0.12 |
| Gln | CAG | 19.00 | 4.09 | 0.63 |
| Gln | CAA | 11.00 | 2.37 | 0.37 |
| Arg | CGG | 34.00 | 7.32 | 0.33 |
| Arg | CGA | 15.00 | 3.23 | 0.14 |
| Arg | CGT | 44.00 | 9.48 | 0.42 |
| Arg | CGC | 11.00 | 2.37 | 0.11 |
| Ser | AGG | 100.00 | 21.54 | 0.25 |
| Ser | AGA | 49.00 | 10.56 | 0.12 |
| Ser | AGT | 88.00 | 18.96 | 0.22 |
| Ser | AGC | 17.00 | 3.66 | 0.04 |
| Ser | TCG | 30.00 | 6.46 | 0.07 |
| Ser | TCA | 25.00 | 5.39 | 0.06 |
| Ser | TCT | 69.00 | 14.86 | 0.17 |
| Ser | TCC | 28.00 | 6.03 | 0.07 |
| Thr | ACG | 7.00 | 1.51 | 0.14 |
| Thr | ACA | 14.00 | 3.02 | 0.27 |
| Thr | ACT | 19.00 | 4.09 | 0.37 |
| Thr | ACC | 11.00 | 2.37 | 0.22 |
| Val | GTG | 114.00 | 24.56 | 0.22 |
| Val | GTA | 95.00 | 20.47 | 0.19 |
| Val | GTT | 270.00 | 58.16 | 0.53 |
| Val | GTC | 34.00 | 7.32 | 0.07 |
| Trp | TGG | 174.00 | 37.48 | 0.60 |
| Trp | TGA | 115.00 | 24.77 | 0.40 |
| Tyr | TAT | 160.00 | 34.47 | 0.83 |
| Tyr | TAC | 32.00 | 6.89 | 0.17 |
| End | TAG | 118.00 | 25.42 | 0.65 |
| End | TAA | 63.00 | 13.57 | 0.35 |
| Counts of di-nucleotides in F. buski mtDNA | ||||
| 1.pos∖2.pos | A | C | G | T |
| A | 467 | 191 | 766 | 1072 |
| C | 217 | 204 | 262 | 593 |
| G | 656 | 347 | 1263 | 1645 |
| T | 1158 | 530 | 1619 | 2997 |
| Frequency of di-nucleotides in F. buski mtDNA | ||||
| 1.pos∖2.pos | A | C | G | T |
| A | 0.033 | 0.014 | 0.055 | 0.077 |
| C | 0.016 | 0.015 | 0.019 | 0.042 |
| G | 0.047 | 0.025 | 0.09 | 0.118 |
| T | 0.083 | 0.038 | 0.116 | 0.214 |
| Gene | Length in F. hepatica |
Gene prediction length in F. buski |
% of F. hepatica CDS covered in F. buski |
|
|---|---|---|---|---|
| 1 | nad3 | 118 | 97 | 82.20 |
| 2 | nad2 | 288 | 257 | 89.24 |
| 3 | cox1 | 510 | 470 | 92.16 |
| 4 | nad1 | 300 | 278 | 92.67 |
| 5 | cox2 | 200 | 194 | 97.00 |
| 6 | cox3 | 213 | 210 | 98.59 |
| 7 | nad5 | 522 | 515 | 98.66 |
| 8 | cob | 370 | 366 | 98.92 |
| 9 | nad6 | 150 | 149 | 99.33 |
| 10 | nad4L | 90 | 90 | 100.00 |
| 11 | nad4 | 423 | 423 | 100.00 |
| 12 | atp6 | 172 | 172 | 100.00 |
| Contig start |
Contig end |
Length | tRNA ID | Codon | GC % | Single letter symbol |
|---|---|---|---|---|---|---|
| 657 | 722 | 66 | mtRNA-His | GUG | 30.3 | H |
| 3358 | 3424 | 67 | mtRNA-Gln | UUG | 35.8 | Q |
| 3438 | 3501 | 64 | mtRNA-Phe | GAA | 39.1 | F |
| 3511 | 3576 | 66 | mtRNA-Met | CAU | 40.9 | M |
| 5086 | 5150 | 65 | mtRNA-Val | UAC | 32.3 | V |
| 5168 | 5233 | 66 | mtRNA-Ala | UGC | 40.9 | A |
| 5233 | 5300 | 68 | mtRNA-Asp | GUC | 38.2 | D |
| 6213 | 6277 | 65 | mtRNA-Asn | GUU | 41.5 | N |
| 6282 | 6339 | 58 | TV-loop mtRNA-Pro | UGG | 31 | P |
| 6356 | 6418 | 63 | mtRNA-Ile | GAU | 47.6 | I |
| 6421 | 6487 | 67 | mtRNA-Lys | CUU | 38.8 | K |
| 6859 | 6919 | 61 | D-loop mtRNA-Ser | GCU | 41 | S1 |
| 6932 | 6994 | 63 | mtRNA-Trp | UCA | 34.9 | W |
| 8577 | 8641 | 65 | mtRNA-Thr | UGU | 30.8 | T |
| 9642 | 9707 | 66 | mtRNA-Cys | GCA | 50 | C |
| 11581 | 11646 | 66 | mtRNA-Tyr | GUA | 39.4 | Y |
| 11645 | 11709 | 65 | mtRNA-Leu | UAG | 49.2 | L1 |
| 11708 | 11772 | 65 | D-loop mtRNA-Ser | UGA | 36.9 | S2 |
| 11778 | 11841 | 64 | mtRNA-Leu | UAA | 37.5 | L2 |
| 11839 | 11910 | 72 | mtRNA-Arg | UCG | 37.5 | R |
| 13483 | 13551 | 69 | mtRNA-Gly | UCC | 30.4 | G |
| 13565 | 13628 | 64 | mtRNA-Glu | UUC | 43.8 | Q |
Among species considerable differences in base composition in PCGs are reflected in differences in the protein sequences. However, the redundancy in the genetic code provides a means by which a mt genome could theoretically compensate for base-composition bias. Increased use of abundant bases in the (largely redundant) third codon position accounts for the fact that base composition bias would be less marked in the first and second codon positions. A phylogenetic tree was computed concatenating all the annotated 12 PCGs that completely accounted for the platyhelminth phylogeny with the representative species (Fig. 8). F. buski came in the same clade with F. hepatica while Ascaris species formed the outgroup. The outgroup Ascaris lumbricoides displayed a different gene order that was aligned adjacent to the phylogenetic leaf nodes (Fig. 8).
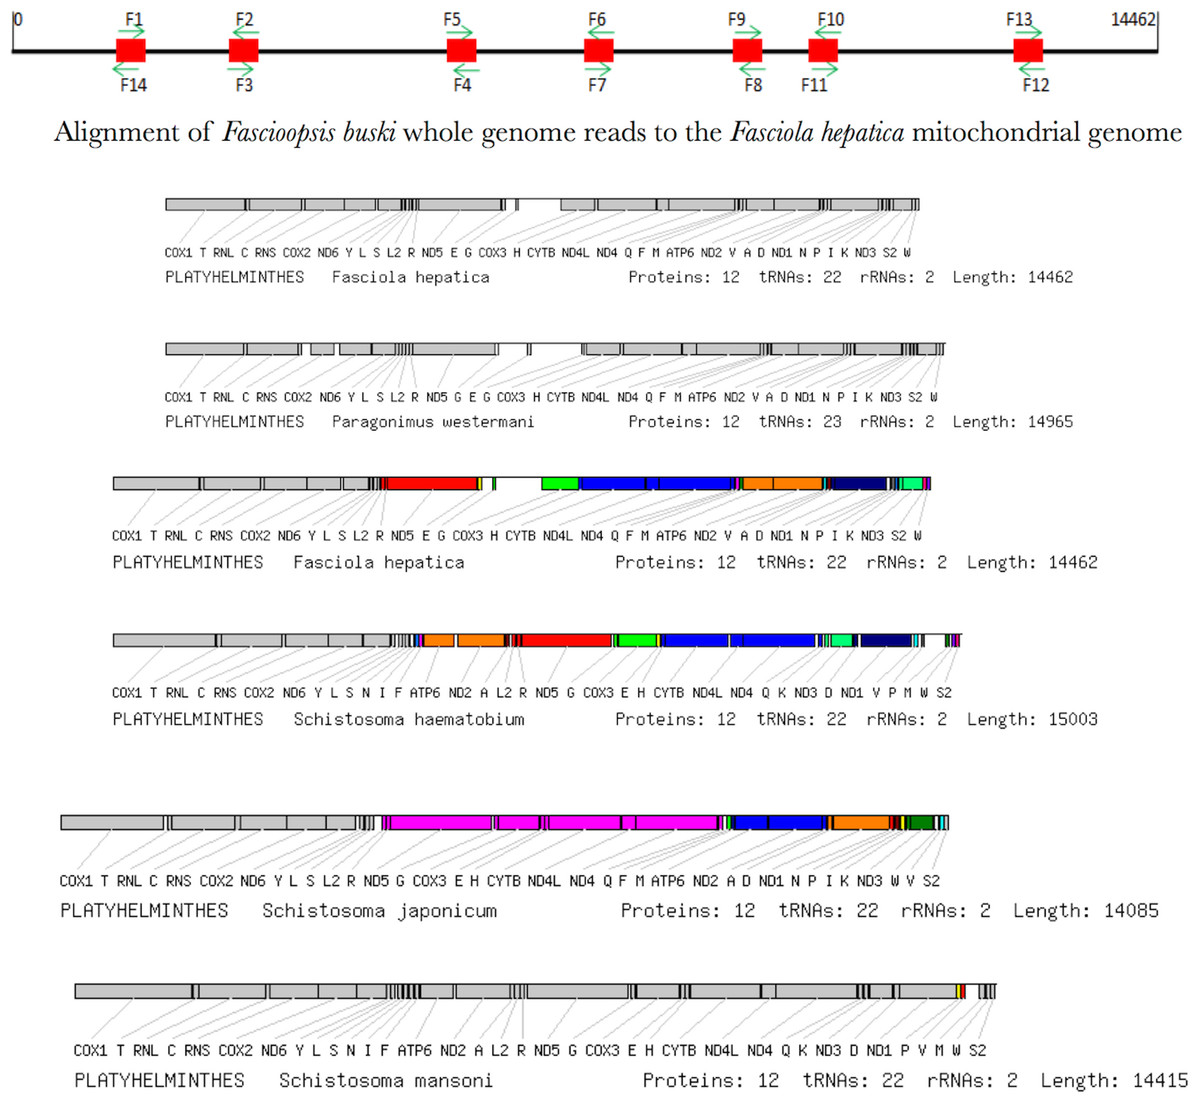
Figure 8: Synteny map of the representative species for the platyhelminth mtDNA.
A comparative synteny for all the 12 protein coding genes and 22/23 tRNAs for the representative platyhelminth parasites (Schistosoma spp, F. buski, Fasciola hepatica, Paragonimus westermani).
Transfer and ribosomal RNA genes
A total of 22 tRNAs were inferred along with structures (Fig. 9). The complete annotation along with their GC percentage is shown in Table 6. tRNA-Leu had the highest GC composition and the length varied between 60–70 nt bases. The tRNA genes generally resemble those of other invertebrates. A standard cloverleaf structure was inferred for most of the tRNAs. Exceptions include tRNA(S) in which the paired dihydrouridine (DHU) arm is missing as usual in all parasitic flatworm species (also seen in some other metazoans) and also tRNA(A) in which the paired DHU-arm is missing in cestodes but not in trematodes (and not usually in other metazoans) and hence, was also seen in F. buski. Structures for tRNA(C) vary somewhat among the parasitic flatworms. A paired DHU-arm is present in F. buski, which is not seen in Schistosoma mekongi and cestodes. A comparative synteny for all the 12 protein coding genes and 22/23 tRNAs for the representative platyhelminth parasites can be seen across all the species under study (Fig. 8).
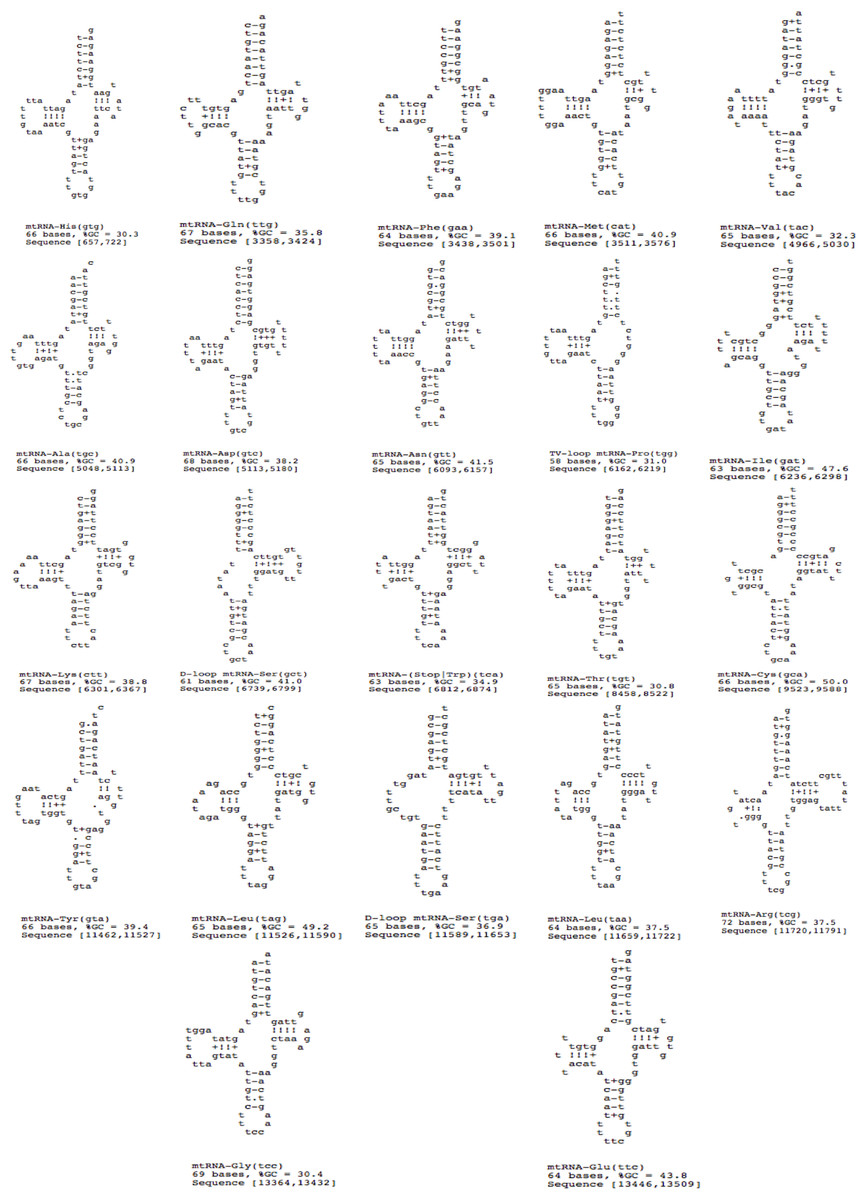
Figure 9: 22 tRNA secondary structures predicted using ARWEN.
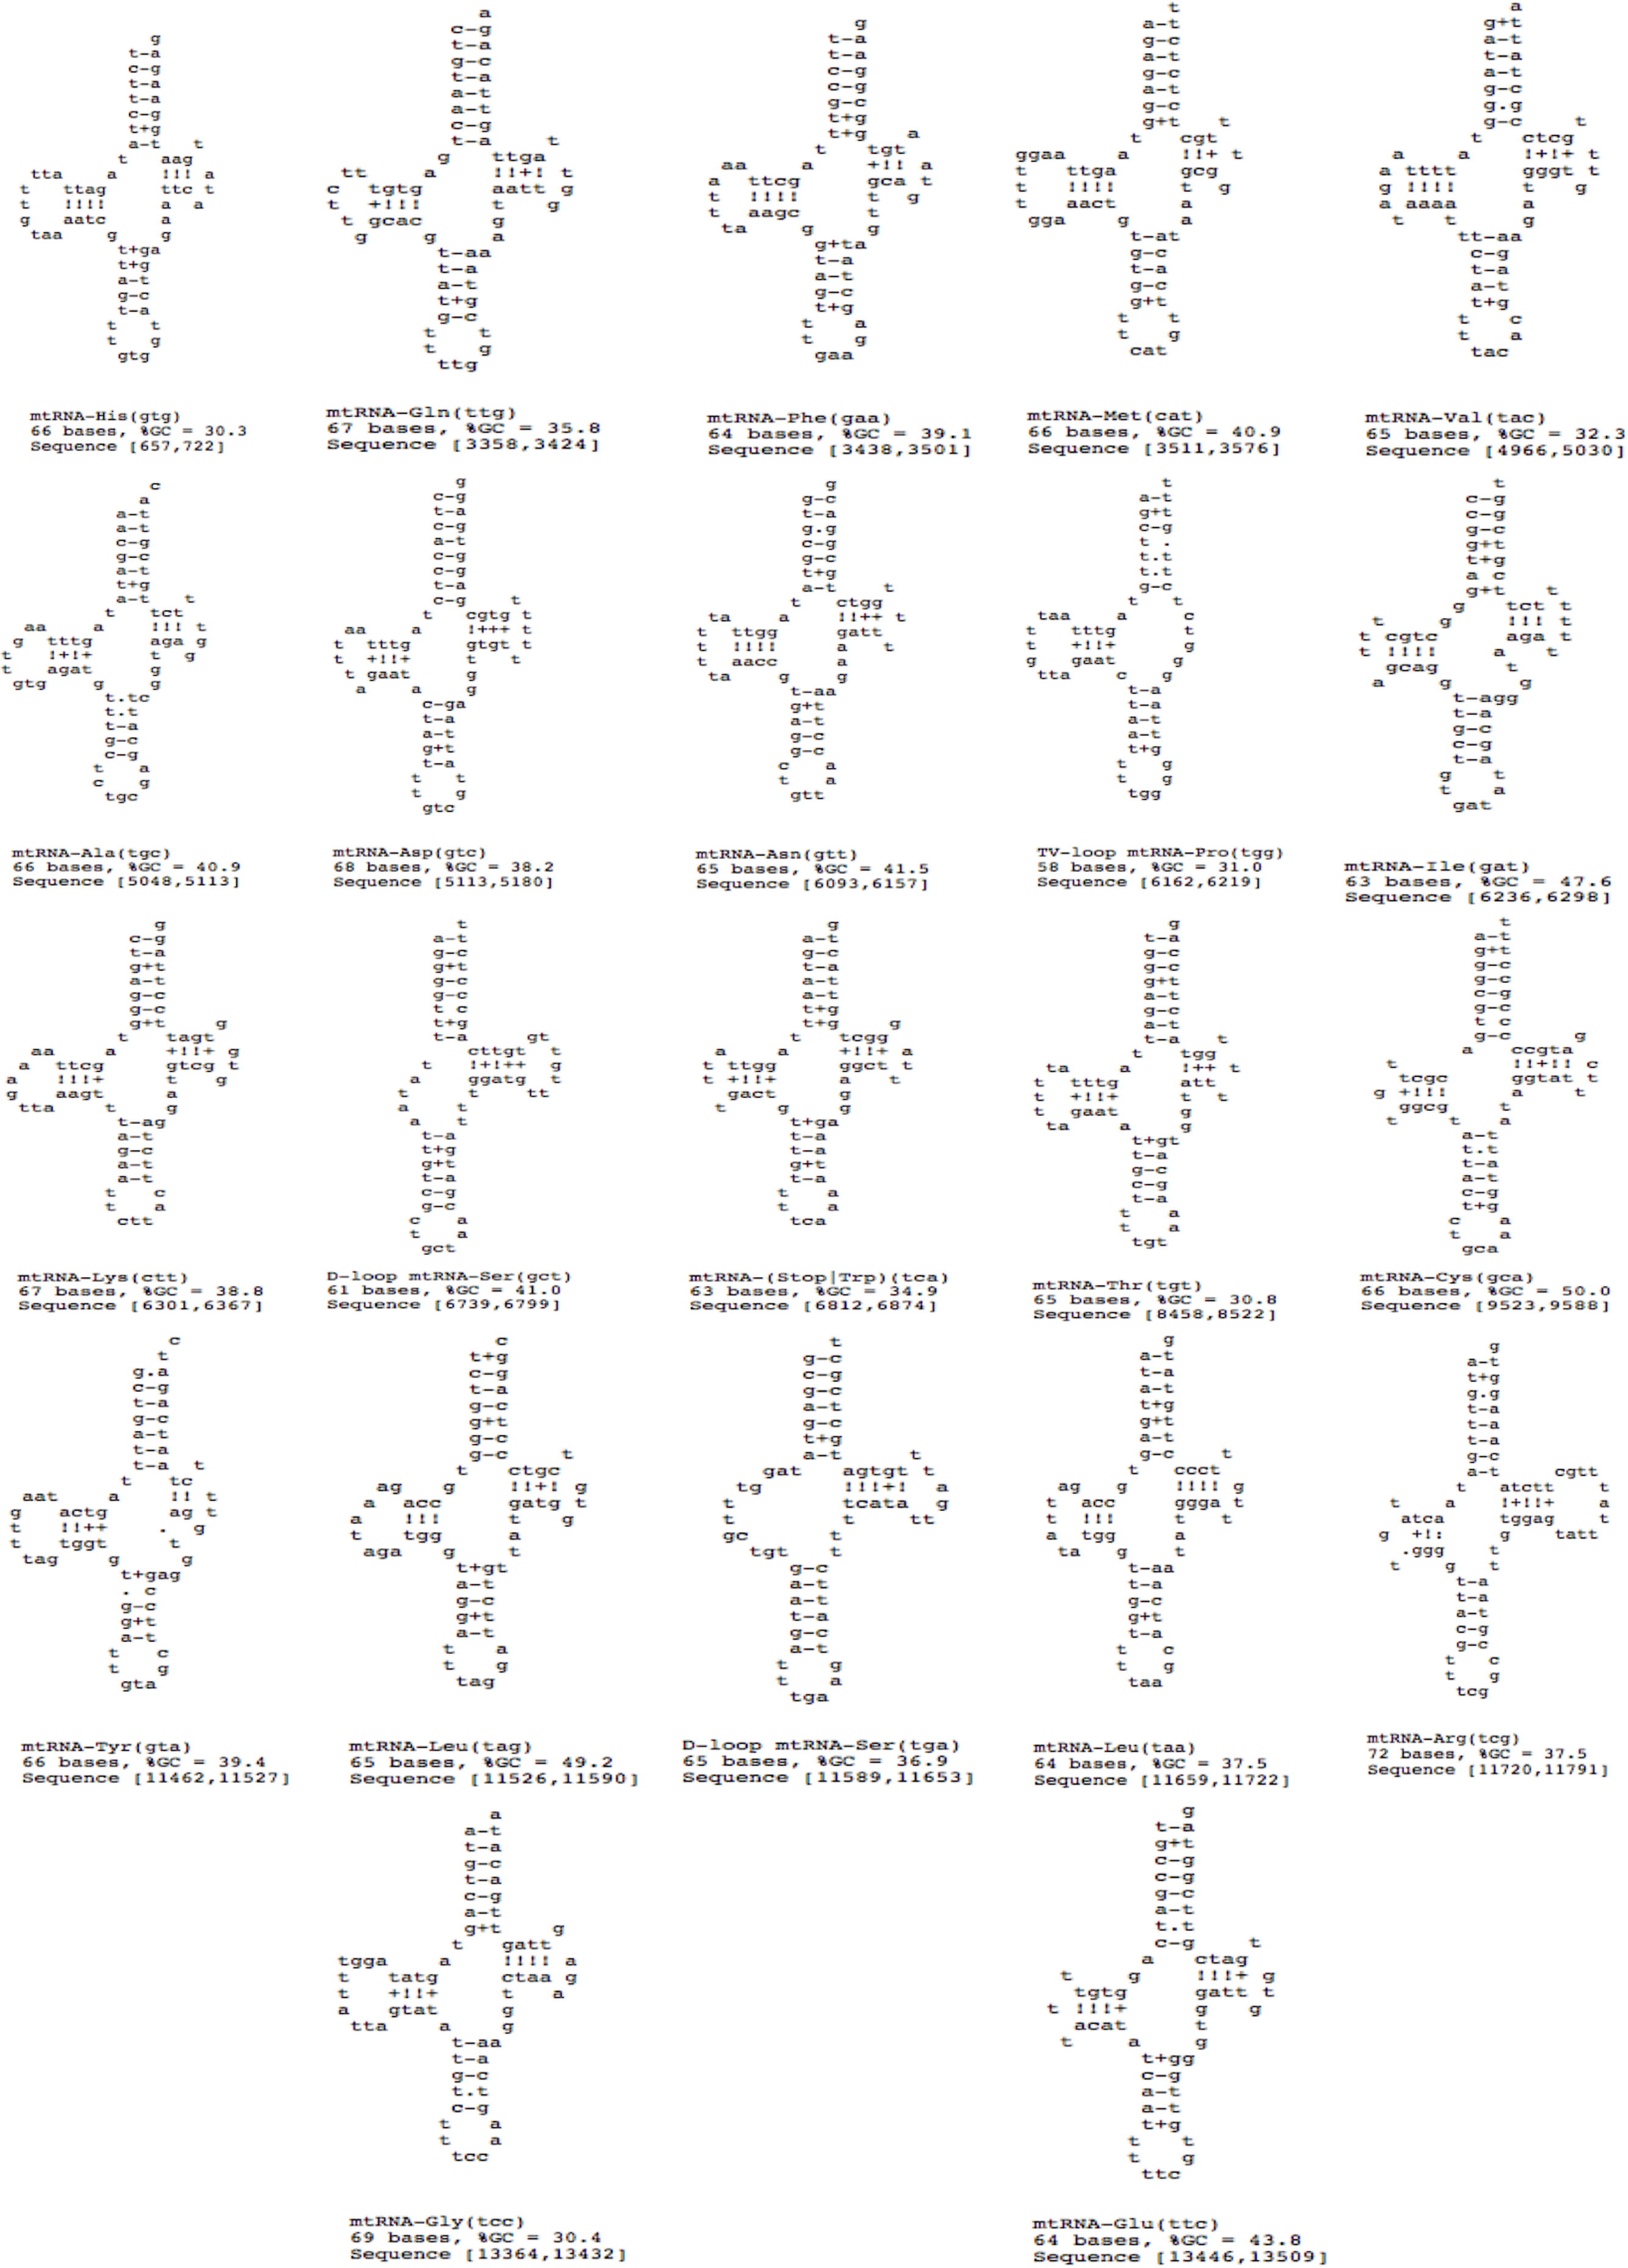
Conclusions
Although mt genomes of only a few parasitic flatworms have been sequenced, some general points can be made. The mtDNA of F. buski did not exhibit any surprising gene order composition or their organization relative to other invertebrates. As usual atp8 was absent, which is not without a precedent among invertebrates. Some typical secondary structures were inferred for some tRNA genes. Again, however, mt tRNA genes are less conserved in metazoans as compared to their nuclear counterparts. Gene order is similar or identical among most of the flatworms investigated, which might be expected for a taxon at this level of taxonomic heirarchy. In conclusion, the complete mtDNA sequences of F. buski will add to the knowledge of the trematode mitochondrial genomics and will aid in phylogenetic studies of the family Fasciolidae.