
Breakdown of coevolution between symbiotic bacteria Wolbachia and their filarial hosts
- Published
- Accepted
- Received
- Academic Editor
- Marta Sánchez
- Subject Areas
- Evolutionary Studies, Parasitology
- Keywords
- Symbiosis, Horizontal transmission, Cophylogenetic analysis, Wolbachia, Coevolution, Filarial nematodes
- Copyright
- © 2016 Lefoulon et al.
- Licence
- This is an open access article distributed under the terms of the Creative Commons Attribution License, which permits unrestricted use, distribution, reproduction and adaptation in any medium and for any purpose provided that it is properly attributed. For attribution, the original author(s), title, publication source (PeerJ) and either DOI or URL of the article must be cited.
- Cite this article
- 2016. Breakdown of coevolution between symbiotic bacteria Wolbachia and their filarial hosts. PeerJ 4:e1840 https://doi.org/10.7717/peerj.1840
Abstract
Wolbachia is an alpha-proteobacterial symbiont widely distributed in arthropods. Since the identification of Wolbachia in certain animal-parasitic nematodes (the Onchocercidae or filariae), the relationship between arthropod and nematode Wolbachia has attracted great interest. The obligate symbiosis in filariae, which renders infected species susceptible to antibiotic chemotherapy, was held to be distinct from the Wolbachia-arthropod relationship, typified by reproductive parasitism. While co-evolutionary signatures in Wolbachia-arthropod symbioses are generally weak, reflecting horizontal transmission events, strict co-evolution between filariae and Wolbachia has been reported previously. However, the absence of close outgroups for phylogenetic studies prevented the determination of which host group originally acquired Wolbachia. Here, we present the largest co-phylogenetic analysis of Wolbachia in filariae performed to date including: (i) a screening and an updated phylogeny of Wolbachia; (ii) a co-phylogenetic analysis; and (iii) a hypothesis on the acquisition of Wolbachia infection. First, our results show a general overestimation of Wolbachia occurrence and support the hypothesis of an ancestral absence of infection in the nematode phylum. The accuracy of supergroup J is also underlined. Second, although a global pattern of coevolution remains, the signal is derived predominantly from filarial clades associated with Wolbachia in supergroups C and J. In other filarial clades, harbouring Wolbachia supergroups D and F, horizontal acquisitions and secondary losses are common. Finally, our results suggest that supergroup C is the basal Wolbachia clade within the Ecdysozoa. This hypothesis on the origin of Wolbachia would change drastically our understanding of Wolbachia evolution.
Introduction
Wolbachia (Rickettsiales, Anaplasmataceae) are α-proteobacteria closely related to Ehrlichia and Anaplasma species. They are widespread symbionts detected in all arthropod classes (infecting between 20 and 70% of insect species) (Bourtzis & Miller, 2003; Zug & Hammerstein, 2012) as well as in a nematode family, the Onchocercidae, commonly known as filariae (Bandi et al., 1998; Sironi et al., 1995). Thus, Wolbachia are present in millions of species. They are vertically transmitted from females to offspring. In addition, this bacterium induces a large range of phenotypes in its hosts, varying from mutualism, including obligate dependencies for reproduction and long-term survival (mostly described in filariae and some arthropods) (Hosokawa et al., 2010; Zug & Hammerstein, 2015; Hoerauf et al., 2003); to parasitism by interfering with host reproduction (in arthropods only) (Werren, Baldo & Clark, 2008). The spread of Wolbachia via cytoplasmic incompatibility, male killing, feminization and induction of parthenogenesis can have a major impact on the evolution of arthropod host populations, and in some cases, may drive speciation (Rokas, 2000; Telschow et al., 2007).
Studies on Wolbachia are more largely focused on arthropods mainly due to: the higher incidence of Wolbachia in arthropods (e.g., a greater number of infected species), differences of accessibility (rearing and collecting are easier for arthropods) and also the relatively late identification of Wolbachia in filariae. Indeed, although intracellular bacterial organisms had been observed in filariae tissues decades ago (Kozek, 1971; Kozek, 1977; McLaren et al., 1975), they were only molecularly identified as closely related to Wolbachia pipientis in the mid-1990s (Sironi et al., 1995). The obligate nature of the relationship between Wolbachia and filariae has led to clinical trials of antibiotics for the treatment of filarial diseases of humans, including lymphatic filariasis and onchocerciasis (Bandi et al., 1999; Taylor et al., 2000; Taylor et al., 2012).
The different Wolbachia strains have been classified in major phylogenetic lineages named supergroups. Initially, the phylogeny of Wolbachia described two clades (named supergroups A and B) infecting only arthropods. Two other clades were added after the investigation of bacteria in filariae (supergroups C and D) (Bandi et al., 1998). From 1999 to 2015, a multiplication of supergroup classifications occurred, with 10 clades identified that exclusively infect arthropods (supergroups E, G, H, I, K, M, N, O, P and Q) (Augustinos et al., 2011; Bing et al., 2014; Bordenstein & Rosengaus, 2005; Czarnetzki & Tebbe, 2004; Dittmar & Whiting, 2004; Glowska et al., 2015; Ros et al., 2009; Rowley, Raven & McGraw, 2004; Vandekerckhove et al., 1999; Wang et al., 2014); one infecting filariae (supergroup J) (Casiraghi et al., 2004); one identified in the plant parasite nematode Radopholus similis (Tylenchida) (supergroup L) (Haegeman et al., 2009); and finally supergroup F, which is apparently unique in infecting both arthropods and filariae (Casiraghi et al., 2001b; Lo et al., 2002).
These phylogenetic analyses led to Wolbachia classification gradually increasing in complexity from single gene analysis (Sironi et al., 1995; Werren, Zhang & Guo, 1995) to multi-locus methods (Baldo et al., 2006b; Bordenstein et al., 2009; Casiraghi et al., 2001a; Casiraghi et al., 2005; Lefoulon et al., 2012). More recently, the complete sequencing of various Wolbachia genomes has allowed the development of phylogenomic analyses (Comandatore et al., 2013; Fenn & Blaxter, 2006; Gerth et al., 2014; Nikoh et al., 2014; Ramirez-Puebla et al., 2015). The evolutionary history of Wolbachia has been investigated by using outgroups belonging to the Anaplasma, Ehrlichia or Rickettsia genera (O’Neill et al., 1992; Ramirez-Puebla et al., 2015) as an attempt to establish the origin of the bacteria. However, it has been suggested that these outgroups are too distant to the ingroups, and thus could introduce artefacts to the phylogenetic reconstruction (such as long-branch attraction, LBA), rendering it very challenging to determine the host group that initially acquired Wolbachia infection with confidence (Bordenstein et al., 2009).
The co-evolutionary pattern observed for Wolbachia varies between hosts (Bandi et al., 1998; Bourtzis & Miller, 2003). First, composite dynamics of acquisition and loss of bacteria strains in arthropods has made the picture very complex at a co-evolutionary scale (Baldo et al., 2008; Gerth, Rothe & Bleidorn, 2013; O’Neill et al., 1992; Vavre et al., 1999). Second, co-speciation of filariae and Wolbachia has been hypothesized (Bandi et al., 1998), even if several cases of secondary losses and two cases of horizontal transmission between species have been detected, suggesting this scenario is too simplistic (Ferri et al., 2011; Lefoulon et al., 2012; Martin & Gavotte, 2010). Moreover, to date, the notion of coevolution between Wolbachia and filariae was based on a poorly resolved evolutionary history of the Onchocercidae and limited sampling (just 10 examined species) (Bandi et al., 1998).
We have recently revised the evolutionary history of the Onchocercidae by completing the most comprehensive analysis to date, using a multi-gene phylogeny on 45 different species representing seven of the eight subfamilies (Lefoulon et al., 2015). Here, we propose a reappraisal of the coevolutionary pattern between Wolbachia and filariae using this significantly more intensive sampling. We identify new Wolbachia strains, critically examine the accuracy of the Wolbachia supergroups, reassess the prevalence of Wolbachia infection within the Onchocercidae and revisit the hypothesis of ancestral Wolbachia absence. Our co-phylogenetic analyses reveal multiple events of losses and acquisitions of the bacteria in the filariae, highlighting strong but localized patterns of co-evolution in some clades, in contrast with multiple horizontal transfers and a breakdown of co-evolution in others. Finally, we apply a new approach to the question of initial acquisition of Wolbachia within the Ecdysozoa.
Materials and Methods
Specimens
DNA from 45 filariae, including 2 outgroup species that fall outside the Onchocercidae (obtained from Lefoulon et al. (2015)), as well as 5 specimens of arthropods (Tables 1 and 2), were used for molecular analyses. In addition, some filarial specimens were used for histological analyses (Table 1). All procedures were conducted in compliance with the rules and regulations of the respective competent national ethical bodies (Table S1) (Lefoulon et al., 2015). Some non-human vertebrates were captured for experimental procedures, subject to the ethics approval of the relevant national bodies, while others were obtained at abattoirs or donated to the MNHN by hunters or veterinarians (Table S1). The MNHN does neither solicit nor compensate for these donations. Nematode accession numbers are reported in Table 1. For the author(s) and year of parasite and host species collection, the reader is referred to File S1. All the samples were fixed and kept in 70% ethanol. For nematodes, the median parts were used for molecular analyses; the anterior and posterior parts being retained for possible morphological analyses.
| Subfamilies | Species | Host | No. | Collection place |
|---|---|---|---|---|
| Oswaldofilariinae | Oswaldofilaria chabaudi | Tropidurus torquatus | 191YU | Brasil |
| Oswaldofilaria petersi | Crocodilurus amazonicus | 34PF | Peru | |
| Waltonellinae | Ochoterenella sp.1 | Rhinella granulosa | 200YU | Venezuela |
| Ochoterenella sp.2 | Rhinella marina | 47YT | Venezuela | |
| Ochoterenella sp3 | Phyllomedusa bicolor | 194JW | French Guyana | |
| Icosiellinae | Icosiella neglecta | Rana ridibunda | 44YT | Ukraine |
| Rana esculeta | 45YT | France | ||
| Setariinae | Setaria labiatopapillosa | Bos taurus | 413YU | Cameroon |
| Setaria tundra | Rangifer tarandus | 71YT | Finlande | |
| Dirofilariinae | Dirofilaria (Dirofilaria) immitis | Canis familiaris | 79YT | ES |
| Dirofilaria (Nochtiella) repens | Canis familiaris | 297YU | Italy | |
| Foleyella candezei | Agama agama | 68CE | Togo | |
| Loa loa | Homo sapiens | 80YT | France | |
| Pelecitus fulicaeatrae | Podiceps nigricollis | 49YT | Spain | |
| Splendidofilariinae | Aproctella alessandroi | Saltator similis | 117YU | Brasil |
| Cardiofilaria pavlovskyi | Oriolus oriolus | 180YU | Bulgaria | |
| Madathamugadia hiepei | Pachycactylus turneri | 81YU | South Africa | |
| Rumenfilaria andersoni | Rangifer tarandus | 94YU | Finlande | |
| Onchocercinae | Acanthocheilonema odendhali | Callorhinus ursinus | 401YU | Alaska |
| Acanthocheilonema viteae | Meriones unguiculatus | 7YT | ES | |
| Breinlia (Breinlia) jittapalapongi | Rattus tanezumi | 78YT | Laos | |
| Brugia malayi | Meriones unguiculatus | 8YT | ES | |
| Brugia pahangi | Meriones unguiculatus | 46YT | ES | |
| Brugia timori | Homo sapiens | 6YT | Indonesia | |
| Cercopithifilaria bainae | Canis familiaris | 9YT | ES | |
| Cercopithifilaria rugosicauda | Capreolus capreolus | 350YU | France | |
| Cruorifilaria tuberocauda | Hydrochoerus hydrochaeris | 55YT | Venezuela | |
| Dipetalonema caudispina | Ateles paniscus | 362YU | Guyana | |
| Ateles sp. | 64YT | Guyana | ||
| Dipetalonema gracile | Cebus olivaceus | 124CV | Venezuela | |
| Cebus apella | 215YU | Peru | ||
| Ateles sp. | 63YT | Guyana | ||
| Dipetalonema graciliformis | Saimiri scuireus | 220YU | Peru | |
| Dipetalonema robini | Lagothrix poeppigii | 216YU | Peru | |
| Litomosoides brasiliensis | Carollia perspicillata | 35/37PF | Peru | |
| Litomosoides hamletti | glossophaga soricina | 36PF1 | Peru | |
| Litomosoides sigmodontis | Meriones unguiculatus | 186MS | ES | |
| Litomosoides solarii | Trachops cirrhosus | 213YU | Venezuela | |
| Loxodontofilaria caprini | Capricornis crispus | YG2-58 | Japan | |
| Mansonella (Cutifilaria) perforata | Cervus nippon | 216JW | Japan | |
| Mansonella (Mansonella) ozzardi | Homo sapiens | 77YT | Haiti | |
| Monanema martini | Arvicanthis niloticus | 31NC | Senegal | |
| Onchocerca armillata | Bos taurus | 54FK | Cameroon | |
| Onchocerca dewittei japonica | S. scrofa leucomystax | OB9 | Japan | |
| Onchocerca eberhardi | Cervus nippon | S63-5 | Japan | |
| Onchocerca gutturosa | Bos taurus | 54FK | Cameroon | |
| Onchocerca ochengi | Bos taurus | 54FK | Cameroon | |
| Onchocerca skrjabini | Cervus nippon | S63-6 | Japan | |
| Yatesia hydrochoerus | Hydrochoerus hydrochaeris | 52YT | Venezuela | |
| Outgroups | Filaria latala | Panthera leo | 62YT | South Africa |
| Protospirura muricola | Gorilla sp. | 97YU | Central African Republic |
Notes:
- ES
-
Experimental strains
| Families | Species | No. MNHN | Collection place |
|---|---|---|---|
| Cimicidae | Cimex lectularius | 11YT | France |
| Drosophilidae | Drosophila simulans | 394YU | France (experimental) |
| Encyrtidae | Ixodiphagus hookeri | 383YU | France |
| Isotomidae | Folsomia candida | EA010816 | France (experimental) |
| Termitidae | Nasutitermes sp. | 86YT | Venezuela |
Molecular screening
DNA was extracted from nematodes or arthropods using the QIAamp kit following the recommended procedures of the manufacturer (Qiagen, France), with a preliminary step of disruption for 2 cycles of 30 s at 30 Hz using a TissueLyser II (Qiagen, Germany) and incubation at 56 °C with proteinase K overnight. The presence of Wolbachia was determined by nested PCR screening of the seven genes (16S rDNA gene, dnaA, coxA, fbpA, gatB, ftsZ and groEL) as described in Table S2. PCR products were purified using the SV Wizard PCR Purification Kit (Promega, USA) and directly sequenced. A total of 198 sequences were deposited in the GenBank Data Library: KU255197 to KU255395 (Table S3).
Immunohistochemical staining of nematode sections
The presence or absence of Wolbachia was determined by immunohistochemical staining according to Kramer et al. (2003). A rabbit polyclonal antiserum raised against the Wolbachia surface protein (WSP) of Wolbachia from Brugia pahangi (Wol-Bp-WSP, dilution 1:2000 (designed by Bazzocchi et al. (2000) and provided by Dr. Maurizio Casiraghi) was used to stain 5 μm paraffin sections of filarial species placed on Superfrost Plus slides (Thermo Scientific) as described by Ferri et al. (2011). Sections of the laboratory strain Litomosoides sigmodontis were used as a positive control. Negative controls were carried out by omitting the primary antibody. In addition, transverse sections were stained with haematoxylin and eosin for the identification of anatomical structures.
Phylogenetic reconstruction
The Wolbachia 16S rDNA, dnaA, groEL, ftsZ, coxA, fbpA and gatB sequences were aligned with sequences available in Genbank (Table S3) using Muscle (Edgar, 2004). To check for the absence of stop codons, the alignment of coding genes was translated using EMBOSS Transeq (Li et al., 2015), and a comparison with available transcript sequences was performed. 12 complete genomes or draft genomes of Wolbachia from arthropods and 5 complete or draft genomes of Wolbachia from filariae were used in the analyses (Table S3). Wolbachia from arthropods included in the analyses were selected based on the availability of the 7 genetic markers we used (with exception of Wolbachia from O. horni, T. deion, Z. angusticollis and Z. nevadensis). Presence of recombination events were evaluated by RDP (Martin & Rybicki, 2000), GENECONV (Padidam, Sawyer & Fauquet, 1999), BootScan (Salminen et al., 1995), MAXCHI (Smith, 1992), Chimaera (Posada & Crandall, 2001), SISCAN (Gibbs, Armstrong & Gibbs, 2000) and 3Sequ (Boni, Posada & Feldman, 2007) methods using RDP v4.38 (Martin et al., 2015). Tests of nucleotide substitution saturation were performed on alignments with and without outgroups by Xia’s method (Xia et al., 2003) using DAMBE version 5 (Xia & Xie, 2001). A supermatrix of these seven alignments was generated using Seaview (Gouy, Guindon & Gascuel, 2010). Two different nucleotide datasets were analysed for different purposes: one alignment of 64 Wolbachia without outgroups for the phylogenic analysis, and one alignment including only Wolbachia from filarial nematodes was studied for the cophylogenetic analysis. In addition, both a nucleotide and an amino-acid dataset of 54 Wolbachia strains, including five outgroups (Anaplasma marginale Theiler, 1910, Anaplasma phagocytophilum (Dumler et al., 2001), Ehrlichia chaffeensis Anderson et al., 1992, Ehrlichia muris Wen et al., 1995, Ehrlichia ruminantium (Dumler et al., 2001), were generated. Best-fitting evolutionary models according to a supermatrix were determined by JModelTest 2.1 (Darriba et al., 2012) or by ProtTest 2.4 (Abascal, Zardoya & Posada, 2005) using the corrected version of the Akaike Information Criterion (AICc). For the nucleotide supermatrix, the phylogenies of filariae and Wolbachia were performed by Maximum Likelihood (ML) inference using the model GTR+ I+Γ with RAxML version 8 (Stamatakis, 2014). For each gene, a partitioned model was implemented to estimate evolution parameters. The robustness of nodes was assessed with 1,000 bootstrap replicates. ML analysis of the amino acid supermatrix was performed using the model HIVb+ I+Γ + F with PhyML (Ronquist & Huelsenbeck, 2003). The robustness of nodes was assessed with 500 bootstrap replicates.
Cophylogenetic analysis
Two methods were performed to study cophylogenetic patterns between filariae and their Wolbachia symbionts: a global-fit method and an event-based method.
The global-fit method estimates the congruence between two phylogenetic trees. The global fit of filarial phylogeny with their bacterial phylogeny was estimated using the PACo application (Balbuena, Miguez-Lozano & Blasco-Costa, 2013) in the R environment (R Core Team, 2013). This method is a distance-based test: briefly, the ML phylogenetic trees were transformed into matrices of pairwise patristic distance, then into matrices of principal coordinates (PCo). The PCo of Wolbachia were transformed by Procrustes analysis using least-squares superimposition to minimize the differences with filarial PCo. An ordination plot was produced, representing the Procrustean global fit. The global fit was evaluated by the residual sum of squares value (m) of the Procrustean fit calculation, which is inversely proportional to the topological congruence, and its significance was tested by random permutations (100,000,000 permutations). Each host-symbiont association was evaluated by a jackknife procedure (Sokal & Rohlf, 1981) to estimate the square residual of each single association and its 95% confidence interval. A bar chart plot of these jackknifed squared residual was produced. Low residuals are interpreted as a low contribution of m and thus as a strong congruence between the filariae and the bacteria.
The event-based method explores co-evolutionary scenarios in order to find the best reconstructions by minimizing the overall cost, given a cost regime for evolutionary events (Charleston, 1998). Jane 4.0 (Conow et al., 2010) was used to associate overall costs of co-evolutionary scenarios between Wolbachia and their hosts. The default settings for cost regimes are: a “co-speciation” event (two partners speciate simultaneously) is associated with null cost; a “duplication” event (the symbionts speciate in the same host) and “loss” event (the symbiont does not speciate while the host does) are associated with a cost equal to one; and a “duplication then host switching” event (the symbiont speciates and one switches to another host) is associated with a cost equal to two (Charleston, 1998). All analyses were performed with a number of generation of 500 and a population of 30.
This method is only manageable on rooted phylogenies, yet rooting of Wolbachia phylogeny is contested due to the absence of appropriate outgroups (Bordenstein et al., 2009). In order to circumvent this problem, the estimation of the co-evolutionary scenario associated with the minimum overall cost was analysed using different rooting constraints on the Wolbachia phylogeny.
An initial analysis was performed including only filariae and their Wolbachia symbionts (62 hosts and 36 symbionts). This analysis was performed without constraint or with a time constraint. Although Jane’s program does not change topologies (i.e., the relationships between hosts) it can modify the distance branches (i.e., the nodes representing the events of speciation are not fixed by timescale) (Conow et al., 2010). Thus, without time constraint, “host switch” events are not limited by temporal scales and the algorithm can change branch length on the filarial tree to minimize scenario cost, at the risk that this is inconsistent with filarial evolution. Subsequently, two time zones were defined to provide constraints to indicate that the first speciation events leading to filariae belonging to ONC1, ONC2 and ONC3 (thus within time zone no. 1) occurred before the first speciation events leading to filariae belonging to ONC4 and ONC5 (thus within time zone no. 2) (Lefoulon et al., 2015). Thus, Wolbachia speciation events were constrained within the second time zone.
A second analysis was performed adding Wolbachia from arthropods (64 Wolbachia strains in total). This analysis was made possible because the Jane program manages topologies and not distance branches (Conow et al., 2010). A hypothetical arthropod evolutionary history based on previous studies (Legendre et al., 2015; Misof et al., 2014; Tong et al., 2015; Wiegmann et al., 2011) was added to the nematode topology in order to perform these analyses. This second analysis was conducted without time constraint because the timescale of evolution for all the hosts (arthropods and filariae) is poorly known. If time zones were defined, events of Wolbachia speciation should be constrained into these zones. The definition of these temporal constraints appears arbitrary so far as timescales are not determined.
Results/Discussion
Absence of Wolbachia in filariae: ancestral absence and secondary losses
The detection of Wolbachia was performed on 16 new filarial species among a total of 45 examined species (Table 1). Nine of the 16 new species were Wolbachia-free (based on PCR screening and/or WSP antibody staining) (Fig. 1 and Table 3). The Wolbachia infection status (i.e., presence or absence) in the other species was in agreement with previous studies (Fig. 1). Absence of Wolbachia infection in filarial species could be explained by two hypotheses: either an ancestral absence or a secondary loss (Casiraghi et al., 2004).
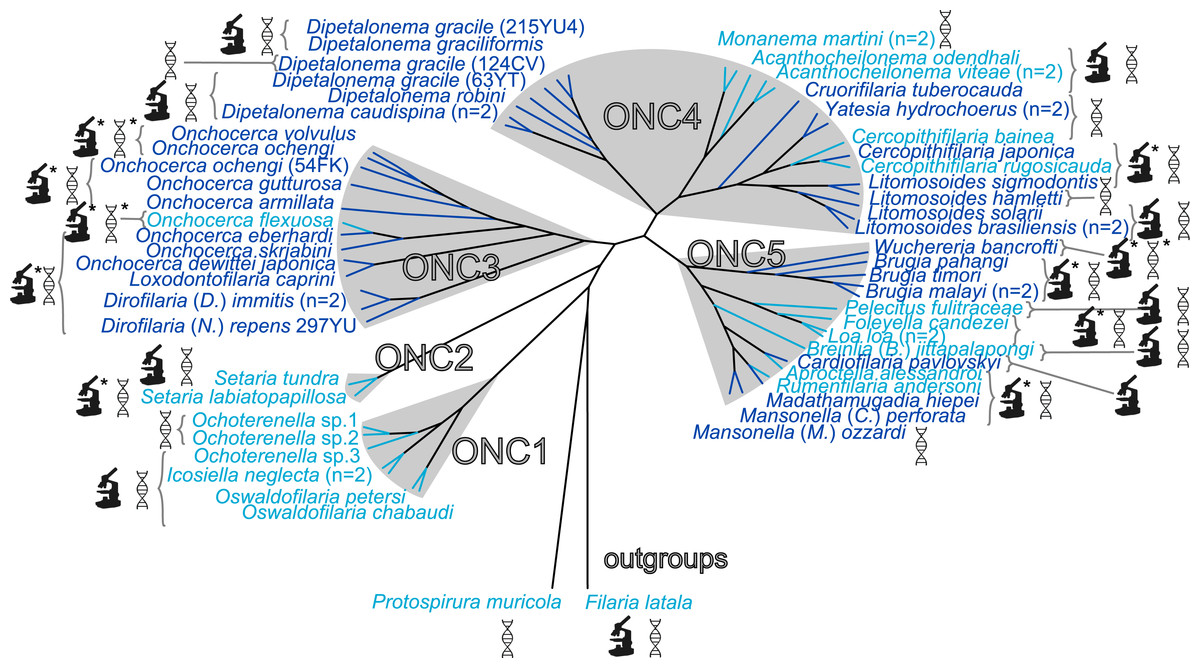
Figure 1: Presence/absence of Wolbachia in filariae (Onchocercidae).
Sixty onchocercid specimens from 45 species were analysed. Wolbachia screening was performed by either PCR and/or immunohistostaining with a rabbit polyclonal antiserum against Wolbachia surface protein (WSP) of Brugia pahangi Wolbachia (Wol-Bp-WSP, dilution 1:2,000). Results of Wolbachia screening are indicated by colour: light blue for Wolbachia-free species and dark blue for Wolbachia-positive species. Detection methods for Wolbachia are illustrated next to the species name using specified symbols: DNA double helix symbol, DNA amplification by PCR; microscope symbol, immunohistostaining of WSP; ∗, determine by previous studies. The filarial clades (ONC1-ONC5) were defined according to Lefoulon et al. (2015). Phylogeny of Onchocercidae was based on partitioned concatenated datasets of 12S rDNA, coxI, rbp1, hsp70, myoHC, 18S rDNA, and 28S rDNA sequences using Maximum Likelihood Inference.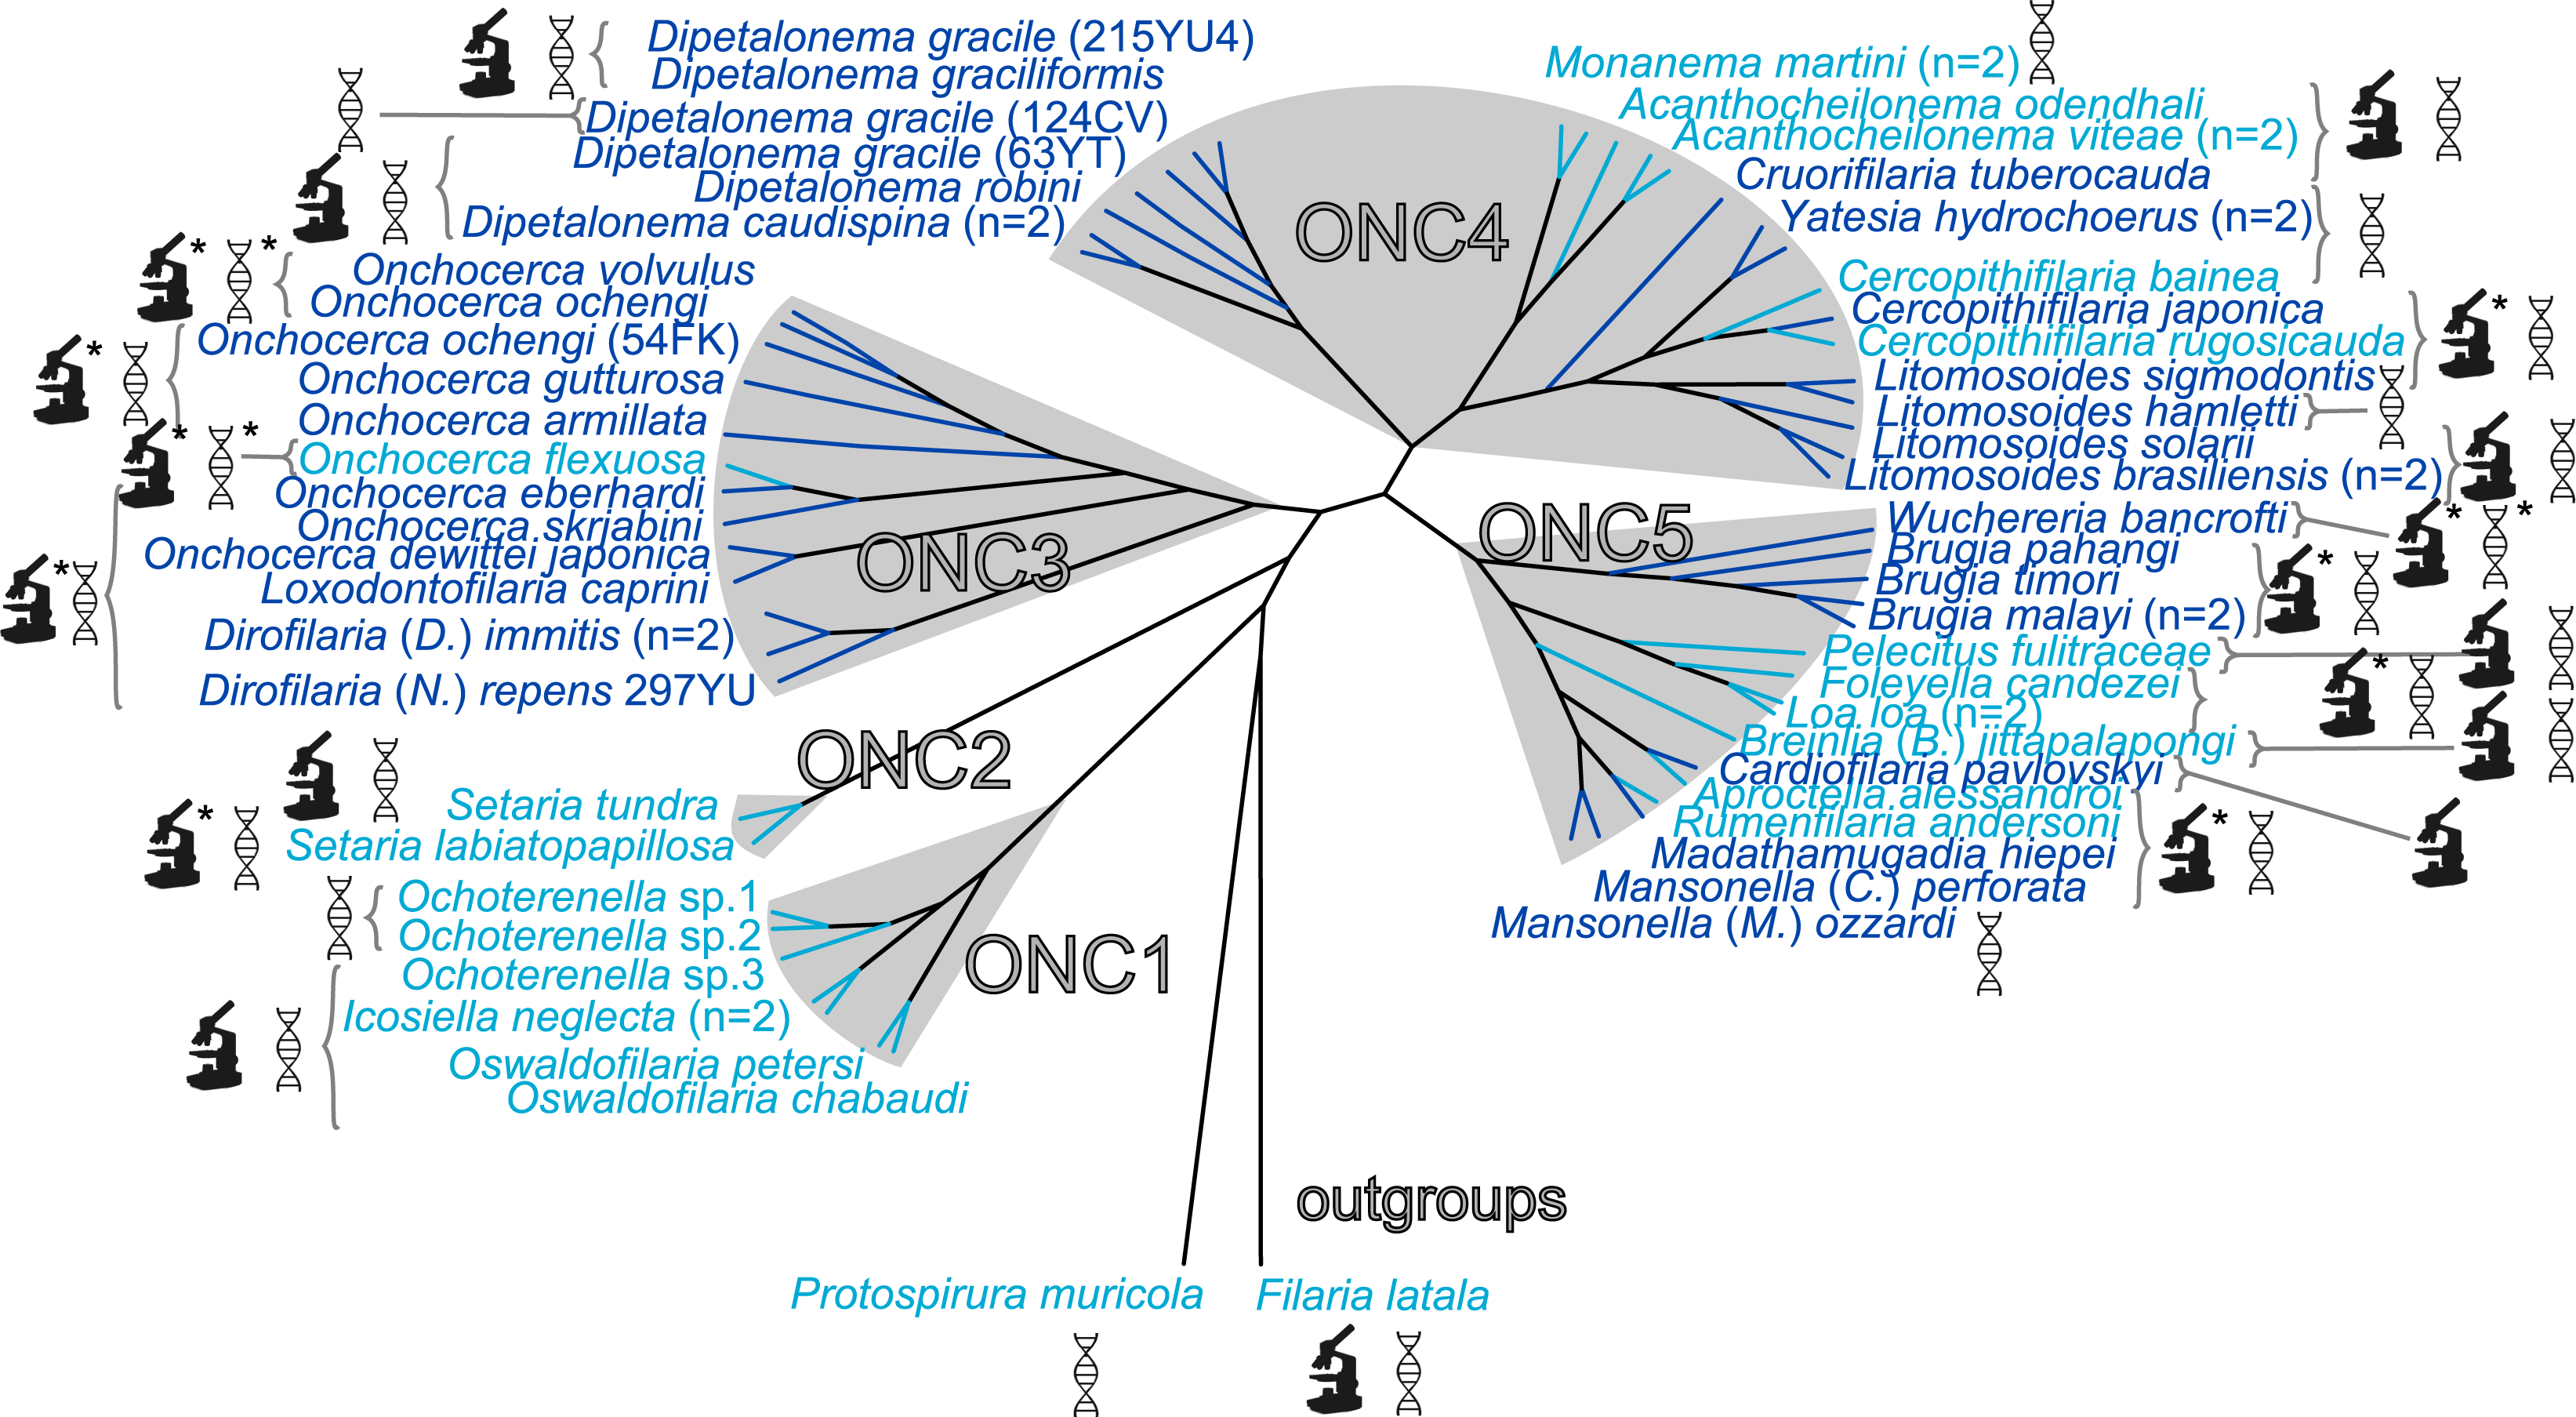
| Species | MNHN no | Sex | LC | GL | Testes | SG | Intestine | ||
|---|---|---|---|---|---|---|---|---|---|
| Oocyte | Egg | mf | |||||||
| Acanthocheilonema odendhali | 401YU | f | − | NA | NA | − | NA | − | − |
| Breinlia (Breinlia) jittapalapongi | 78YT | m | − | NA | NA | NA | − | − | − |
| Cardiofilaria pavlovskyi | 180YU | f | + | NA | + | NA | NA | − | + |
| Cruorifilaria tuberocauda | 57YT | f | + | NA | NA | + | NA | − | − |
| Cruorifilaria tuberocauda | 60YT | f | + | NA | NA | + | NA | − | − |
| Dipetalonema caudispina | 64YT | f | + | NA | − | NA | NA | − | − |
| Dipetalonema gracile | 215YU | f | + | NA | + | NA | NA | − | − |
| Dipetalonema graciliformis | 220YU | f | + | NA | + | NA | NA | − | − |
| Dipetalonema robini | 216YU | f | + | NA | + | NA | NA | − | − |
| Icosiella neglecta | 122YU | f | − | − | NA | NA | NA | − | NA |
| Litomosoides brasiliensis | 35PF | f | + | + | + | NA | NA | − | − |
| Litomosoides solarii | 213YU | f | + | NA | + | NA | NA | − | − |
| Ochoterenella phyllomedusa | 194JW | f | − | NA | − | − | NA | − | − |
| Oswaldofilaria chabaudi | 102YU | f | NS | NA | − | NA | NA | − | NS |
| Oswaldofilaria petersi | 34PF | f | − | − | NA | NA | NA | − | NA |
| Pelecitus fulicaeatrae | 150YU | f | − | NA | − | − | NA | − | − |
| Setaria tundra | 71YT | f | − | NA | − | NA | NA | − | NS |
Notes:
- LC
-
lateral chords (hypodermis)
- GL
-
germline
- mf
-
microfilaria
- SG
-
somatic germline
- +
-
positive staining
- −
-
no staining
- ns
-
no specific staining
- NA
-
not available due to position of the section
We have previously identified five strongly supported clades within the Onchocercidae that we have named ONC1 to ONC5 based on their monophyly (Fig. 1) (Lefoulon et al., 2015). The ancestrally derived species belonging to the genera Oswaldofilaria, Icosiella and Ochoterenella (clade ONC1) are not infected by Wolbachia (Fig. 1). This result supports, as previously suggested, the absence of Wolbachia infection as an ancestral trait (Bain et al., 2008; Ferri et al., 2011; Lefoulon et al., 2012). Absence of Wolbachia has also been noted in the other nematodes and nematomorph species examined so far (about 30 examined species) (Bordenstein, Fitch & Werren, 2003; Duron & Gavotte, 2007; Foster et al., 2014), with the exception of the plant parasitic nematode Radopholus similis (Haegeman et al., 2009), emphasizing the hypothesis of ancestral absence. Nevertheless, the hypothesis of secondary loss(es) cannot be ruled out, especially considering a recent discovery of Wolbachia genetic sequences within the host nuclear genome (“nuwts”, nuclear Wolbachia transfers) of the Wolbachia-free nematode Dictyocaulus viviparus (Rhabditina), which would imply secondary losses in at least some nematode clades outside the Onchocercidae (Koutsovoulos et al., 2014).
In more recently derived groups (clades ONC3, ONC4 and ONC5), infection was detected in a majority of species (71%) (Fig. 1). The more parsimonious hypothesis to explain the lack of infection in species belonging to these groups is a series of secondary losses, instead of a more costly scenario with multiple independent acquisitions. Thus, absence of infection in Pelecitus fulicaeatrae, Acanthocheilonema odendhali, Breinlia (Breinlia) jittapalapongi (ONC5) and Cercopithifilaria bainae (ONC4) are likely due to such losses. This hypothesis is strengthened by the identification of nuwts in Wolbachia-free species, such as Onchocerca flexuosa (ONC 3) and Acanthocheilonema viteae (ONC 4) (McNulty et al., 2010) and small Wolbachia-derived sequences (<500 bp) in Loa loa (ONC 5) (Desjardins et al., 2013).
Occurrence of Wolbachia infection: where do we stand?
Among the 26 species harbouring a Wolbachia infection, seven new Wolbachia strains were identified (Fig. 1) in the following filarial species: Cruorifilaria tuberocauda, Yatesia hydrochoerus, Dipetalonema caudispina, D. graciliformis, D. robini, Litomosoides solarii (all in ONC4) and Cardiofilaria pavlovskyi (ONC5). Thus, Wolbachia infection occurs in 58% of our sample. Combining these data with those from former studies (Table S4), the occurrence of Wolbachia infection is 52.9% across 85 analysed filarial species. However, it is important to emphasise that most of the examined species belong to the more recently derived Onchocercinae subfamily, so the estimated occurrence of Wolbachia infection within the filariae still may be biased towards infected species (Fig. 1). For example, the filariae from birds, squamates and amphibians are largely understudied (Ferri et al., 2011). Wolbachia were typically present in the hypodermis of filariae and in the female germline (Table 3, Figs. S1 and S2), except for a specimen of Cardiofilaria pavlovskyi, in which an additional localisation in the intestinal wall cells was observed. This tissue distribution has also been reported for Madathamugadia hiepei (Lefoulon et al., 2012) and Mansonella (Cutifilaria) perforata (Ferri et al., 2011).
Updated, unrooted Wolbachia phylogeny highlights accuracy of supergroup J
The present unrooted Wolbachia phylogeny includes 64 Wolbachia strains and is based on the concatenation of seven genes (16S rDNA, groEL, ftsZ, dnaA, gatB, fbpA and coxA) (Fig. 2). While no events of recombination were found within coxA, gatB, ftsZ, dnaA sequences, some were detected in 16S rDNA, fbpA and groEL sequences as presented in Table 4. These events occurred exclusively between supergroups A and B Wolbachia, as previously described (Baldo et al., 2006a). The resultant phylogeny reveals 7 strongly supported clades representing the seven previously defined supergroups A, B, C, D, F, H, and J (Bandi et al., 1998; Lo et al., 2002; Ros et al., 2009; Werren, Zhang & Guo, 1995).
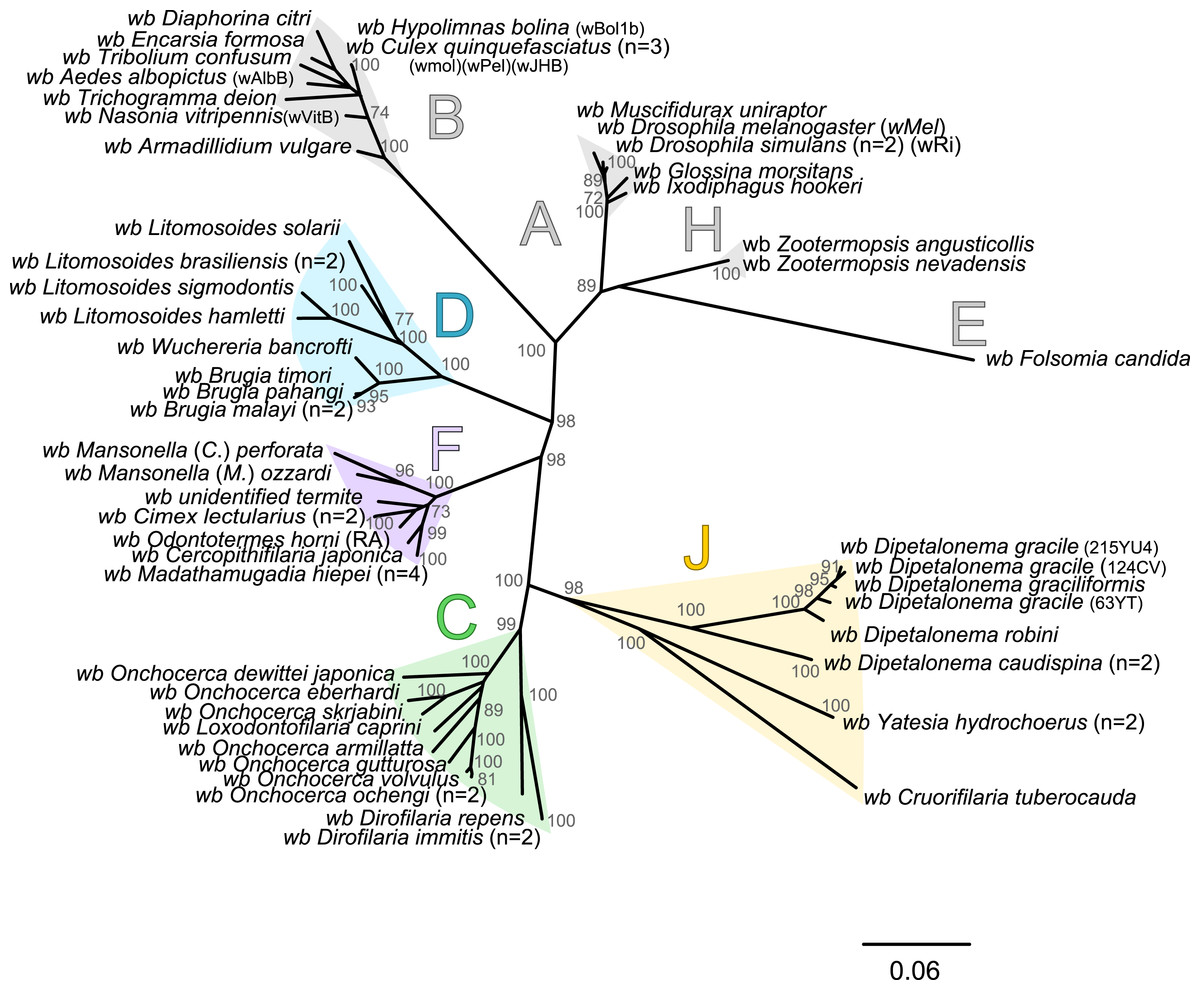
Figure 2: Phylogenetic tree of Wolbachia based on 7 markers by Maximum Likelihood.
Analysis based on concatenation of 16S rDNA, dnaA, groEL, ftsZ, coxA, fbpA and gatB. The total length of datasets is approximately 4,600 bp. Sixty-four Wolbachia strains were analysed. The topology was inferred using Maximum Likelihood (ML) inference using RaxML. Nodes are associated with Bootstrap values based on 1,000 replicates. The Wolbachia supergroups (A–H) were identified according to Werren, Zhang & Guo (1995), Bandi et al. (1998), Lo et al. (2002) and Ros et al. (2009). The scale bar indicates the distance in substitutions per nucleotide. Abbreviation: wb, Wolbachia; n, number of studied specimens.
| Methods | 16S rDNA | coxA | gatB | ftsZ | dnaA | fbpA | groEL |
|---|---|---|---|---|---|---|---|
| RDP | 0 | 0 | 0 | 0 | 0 | 0 | 0 |
| GENECONV | 0 | 0 | 0 | 0 | 0 | 0 | 0 |
| BootScan | 0 | 0 | 0 | 0 | 0 | 0 | 1 (9, 12 × 10−3) |
| MaxChi | 7 (1, 7161 × 10−2) | 0 | 0 | 0 | 0 | 0 | 11(3, 35 × 10−2) |
| Chimaera | 0 | 0 | 0 | 0 | 0 | 0 | 0 |
| SiScan | 3 (1, 909 × 10−13) | 0 | 0 | 0 | 0 | 0 | 0 |
| 3Sequ | 0 | 0 | 0 | 0 | 0 | 2 (8, 522 × 10−3) | 0 |
Wolbachia from the Dipetalonema species (D. gracile, D. caudispina, D. robini and D. graciliformis) constitute a strongly supported group (Fig. 1). Wolbachia from Yatesia hydrochoerus and Cruorifilaria tuberocauda were closely related and are also linked to the Wolbachia from the Dipetalonema species. All together, they formed a strongly supported clade that confirm the validity of supergroup J (Ros et al., 2009), even if our results suggest two distinct J subgroups. However, we do not propose a new supergroup to prevent the multiplication of Wolbachia clades. We hold this position due to the following facts: the status of several supergroups is questionable because either they were described only on the basis of a few genetic markers (for example supergroups M and N infecting aphids (Augustinos et al., 2011; Bing et al., 2014)), or they contained only one or few host species such as supergroup J (Casiraghi et al., 2004; Ros et al., 2009). Up to now, Wolbachia in Dipetalonema gracile was the only representative of supergroup J. It was initially described as a deep branch within the supergroup C (Casiraghi et al., 2004), and then defined as a divergent lineage (Casiraghi et al., 2005; Ros et al., 2009). The accuracy of supergroup J was subsequently questioned, and its insertion into supergroup C has been proposed (Bordenstein et al., 2009; Glowska et al., 2015; Koutsovoulos et al., 2014). Our result clearly supports the accuracy of supergroup J and confirm its position as a sister group of supergroup C as previously suggested (Casiraghi et al., 2005).
Coevolution of Wolbachia and Onchocercidae
Since 1998, the hypothesis suggesting that Wolbachia is ubiquitous in filariae and co-evolved with them has been commonly accepted (Bandi et al., 1998). However, our recent studies on supergroup F of Wolbachia have clearly exposed incongruences with this hypothesis (Ferri et al., 2011; Lefoulon et al., 2012). The key problem in the former studies was that they were based on either a small sampling of Wolbachia-infected filarial species and/or a low phylogenetic resolution of the onchocercid evolutionary history. Indeed, the commonly accepted phylogeny of Onchocercidae was erroneous, with distant species considered to be close and vice-versa (Lefoulon et al., 2015). Now, given the 5 strongly supported clades we described within the Onchocercidae (Fig. 1) (Lefoulon et al., 2015), the coevolution of Wolbachia and filariae needs to be reassessed. Although a general co-evolutionary pattern was observed (Fig. 3), and the PACo global-fit analysis also indicated a global coevolution between filariae and their Wolbachia symbionts (m, p-value <0,001), distinct local features are apparent. Indeed, the superimposition plot shows 7 groups of filariae-Wolbachia associations (Fig. 4A), and the relative contribution of each association to the global fit appears strongly unequal (Fig. 4B). The comparison of both filariae and Wolbachia phylogenies revealed strong disparities of the co-phylogenies among the different symbiont supergroups (Fig. 3).
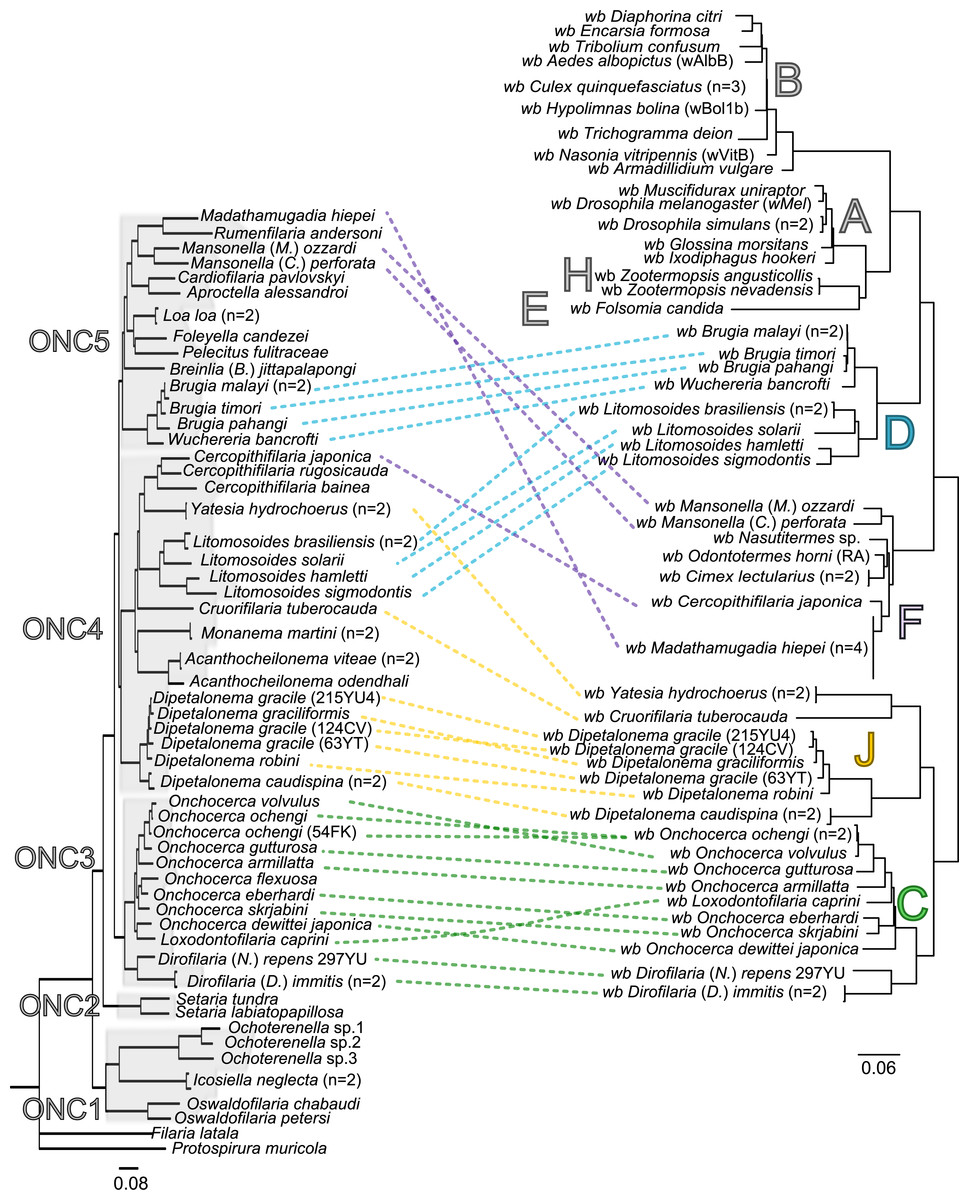
Figure 3: Congruence between filariae and Wolbachia phylogenies.
The phylogenies of filariae and Wolbachia were performed by Maximum Likelihood (ML) inference using RAxML. The scale bar indicates the distance in substitutions per nucleotide. The filariae clades (ONC1-ONC5) were defined according to Lefoulon et al. (2015). The Wolbachia supergroups (A–H) were identified according to Werren, Zhang & Guo (1995), Bandi et al. (1998), Lo et al. (2002), and Ros et al. (2009). Abbreviation: wb, Wolbachia; n, number of studied specimens. Dotted lines show the association between a filarial species and its symbiont. Colors illustrate the bacterial supergroup in filariae.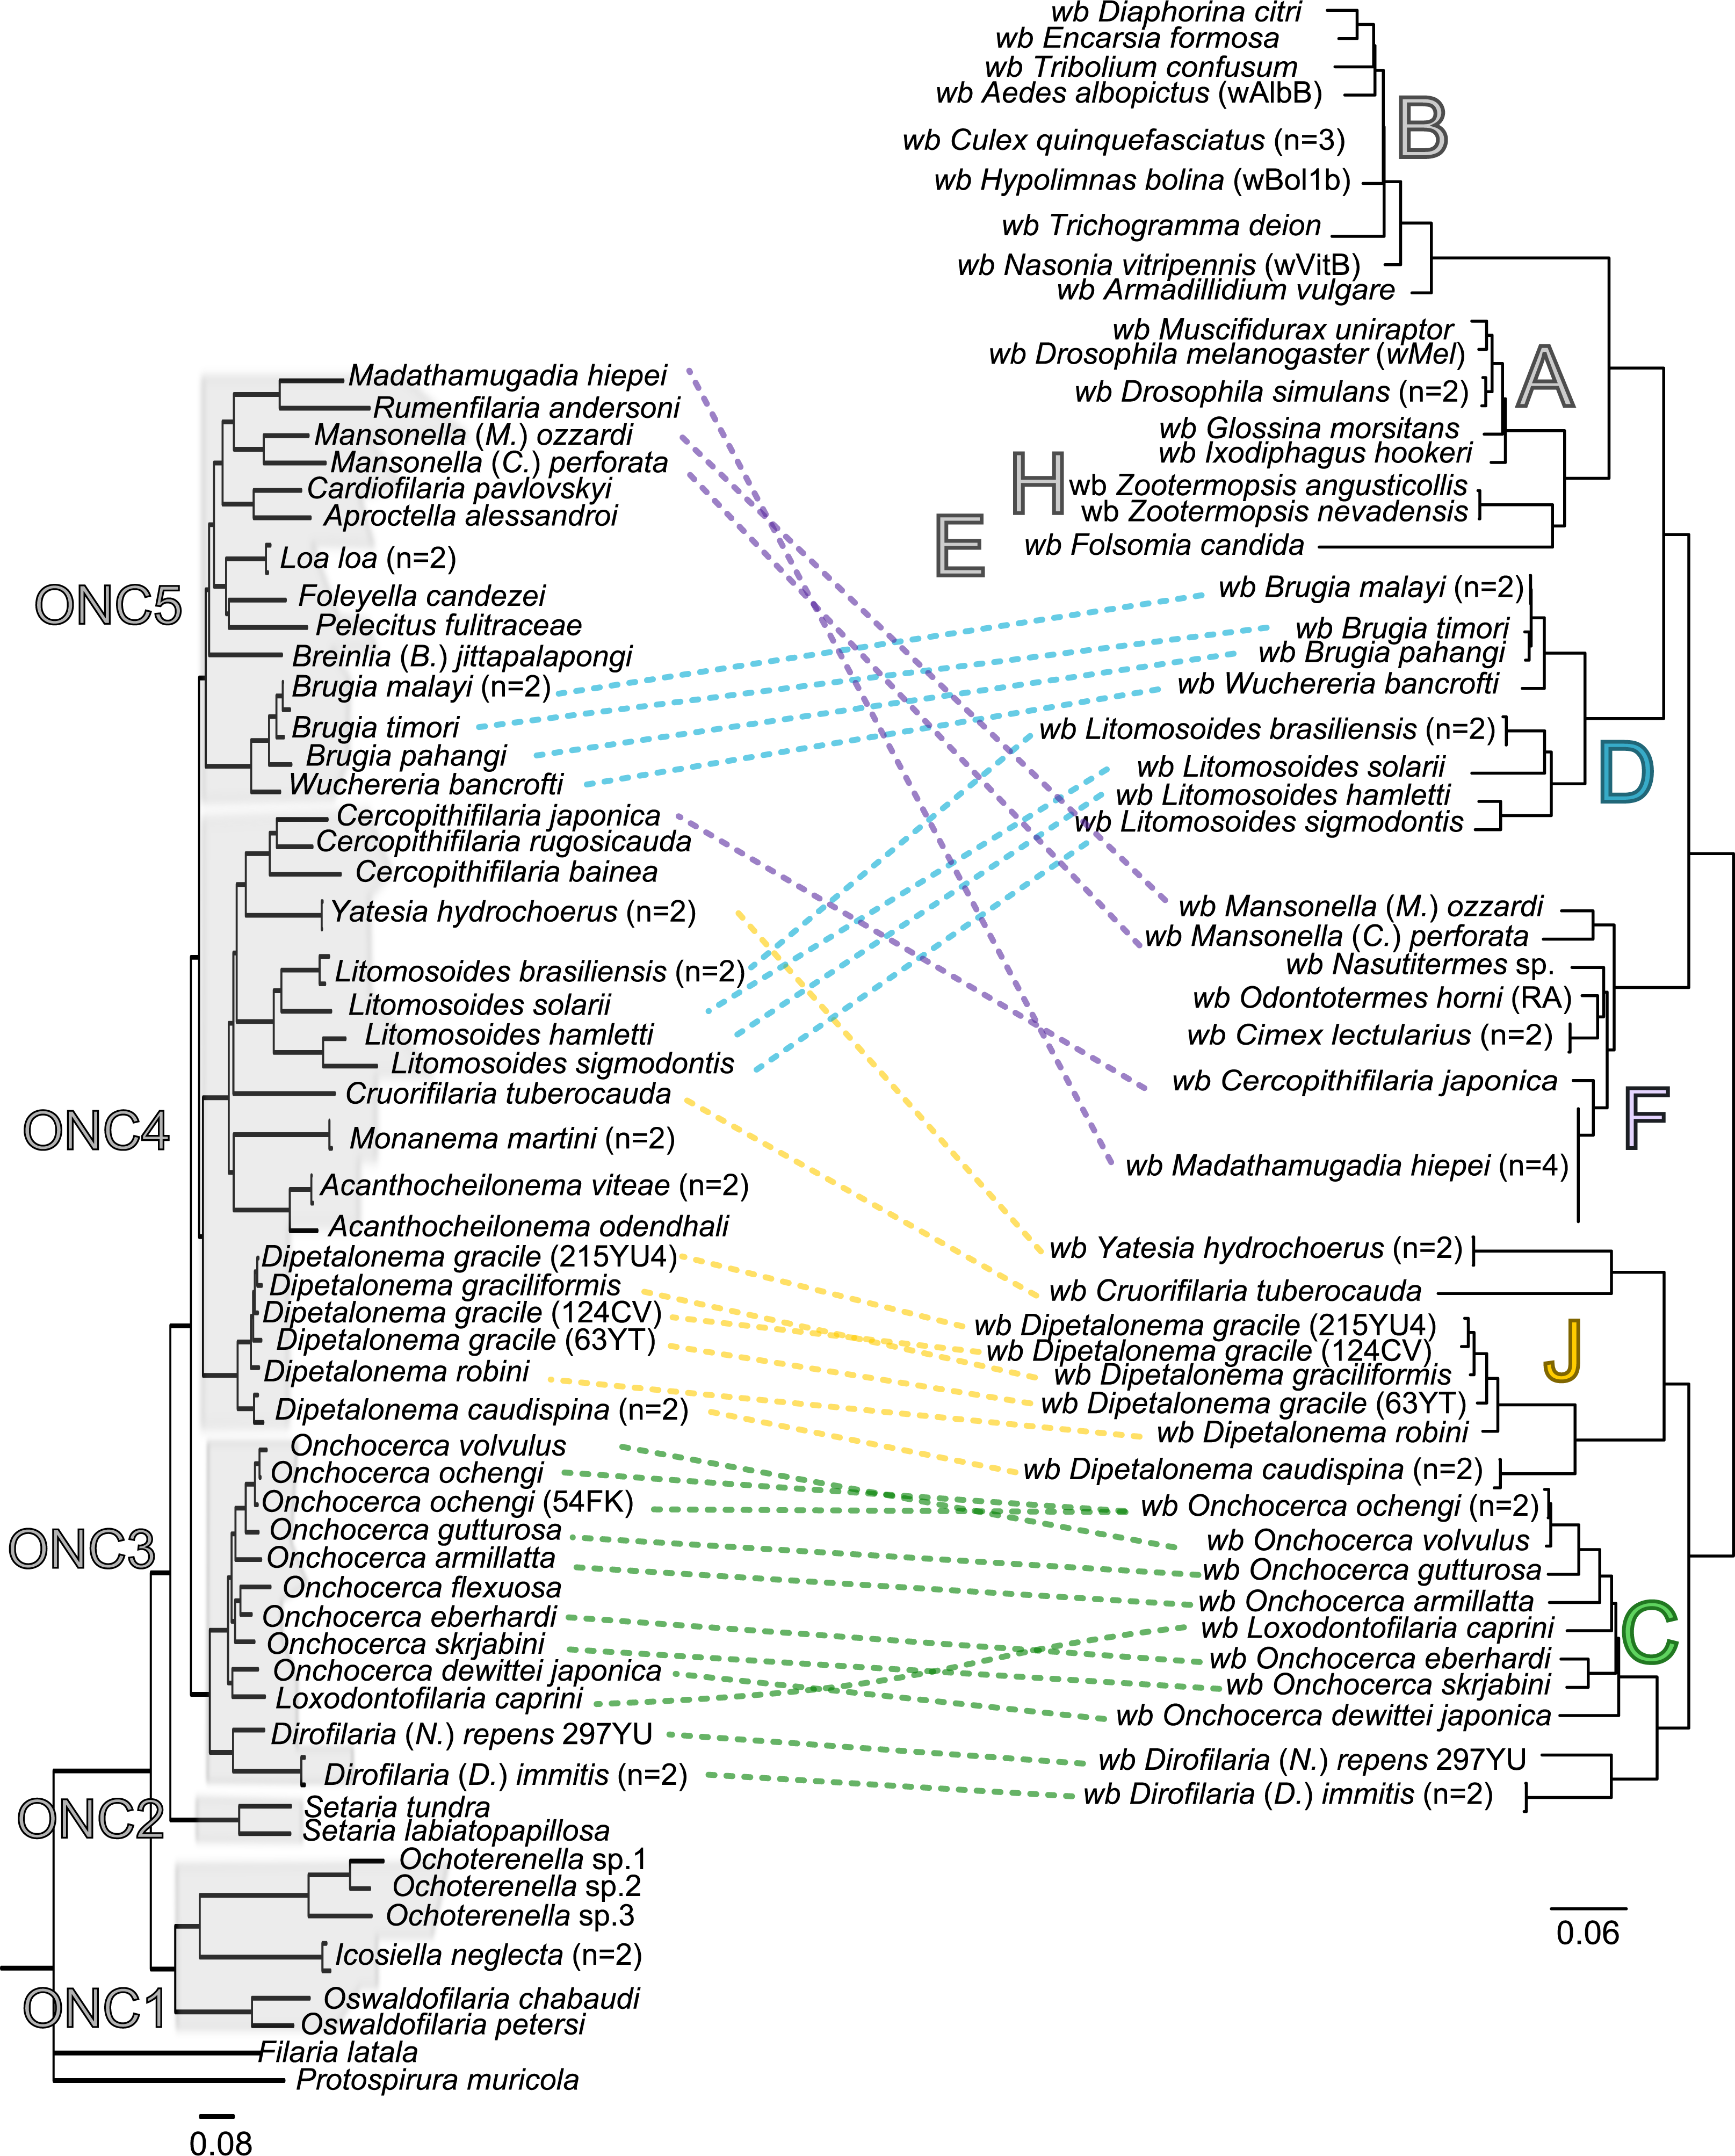
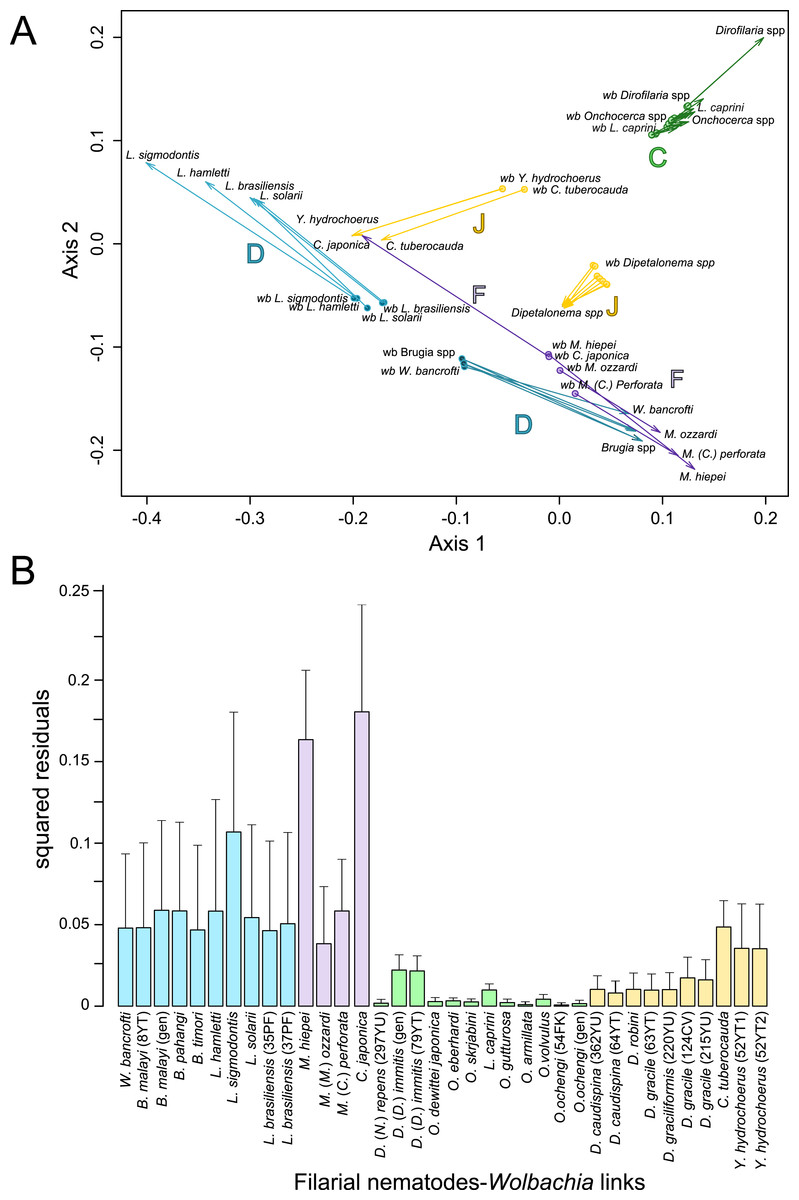
Figure 4: Analysis of coevolution between filariae and Wolbachia.
A PACo global-fit analysis of Wolbachia and their filarial hosts phylogenies was performed. (A) Representative plot of a Procrustes superimposition analysis which minimizes differences between the two partners’ principal correspondence coordinates of patristic distances. For each vector, the start point represents the configuration of Wolbachia and the arrowhead the configuration of filarial hosts. The vector length represents the global fit (residual sum of squares) which is inversely proportional to the topological congruence. (B) Contribution of each Wolbachia-filariae association to a general coevolution. Each bar represents a Jacknifed squared residual and error bars represent upper 95% confidence intervals. Abbreviation: wb, Wolbachia.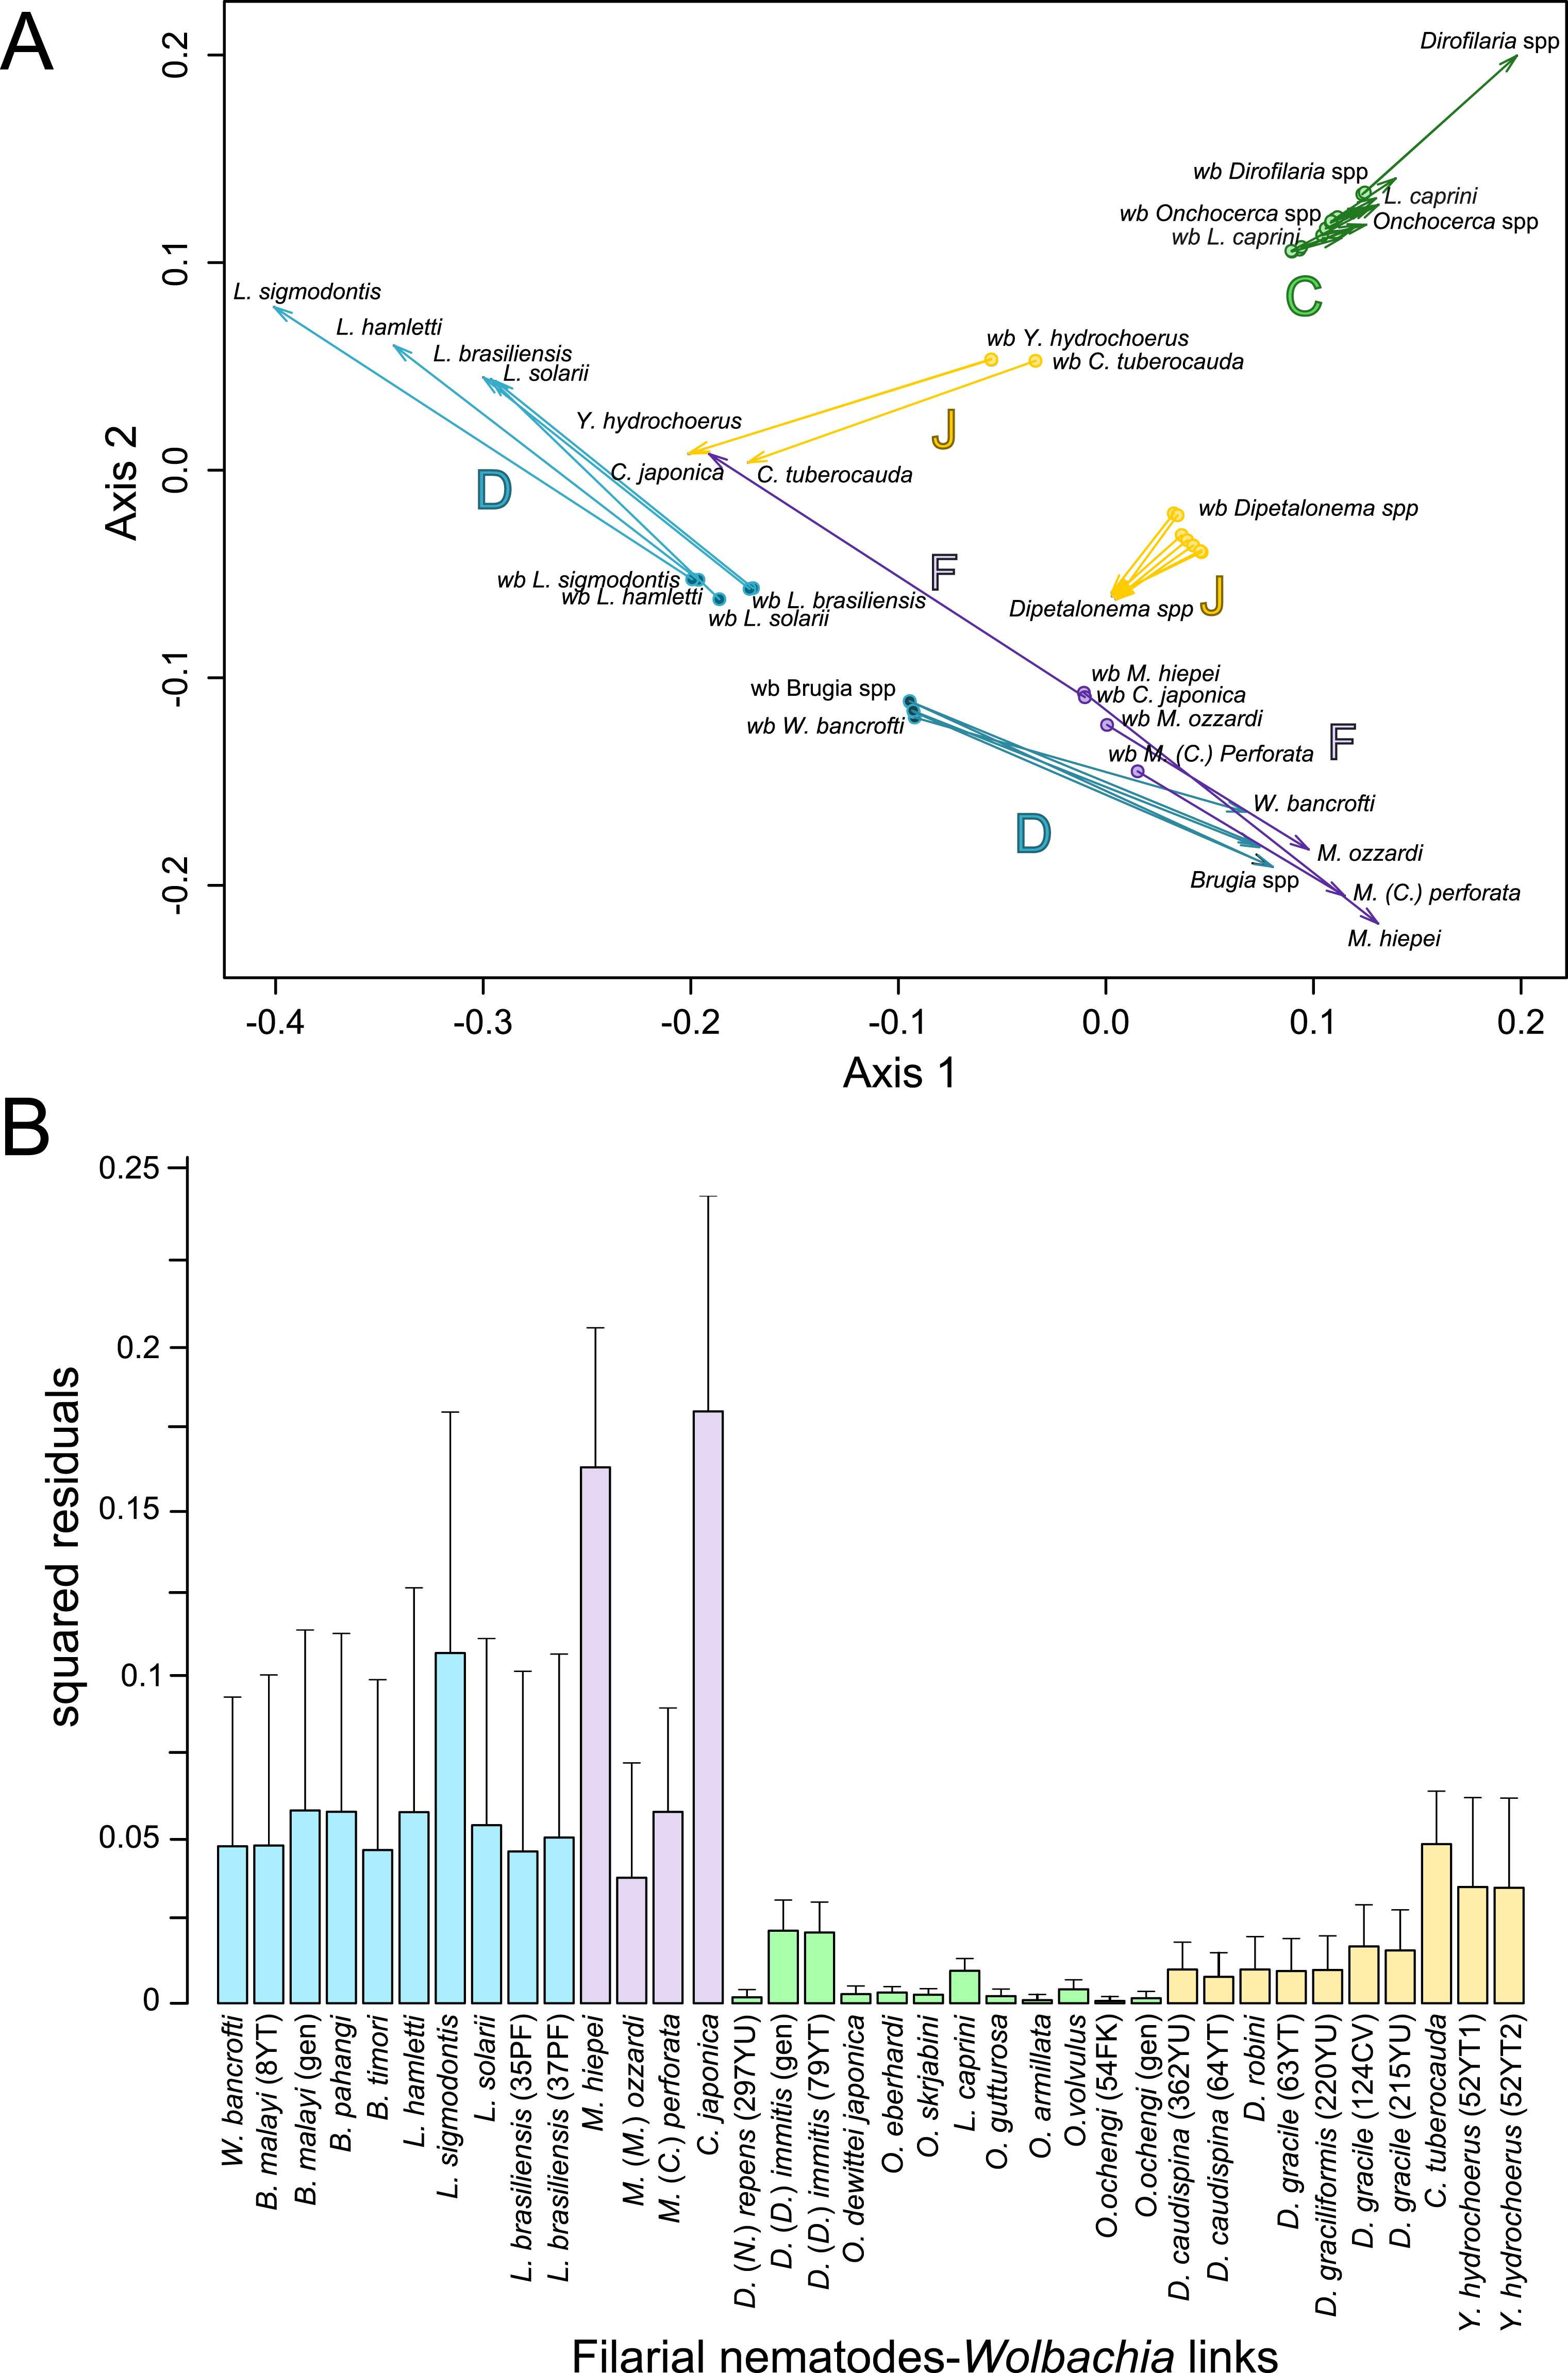
Thus, supergroup C Wolbachia and their filarial hosts form one cluster as a result of a strong congruence between their phylogenies (Fig. 4A). Each association in this group presents low squared residual values, which are representative of strong co-evolutionary associations (Fig. 4B). Interestingly, in general, supergroup C Wolbachia follows the same evolutionary pattern as that of the ONC3 filarial clade (Fig. 3). Two exceptions can be observed: the position of Wolbachia from Loxodontofilaria caprini appears not to be congruent, although statistically weakly supported (bootstrap: 42); and Onchocerca flexuosa is not infected by Wolbachia, which is known to be a secondary loss due to the large number of nuwts in the genome of this species (McNulty et al., 2010).
Supergroup J Wolbachia and their filarial hosts are divided in two clusters, one including Dipetalonema spp. and their endosymbionts, and the second one including C. tuberocauda and Y. hydrochoerus and their endosymbionts (Fig. 4A). Within the type J, evolution of Wolbachia from Dipetalonema species displays a strong congruence with the evolution of their host, unlike Wolbachia from Cruorifilaria and Yatesia (Fig. 4B). Indeed, these two filariae species are not closely related, although they both belong to the same ONC4 clade (Fig. 3). Nonetheless, C. tuberocauda and Y. hydrochoerus share the same host (Hydrochoerus hydrochaeris) and the same neotropical localization as the Dipetalonema species; therefore, horizontal transmission is conceivable. Supergroup J Wolbachia infect exclusively filariae from ONC4, but this clade also contains five Wolbachia-free species: Acanthocheilonema viteae, A. odendhali, Monanema martini, Cercopithifilaria bainae and C. rugosicauda (Fig. 3). Hence, our results suggest events of horizontal transmission of supergroup J Wolbachia in the ONC4 clade, as well as secondary losses.
The supergroups D and F Wolbachia and their filarial hosts are each divided into two clusters, supporting an absence of global coevolution between the bacteria and the filariae (Fig. 4). Indeed, the evolution of supergroups D and F are not perfectly congruent with the evolution of their filarial hosts (Fig. 3). Some associations are clearly incongruent with a co-evolutionary hypothesis, such as the relationship between Wolbachia and C. japonica (supergroup F), M. hiepei (supergroup F), M. (C.) perforata (supergroup F), and L. sigmodontis (supergroup D) (Fig. 4B). Regarding the Wolbachia from supergroup D, one subgroup is distributed in the Litomosoides group belonging to the ONC4 clade, and a second group is distributed in the Brugia/Wuchereria group belonging to the ONC5 clade. The filarial host discontinuity observed in the supergroup D Wolbachia suggests that horizontal transfer events occurred between the two filarial host groups. Regarding the supergroup F Wolbachia, the bacteria were identified in distant filarial host species (Fig. 3): Madathamugadia hiepei and Mansonella spp. belonging to the ONC5 clade, and Cercopithifilaria japonica belonging to the ONC4 clade. The ONC5 clade also contains 7 Wolbachia-free species: Pelecitus fulitraceae, Foleyella candezei, L. loa, Breinlia (B.) jittapalapongi, Aproctella alessandroi, Cardiofilaria pavlovskyi and Rumenfilaria andersoni. Supergroup F also has the peculiarity of including some bacteria infecting arthropods species (e.g,. Cimex lectularius and termite species), supporting one or several horizontal transfers from filariae to arthropods during evolution.
Our current results indicate local patterns of co-evolution and multiple horizontal transmission events of Wolbachia within the Onchocercidae family, which are not limited to supergroup F. In addition, supergroup C is the only one to exhibit strong co-speciation with their hosts and not to show any evidence of horizontal transmission events. Recent identification of higher genome plasticity and a lack of synteny within supergroup D compared to supergroup C (Comandatore et al., 2015) supports the uniqueness of supergroup C.
Origin of Wolbachia infection
To date, 26 scientific articles have presented a rooted phylogenetic tree of Wolbachia and discuss the evolutionary origin of Wolbachia using different methods and a variety of datasets (genes, multi-genes or genomes). The majority of these phylogenetic trees were rooted with Ehrlichia, Anaplasma or Rickettsia as outgroups. Among them, 10 have established the origin of Wolbachia between symbionts of arthropods (supergroups A and B) and symbionts of filariae (supergroups C, D, and J) (Baldini et al., 2014; Bandi et al., 1998; Comandatore et al., 2013; Dumler et al., 2001; Fenn & Blaxter, 2006; Ferri et al., 2011; Nikoh et al., 2014; Sironi et al., 1995; Taylor & Hoerauf, 1999; Unver et al., 2003); 4 have indicated a rooting in the symbionts of arthropods, and more specifically between supergroups A and B (Anderson & Karr, 2001; Bordenstein & Rosengaus, 2005; Bordenstein et al., 2009; Giordano, O’Neill & Robertson, 1995; Koutsovoulos et al., 2014); 6 have found a rooting in the symbionts of filariae (Casiraghi et al., 2001a; Casiraghi et al., 2004; Casiraghi et al., 2001b; Czarnetzki & Tebbe, 2004; Dittmar & Whiting, 2004; Rowley, Raven & McGraw, 2004); 2 studies have proposed the symbiont of Radopholus similis as a sister group of all other Wolbachia (Glowska et al., 2015; Haegeman et al., 2009); and finally 3 studies, including a recent phylogenomic analysis (Casiraghi et al., 2003; Gerth et al., 2014; Ramirez-Puebla et al., 2015), have presented the symbiont of Folsomia candida (supergroup E) as a sister group of all other Wolbachia.
Our rooted phylogenetic tree of Wolbachia is based on the concatenation of six genes (groEL, ftsZ, dnaA, gatB, fbpA and coxA) and presents the supergroup B of Wolbachia as a sister group of all other Wolbachia (Fig. 5). However, our analysis also reveals high branch distance between outgroups and ingroups suggesting that the choice of Ehrlichia and Anaplasma as outgroups induces a long-branch attraction (LBA) artefact due to their high genetic divergence compared to ingroups, as previously suggested (Bordenstein et al., 2009). Moreover, when their outgroups are included in the alignments, substitution saturation was also detected by the Xia method (Xia et al., 2003) for three molecular markers (coxA, p-value = 0.92; gatB, p-value = 0.15; and dnaA, p-value = 0.83) out of 7 analysed (Table 5). Substitution saturation decreases phylogenetic information contained in the sequences and generates phylogenetic reconstruction which does not reveal correct phylogenetic relationships (Xia & Xie, 2001; Xia et al., 2003). Thus, without identification of accurate outgroups, rooting of Wolbachia phylogeny and subsequent analyses are misleading. Consequently, alternative methods need to be investigated.
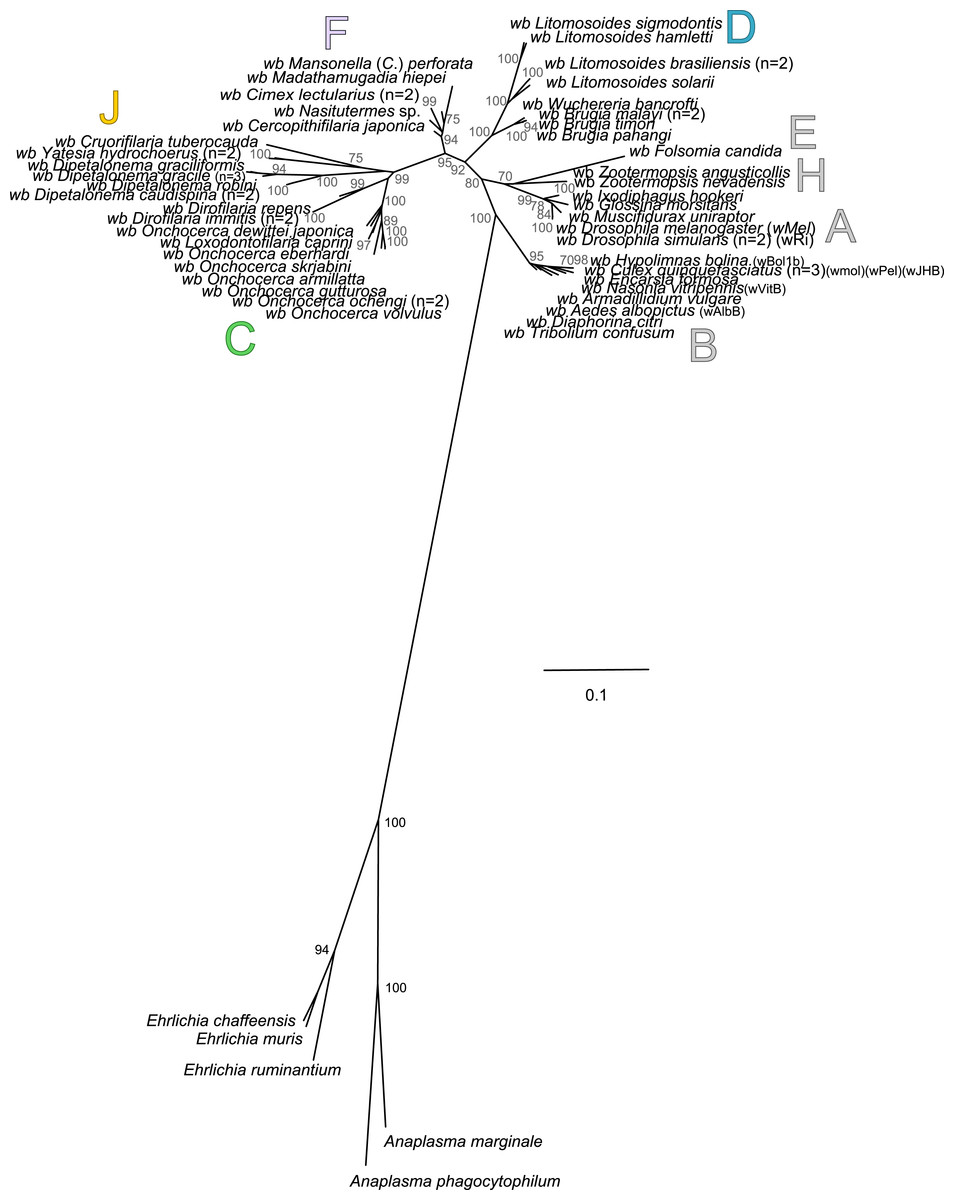
Figure 5: Rooted phylogenetic tree of Wolbachia based on 7 markers by Maximum Likelihood.
Analysis based on partitioned concatenation of dnaA, groEL, ftsZ, coxA, fbpA and gatB amino acid sequences. The total length of datasets is approximately 1,100 aa. 54 Wolbachia strains were analysed. The species Anaplasma marginale, A. phagocytophilum, Ehrlichia chaffeensis, E. muris and E. ruminantium species were used as outgroups. The topology was inferred using Maximum Likelihood (ML) inference using phyML. Nodes are associated with Bootstrap values based on 500 replicates. The Wolbachia supergroups (A–H) were identified according to Werren, Zhang & Guo (1995), Bandi et al. (1998), Lo et al. (2002) and Ros et al. (2009). The scale bar indicates the distance in substitutions per nucleotide. Abbreviation: wb, Wolbachia; n, number of studied specimens.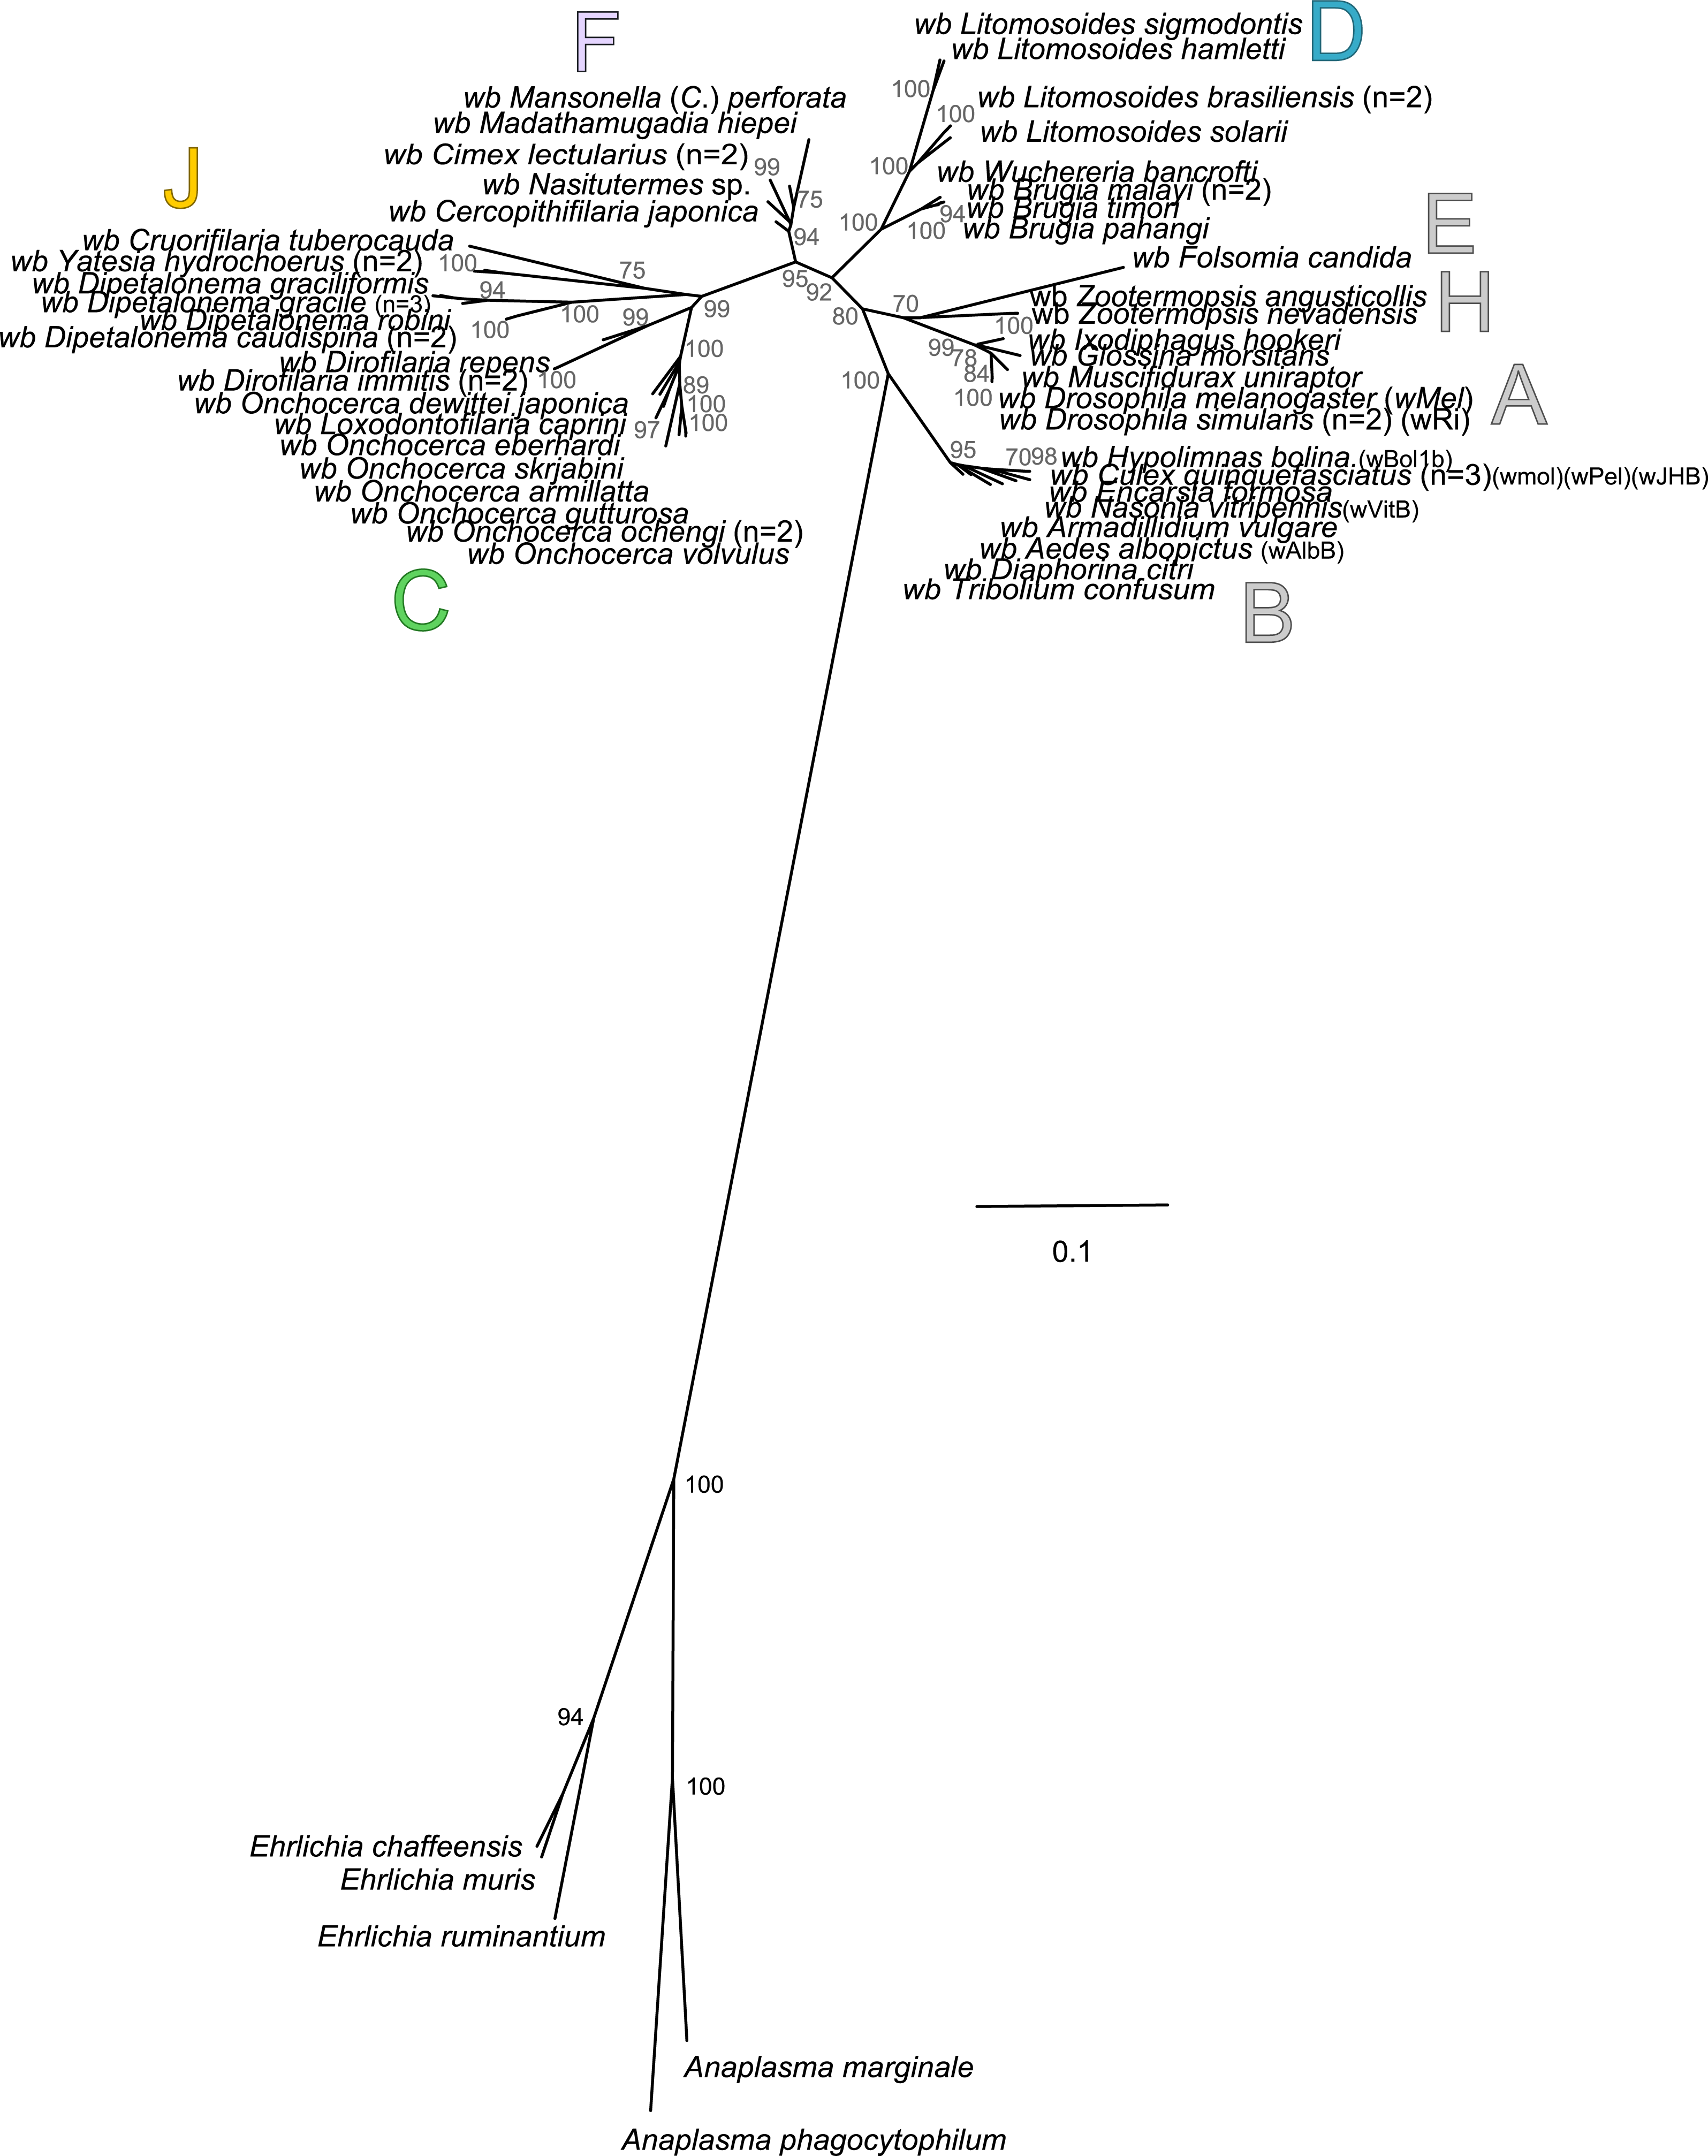
| Markers | N | DF | ISS | ISS.cSym | p-value | ISS.cAsym | p-value |
|---|---|---|---|---|---|---|---|
| fbpA | 32 | 462 | 0.244 | 0.698 | 0 | 0.372 | 0 |
| fbpA+ outgp | 32 | 461 | 0.281 | 0.698 | 0 | 0.371 | 0.0002 |
| ftsZ | 32 | 515 | 0.177 | 0.704 | 0 | 0.378 | 0 |
| ftsZ+ outgp | 32 | 518 | 0.246 | 0.704 | 0 | 0.378 | 0 |
| coxA | 32 | 488 | 0.274 | 0.701 | 0 | 0.376 | 0.0001 |
| coxA+ outgp | 32 | 489 | 0.378 | 0.701 | 0 | 0.376 | 0.9229 |
| 16S rDNA | 32 | 1,255 | 0.339 | 0.763 | 0 | 0.471 | 0 |
| 16S rDNA + outgp | 32 | 1,251 | 0.327 | 0.763 | 0 | 0.471 | 0 |
| gatB | 32 | 564 | 0.251 | 0.709 | 0 | 0.381 | 0 |
| gatB+ outgp | 32 | 558 | 0.338 | 0.708 | 0 | 0.38 | 0.155 |
| groEL | 32 | 745 | 0.13 | 0.727 | 0 | 0.405 | 0 |
| groEL+ outgp | 32 | 836 | 0.267 | 0.735 | 0 | 0.419 | 0 |
| dnaA | 32 | 407 | 0.259 | 0.692 | 0 | 0.363 | 0 |
| dnaA+ outgp | 32 | 410 | 0.357 | 0.692 | 0 | 0.364 | 0.8301 |
Notes:
- Outgp
-
outgroups
The current phylogenies of both Wolbachia and their filarial hosts allow us to attempt an explanation of the symbiotic history on the basis of the most parsimonious co-phylogeny scenario. Our data raise the hypothesis that Wolbachia infection in the onchocercid family was acquired between the diversification of ONC2 (Setarinae) and the later derived clades (Fig. 3). Phylogenetic and co-evolutionary data suggest that supergroup C has diverged in the ONC3 filarial clade, which is the first diverged clade from ONC2 (Fig. 3). These data imply that supergroup C of Wolbachia would be the ancestral symbionts. All other alternatives involve numerous horizontal transfers of Wolbachia within the Onchocercidae. Upon agreement on the basal position of supergroup C in the co-phylogeny of Wolbachia and filariae, a “walking” method can be used to analyse the other bacteria supergroups (Fig. 3): supergroup J is thus the closest to supergroup C, infecting filarial species in ONC4 clade; subsequently, supergroups F and D appear, infecting respectively both ONC4 and ONC5 and showing horizontal transfers and losses, but also local coevolution.
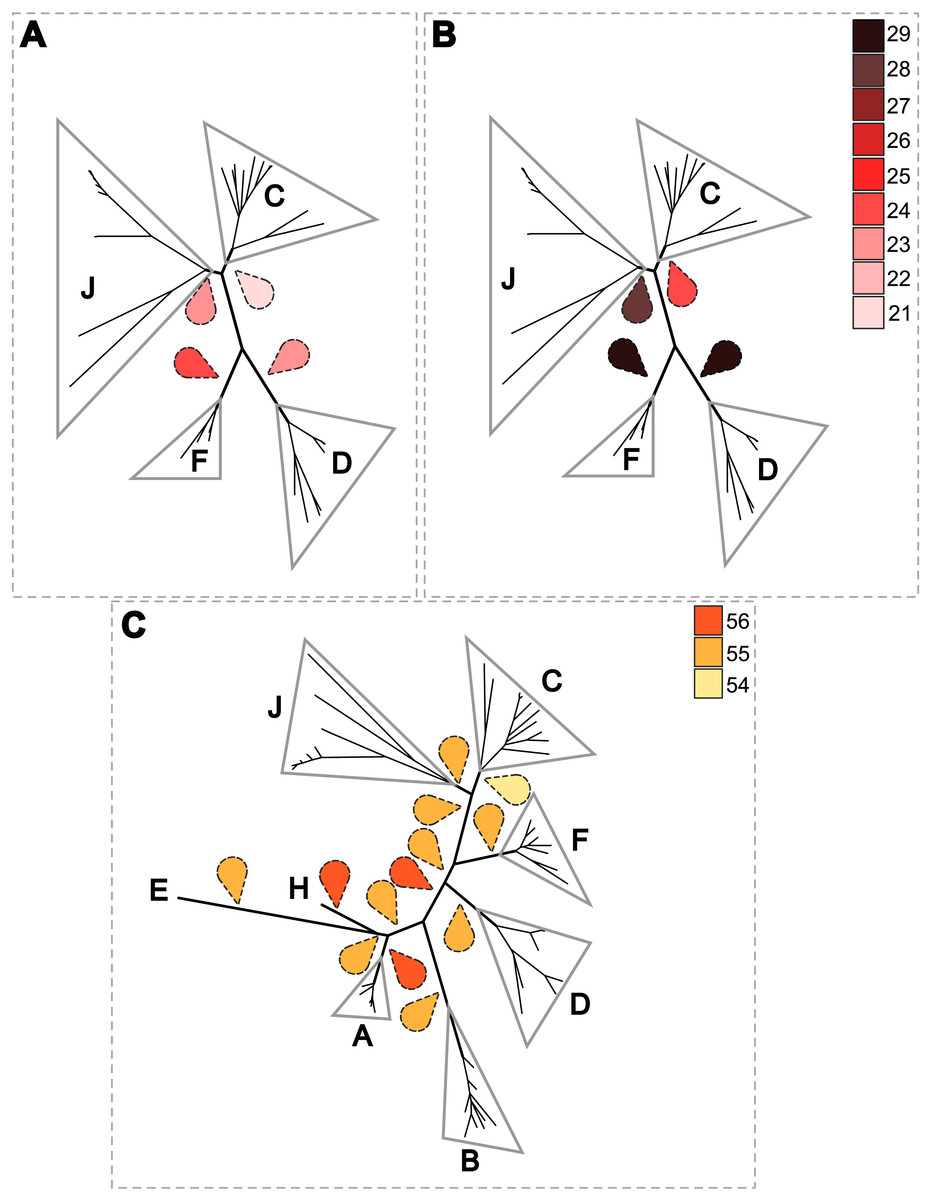
Figure 6: Estimation of the cost of co-evolutionary scenarios based on different rooted Wolbachia phylogenies.
An event-cost method with Jane software was performed. Representations of the costless co-evolutionary reconstructions between Wolbachia and their hosts are shown using the following regime cost criteria: co-speciation = 0; duplication = 1; loss = 1; and duplication and host switch = 2. Different roots for the phylogeny of Wolbachia were tested. The colored drop tips indicate the examined rooting and the color represents the lowest associated cost. (A) co-evolutionary reconstruction between 36 Wolbachia and their filarial hosts without time constraint. (B) co-evolutionary reconstruction between 36 Wolbachia and their filarial hosts with time constraint. (C) co-evolutionary reconstructions between 60 Wolbachia and their filarial and arthropod hosts.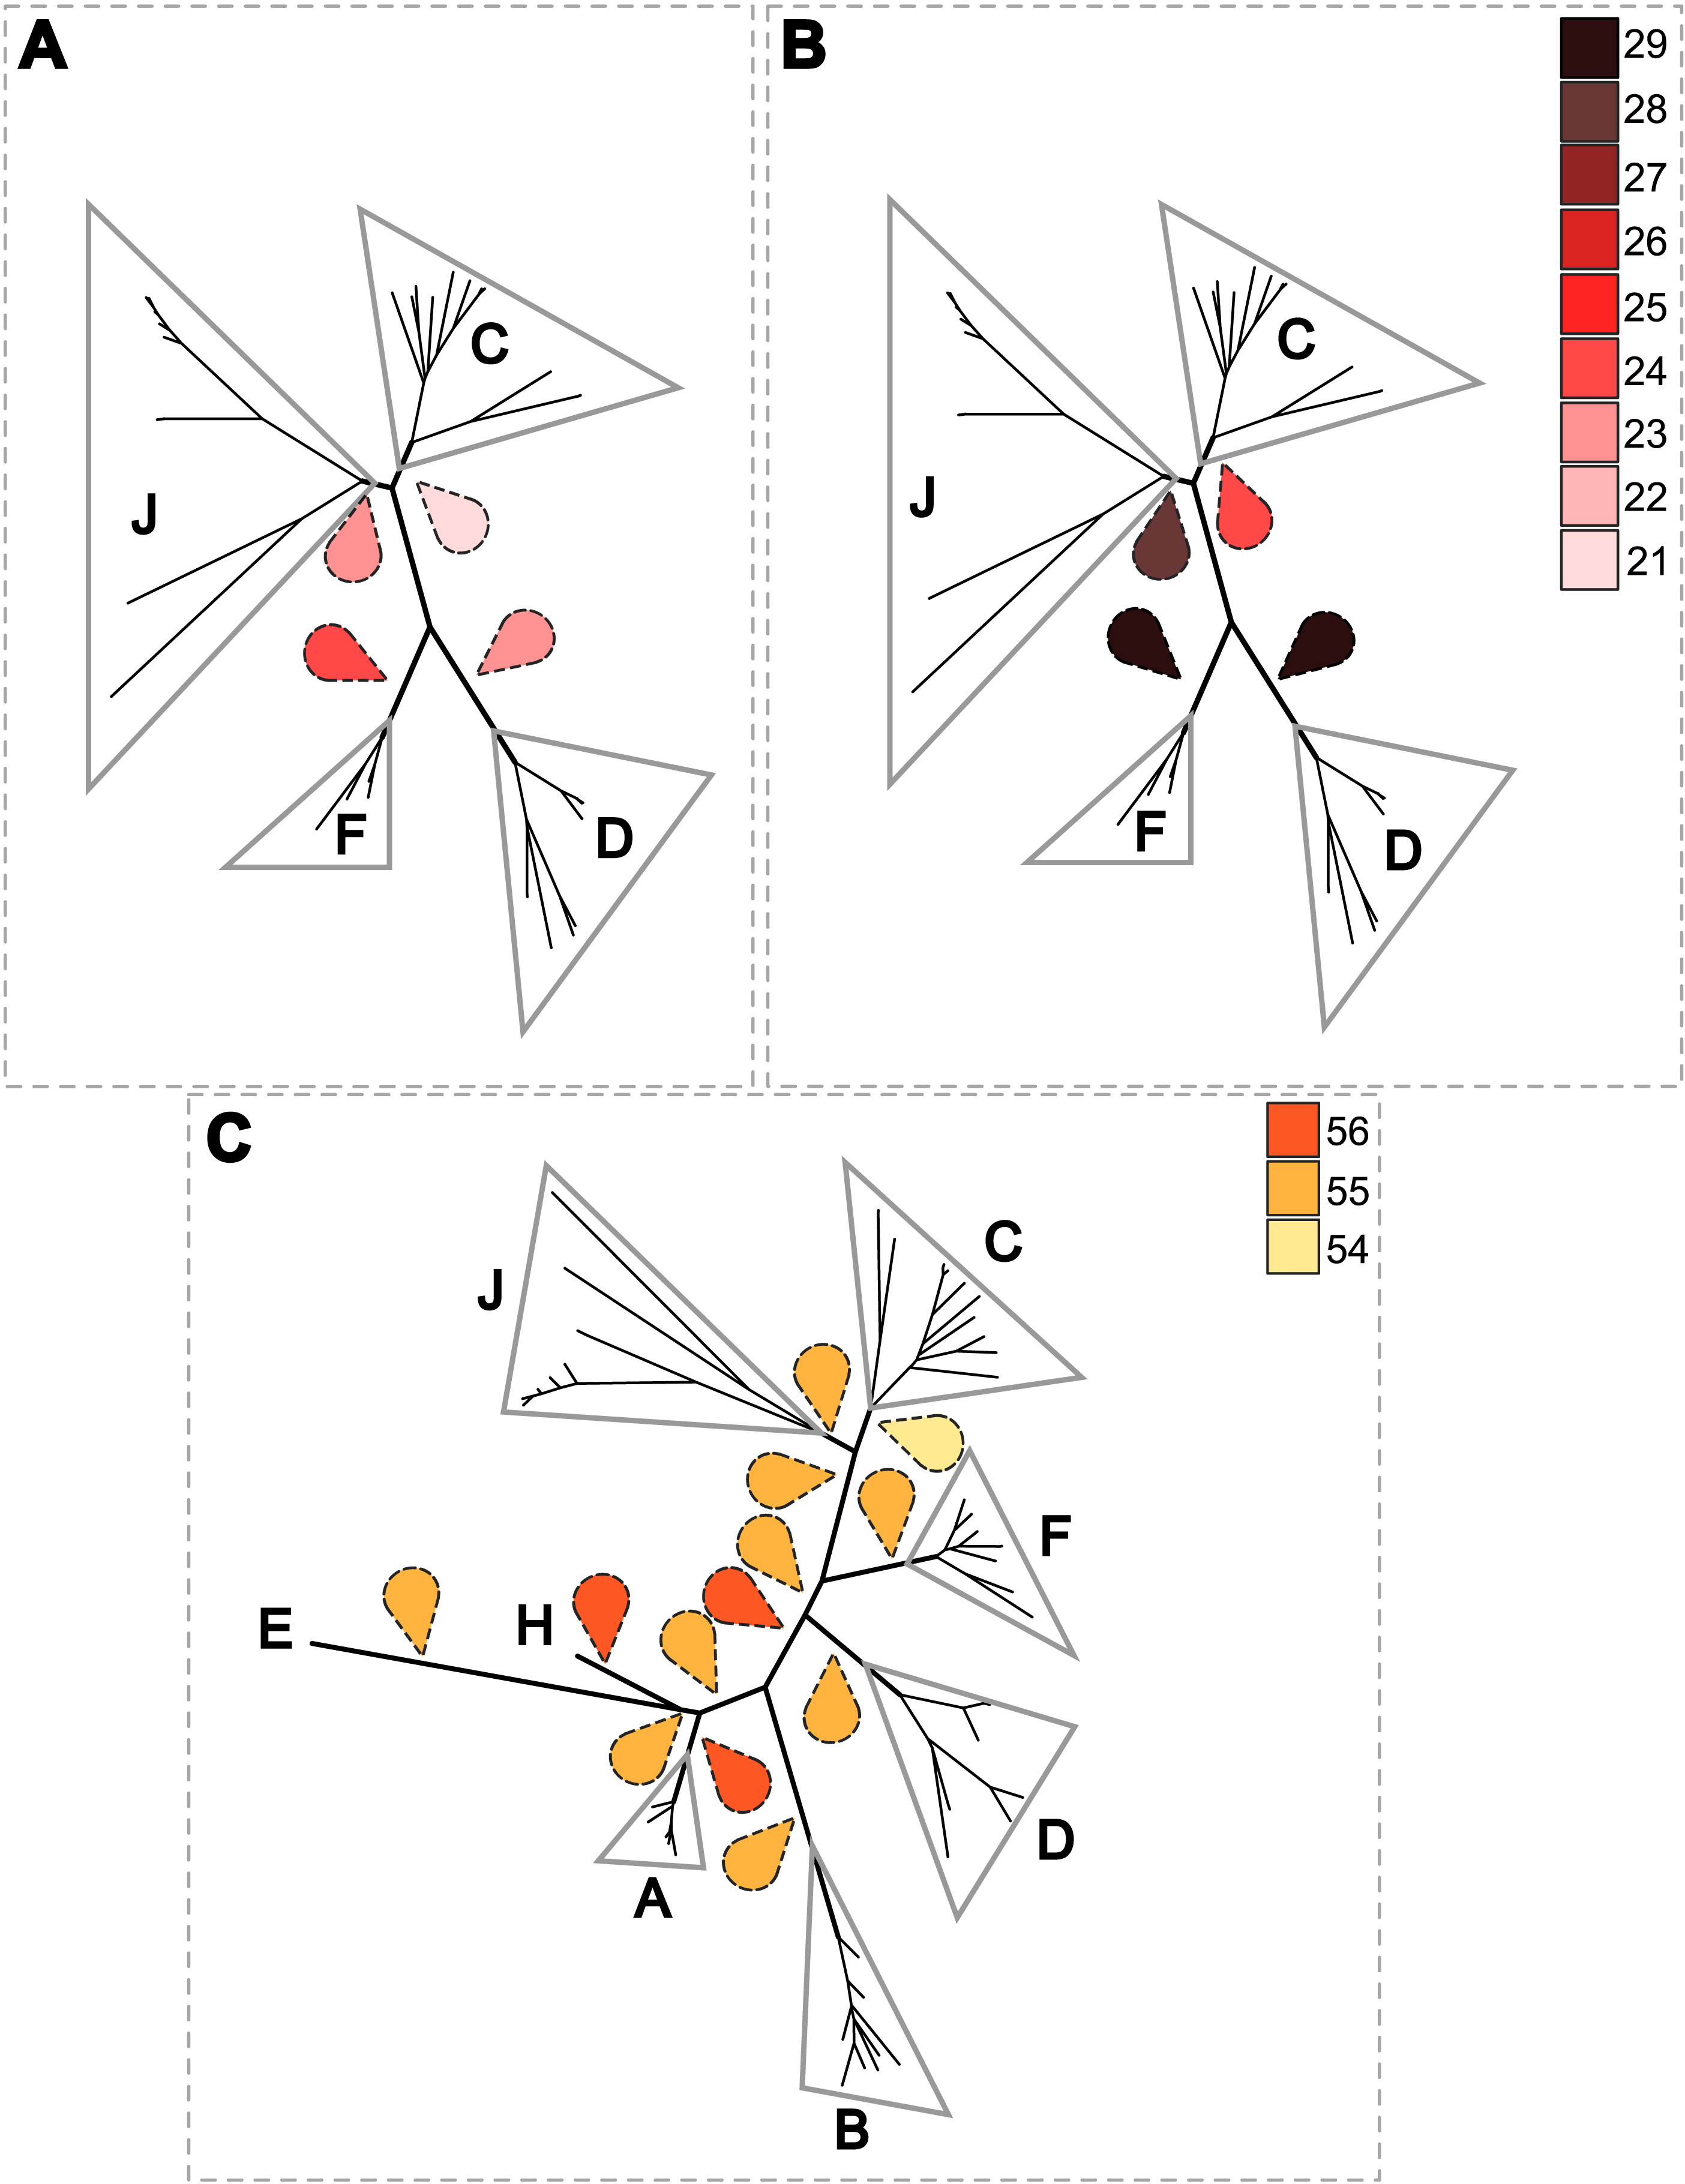
To further analyse the coevolution scenarios, an event-based method using Jane v4 (Conow et al., 2010) was applied to our data, computing each scenario while minimizing the cost of evolutionary events. Focusing on Wolbachia from filariae reveals that a rooting of the phylogeny of Wolbachia within supergroup C represents the co-evolutionary scenario associated with the lowest cost (Figs. 6A and 6B). Cost differences between different Wolbachia-rooted tree analyses are increased if a time constraint is applied to limit host switch events which could be inconsistent with filarial phylogeny (see Material and Method) (Figs. 6A and 6B). Similarly, the analysis including Wolbachia from arthropods also suggests a rooting of the phylogenetic tree of Wolbachia within supergroup C because of its lowest co-evolutionary scenario cost, even if cost differences are weak (Fig. 6C). Unfortunately, it would be difficult to increase these cost differences by defining time zones, as for analysis performed with the Wolbachia from filariae (see Material and Method). Indeed, timescale evolution of filariae is unknown due to absence of paleontological data, so it is not possible to position their speciation versus the evolutionary history of arthropods. The two proposed analyses using Jane have limitations (such as time zone definition), but all results suggest that supergroup C is the ancestrally derived group of nematode Wolbachia symbionts. This scenario may lead to the hypothesis that Wolbachia have primarily infected and diverged within the filarial species and then were transferred from the supergroup D Wolbachia to arthropod species.
Such a hypothesis on the origin of Wolbachia does not simply change the reading of the phylogenetic tree, but may also improve our understanding of Wolbachia adaptation to their hosts at the evolutionary scale. Indeed, the genome structures of Wolbachia infecting arthropods are relatively large and plastic, including numerous mobile elements (repeated elements, transposons, and phages); whereas symbionts of filariae present more compact genomes without actively mobile DNA. Thus, the genomic structure could be regarded differently, as the acquisition of plasticity and increased insertions of mobile DNA may be patterns linked to a change of host range. Recently, analyses of complete genomes of Wolbachia indicated that symbionts belonging to supergroup C from Onchocerca ochengi (wOo) and Dirofilaria immitis (wDi), present specific genomic features including reduced genome size, a low number of genomic rearrangements, fewer insertion sequences, and losses or pseudogenization of numerous genes (e.g., 88 unique losses for wOo) (Comandatore et al., 2015; Darby et al., 2012). These data would support a reductive evolution of supergroup C (Darby et al., 2012). However, it was also suggested that such features are characteristic of endosymbiotic bacteria with long-lasting relationships with their hosts (Comandatore et al., 2015), which is consistent with our results showing that supergroup C is strongly co-evolved with its hosts. Nevertheless, we cannot rule out that Wolbachia could have originally had a very plastic genome structure and reductive evolution may have been promoted by strong coevolution with their hosts.
In conclusion, we show that patterns of coevolution between Wolbachia and their filarial hosts are much more complex than previously assumed, with numerous examples of secondary losses of symbionts and horizontal transfers between clades. Strict coevolution is restricted to filarial clade ONC 3 with Wolbachia in supergroup C. Moreover, since tree-rooting options are contentious for Wolbachia, we have applied a series of novel analyses to address the question of the origin of the Wolbachia symbiosis. These methods, although not without their own limitations, place the origin within supergroup C rather than an arthropod-specific supergroup.
Supplemental Information
List of author(s) and dates of studied species
List of author(s) and dates associated with name of filariae, their vertebrate hosts or arthropods.
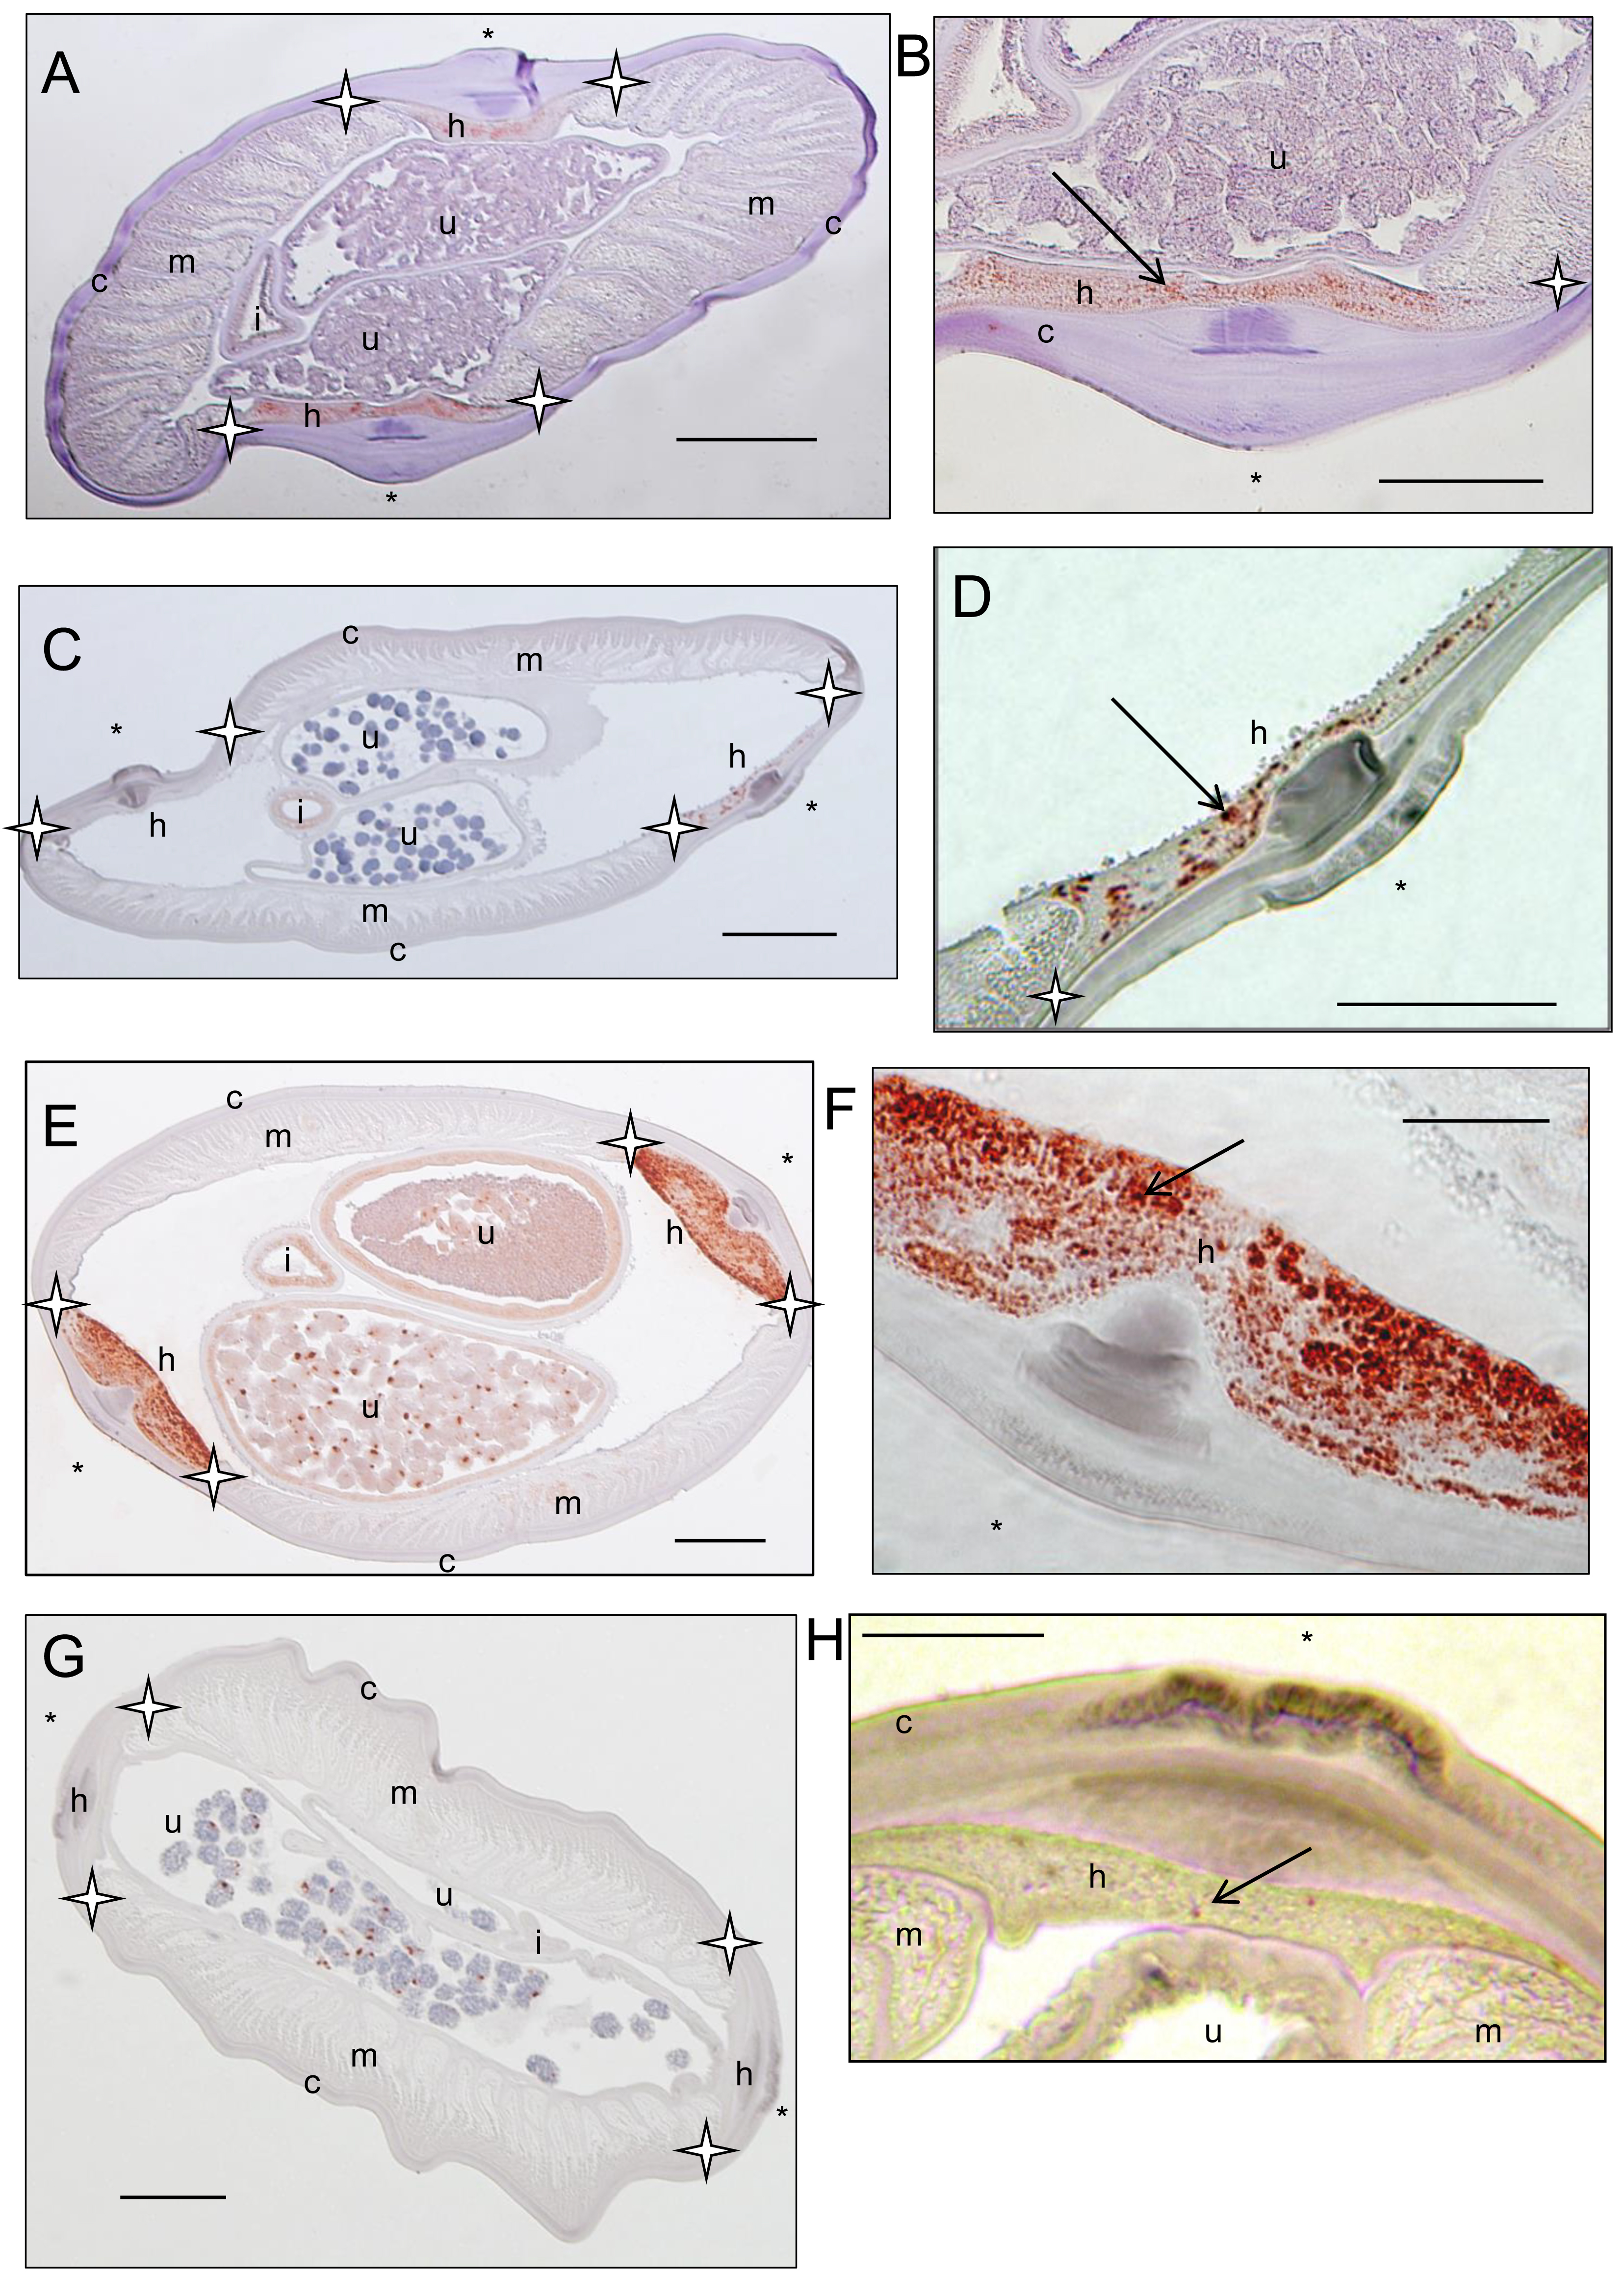
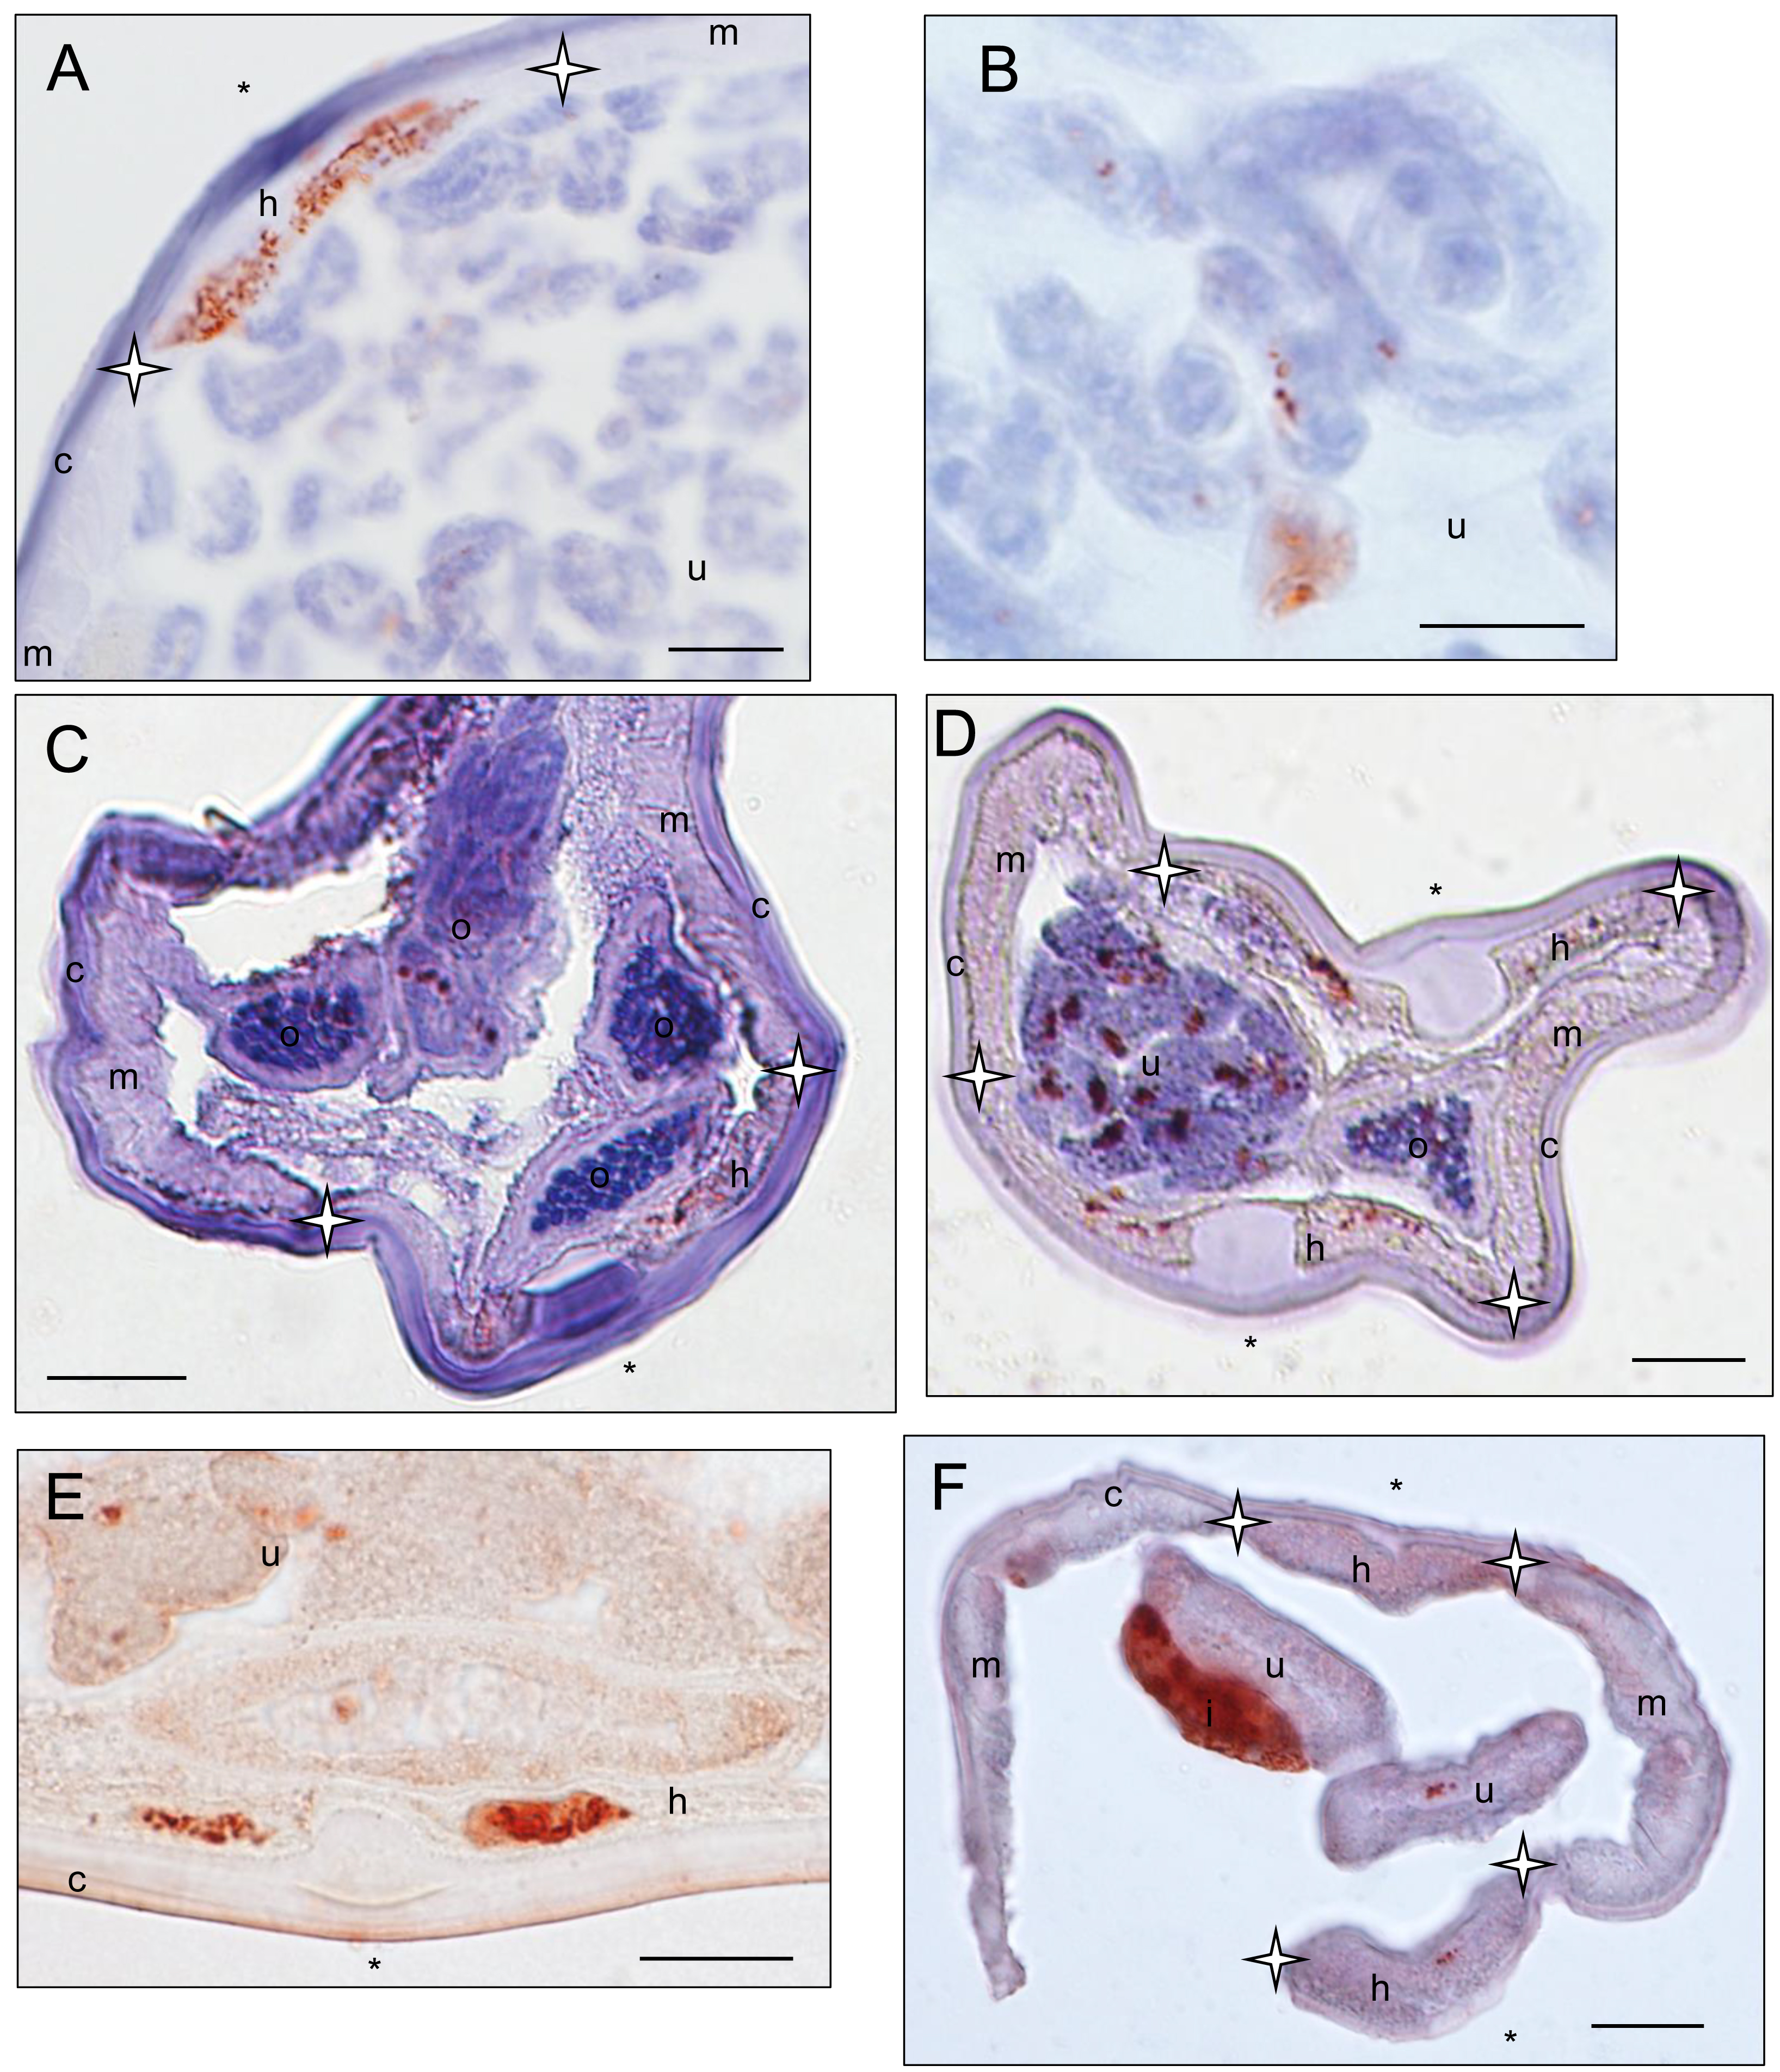
Wolbachia immunostaining in four female specimens belonging to the Dipetalonema genus
Sections stained with a rabbit polyclonal antiserum against Wolbachia surface protein (WSP) of Brugia pahangi Wolbachia (Wol-Bp-WSP, dilution 1:2,000). Presence of Wolbachia (small red dots) is indicated by an arrow. (A–B) a Dipetalonema caudispina specimen (64YT) presents staining in the hypodermal lateral chord. (C–D) a Dipetalonema robini specimen (217YU) presents staining in the hypodermal lateral chord and germline (not shown). (E–F) a Dipetalonema gracile specimen (215YU) presents staining in the hypodermal lateral chord and reproductive tract. (G–H) a Dipetalonema graciliformis specimen (220YU) presents staining in the hypodermal lateral chord and reproductive tract. Legend: I, intestine; U, uterus; c, cuticle; h, hypodermal lateral chords; m, muscles; hypodermal lateral chord delimited by stars; * indicated lateral plan.
Wolbachia immunostaining in female specimens belonging to Cruorifilaria, Litomosoides and Cardiofilaria genera
Sections stained with a rabbit polyclonal antiserum against Wolbachia Surface Protein (WSP) of Brugia pahangi Wolbachia (Wol-Bp-WSP, dilution 1:2,000). Presence of Wolbachia (small red dots) is indicated by an arrow. (A–B) a Cruorifilaria tuberocauda specimen (57YT) presents staining in the hypodermal lateral chord and reproductive trac. (C–D) a Litomosoides brasiliensis specimen (35PF) presents staining in the hypodermal lateral chord and reproductive tract (not shown). (E) a Litomosoides solarii specimen (213YU) presents staining in the hypodermal lateral chord and reproductive tract. (F) a Cardiofilaria pavlovkyi specimen (180YU) presents staining in the hypodermal lateral chord, reproductive tract and intestinal wall cells. Legend: I, intestine; U, uterus; c, cuticle; h, hypodermal lateral chords; m, muscles; Hypodermal lateral chord delimited by stars; ∗ indicated lateral plan.
Ethical statement on vertebrate hosts
Vertebrate host are indicated in the first column and their collection place is given in the second column. The name of the collected filarial species is given in the third column. Columns 4 and 5 present ethical information on the host collection, i.e., the capture permit number and the ethical committee or legal entity for scientific procedures; columns 6 to 8 describe non-scientific procedures in which filariae were recovered from vertebrates after hunting, necropsies in slaughter houses, or post-veterinary or post-medical procedures. The number of MNHN collection registration is listed in the last column.
Primers and PCR programs used in this study
Abbreviations: size, amplicon size; step 1, denaturation; step 2, annealing; step 3, elongation; T, temperature (°C); D, duration (sec); N, number of cycles; pr., primers; BSA, bovine serum albumin; ref, reference. ∗ Indicates that the primers were designed for nested PCR. References: PS means newly designed for the present study.
Accession number list of Wolbachia from filarial species or from arthropods, and outgroupsused for phylogenetic analyses
The name of the species are given in the first column. The identification number of samples are given in the second column. Columns 3 to 9 present accession numbers for each analysed gene: 16S rDNA; 60 kDa chaperonin groEL gene; ftsZ gene for cell division protein; dnaA gene for chromosomal replication initiator protein; cytochrome c oxidase subunit I (coxA) gene; putative fructose-bisphosphate aldolase (fbpA) gene; and glutamyl-tRNA(Gln) amidotransferase subunit B (gatB) gene. Abbreviations: ext. indicates external samples.
Summary of reports of the presence of Wolbachia in filariae
Filariae examined in the current study are indicated in bold. Abbreviation: EM, transmission electron microscopy; IM, immunostaining; +, detection of Wolbachia; ND, not determined.