
PhyloPythiaS+: a self-training method for the rapid reconstruction of low-ranking taxonomic bins from metagenomes
- Published
- Accepted
- Received
- Academic Editor
- Jonathan Eisen
- Subject Areas
- Bioinformatics, Computational Biology, Genomics, Taxonomy
- Keywords
- Metagenomics, Taxonomic classification, Machine learning, Bioinformatics
- Copyright
- © 2016 Gregor et al.
- Licence
- This is an open access article distributed under the terms of the Creative Commons Attribution License, which permits unrestricted use, distribution, reproduction and adaptation in any medium and for any purpose provided that it is properly attributed. For attribution, the original author(s), title, publication source (PeerJ) and either DOI or URL of the article must be cited.
- Cite this article
- 2016. PhyloPythiaS+: a self-training method for the rapid reconstruction of low-ranking taxonomic bins from metagenomes. PeerJ 4:e1603 https://doi.org/10.7717/peerj.1603
Abstract
Background. Metagenomics is an approach for characterizing environmental microbial communities in situ, it allows their functional and taxonomic characterization and to recover sequences from uncultured taxa. This is often achieved by a combination of sequence assembly and binning, where sequences are grouped into ‘bins’ representing taxa of the underlying microbial community. Assignment to low-ranking taxonomic bins is an important challenge for binning methods as is scalability to Gb-sized datasets generated with deep sequencing techniques. One of the best available methods for species bins recovery from deep-branching phyla is the expert-trained PhyloPythiaS package, where a human expert decides on the taxa to incorporate in the model and identifies ‘training’ sequences based on marker genes directly from the sample. Due to the manual effort involved, this approach does not scale to multiple metagenome samples and requires substantial expertise, which researchers who are new to the area do not have.
Results. We have developed PhyloPythiaS+, a successor to our PhyloPythia(S) software. The new (+) component performs the work previously done by the human expert. PhyloPythiaS+ also includes a new k-mer counting algorithm, which accelerated the simultaneous counting of 4–6-mers used for taxonomic binning 100-fold and reduced the overall execution time of the software by a factor of three. Our software allows to analyze Gb-sized metagenomes with inexpensive hardware, and to recover species or genera-level bins with low error rates in a fully automated fashion. PhyloPythiaS+ was compared to MEGAN, taxator-tk, Kraken and the generic PhyloPythiaS model. The results showed that PhyloPythiaS+ performs especially well for samples originating from novel environments in comparison to the other methods.
Availability. PhyloPythiaS+ in a virtual machine is available for installation under Windows, Unix systems or OS X on: https://github.com/algbioi/ppsp/wiki.
Introduction
Metagenomics is the functional or sequence-based analysis of microbial DNA isolated directly from a microbial community of interest (Riesenfeld, Schloss & Handelsman, 2004; Kunin et al., 2008). As the cultivation conditions for most microorganisms are unknown or too complex to reproduce in the laboratory (Hugenholtz, 2002), random shotgun and amplicon-sequencing based metagenome studies have led to substantial advances in our understanding of the structure and functions of microbial communities within the last decade (Kalyuzhnaya et al., 2008; Turnbaugh et al., 2010; Hess et al., 2011; Pope et al., 2011b; Zarowiecki, 2012; Schloissnig et al., 2013; Blaser et al., 2013). The taxonomic classification or ‘binning’ of metagenome samples is often performed after sequence assembly (Peng et al., 2011; Laserson, Jojic & Koller, 2011; Boisvert et al., 2012; Namiki et al., 2012; Pell et al., 2012). This is a computationally demanding task, which for metagenome samples results in a mixture of sequence fragments of varying lengths, originating from the different microbial community members. A taxonomic binning defines ‘bins’ of sequence fragments that were assigned the same taxonomic identifier, representing draft genomes or pan-genomes of the different microbial community members. Taxonomic binning methods use sequence homology, sequence composition and similarities of contigs in read coverage or gene counts, see Dröge & McHardy (2012) for a recent review. The subsequent analysis of these bins allows characterizing the functional and metabolic potential for individual taxa. For instance, in a collaboration with Mark Morrison’s group, a functional and metabolic analysis of a draft genome recovered by taxonomic binning from the gut of the Australian Tammar Wallaby metagenome led to the isolation and subsequent characterization of a new and previously uncultivated bacterium (Pope et al., 2011b). Different from binning methods, taxonomic profiling tools (Wu & Eisen, 2008; Stark et al., 2009; Liu et al., 2011; Meinicke, Asshauer & Lingner, 2011; Wu & Scott, 2012; Segata et al., 2012; Sunagawa et al., 2013; Silva et al., 2013) return a taxonomic profile for a metagenome sample to represent the taxonomic composition of the underlying sampled community.
Composition-based binning methods assign metagenome sequences based on their k-mer signature, which is derived from the counts of short oligomers (k-mers) for a sequence (Karlin & Burge, 1995; Deschavanne et al., 1999). Our previously developed PhyloPythia(S) (PPS) (McHardy et al., 2007; Patil, Roune & McHardy, 2011) software uses this information in combination with a structured output support vector machine framework for taxonomic classification. Composition-based signatures are global genomic properties, which can be estimated from any sufficiently sized sequence sample for a taxon; e.g., for PP(S), 100 kb of reference sequences for a taxon are sufficient for accurate assignment, also for low ranking taxa. Thus, no complete genome sequences of related organisms are required for assignment, which is often a limiting factor for the homology-based methods. Composition-based methods are very fast, with classification runtimes increasing linearly with the size of the sequence sample, whereas the runtime of alignment-based methods is proportional to the product of the reference collection size and the sequence sample size. As the current sequencing technologies produce Gb-sized metagenome samples (Metzker, 2010; Loman et al., 2012), scalability and computational efficiency are becoming increasingly important for computational metagenomic methods. Therefore, we have developed a fully automated taxonomic binning software, that can rapidly process large metagenome samples. PhyloPythiaS+ (PPS+) is the successor to our previously described PPS software and improves on it in several important ways. We provide an automated marker-gene based framework for design and creation of sample-derived structured output support vector machine models, which allows the generation of accurate sample-derived models without user intervention or expert knowledge. PPS+ is the first tool that combines taxonomic profiling and subsequent taxonomic composition based binning of the whole metagenome sample, which is particularly valuable for the draft genome reconstruction of taxa from deep-branching phyla. By implementation of a faster k-mer counting algorithm, we substantially increased its throughput to 0.5 Gb/h. PPS+ is distributed in a virtual machine which facilitates installation under all common operating systems and runs on inexpensive hardware available to most users. 
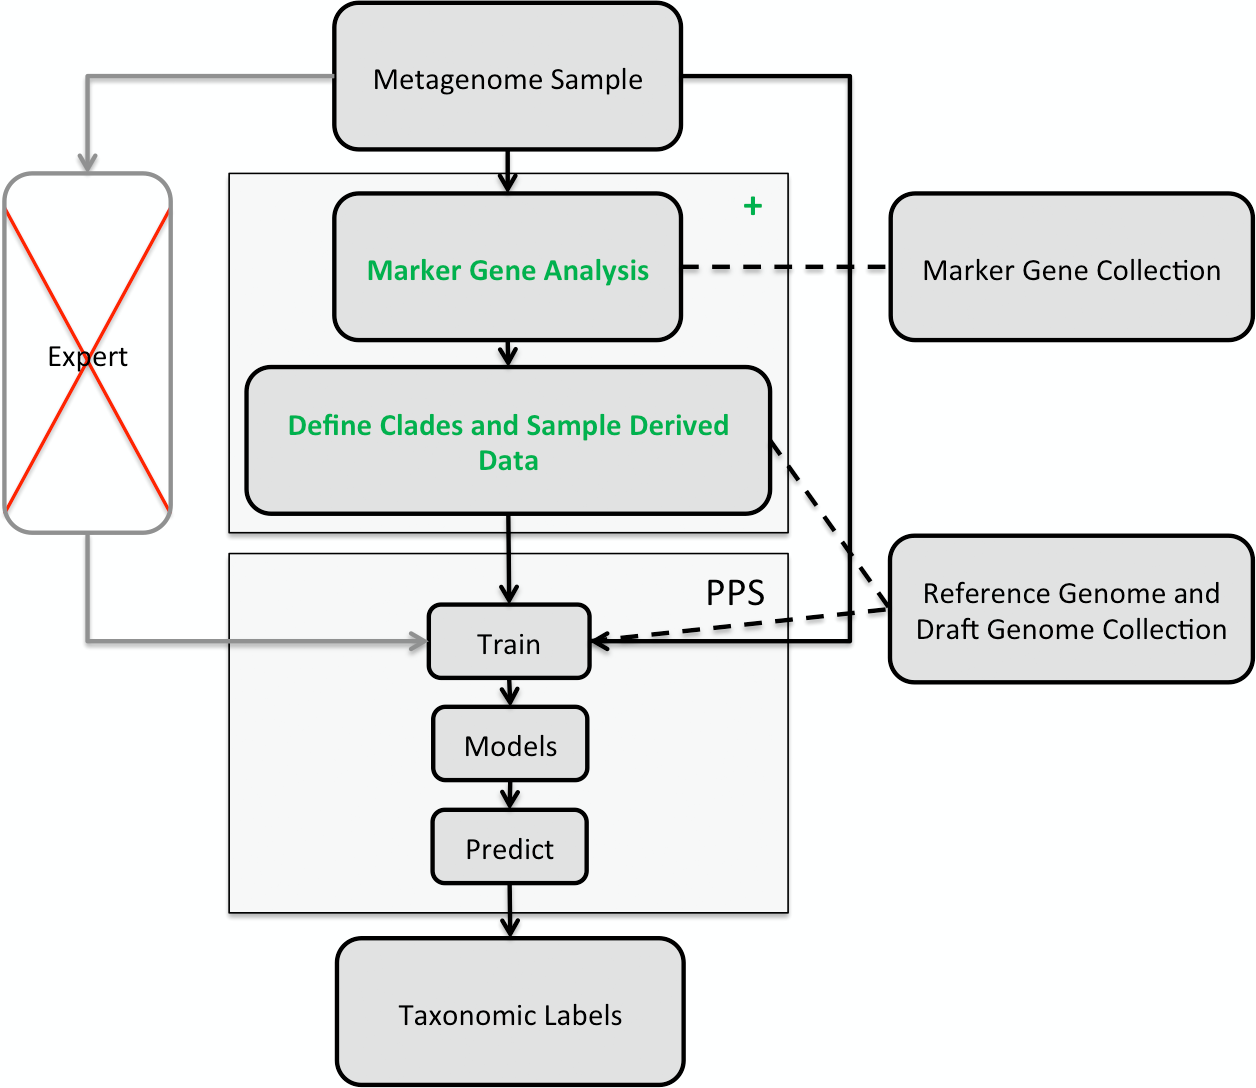
Figure 1: Illustration of the PhyloPythiaS+ workflow.
The recommended use of PPS is that a human expert specifies the taxa to incorporate in a composition-based taxonomic metagenome classifier and identifies the relevant ‘training’ sequences based on marker genes directly from the sample. The inclusion of contigs originating directly from members of the microbial community, as ‘training’ sequences, is very important for achieving good classification accuracy, as many members of microbial communities are underrepresented in public sequence collections. In PPS+, the step of deciding which taxa to include in the model and defining suitable ‘training’ sequences was automated in the + component, based on marker genes, genome and draft genome sequence collections. The data generated by the + component are then used to build the PPS models, that are subsequently used to generate the taxonomic binning of the entire metagenome sequence sample.
Methods
The classification of a shotgun metagenome sequence sample with PPS+ proceeds in two phases (Fig. 1): In the first phase, the newly developed (+) component identifies sample-derived training sequences and the taxa to be modeled by searching for copies of 34 ubiquitous taxonomic marker genes in the metagenome sample. The marker gene analysis results in taxonomic assignments for a small fraction of the sample. Based on the taxa abundance profile derived from these assignments and the sequences available in the reference sequence collections, our method determines which taxa will be modeled and which are the sample-derived data that will be used for training PPS.
The second phase is the composition-based taxonomic assignment of the entire metagenome sample using PPS models trained using the data generated in the first phase. PPS models can be reused to classify further metagenome samples, e.g., additional samples from the same community.
PhyloPythiaS
Assignment with PPS proceeds in two steps: In the training step, an ensemble of structured output Support Vector Machines (SVMs) (Joachims, Finley & Yu, 2009) for the specified part of the NCBI taxonomy, defined by the taxa being modeled, are trained using the sample-derived training sequences and additional data for these taxa from a customized reference collection of sequenced genomes and draft genomes (Suplemental Information 1, Section 3.3). The list of modeled taxa and sample-derived data are generated with the + component of PPS+. The list of taxa restricts the taxonomic output space that is modeled, i.e., a sequence from a metagenome sample will be assigned to a leaf node taxon or a corresponding higher-ranking taxon of the learned taxonomy.
In the prediction step, the PPS model ensemble identifies the taxon which best matches a query sequence in terms of its k-mer profile and assigns to it the respective taxonomic identifier. By default, sequences of 1 kb or more are classified (PPS+ configuration parameter: minSeqLen).
The + component of PhyloPythiaS+
The input for the + component of PhyloPythiaS+ is the metagenome sample. This step returns a list of clades and sample-derived data for the subsequent PPS training. The + component performs the following steps:
-
Marker gene identification: DNA sequences from the sample are translated in all six reading frames (i.e., also considering reverse complement sequences) to protein sequences. In both the translated and untranslated sequences, regions with similarity to the DNA or protein Hidden Markov model (HMM) profiles of 34 taxonomically informative marker genes (Wu & Eisen, 2008; Stark et al., 2009; Liu et al., 2011; Wu & Scott, 2012; Segata et al., 2012; Sunagawa et al., 2013) are identified (Supplemental Information 1, Section 3.3 and 6.1). The corresponding DNA marker gene sequences from these regions are used for further analysis.
-
Taxonomic marker gene assignment: The marker gene sequences are assigned a taxonomic identifier using the composition-based Naïve Bayes classifier (Schloss et al., 2009) (Supplemental Information 1, Section 6.2).
-
Taxonomic sequence assignment: If a sequence contains multiple marker genes, multiple taxonomic identifiers are identified in Step 2. Then the highest bootstrap confidence score (hcs) returned by the Naïve Bayes classifier (NBC) for one of the markers on the fragment is identified. We use all marker gene assignments with confidence scores larger than hcs ∗ (1 − candidatePlTopPercentThreshold). The default setting for the configuration parameter candidatePlTopPercentThreshold is 0.1. From the set of taxonomic identifiers, the lowest taxon t is identified for which all other assignments are either to the same taxon t or defined at higher-ranking parental taxa of t. Taxon t is consequently used for the overall fragment assignment. The confidence score for the fragment is set to the smallest confidence score for the set of retained marker gene assignments.
-
(Optional: Taxonomic scaffold assignment): Scaffolding information (i.e., the mapping of contigs to scaffolds) can be used to obtain more training data for the relevant taxa. Assembled contigs can be grouped into scaffolds based on the paired-end information after the assembly. As all contigs of a particular scaffold originate from the same strain, all contigs of the respective scaffold should have the same taxonomic label. Here, we make use of this scaffolding information, such that unassigned contigs of a particular scaffold can be assigned based on the assigned contigs of the respective scaffold. In the first step, the taxonomic identifiers of all assigned contigs for a scaffold are corrected as follows: Let us consider that n taxonomically assigned contigs of a scaffold are placed along a common path from the root r down to a low-ranking clade lc in the reference taxonomy. The unassigned contigs of a scaffold are not among these n contigs. To obtain a consistent assignment for all the contigs of a scaffold and to correct for ‘outlier’ contig assignments to low ranking taxa, contigs are reassigned according to the following: All n assigned contigs of the respective scaffold are reassigned to the lowest taxon c, which lies on the path from r to lc, where c is chosen such that at least (agThreshold ∗ n) of the contigs are assigned on the path from c to lc. In the second step, unassigned contigs are assigned to the same taxon c, if a sufficient number of contigs have already been assigned. Let us denote the sum of all contig lengths for a scaffold as l and the sum of all assigned contig lengths of the respective scaffold as al. If al/l ≥ assignedPartThreshold, then the unassigned contigs of a scaffold are also assigned to clade c (see the configuration parameters: placeContigsFromTheSameScaffold = True, agThreshold = 0.3, assignedPartThreshold = 0.5).
-
Assignment path truncation: Contigs assigned to a lower-ranking taxon than the specified lowest rank are reassigned to the parental taxon of this lowest rank (configuration parameter: rankIdCut).
-
Taxa selection for model specification: Any taxon for which at least 100 kb of sample-derived data have been identified can be modeled. Furthermore, species can be modeled if at least 300 kb of reference sequences are available in the reference sequence database, and higher-ranking taxa can be modeled if data for at least three distinct species with this requirement (>300 kb per species) are available. Contigs assigned to taxa for which there are fewer data are subsequently assigned to higher taxonomic ranks for which sufficient data are available to allow their use as sample-derived training data (configuration parameters: minGenomesWgs = 3 or 1, minBpPerSpecies = 300,000, minBpToModel = 100,000).
-
Abundant taxa selection: To reduce the number of taxa to the most relevant ones, the least abundant taxon is removed iteratively. This is defined as the taxon to which the minimum number of bp is assigned. Sequences assigned to this taxon are reassigned to the closest defined taxon at a parental rank. The algorithm ends when the number of leaf taxa is less than or equal to the maximum number of taxa to be modeled (configuration parameter: maxLeafClades = 50; this can be set realistically up to 800).
Balancing training data: The part of the taxonomy that will be modeled with PPS is defined by the taxa identified in the previous step. It has leaf nodes at different ranks above the specified rank cut-off, and internal nodes. Only leaf node taxa and sample-derived training data assigned to leaf node taxa in the preceding steps are specified as input for PPS training. To balance the training data across clades, a maximum of 400 kb of sample-derived training data are selected for each leaf node taxon (configuration parameter: maxSSDfileSize). For this selection, contigs are used in order of decreasing confidence values and then in order of decreasing length. The balancing of training data can be switched off by setting the configuration parameter (maxSSDfileSize) to a large number.
Simultaneous counting of multiple short k-mers
We provide PPS+ with a new custom k-mer counting algorithm that is based on the Rabin Karp string matching algorithm (Karp & Rabin, 1987). The algorithm is highly optimized to count occurrences of short DNA sequences. It is very fast, as it is memory efficient, because it does not need any large helper data structure similar to suffix trees. It explores the locality of reference, uses very fast bit shift operations and is efficiently implemented in C. Its complexity is O(n), where n is the length of the DNA sequence that is being considered. It enumerates k-mers up to hundred times faster than when using suffix trees that were employed in PPS. This made PPS+ overall up to 3x faster than PPS. Because the algorithm allows to simultaneously enumerate k-mers of consecutive lengths in one run, it is at least 2–7x faster than the state-of-the-art software Jellyfish (Marcais & Kingsford, 2011) and 11x faster than KAnalyze (Audano & Vannberg, 2014) in the scenario used in PPS+, i.e., when calculating k-mers of length 4, 5, and 6 for every sequence (Table S1, Supplemental Information 1, Section 2). We also found that the state-of-the-art k-mer counting methods KMC 2 (Deorowicz et al., 2015) and Turtle (Roy, Bhattacharya & Schliep, 2014) are not applicable to our problem setting, as KMC 2 can count only k-mers ≥ 10 and Turtle is prohibitively slow for sequences ≥ 16 kb.
Algorithm description
Let us assume that we are given an array a, which represents a DNA sequence of length n where all letters are encoded as numbers 0, 1, 2, 3 (where A ∼0, T ∼1, G ∼2, C∼3) and let a0, …, an−1 denote the respective entries. We would like to count the occurrences of all k-mers of length k and store the counts in an array c of length 4k, which is initialized by zeros. Each k-mer maps to a unique index in the array c. The index of the first k-mer in our sequence is calculated according to: The index of the (i + 1)th k-mer of the sequence is computed from the (i)th index as: When an index is identified, the corresponding k-mer count at this index position in array c is incremented by one. For instance, the DNA sequence ATGCATG is encoded in array a as [0, 1, 2, 3, 0, 1, 2]. For k = 2, we would add two counts for the k-mer AT in array c at the index position 0∗4 + 1 = 1, two counts for TG at the index position 1∗4 + 2 = 6, one count for GC at the index position 2∗4 + 3 = 11 and one count for CA at index position 3∗4 + 0 = 12. The multiplication operation X∗4m can be computed using the bit shift operation X ≪ 2∗m, which is usually much faster than multiplication.
Counting k-mers of different lengths at once
If indexi is the index of the ith k-mer of length k, the index of the ith (k − j)-mer (of length k − j) can be simultaneously computed using the bit shift operation as indexi ≫ (2∗j) (for j ∈ [1..k − 1]) and the corresponding counter at the computed index of a respective counter array of length 4(k−j) is incremented. The end of a DNA sequence can be handled by adding several non-DNA characters to its end.
Results
We evaluated PPS+ by comparing it to homology-based methods (MEGAN4, taxator-tk) (Huson et al., 2011; Dröge, Gregor & McHardy, 2014), the fast taxonomic binning program Kraken (Wood & Salzberg, 2014), the composition-based method PhyloPythia trained under expert guidance (a recommended but time-consuming procedure) and to a generic PPS model using default settings (Supplemental Information 1, Section 3.5–3.8). For a performance comparison of PPS to methods with prohibitive runtimes for large datasets, such as PhymmBL (Brady & Salzberg, 2011) and CARMA3 (Gerlach & Stoye, 2011), and the web-based tool NBC (Rosen, Reichenberger & Rosenfeld, 2011) see Patil et al. (2011); Patil, Roune & McHardy (2011); Dröge, Gregor & McHardy (2014), as PPS has already been compared to these methods with favorable outcomes. For a comparison with ‘taxonomy-free’ binning software CLARK (Ounit et al., 2015) see (Supplemental Information 1, Section 7). We did not compare PPS+ to profiling tools such as (Liu et al., 2011), as PPS+ is a binning method that assigns a taxonomic label to each input sequence. As benchmark datasets, we created two simulated datasets, one with a uniform (137 Mb) and one with a log-normal (66 Mb) distribution of 47 community members (Supplemental Information 1, Section 3.1, Datasets S1 and S2). We also used two real datasets, a metagenome sample from the guts of two obese human twins (255 Mb) (Turnbaugh et al., 2010) and a cow rumen metagenome sample (319 Mb) from Hess et al. (2011) (Supplemental Information 1, Section 3.2, Datasets S3–S6) for evaluation.
Benchmarks with simulated datasets
We constructed the simulated datasets by assembling simulated reads with an empirical error profile. The details on how the simulated reads were generated and assembled can be found in (Supplemental Information 1, Section 3.1). For the evaluation, precision and recall were calculated (Supplemental Information 1, Section 3.9). Furthermore, these measures were also calculated with a ‘correction,’ to account for the case where the sequences of one taxon were consistently assigned to a different taxon, as for draft genome reconstruction, it is more important that the sequences are assigned consistently than that the taxonomic identifier is correct. To assess the performance of the different methods in assigning the simulated sequence fragments without related reference genomes being available, ‘new strain,’ ‘new species’ and ‘new genus’ scenarios were simulated by removing all sequence data from the taxa of the simulated test dataset at each rank from the reference data. Furthermore, for PPS+, we distinguished whether the reference data were excluded (masked) from the reference sequence (RS) collection or also from the marker gene (MG) collection, since the MG collection included sequences for 15 times more distinct species than the RS collection. There were therefore two different situations to consider (Table 1).

Figure 2: Performance comparisons with simulated datasets.
(A) and (C) show the fraction of correct, incorrect and unassigned bp for simulated datasets with uniform and log-normally distributed species abundance for PhyloPythiaS+, the generic PhyloPythiaS model, MEGAN4, Kraken and taxator-tk for assignments at the species, genus and family ranks. Results were averaged over all test ‘scenarios’ (Table 1), where sequences of the same strain, species or genus from the simulated metagenomes were removed from the genome, draft genome and marker gene reference sequence collections (Figs. S1, S3, S14A and S14C). (B) and (D) show the portion of consistently (correct), inconsistently (incorrect) and unbinned (unassigned) bp without consideration of the taxonomic identifiers (Figs. S2, S4, S14B and S14D, Supplemental Information 1, Section 3.9.2). The exact values and the corresponding precision, recall and f1-score are contained in (Tables S2–S5) for (A–D), respectively.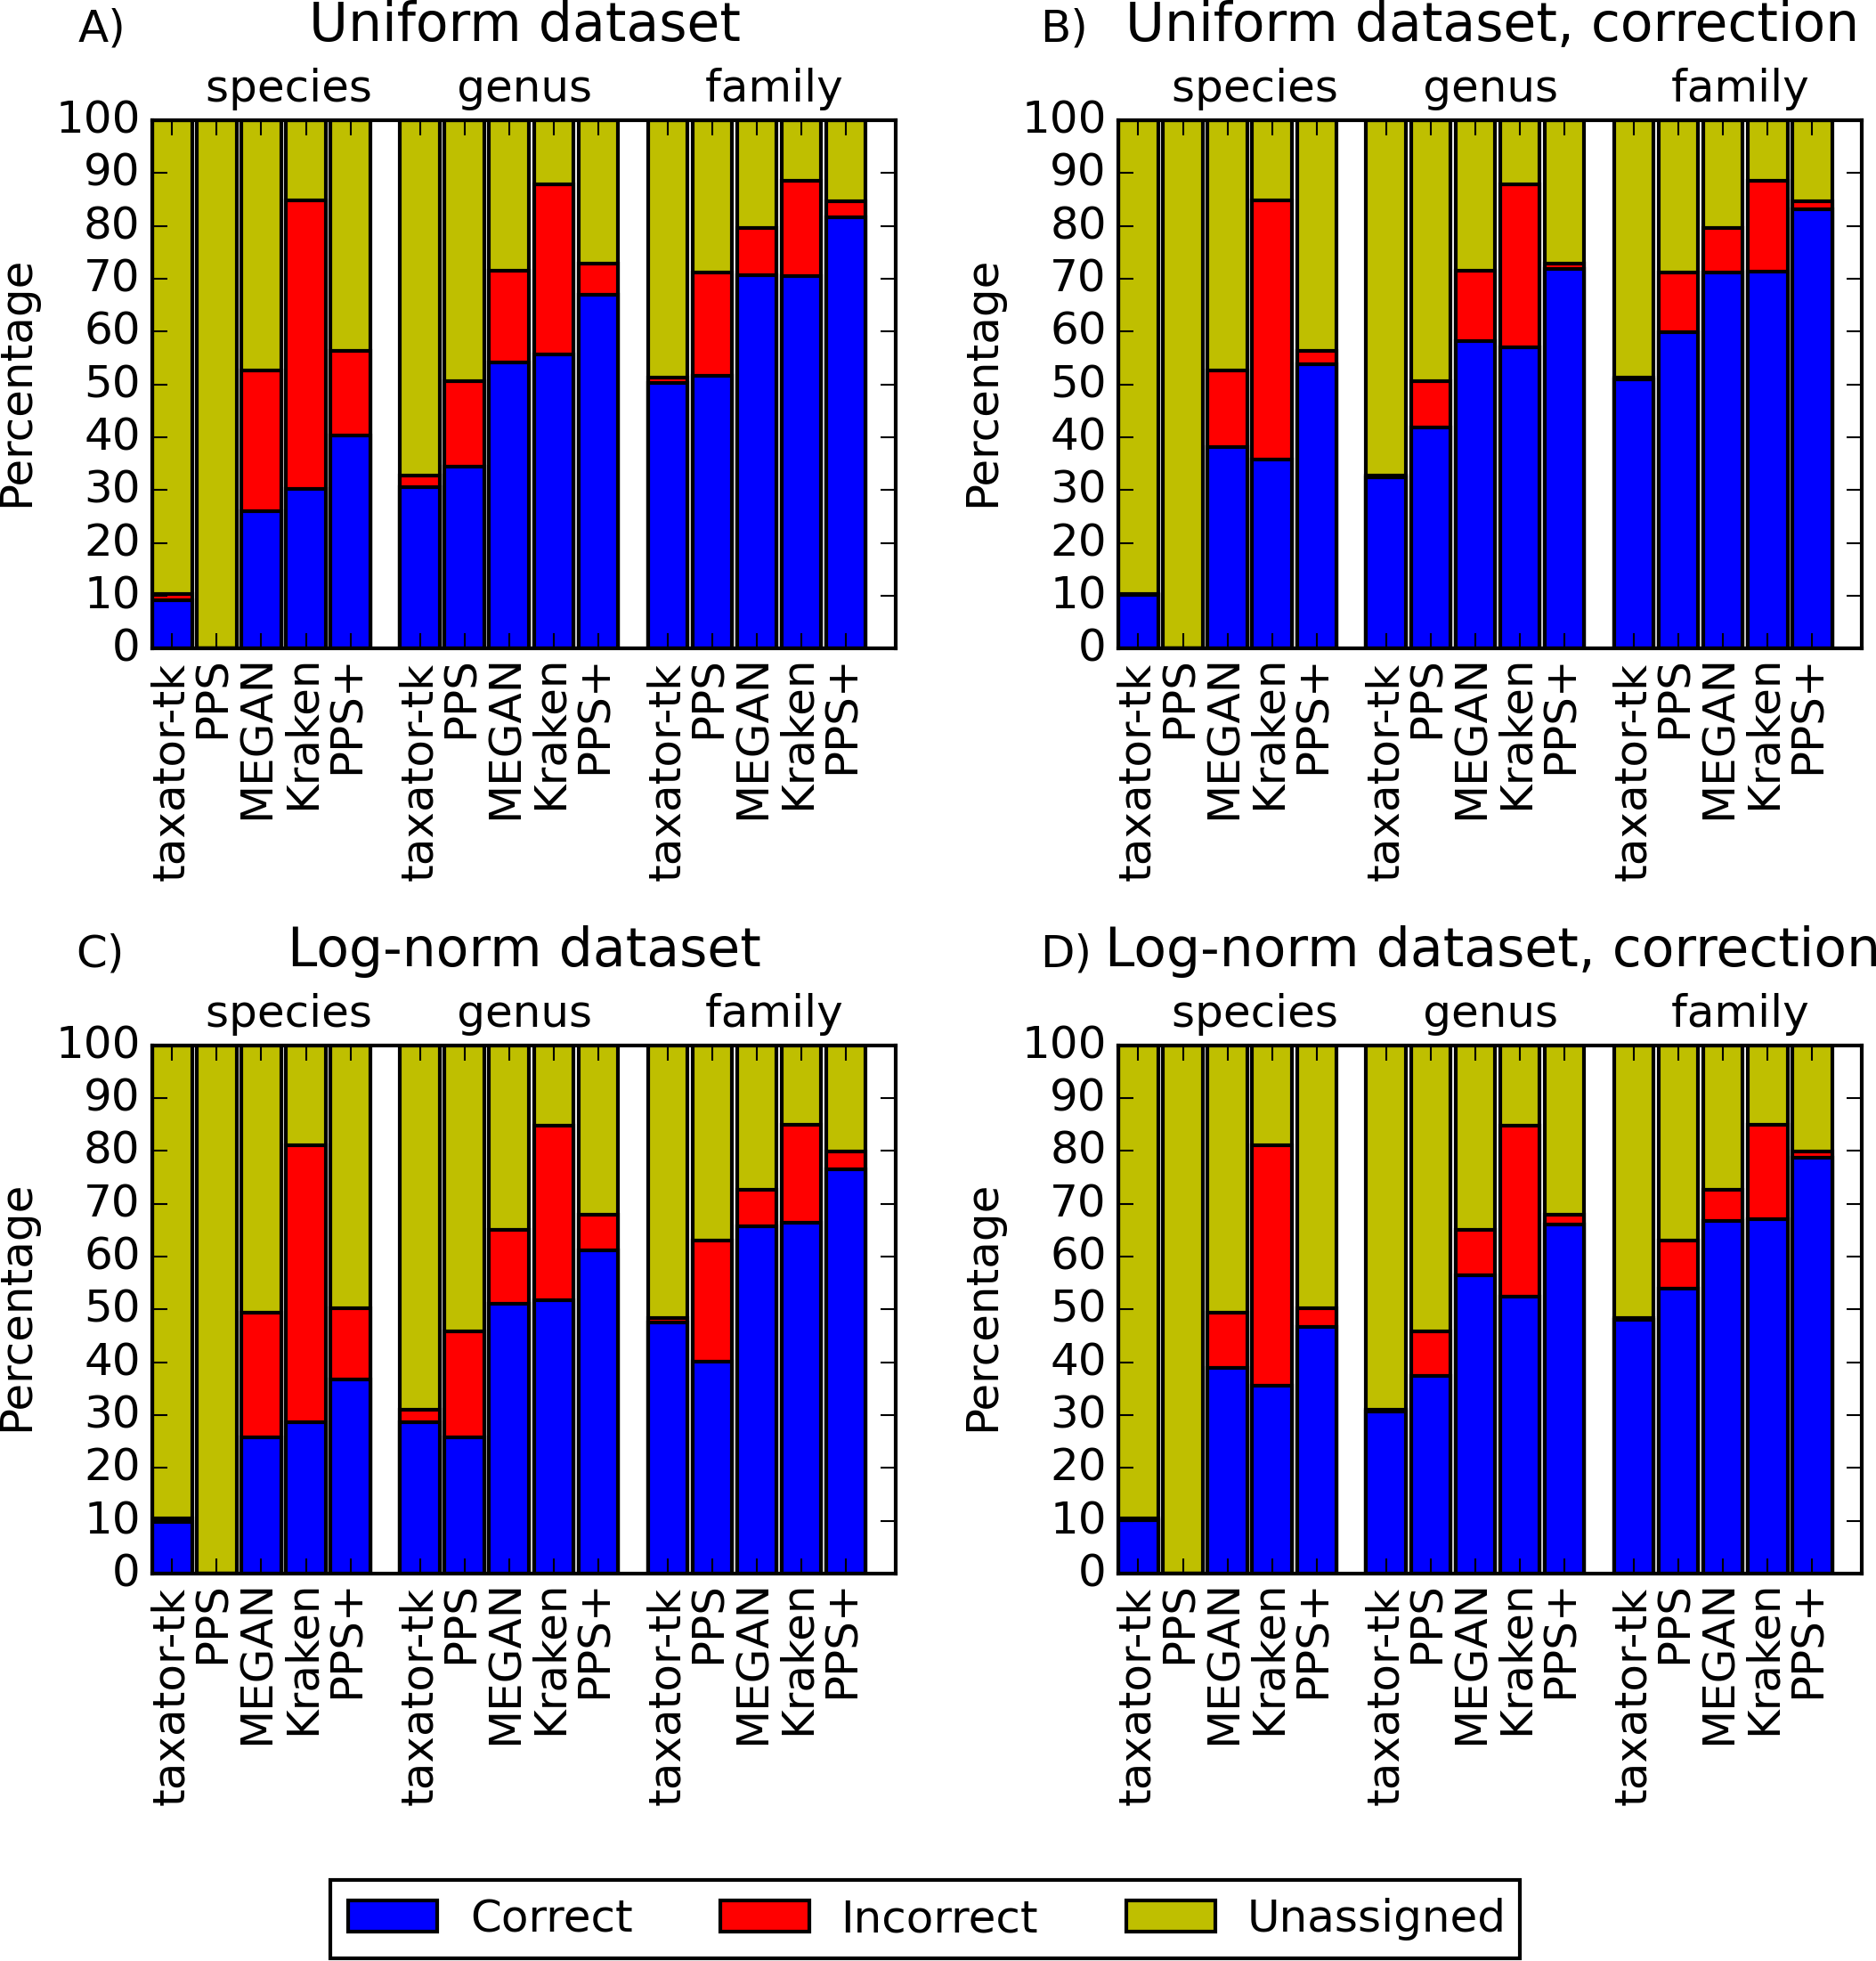
| Test scenario | Rank masked from RS | Rank masked from MG |
|---|---|---|
| 1. | None | None |
| 2. | Strain | None |
| 3. | Species | None |
| 4. | Genus | None |
| 5. | Strain | Strain |
| 6. | Species | Strain |
| 7. | Genus | Strain |
| 8. | Species | Species |
| 9. | Genus | Genus |
PPS+ showed a substantially improved precision and recall over the PPS generic model, which demonstrated the impact of the improved selection of training data and modeled taxa (Figs. 2A and 2C, S1A–S1D and S3A–S3D). PPS+ almost always had higher precision and recall than MEGAN4 and Kraken, except when almost all test data were included in the reference sequences (Figs. 2A and 2C, S1A–S1C, S1E, S3A–S3C, S3E, S14A). This was even more pronounced when comparing bin quality using the corrected measures (Figs. 2B and 2D, S2A–S2C, S2E, S4A–S4C, S4E, S14A and S14D). When comparing PPS+ to taxator-tk, PPS+ had substantially improved recall, particularly for lower ranks (Figs. 2A and 2C, S1A–S1C, S1F, S3A–S3C, S3F); while taxator-tk outperformed all other methods in terms of precision (Figs. 2A and 2C, S1A–S1F and S3A–S3F). Both methods were similarly precise when analyzing bin recovery, independent of assigning the taxonomic identifiers to the corrected measures (Figs. 2B and 2D, S2A–S2C, S2F, S4A–S4C and S4F). As a strong point of PPS+ , we also observed that it more rarely predicted wrong taxa that were not a part of the sample than the other methods (Fig. S5). For example, for the genus rank in Scenarios 3 and 8, PPS+ assigned sequences to only 2–5 false positive taxa, while taxator-tk identified 20, MEGAN4 37 and PPS 59 false ones. If PPS+ identified wrong taxa, these were usually very closely related to the true taxa.
Benchmarks with real datasets
Comparison of scaffold and contig assignments
For each taxonomic rank, the percentage and the total number of kb (% agreement and kb agreement) that were assigned the same taxonomic identifier were calculated for the real datasets, based on the assignments of scaffold and contig sequences (Supplemental Information 1, Section 3.10.1). For the chunked cow rumen dataset (Supplemental Information 1, Section 3.2.2), taxator-tk had the highest assignment consistency (Table 2); however, it assigned much fewer data than the other methods at lower taxonomic ranks. A detailed comparison is given in heat maps (Figs. S6–S13). PPS+ performed substantially better by both measures than the generic PPS model in almost all cases. PPS+ was also more consistent than MEGAN4 for all lower ranks and assigned many more sequences than MEGAN4 overall. For instance, at the genus rank, the scores were 84.3 and 56 ‘% agreement’, as well as 33,724 and 13,726 ‘kb agreement’ for PPS+ and MEGAN4, respectively. The overall low numbers for Kraken suggests that it is rather not applicable to samples containing novel taxa. Also, the low number of consistently assigned bp by MEGAN4 and taxator-tk to lower taxonomic ranks reflects the availability of few related reference genome sequences for the cow rumen metagenome sample, which is not an issue for a composition-based method PPS+.
| Method | Rank | % agreement | kb agreement |
|---|---|---|---|
| PPS+ | Phylum | 73.9 | 153,774 |
| PPS | Phylum | 67.8 | 75,538 |
| MEGAN4 | Phylum | 74.2 | 43,380 |
| taxator-tk | Phylum | 98.2 | 59,702 |
| Kraken | Phylum | 67.0 | 33,558 |
| PPS+ | Class | 86.0 | 99,596 |
| PPS | Class | 58.5 | 43,931 |
| MEGAN4 | Class | 68.5 | 33,780 |
| taxator-tk | Class | 97.7 | 23,190 |
| Kraken | Class | 58.5 | 27,536 |
| PPS+ | Order | 88.4 | 98,616 |
| PPS | Order | 63.8 | 41,349 |
| MEGAN4 | Order | 68.9 | 32,650 |
| taxator-tk | Order | 98.0 | 22,368 |
| Kraken | Order | 57.0 | 26,410 |
| PPS+ | Family | 80.0 | 46,343 |
| PPS | Family | 55.8 | 19,158 |
| MEGAN4 | Family | 55.0 | 15,790 |
| taxator-tk | Family | 98.9 | 7,276 |
| Kraken | Family | 45.2 | 18,370 |
| PPS+ | Genus | 84.3 | 33,724 |
| PPS | Genus | 63.2 | 12,938 |
| MEGAN4 | Genus | 56.0 | 13,726 |
| taxator-tk | Genus | 99.1 | 6,042 |
| Kraken | Genus | 43.7 | 16,912 |
| PPS+ | Species | 91.6 | 9,821 |
| PPS | Species | N/A | N/A |
| MEGAN4 | Species | 54.6 | 8,502 |
| taxator-tk | Species | 100.0 | 292 |
| Kraken | Species | 38.1 | 14,186 |
For the human gut microbiome, extensive sequencing of isolate cultures has resulted in a large collection of several hundred reference genome sequences. Accordingly, for the human gut dataset, taxator-tk, MEGAN4 and Kraken assigned many more sequences than they did for the cow rumen dataset (Tables 2 and 3). For Kraken and MEGAN4, this was most pronounced for the genus and species ranks, even though this was also caused by counting scaffolds containing only one contig being consistent to itself. The most consistent method was again taxator-tk, but it also assigned fewer sequences than the other methods. PPS+ performed better than the generic PPS model in all cases in terms of both measures (Table 3). PPS+ and MEGAN4 showed comparable consistency, with PPS+ being more consistent for the class, order and species ranks, and MEGAN4 being more consistent for the superkingdom, family and genus ranks. However, PPS+ consistently assigned (kb agreement) more sequences than MEGAN4, except for the genus and species ranks. Thus, in the case of larger collections of related isolate genome sequences being available, composition- and homology-based methods perform similarly well.
| Method | Rank | % agreement | kb agreement |
|---|---|---|---|
| PPS+ | Phylum | 99.0 | 140,283 |
| PPS | Phylum | 97.0 | 124,884 |
| MEGAN4 | Phylum | 99.0 | 127,658 |
| taxator-tk | Phylum | 100.0 | 104,475 |
| Kraken | Phylum | 97.6 | 123,428 |
| PPS+ | Class | 99.5 | 134,707 |
| PPS | Class | 96.9 | 118,068 |
| MEGAN4 | Class | 98.5 | 122,131 |
| taxator-tk | Class | 100.0 | 84,228 |
| Kraken | Class | 96.3 | 121,071 |
| PPS+ | Order | 99.5 | 134,127 |
| PPS | Order | 97.3 | 117,185 |
| MEGAN4 | Order | 98.6 | 121,811 |
| taxator-tk | Order | 100.0 | 83,337 |
| Kraken | Order | 96.3 | 121,003 |
| PPS+ | Family | 94.0 | 110,664 |
| PPS | Family | 92.6 | 97,066 |
| MEGAN4 | Family | 96.2 | 98,582 |
| taxator-tk | Family | 99.8 | 43,751 |
| Kraken | Family | 89.4 | 109,151 |
| PPS+ | Genus | 95.3 | 82,992 |
| PPS | Genus | 91.9 | 58,883 |
| MEGAN4 | Genus | 96.1 | 86,495 |
| taxator-tk | Genus | 99.9 | 34,667 |
| Kraken | Genus | 88.3 | 97,097 |
| PPS+ | Species | 94.7 | 43,329 |
| PPS | Species | N/A | N/A |
| MEGAN4 | Species | 93.5 | 64,554 |
| taxator-tk | Species | 99.7 | 10,314 |
| Kraken | Species | 81.3 | 94,591 |
The taxonomic scaffold-contig consistency of the assignments was additionally evaluated (Table S6 and Table S7) using a set of measures (Supplemental Information 1, Section 3.10.2) that provide more detailed insights into assignment consistency (Supplemental Information 1, Section 5.1) and support the conclusions in this section.
Comparison to an expert binning based on marker genes
A taxonomic binning generated by PhyloPythia (PP) with expert guidance for sample-derived model construction (Turnbaugh et al., 2010) was compared to the PPS+ assignments. Scaffolds that were unassigned by either method were not considered. The PP expert binning and the PPS+ binning agreed well, down to the order rank (Table 4). For the family and genus ranks, the overlap of both methods dropped to 69.5–74.1%, which may partly be due to changes in the NCBI taxonomy since the generation of the expert binning in 2009. Both PPS+ and PP assignments were highly consistent with the MG assignments made by the + component of PPS+ alone, though only a small number of scaffolds with marker genes could be compared (7–23% for different ranks). While PPS+ had a larger overlap (‘% agreement’) with the MG assignments at the genus rank, PP had a larger overlap (‘% agreement’) with the MG assignments at the family rank. Moreover, we compared the number of taxonomic assignments for individual methods (Fig. 3): PPS+ assigned sequences to low-ranking taxa down to the species level, in agreement with the MG assignments, while PP often assigned the respective sequences only to the parental taxa. This demonstrates that PPS+ can generate a high quality taxonomic binning in a fully automated manner.
| Comparison | Rank | % agreement | kb agreement |
|---|---|---|---|
| PP vs PPS+ | Superkingdom | 99.6 | 160,617 |
| MG vs PP | Superkingdom | 99.7 | 38,314 |
| MG vs PPS+ | Superkingdom | 99.5 | 38,220 |
| PP vs PPS+ | Phylum | 95.4 | 149,213 |
| MG vs PP | Phylum | 96.9 | 17,771 |
| MG vs PPS+ | Phylum | 98.7 | 18,065 |
| PP vs PPS+ | Class | 97.0 | 145,887 |
| MG vs PP | Class | 98.1 | 17,599 |
| MG vs PPS+ | Class | 100.0 | 17,869 |
| PP vs PPS+ | Order | 98.0 | 145,373 |
| MG vs PP | Order | 98.3 | 17,494 |
| MG vs PPS+ | Order | 100.0 | 17,764 |
| PP vs PPS+ | Family | 69.5 | 95,779 |
| MG vs PP | Family | 90.7 | 13,047 |
| MG vs PPS+ | Family | 83.7 | 12,013 |
| PP vs PPS+ | Genus | 74.1 | 78,686 |
| MG vs PP | Genus | 91.6 | 12,235 |
| MG vs PPS+ | Genus | 94.9 | 11,479 |
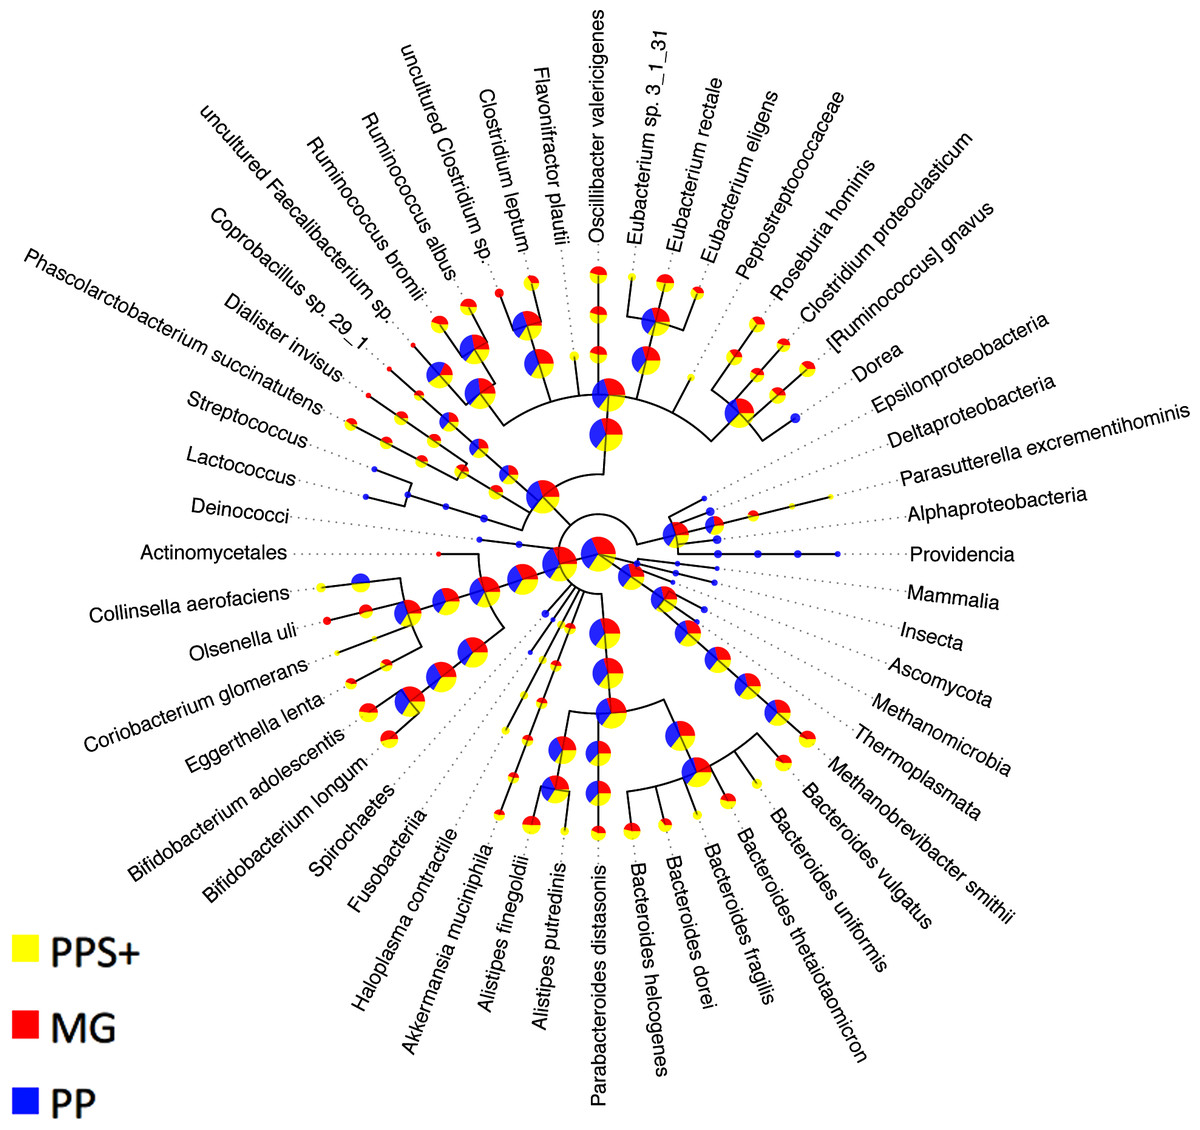
Figure 3: Comparison to expert binning based on marker genes.
The amount of assigned bp by PhyloPythia (PP), PhyloPythiaS+ (PPS+) and taxonomically informative marker genes directly (MG) to each taxon are indicated by the pie chart sizes on a log-scale for the human gut metagenome sample (Turnbaugh et al., 2010; Patil, Roune & McHardy, 2011). PhyloPythiaS+ automatically determined the taxa to model from the sample. For the expert-trained PhyloPythia, the taxa to model were specified by an expert, and were included in the model if they were covered by sufficient reference sequence data retrieved separately from the sample and from sequenced human gut isolates. PhyloPythiaS+ assigned sequences to low-ranking taxa down to the species level, in agreement with the marker gene assignments, while PhyloPythia often assigned these sequences to the parental taxa. For the MG assignments, a negligible amount—only two contigs (3.6 kb) of two scaffolds (231 kb)—were used as sample-derived training data for PPS+; as mainly sample contigs (2.5 Mb) that were not part of scaffolds were used as sample-derived data to train PPS.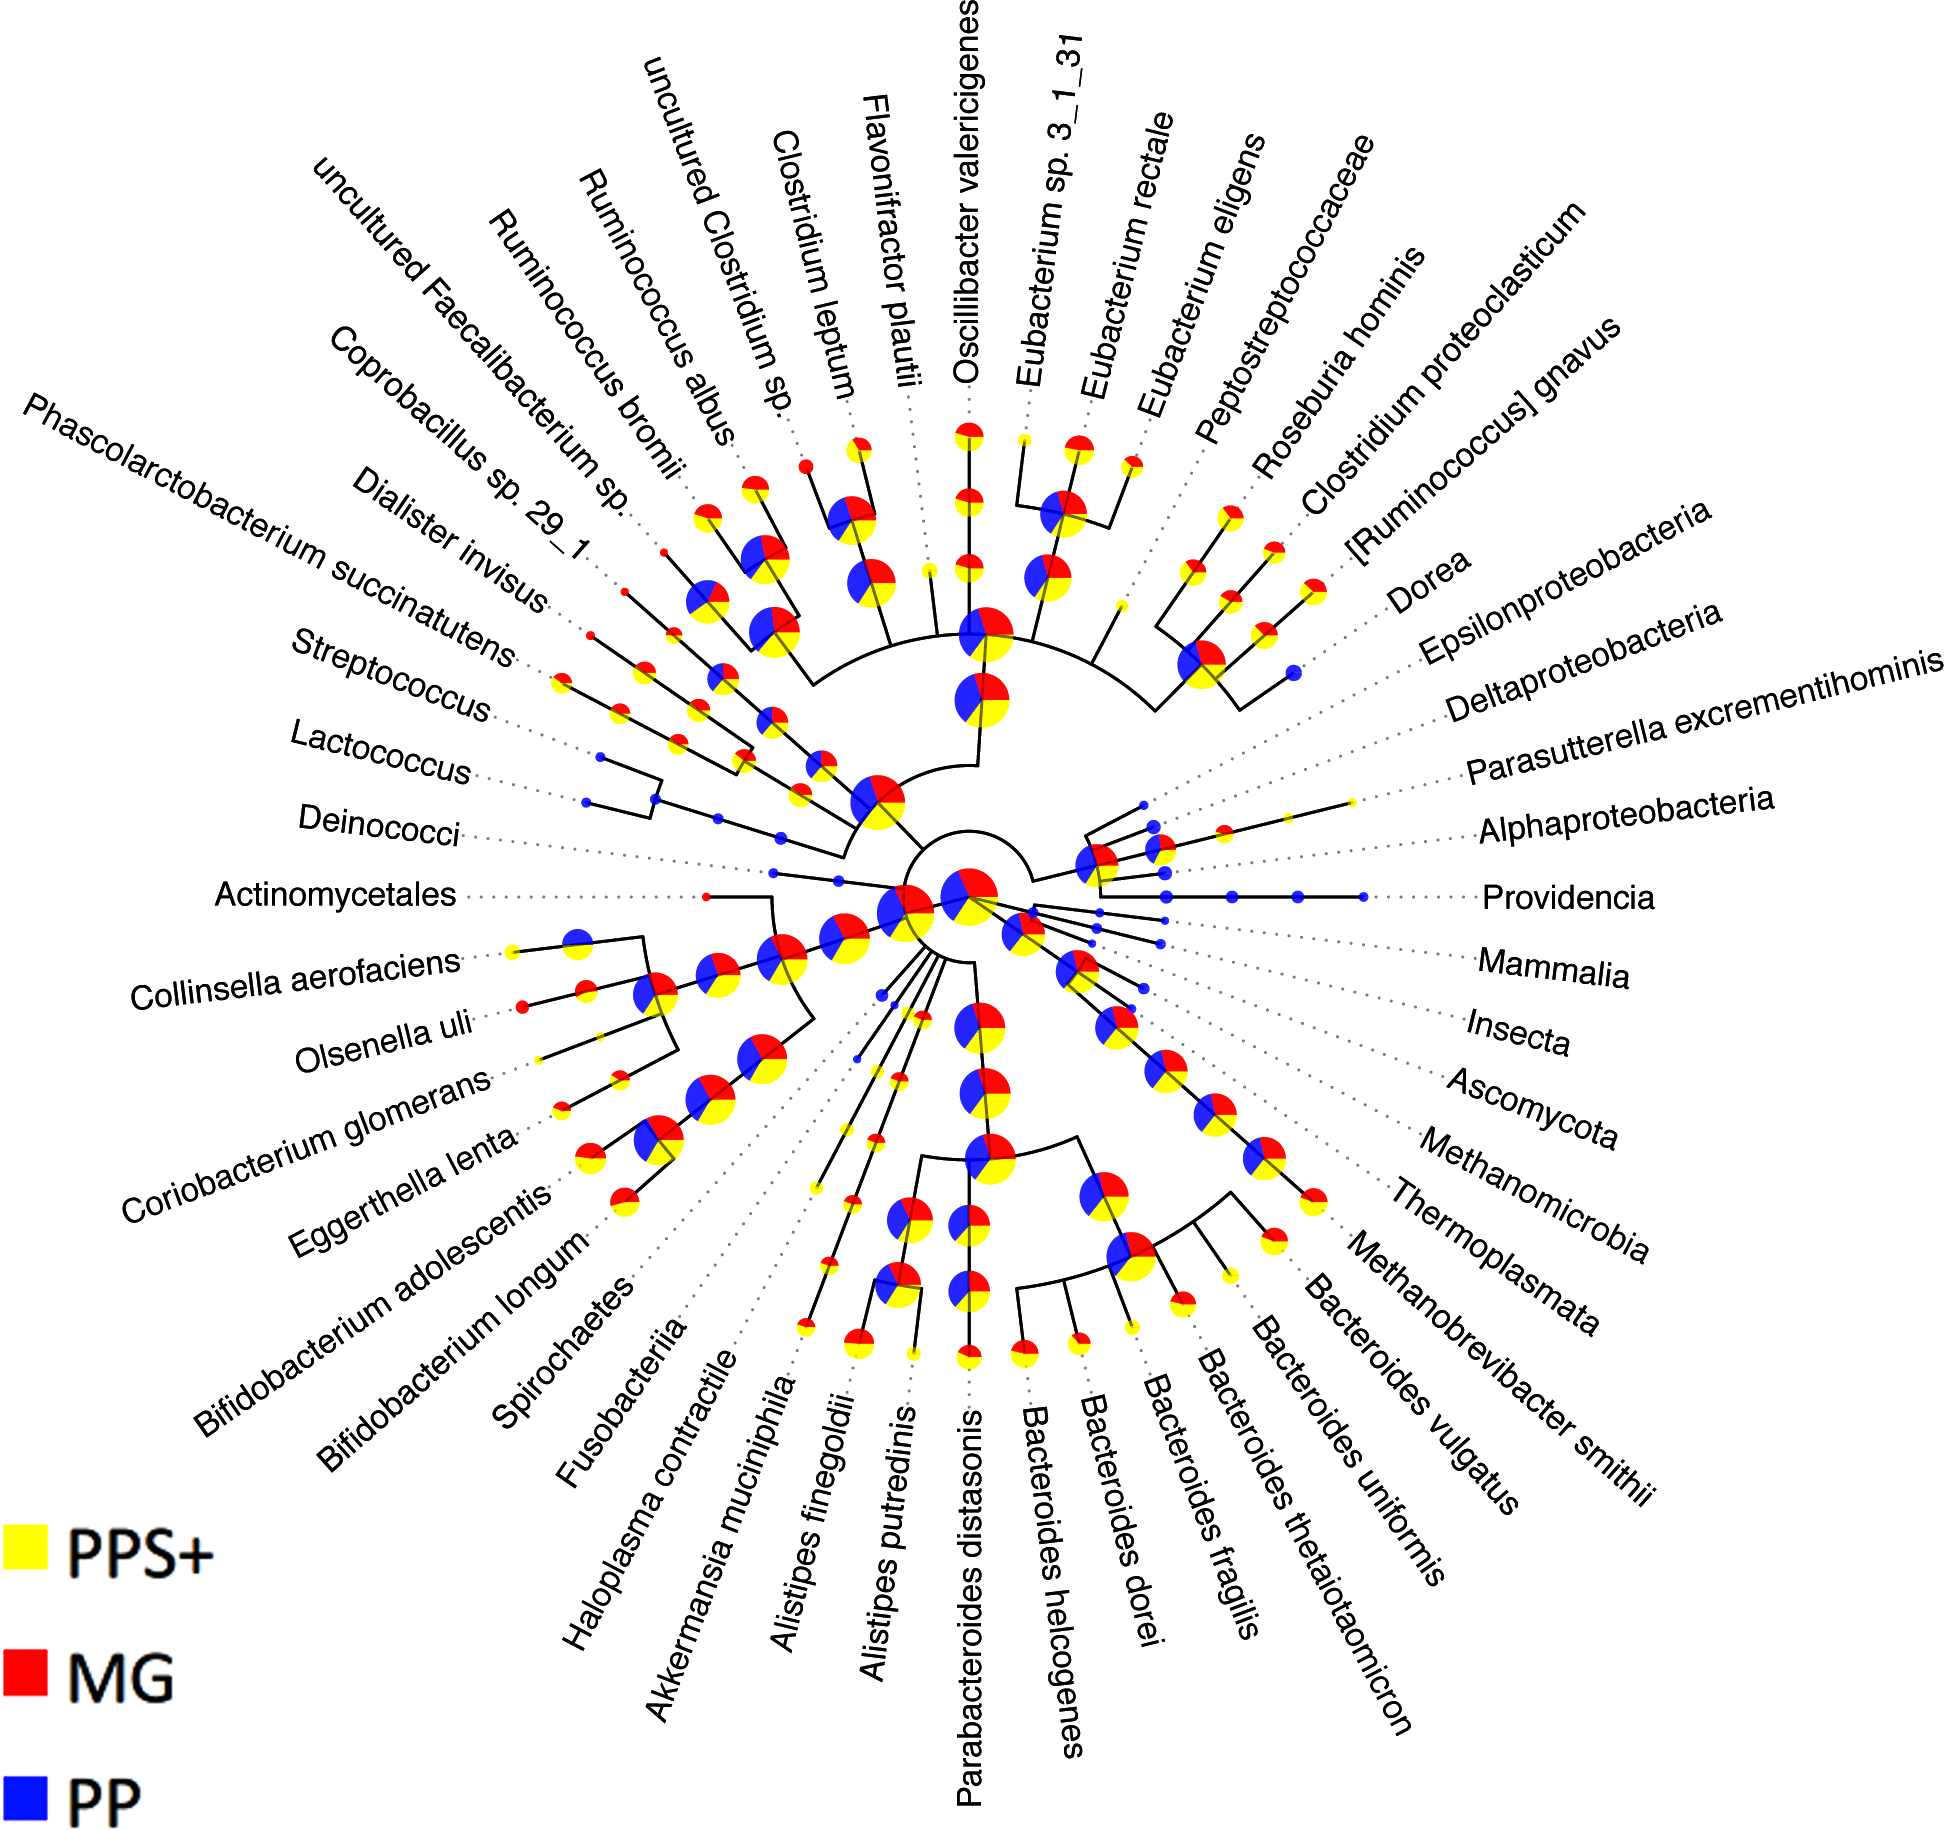
Throughput comparison
The throughput of the individual methods for contig assignments of the human gut sample was calculated (Supplemental Information 1, Section 3.3, 3.4 and 5.3). The throughput of Kraken substantially varied between 38.4 Mb/h and 4.2 Gb/h in our experiments, depending on whether its large (∼200 GB) reference database was already loaded in the main memory or not, therefore Kraken is the fastest method in high performance environments. When only the prediction step of PPS+ was considered, PPS+ assigned up to 0.5 Gb/h and was more than 7 times faster than the homology-based methods (Fig. 4). This is relevant when PPS models are reused for the classification of another sample. Moreover, unlike the homology-based tools and Kraken, PPS+ can be run on a standard laptop, as it requires much less main memory (see Supplemental Information 1, Section 3.4 for the hardware configurations used).
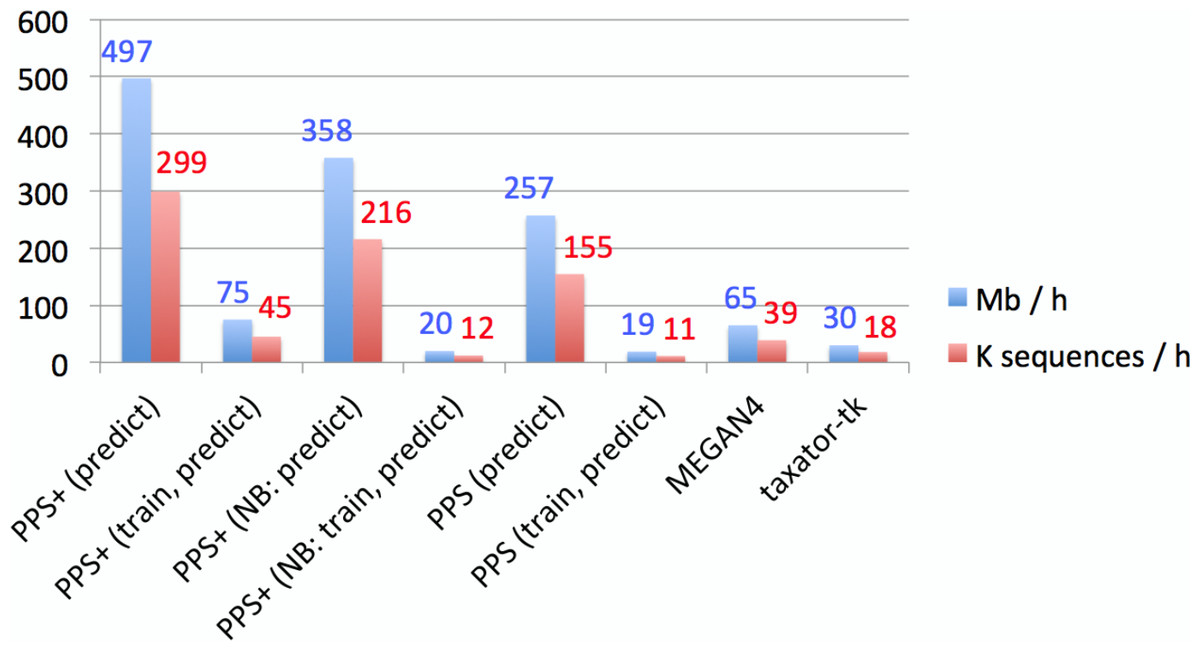
Figure 4: Empirical comparison of execution times.
The throughput was measured in Mb and the number of sequences classified within 1 h with one execution thread, using all assembled contigs of the human gut metagenome dataset on a server computer with an AMD Opteron 6386 SE 2.8 GHz processor and 512 GB of RAM. Default settings were used for all methods (Supplemental Information 1, Section 3.5–3.7). Both MEGAN4 and taxator-tk were run using BLAST. For MEGAN4, only the runtime of BLAST was considered, as the runtime of the subsequent algorithm was negligible. For PhyloPythiaS and PhyloPythiaS+, the throughput was calculated for the prediction step and both steps (training and prediction). The former is relevant when using previously generated models for the classification of multiple samples. The execution time shown for PhyloPythiaS is approximately three times better than that for the original release, as we incorporated the new k-mer counting algorithm. PhyloPythiaS+ was the only method that could also be executed on a standard laptop (NB) with an Intel i5 M520 2.4 GHz processor, 4 GB of RAM and 150 GB disk space.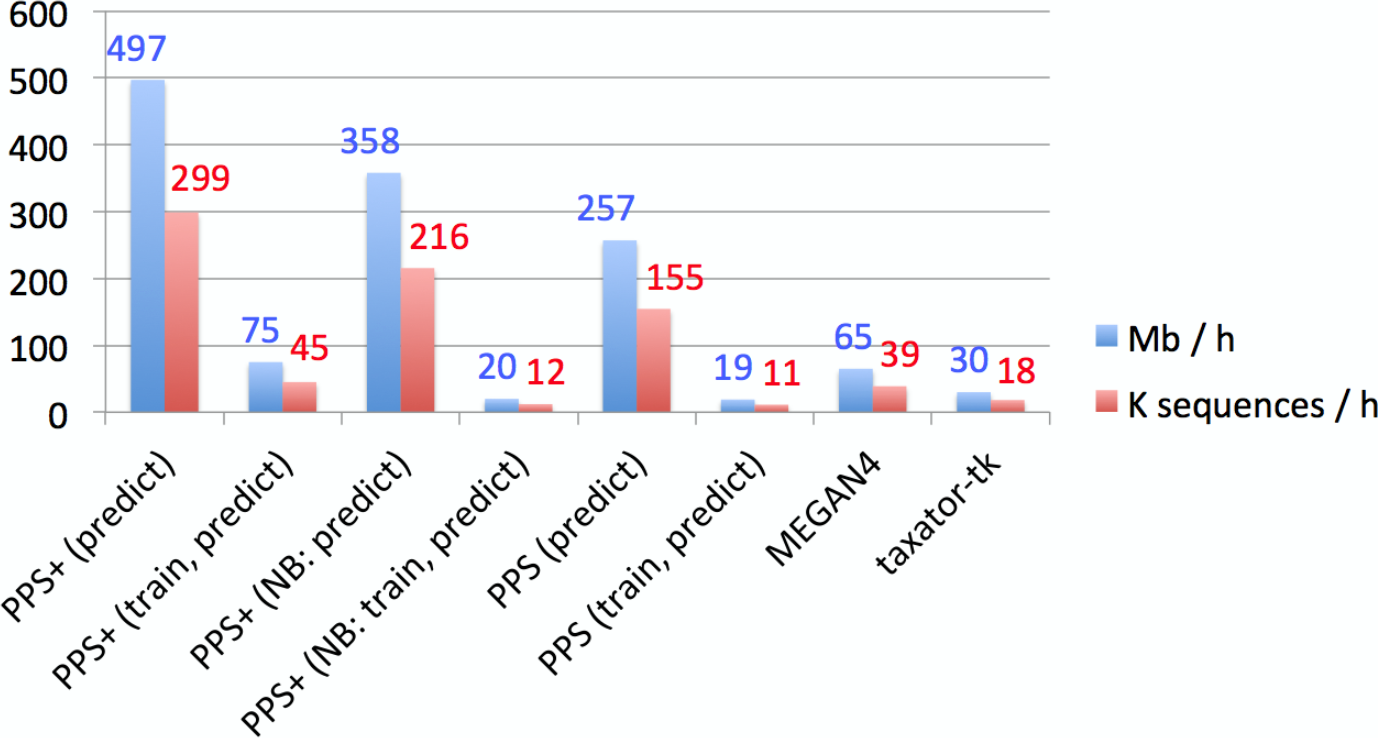
Conclusions
We describe a taxonomic assignment program that produces accurate assignments with a precision of 80% or more also for low-ranking taxa from metagenome samples. PPS+ is a fully automated successor of the PhyloPythiaS software. It automatically determines the most relevant taxa to be modeled and suitable training sequences directly from the input sample, which are then used to generate a sample-specific structured output SVM taxonomic classifier for the taxonomic binning of a sample. This enables its use for researchers without experience in the field or time to search for suitable training sequences for the manual construction of well-matching taxonomic classifier to a particular metagenome sequence sample.
PPS+ is best suited for the analysis of large NGS metagenome samples with assembled contigs (> 1kb) carrying marker genes or datasets including the high quality longer PacBio (Chin et al., 2013) consensus reads. Contrary to some recent methods for the taxonomic profiling or binning of multiple similar samples (Sunagawa et al., 2013), PPS+ can be also applied to individual samples. PPS+ requires only 100 kb of sample-derived data to model a bin, while homology-based methods require large related reference genome or draft genome sequence collections for substantial assignments to low-ranking taxa. Our experiments on both real and simulated metagenome samples showed that PPS+ automatically reconstructed many low-ranking bins from metagenome samples, such as for genera and species, representing draft genomes or pan-genomes of different community members.
The novel implementation of the k-mer counting algorithm accelerated k-mer counting 100-fold in comparison to the original PPS software and made PPS+ overall up to three times faster. The method performed favorably in comparison to all state-of-the-art k-mer counting software for the simultaneous enumeration of 4–6-mers, commonly used for composition-based binning.
PPS models can be reused when classifying multiple samples from the same or similar environments. When comparing assignment with PPS+ to MEGAN4 and taxator-tk, PPS+ showed a competitive processing time, allowing to process up to 0.5 Gb of sequences per hour with a given PPS model on a single core with much lower main memory requirements, while MEGAN4 processed 0.065 Gb and taxator-tk 0.03 Gb (Fig. 4). The fastest method in the comparison was Kraken with up to 4.2 Gb/h; however, we have found that Kraken should be used only for well-studied environments, for which many closely related (draft) genomes have been sequenced, as an alternative to alignment-based methods, as its use for samples originating from novel environments is very limited (Fig. 2).
In terms of assignment quality, we found that PPS+ often outperformed MEGAN4 and Kraken in terms of precision, recall and consistency. Taxator-tk performed best in terms of precision and consistency, but assigned substantially fewer sequences to low taxonomic ranks. PPS+ also excelled in determining the taxa that were part of the simulated metagenome community. We found that the fully automated PPS+ binning can be as good as an expert-guided binning with the original PhyloPythia implementation. PPS+ also showed a substantially improved assignment performance compared to the generic PPS model.
To conclude, the newly introduced self-training (+) component and the faster k-mer counting algorithm implemented in PPS+ allow users to generate high quality taxonomic binnings of metagenome samples in a high-throughput fashion, without requiring expensive hardware, manual intervention and expert knowledge. It should be helpful to a wide range of users. An initial version of the software has been already employed for the taxonomic binning of a metagenome sample from reindeer guts by Pope et al. (2011a) and it is currently used in several other projects: for instance, a PPS+ binning of shotgun metagenome samples indicated the likely metabolite flow and participating microbial phylotypes for a biogas-producing microbial community tolerant of high ammonia levels (Supplemental Information 2).
PPS+ is distributed with a large reference sequence collection (containing Bacterial and Archaeal data) in a virtual machine, which makes it easy to install. This allows metagenome sample analysis on a standard laptop under Windows, Unix or OS X systems.
Supplemental Information
Supplemental Text S2
Personal communication from Dr PB Pope.
Benchmark results for the simulated dataset with uniform distribution
Precision (P) and recall (R) (Supplemental Information 1, Section 3.9.1) at different taxonomic ranks were calculated for (A–C) PPS+, (D) the generic PPS model, (E) MEGAN4 and (F) taxator-tk in all test scenarios (Table 1: Test Scenarios 1–9). In parentheses, (mg) and (rs) denote whether the sequences at a given taxonomic rank were masked from the marker gene or from the reference sequence collections, respectively (Supplemental Information 1, Sections 3.1 and 3.3). If not stated, sequences were masked from both reference collections.
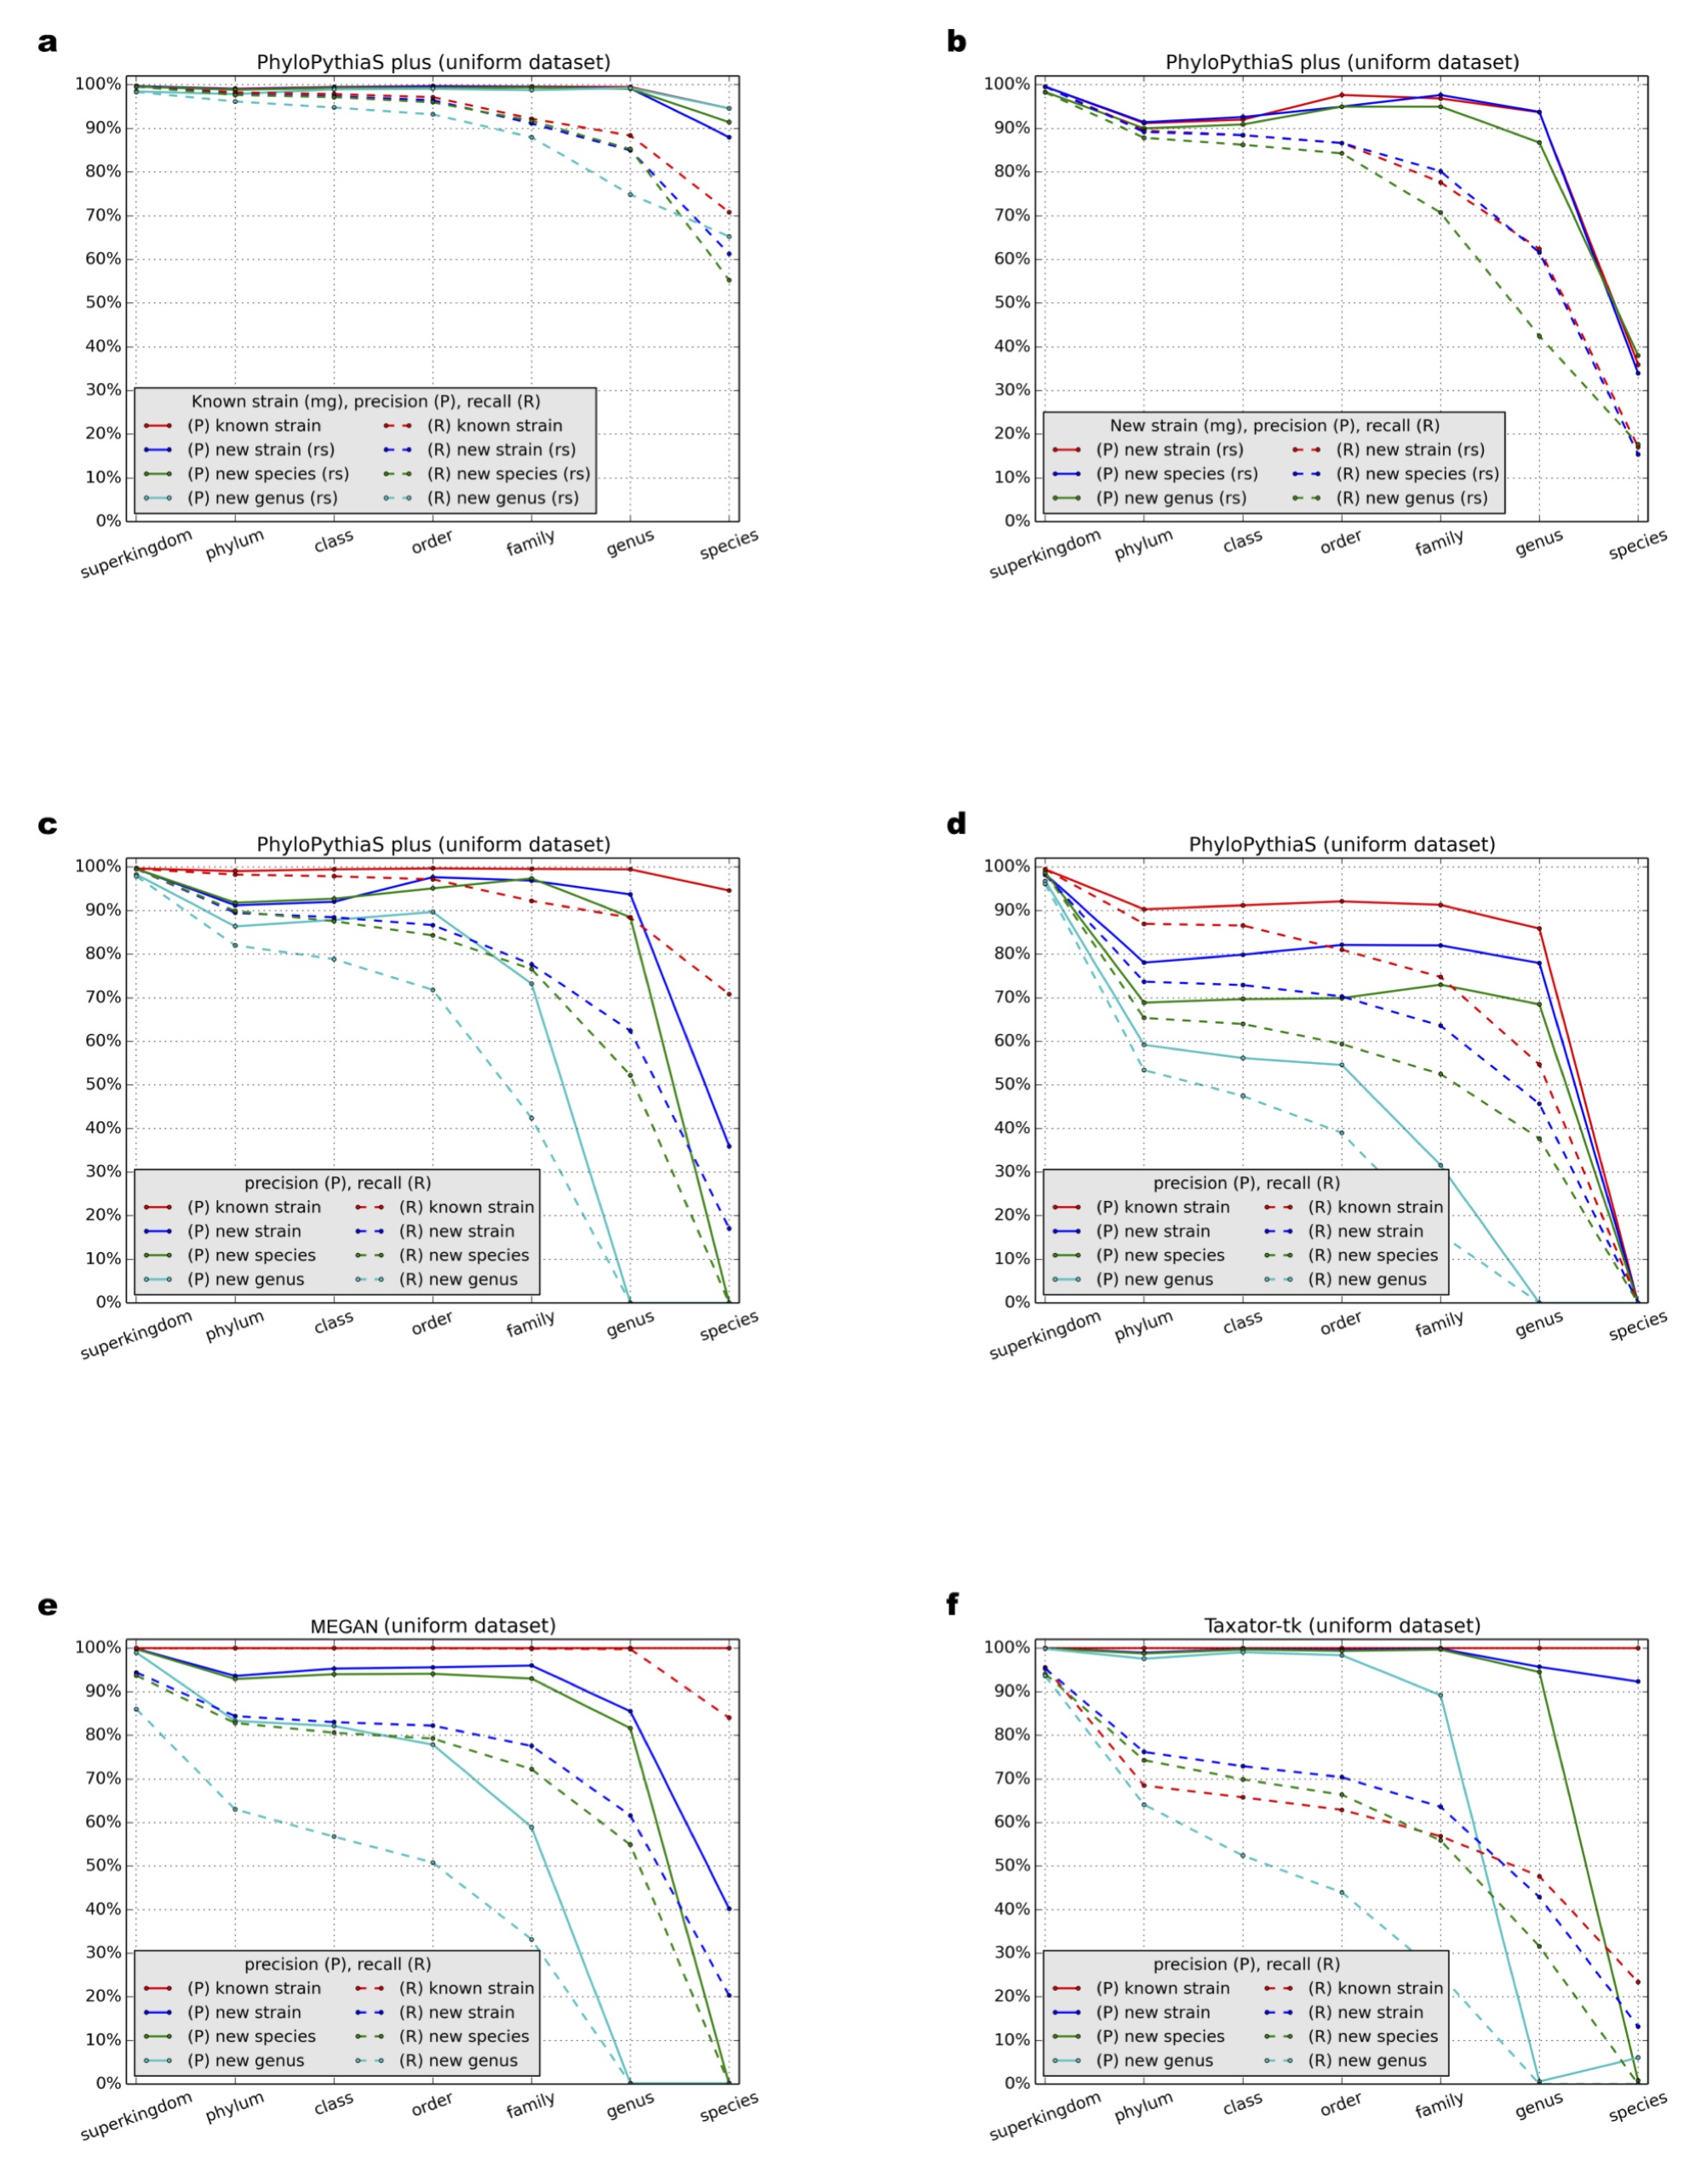
Benchmark results for the simulated dataset with uniform distribution using ‘correction’
Precision (P) and recall (R) were calculated with a ‘correction’ (Supplemental Information 1, Section 3.9) at different taxonomic ranks for (A–C) PPS+, (D) the generic PPS model, (E) MEGAN4 and (F) taxator-tk in all test scenarios (Table 1: Test Scenarios 1–9, Supplemental Information 1, Section 3.1).
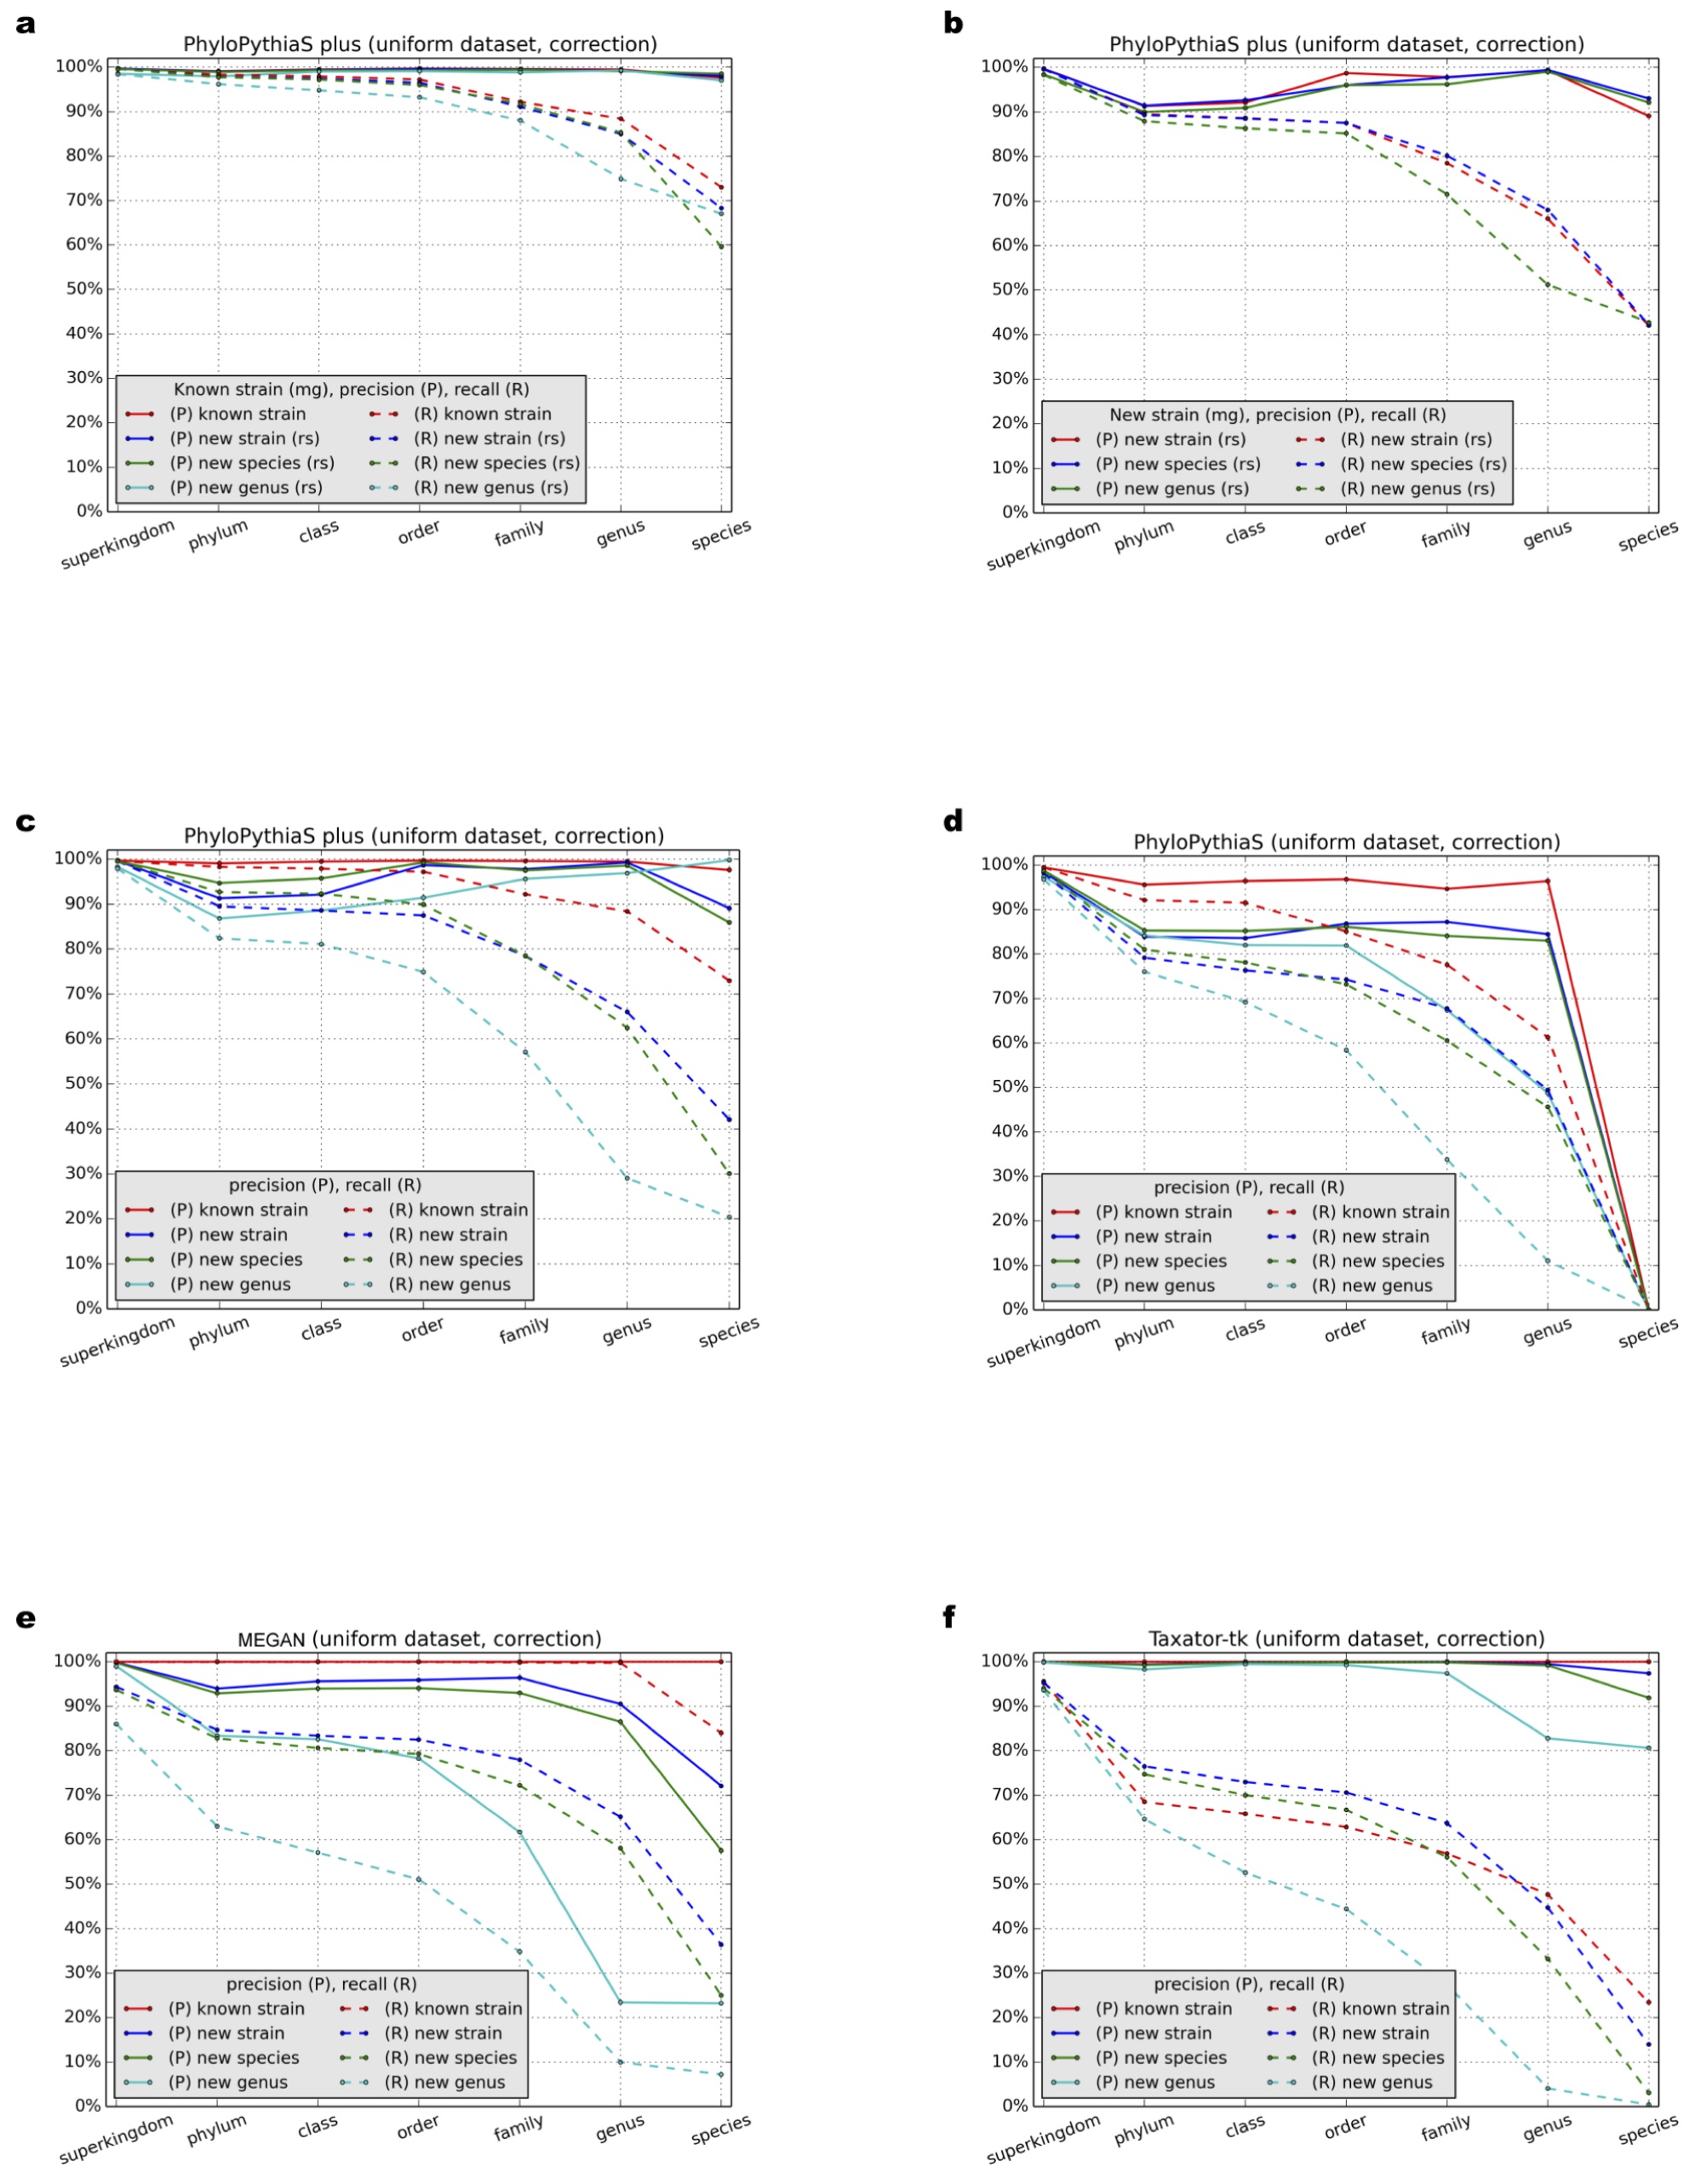
Benchmark results for the simulated dataset with the log-normal distribution
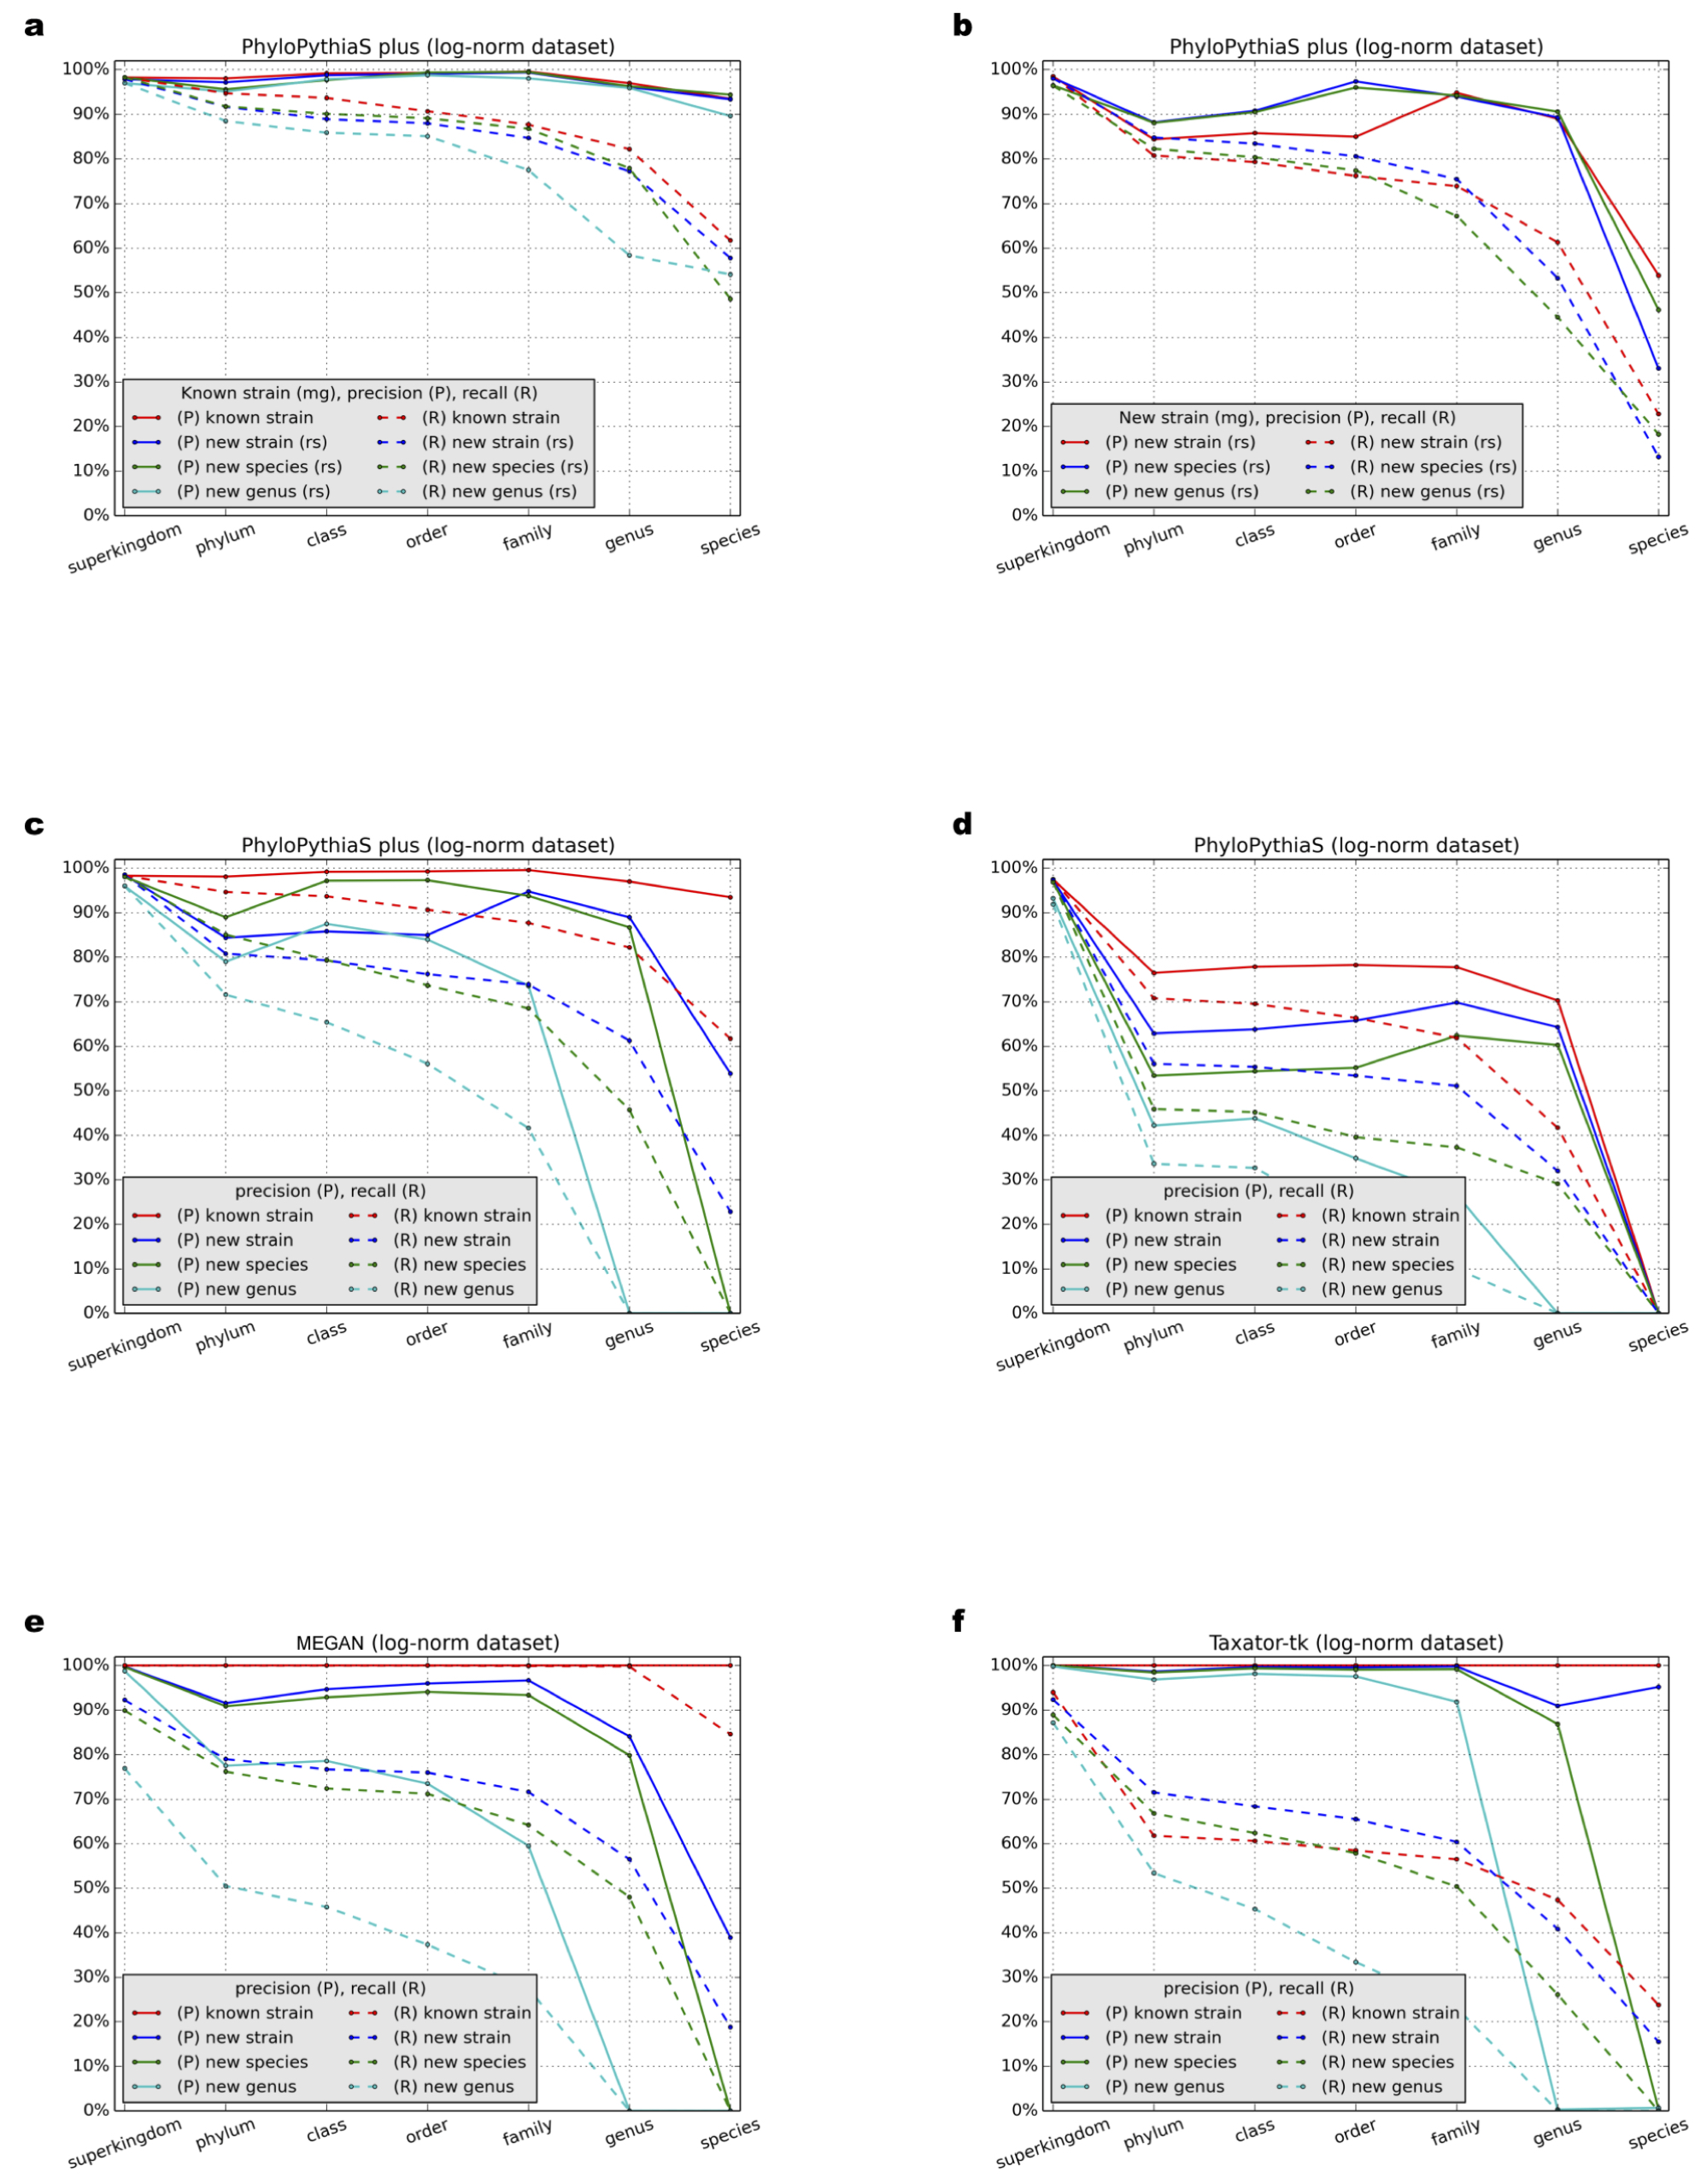
Precision (P) and recall (R) (Section 3.9.1) at different taxonomic ranks were calculated for (A–C) PPS+, (D) the generic PPS model, (E) MEGAN4 and (F) taxator-tk in all test scenarios (Table 1: Test Scenarios 1–9, Supplemental Information 1, Section 3.1).
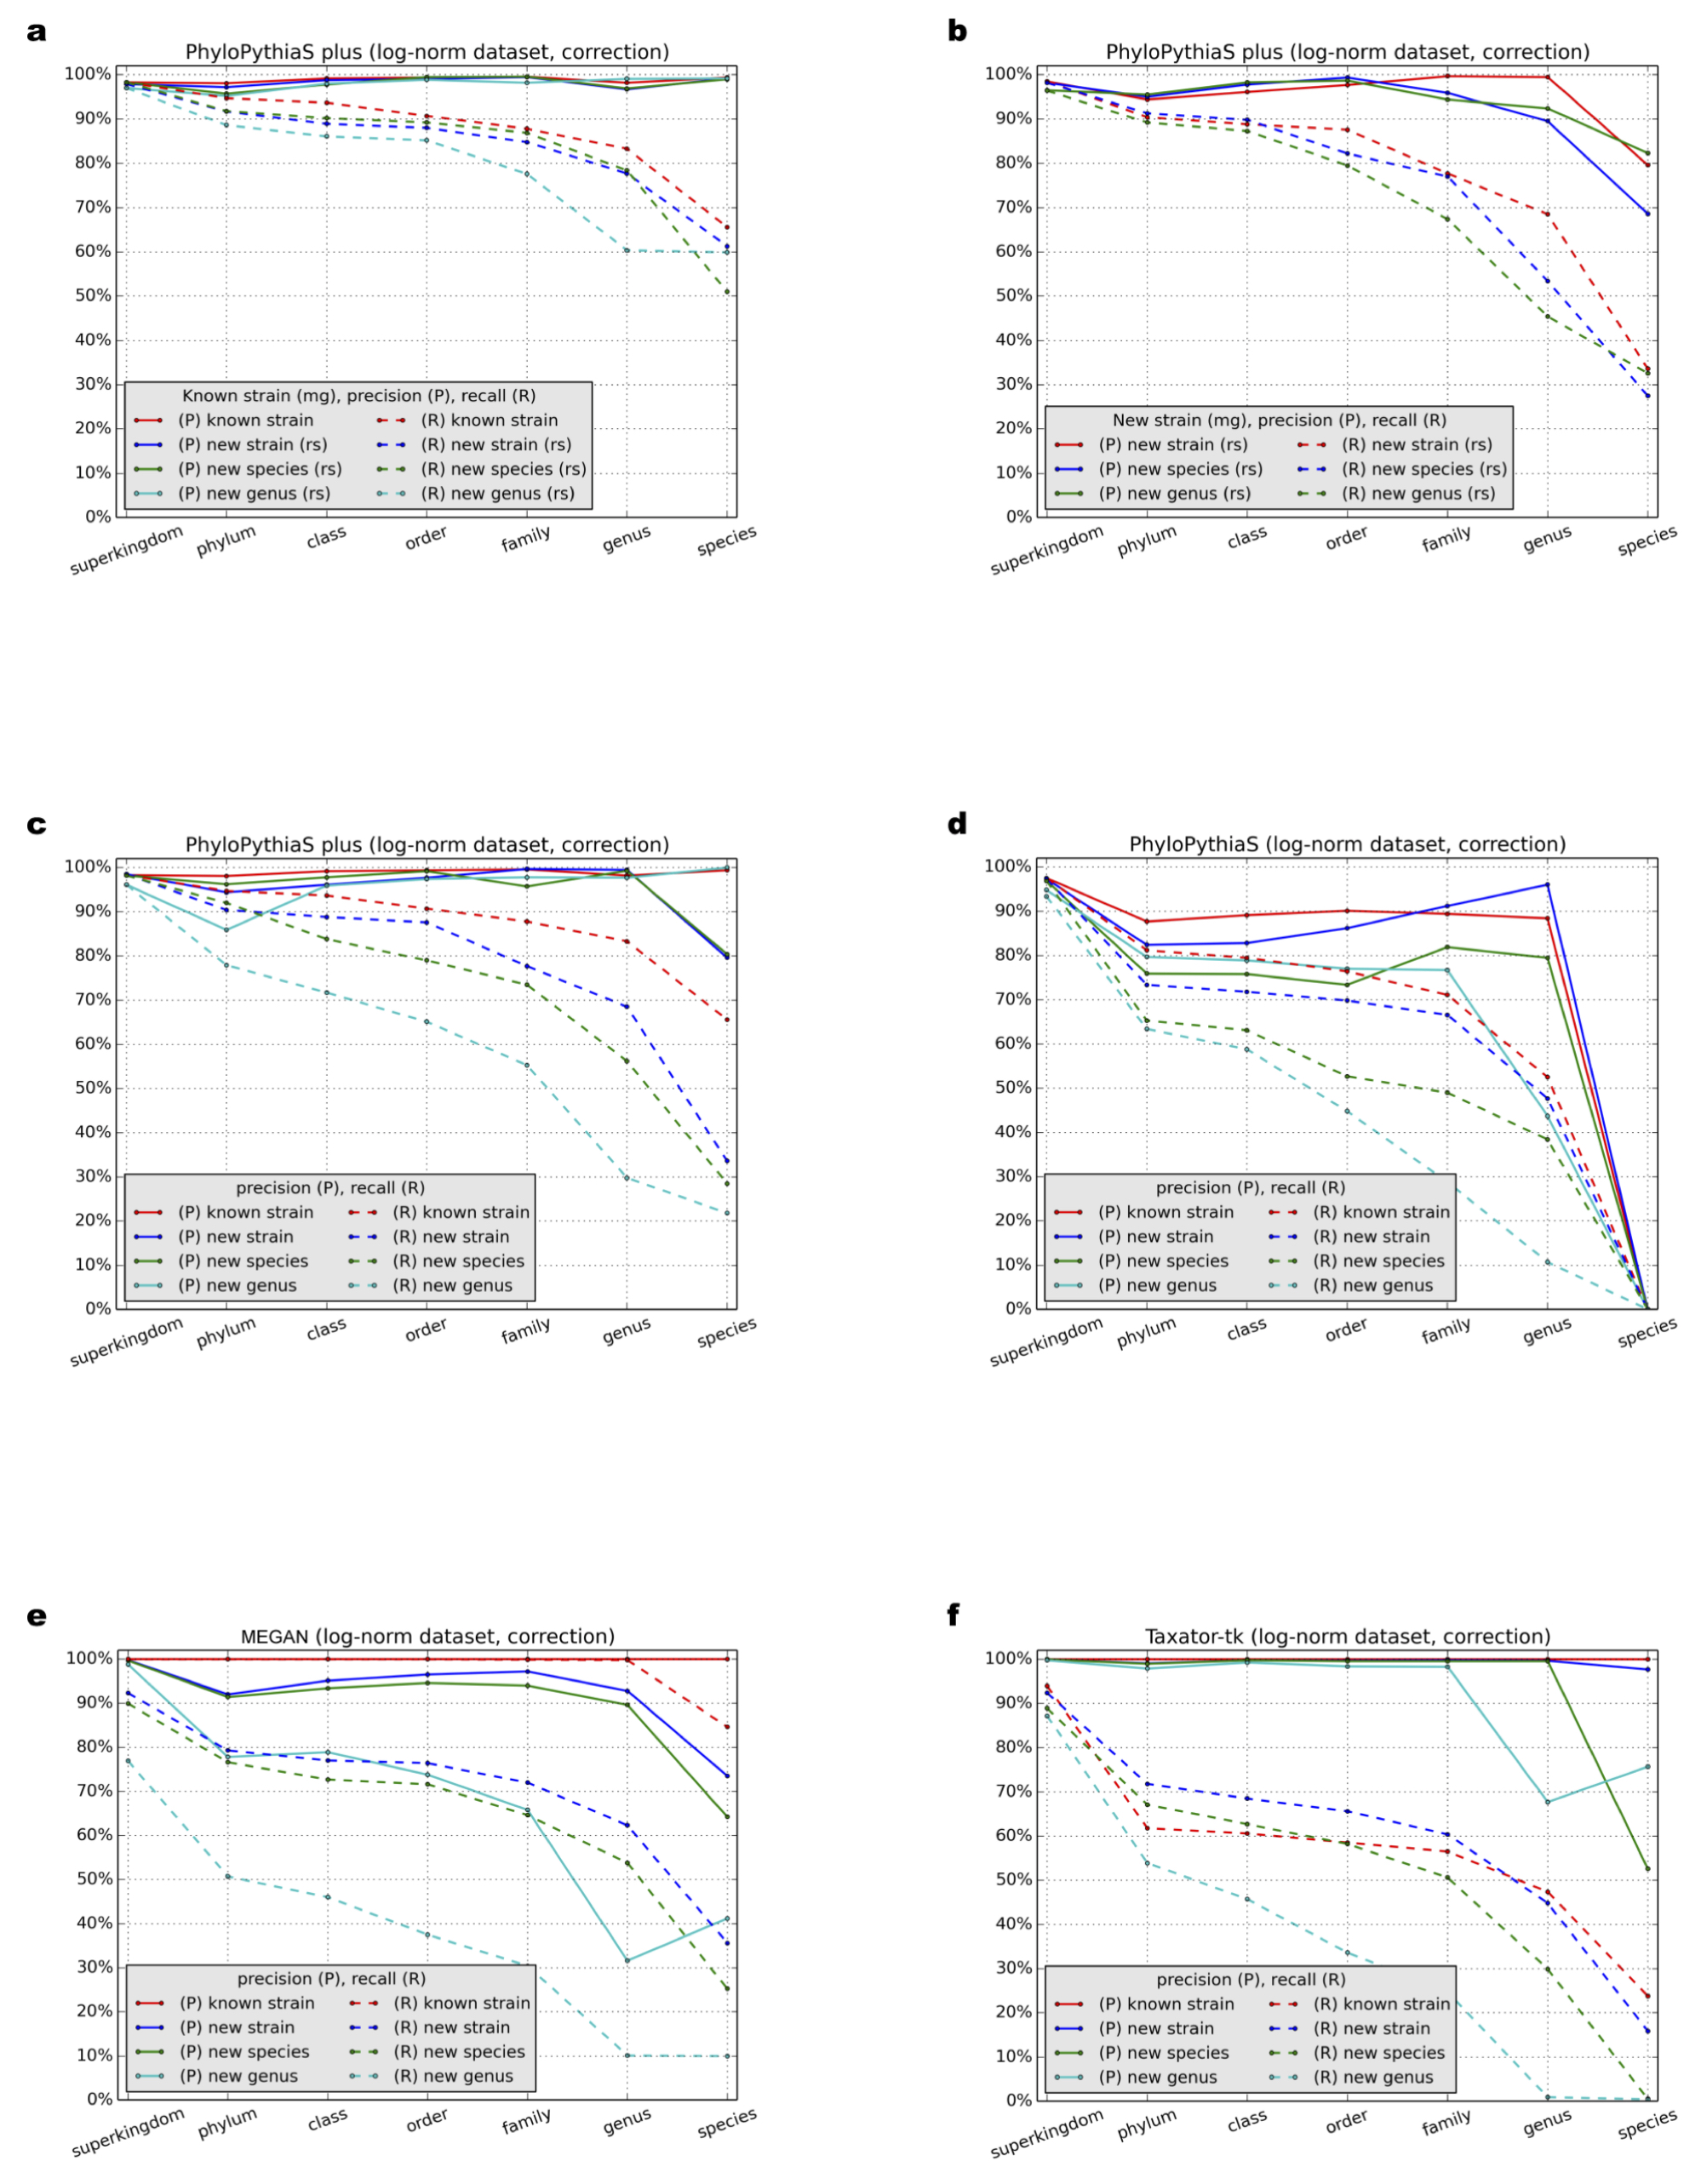
Benchmark results for the simulated dataset with the log-normal distribution using ‘correction’
Precision (P) and recall (R) were calculated with a ‘correction’ (Supplemental Information 1, Section 3.9) at different taxonomic ranks for (A–C) PPS+, (D) the generic PPS model, (E) MEGAN4 and (F) taxator-tk in all test scenarios (Table 1: Test Scenarios 1–9, Supplemental Information 1, Section 3.1).
Base pairs assigned to individual taxa for a simulated metagenome of a microbial community with log-normally distributed species abundance
The number of taxonomic assignments to each taxon in bp is indicated on a log-scale by the pie chart sizes for PPS+, the generic PPS model, taxator-tk, MEGAN4 and the underlying standard of truth (TRUE). There were 47 strains present in the simulated metagenome sample. Assignments to taxa not shown in black in the chart are to false taxa that are not present in the simulated metagenome. (A) shows the scenario where sequences from the same species as those of the simulated dataset were excluded from the reference sequences but not the marker gene databases (Table 1: Test Scenario 3). (B) shows the scenario where sequences from the same species as those of the simulated dataset were excluded from the reference sequence and marker gene databases (Table 1: Test Scenario 8).
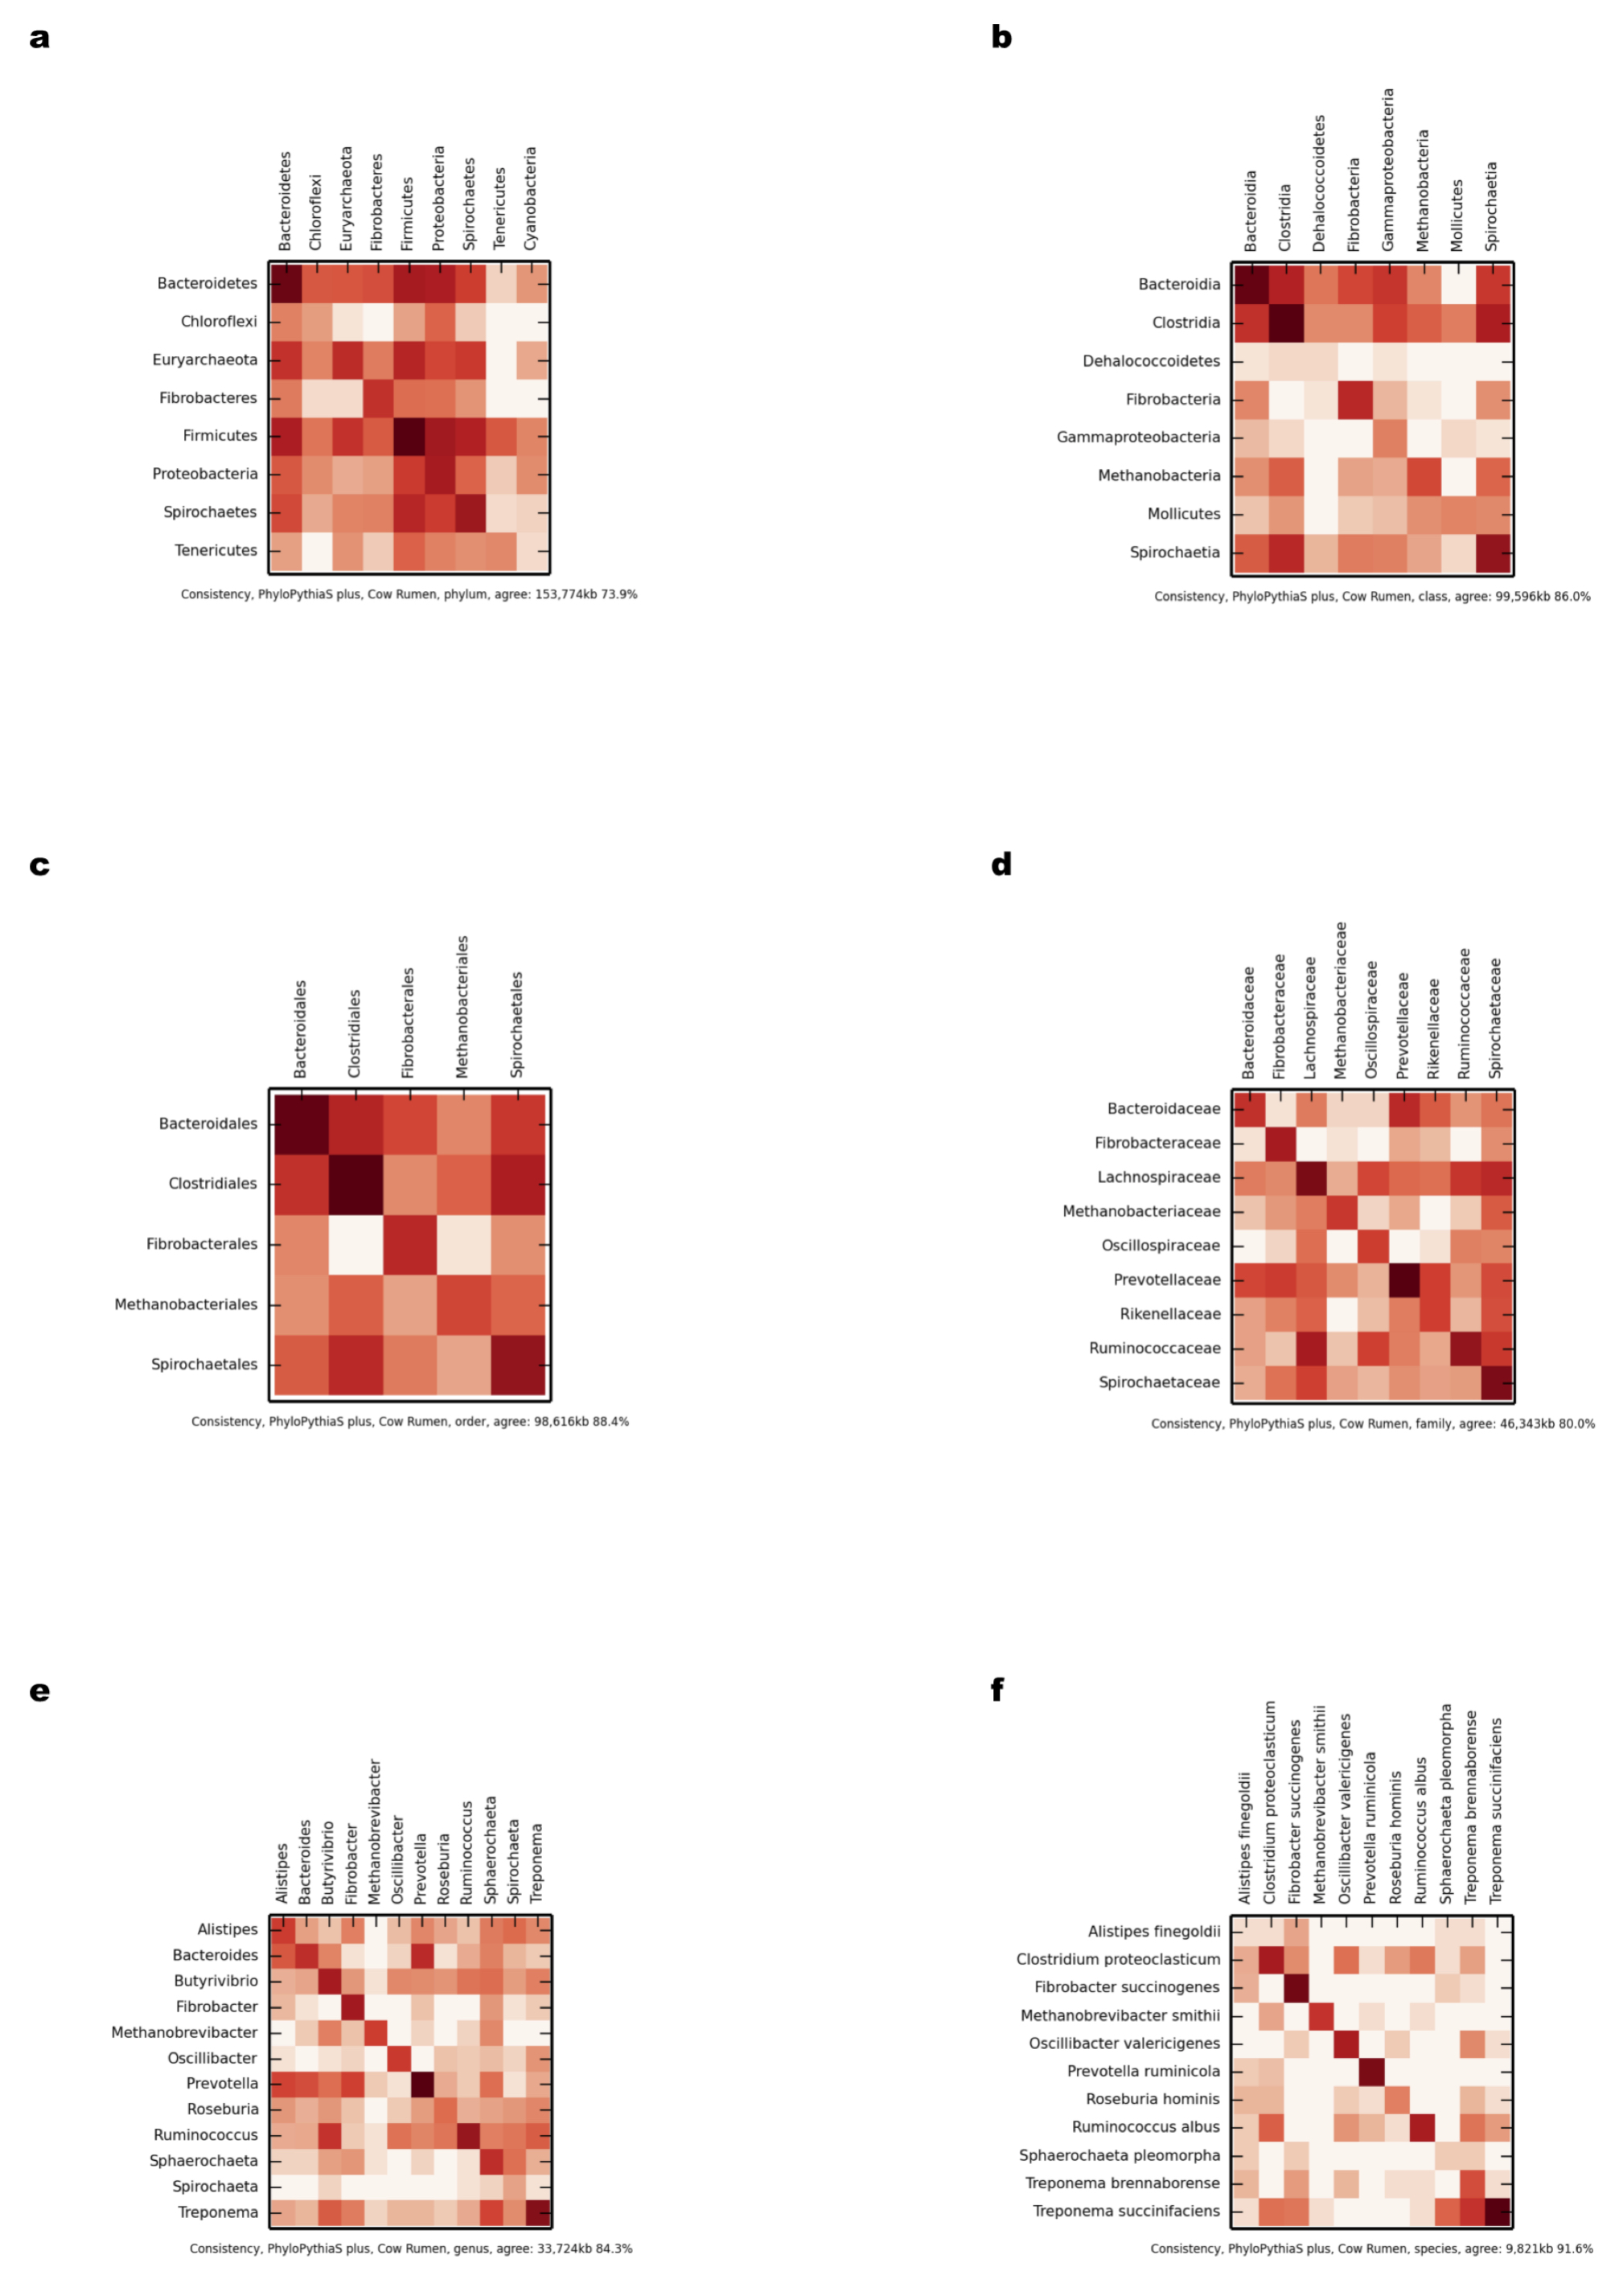
Comparison of scaffold and contig assignments using PPS+ for the chunked cow rumen dataset
The comparisons were performed at different taxonomic ranks using heat maps (Supplemental Information 1, Sections 3.2.2 and 3.10.1). The rows correspond to scaffolds and the columns correspond to contig assignments. (A) Phylum; (B) class; (C) order; (D) family; (E) genus; (F) species.
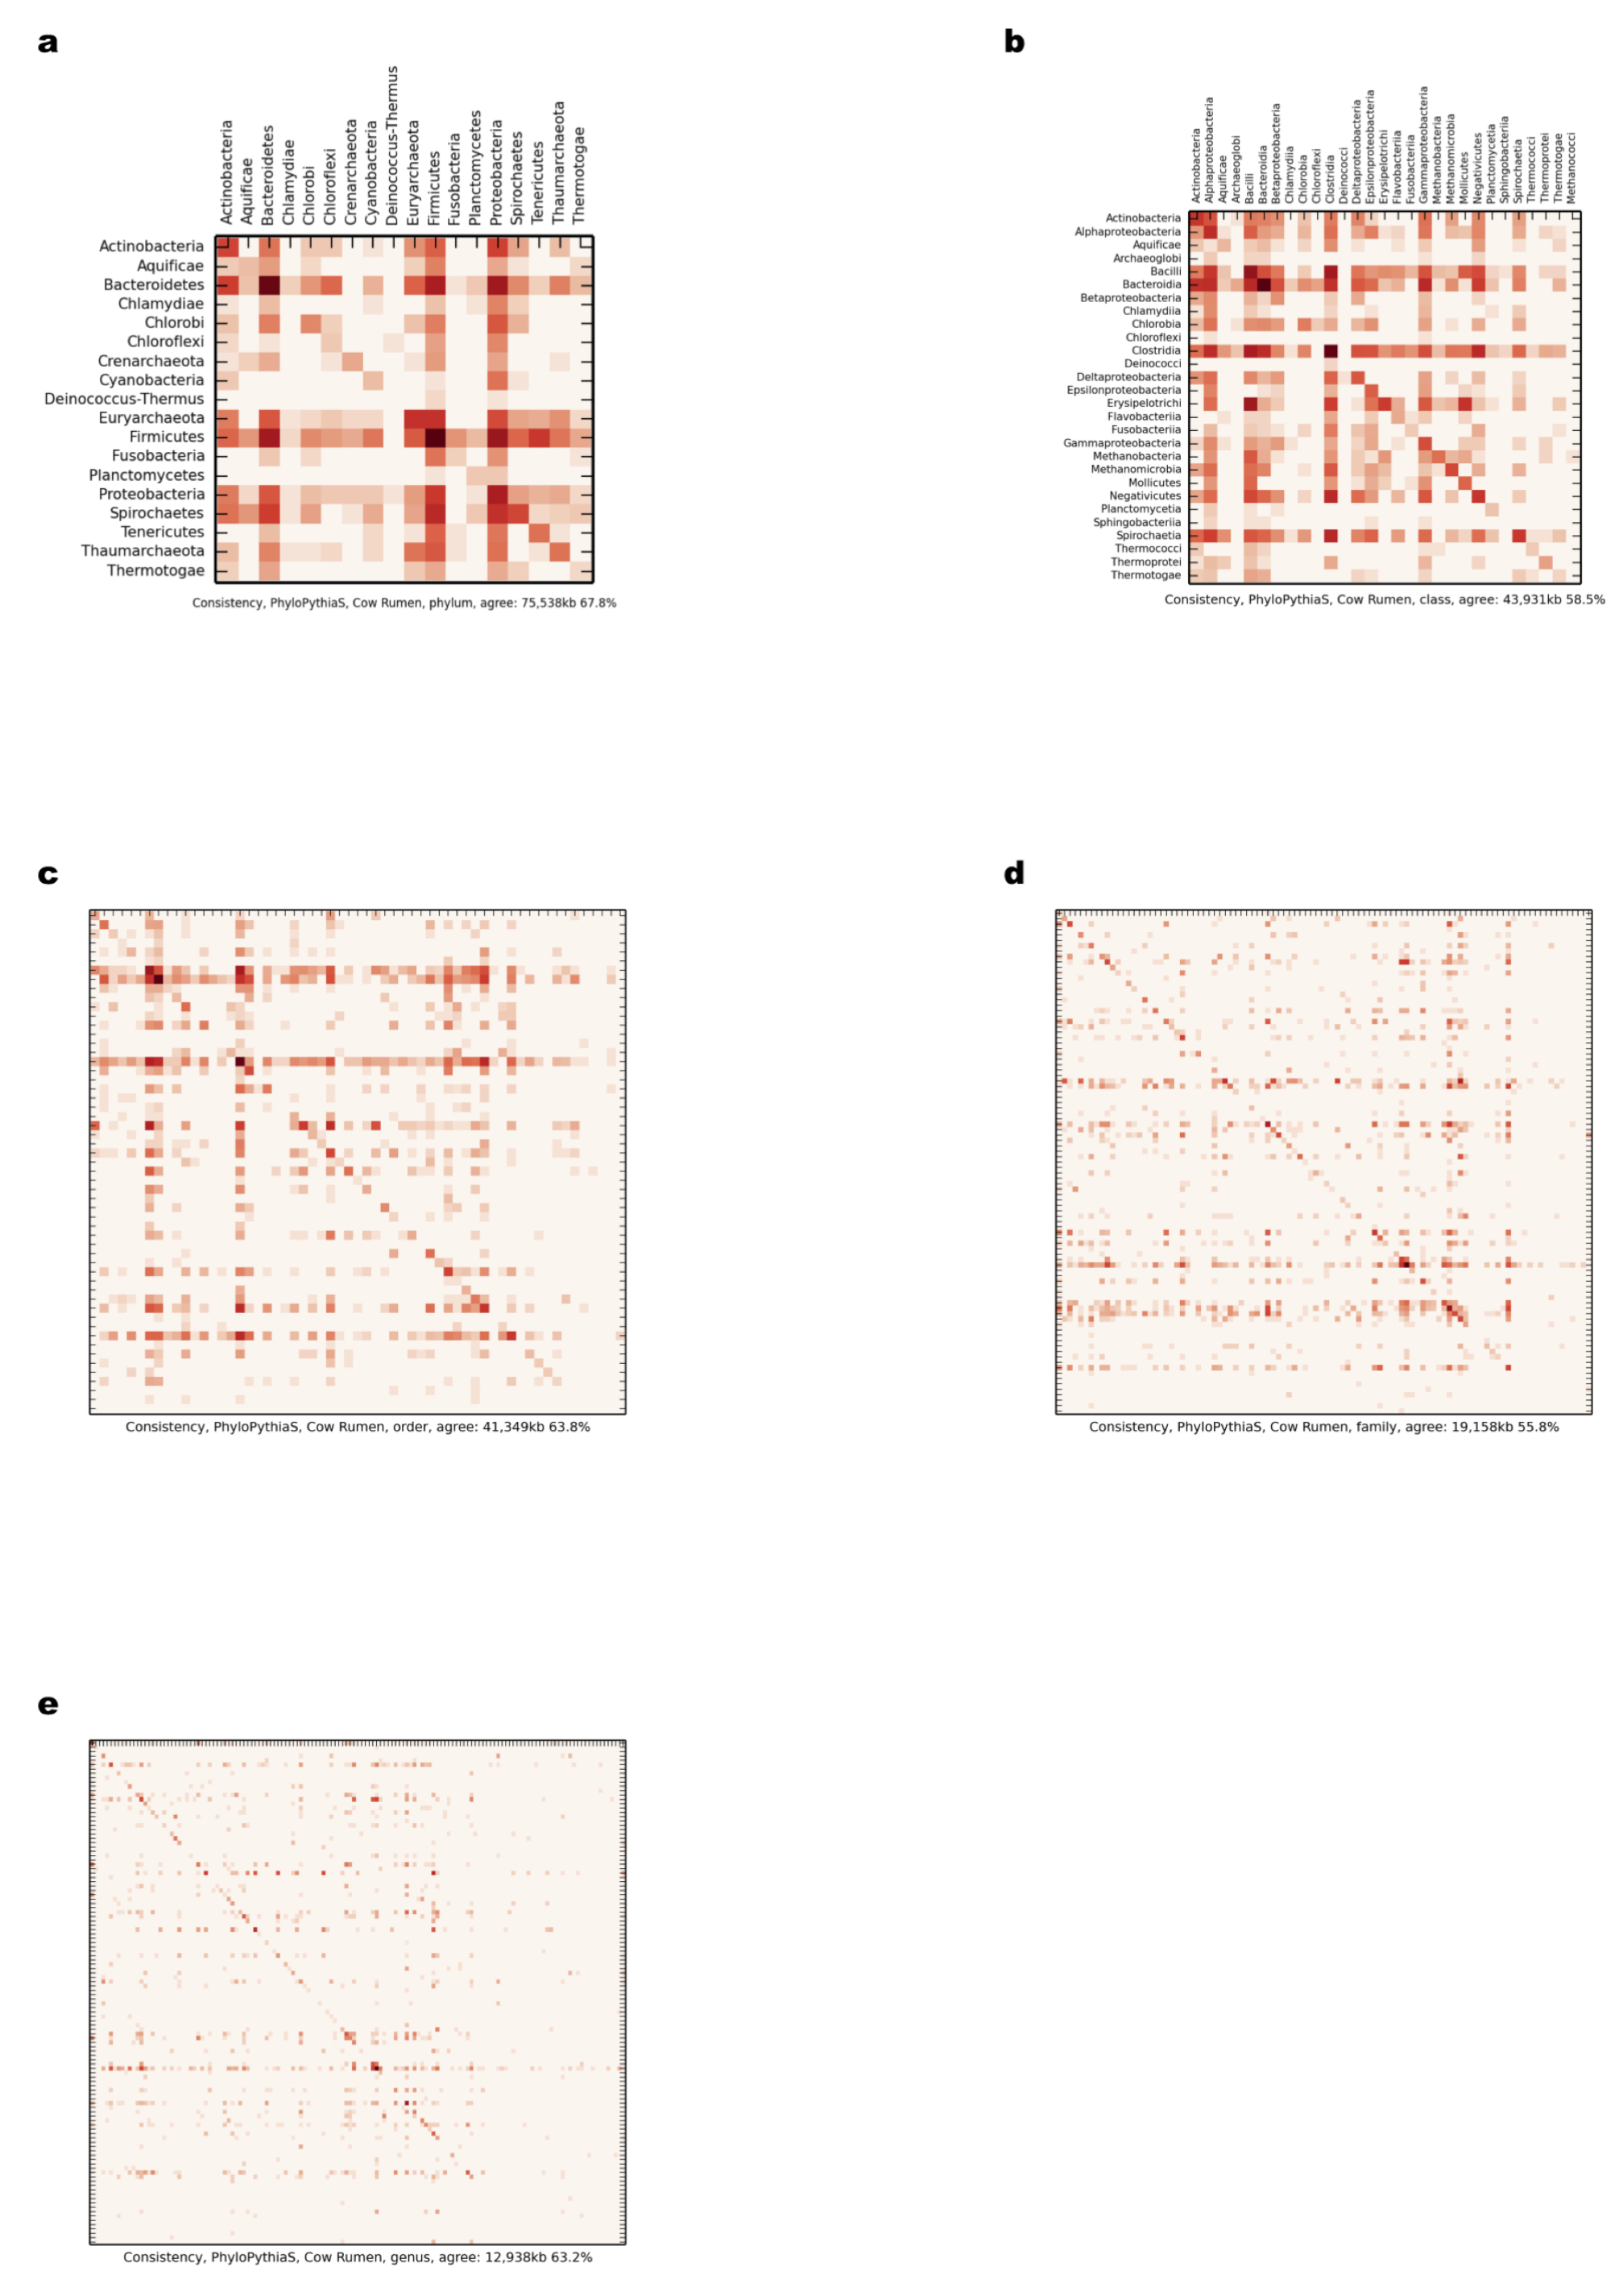
Comparison of scaffold and contig assignments using the generic PPS model for the chunked cow rumen dataset
The comparisons were performed at different taxonomic ranks using heat maps (Supplemental Information 1, Sections 3.2.2 and 3.10.1). The rows correspond to scaffolds and the columns correspond to contig assignments. (A) Phylum; (B) class; (C) order; (D) family; (E) genus.
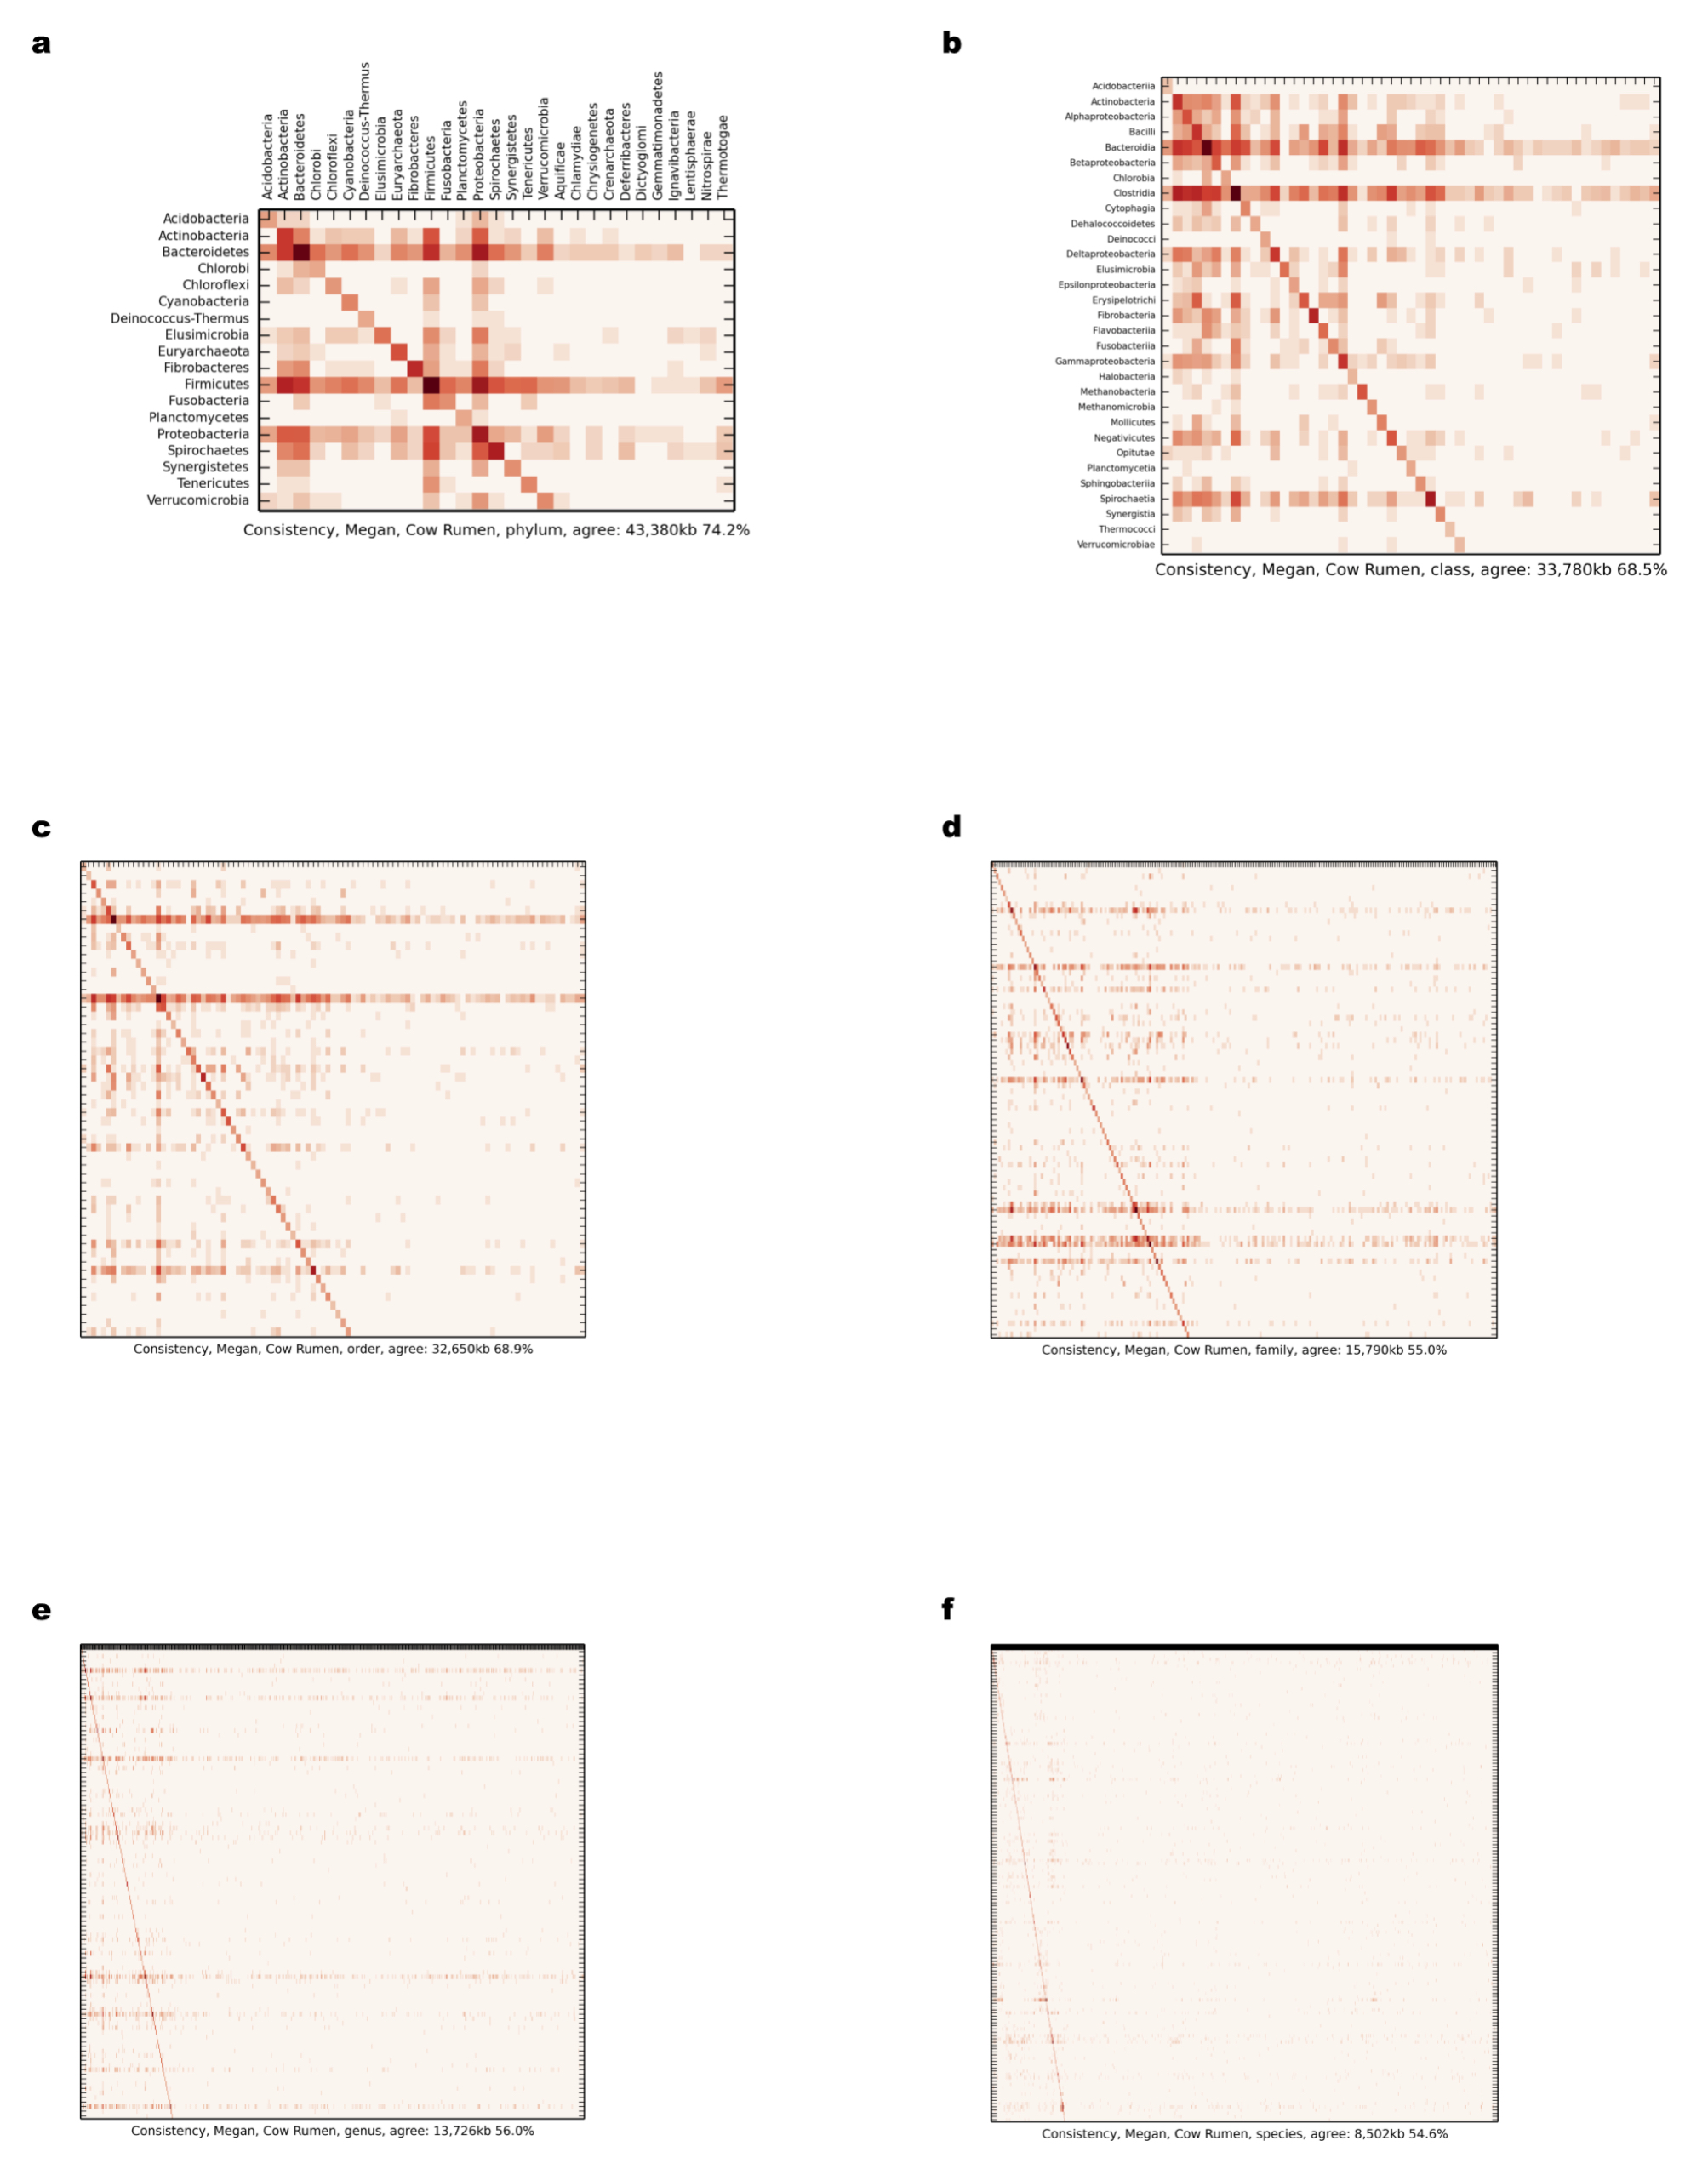
Comparison of scaffold and contig assignments using MEGAN4 for the chunked cow rumen dataset
The comparisons were performed at different taxonomic ranks using heat maps (Supplemental Information 1, Section 3.2.2 and 3.10.1). The rows correspond to scaffolds and the columns correspond to contig assignments. (A) Phylum; (B) class; (C) order; (D) family; (E) genus; (F) species.
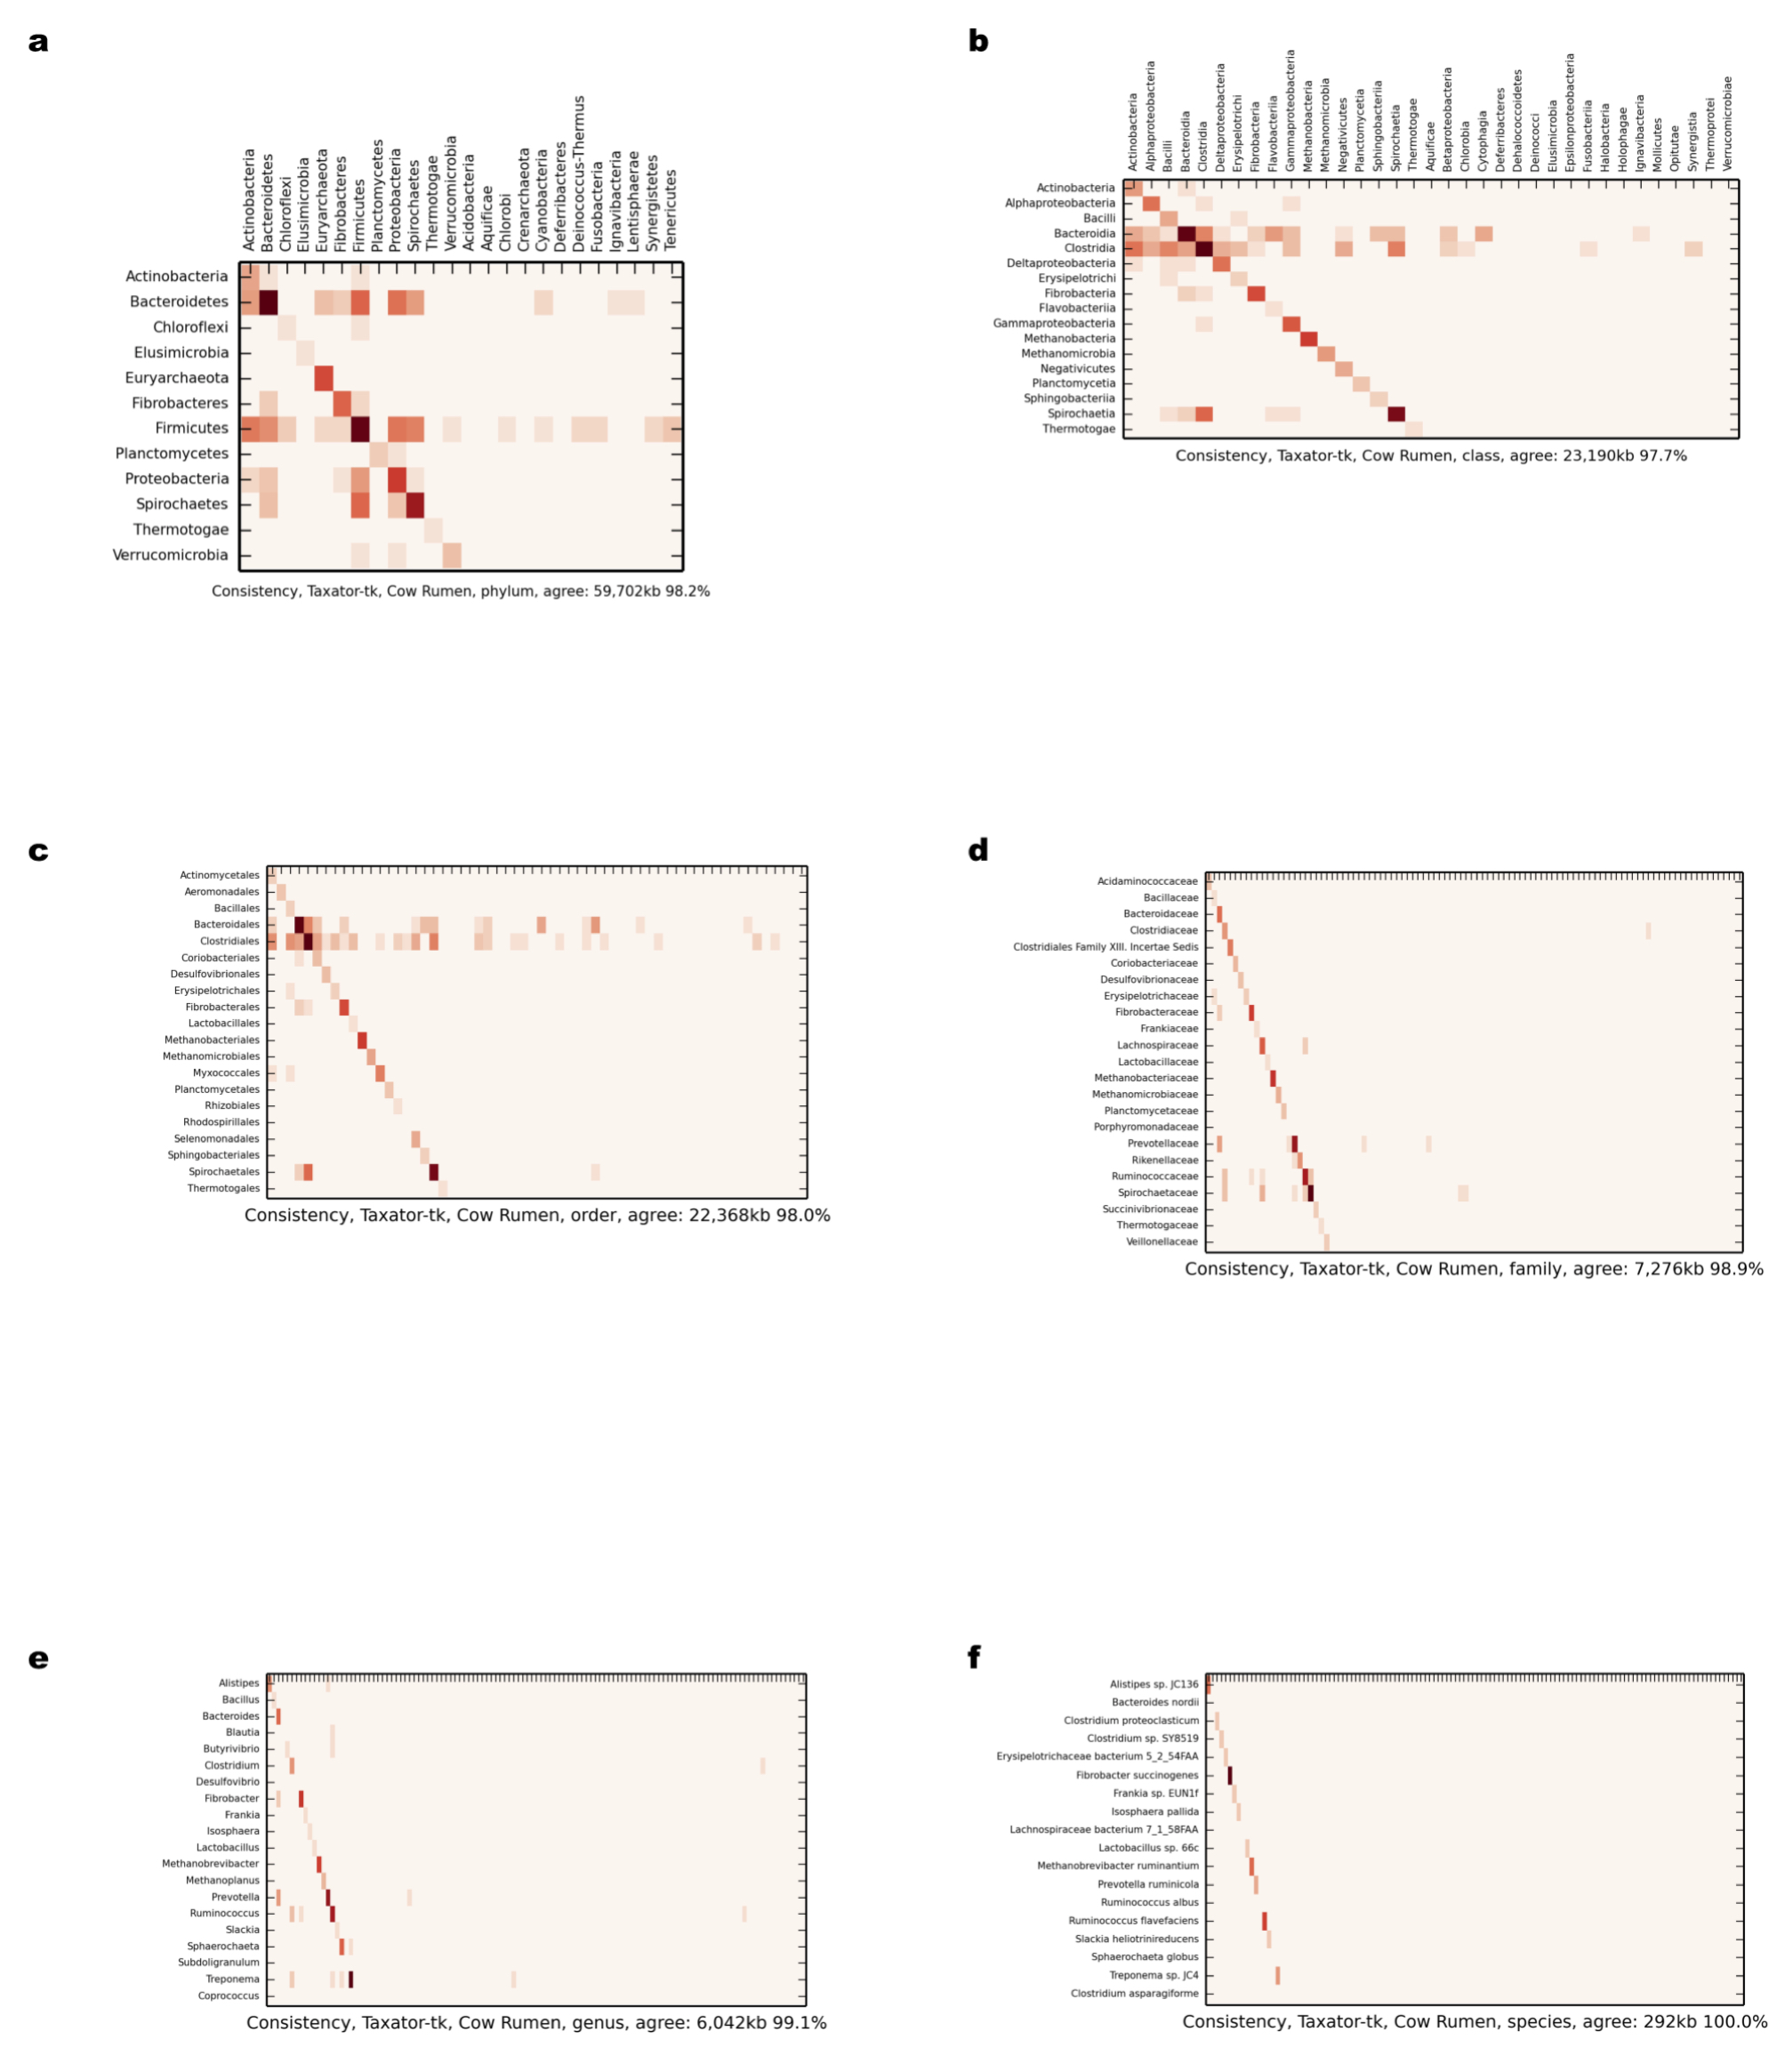
Comparison of scaffold and contig assignments using taxator-tk for the chunked cow rumen dataset
The comparisons were performed at different taxonomic ranks using heat maps (Supplemental Information 1, Section 3.2.2 and 3.10.1). The rows correspond to scaffolds and the columns correspond to contig assignments. (A) Phylum; (B) class; (C) order; (D) family; (E) genus; (F) species.
Comparison of scaffold and contig assignments using PPS+ for the human gut dataset
The comparisons were performed at different taxonomic ranks using heat maps (Supplemental Information 1, Sections 3.2.1 and 3.10.1). The rows correspond to scaffolds and the columns correspond to contig assignments. (A) Phylum; (B) class; (C) order; (D) family; (E) genus; (F) species.
Comparison of scaffold and contig assignments using the generic PPS model for the human gut dataset
The comparisons were performed at different taxonomic ranks using heat maps (Supplemental Information 1, Sections 3.2.1 and 3.10.1). The rows correspond to scaffolds and the columns correspond to contig assignments. (A) Phylum; (B) class; (C) order; (D) family; (E) genus.
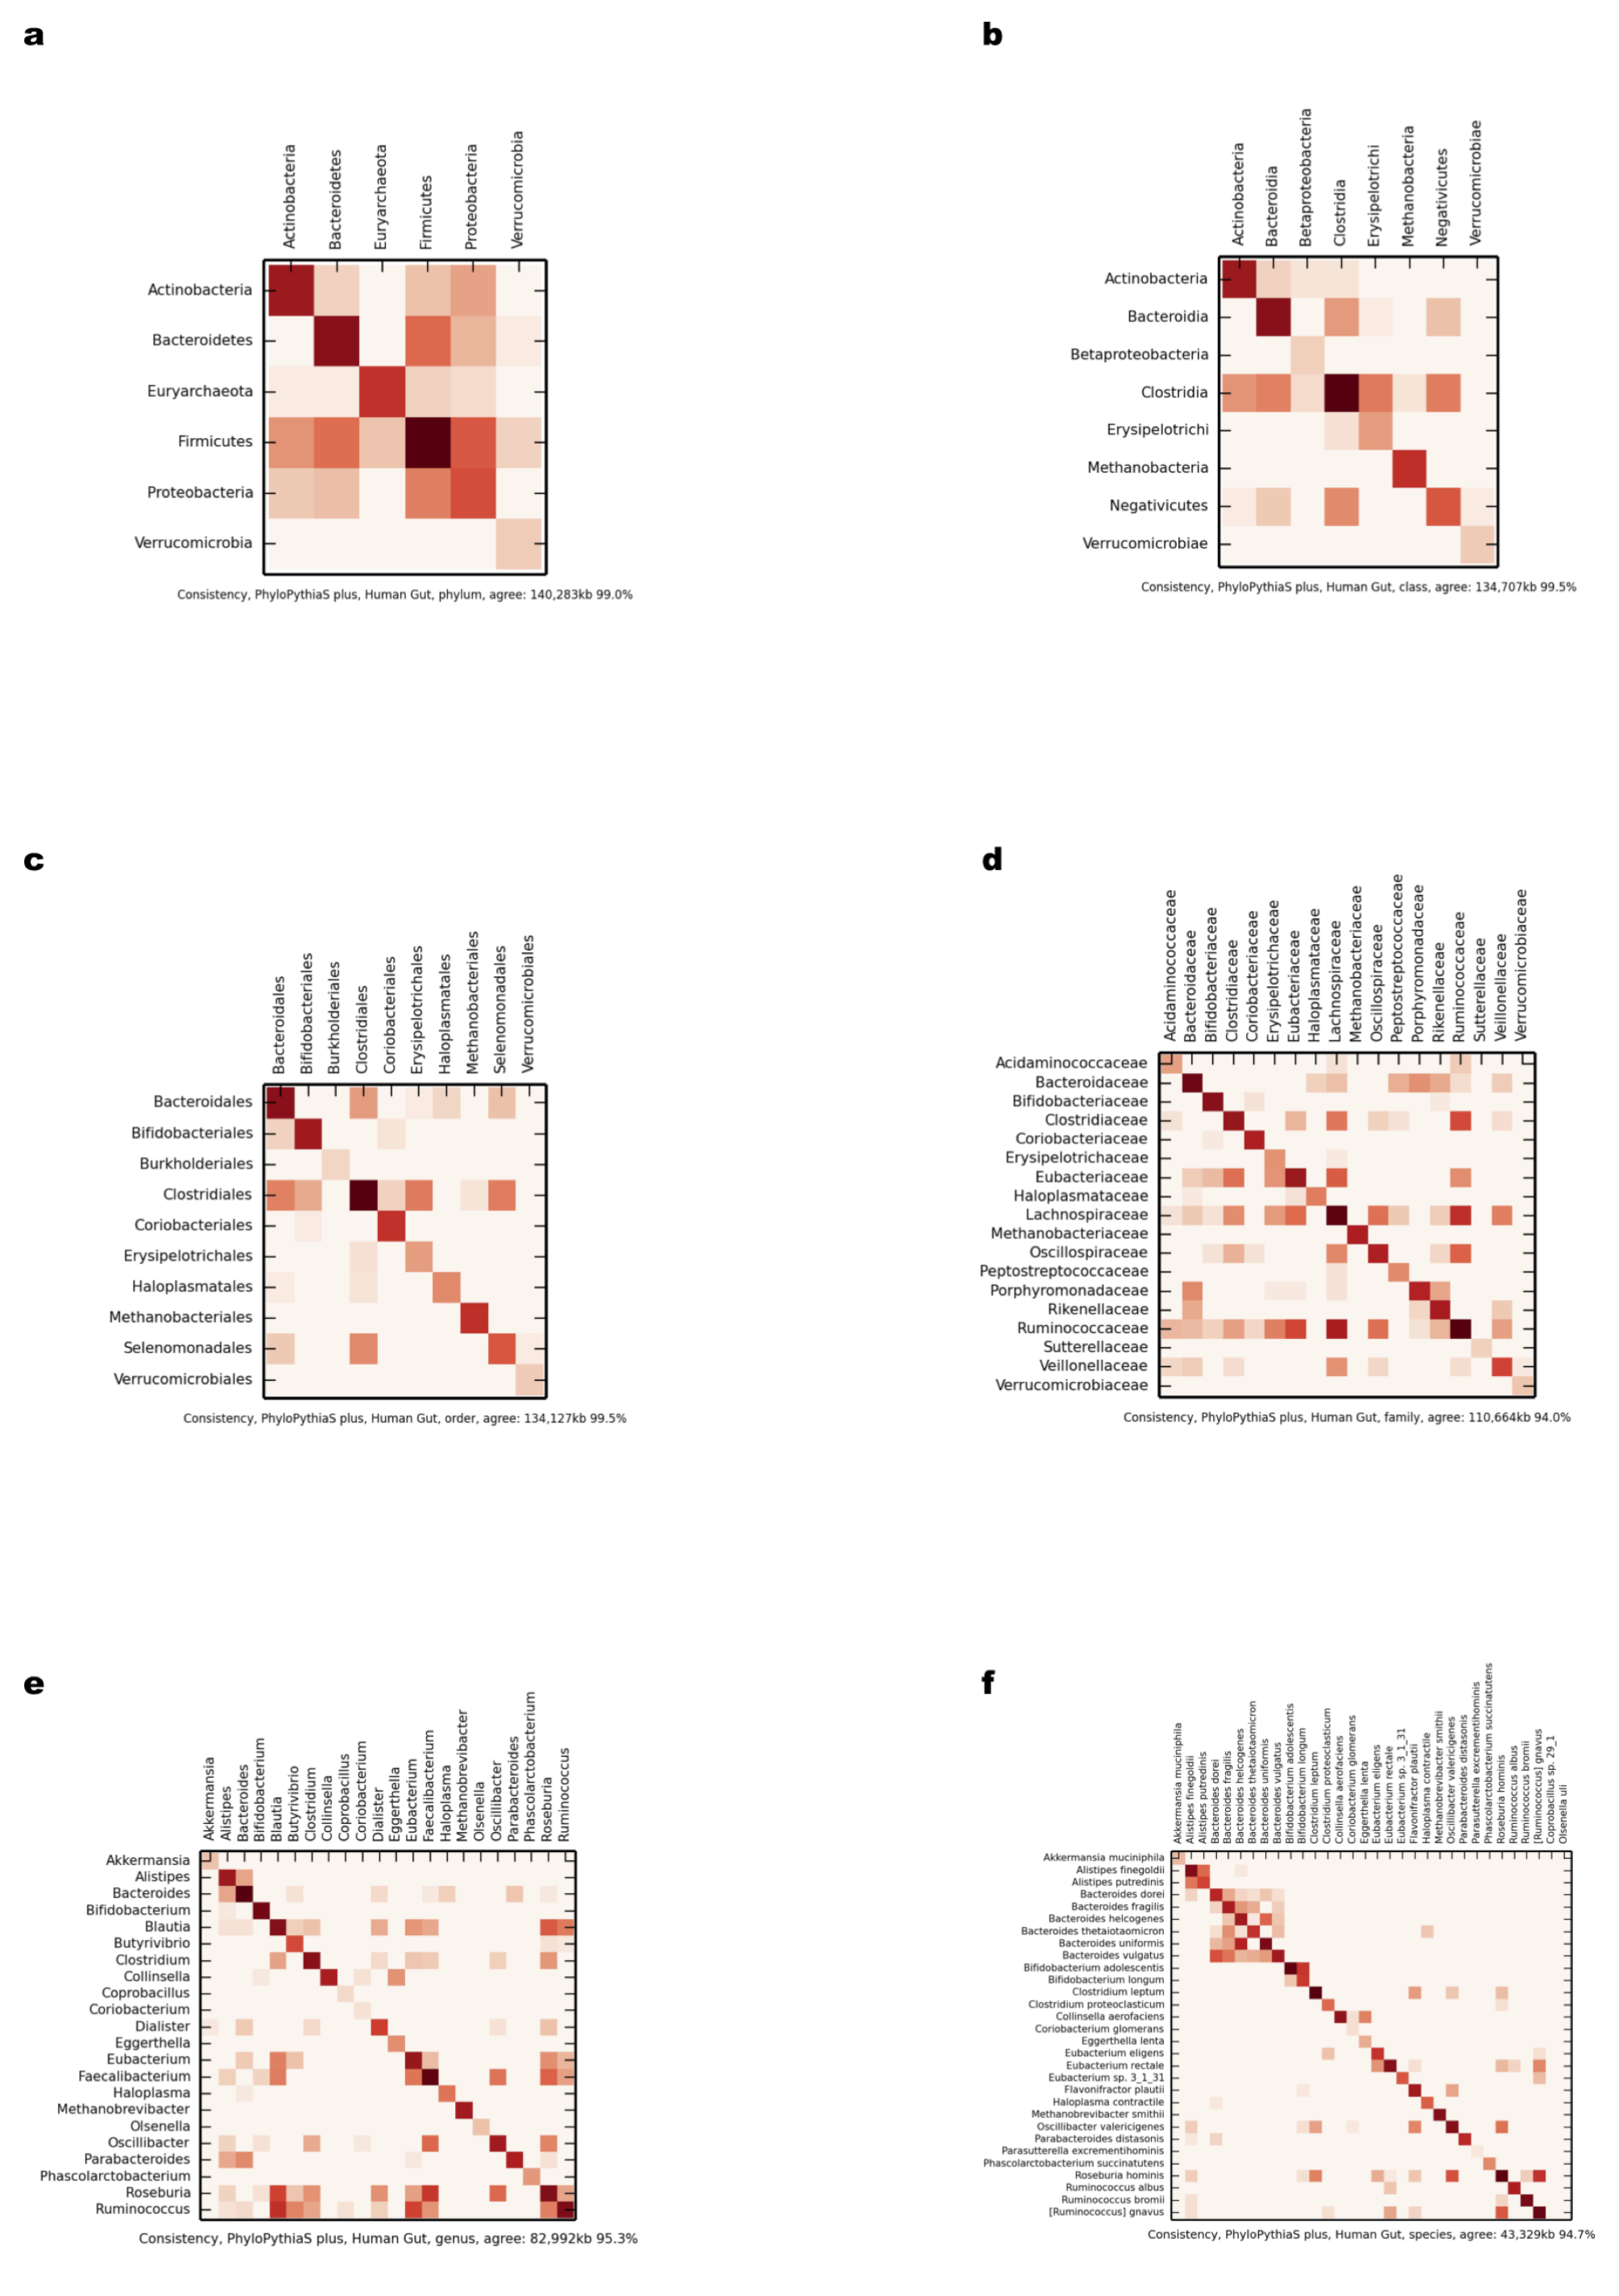
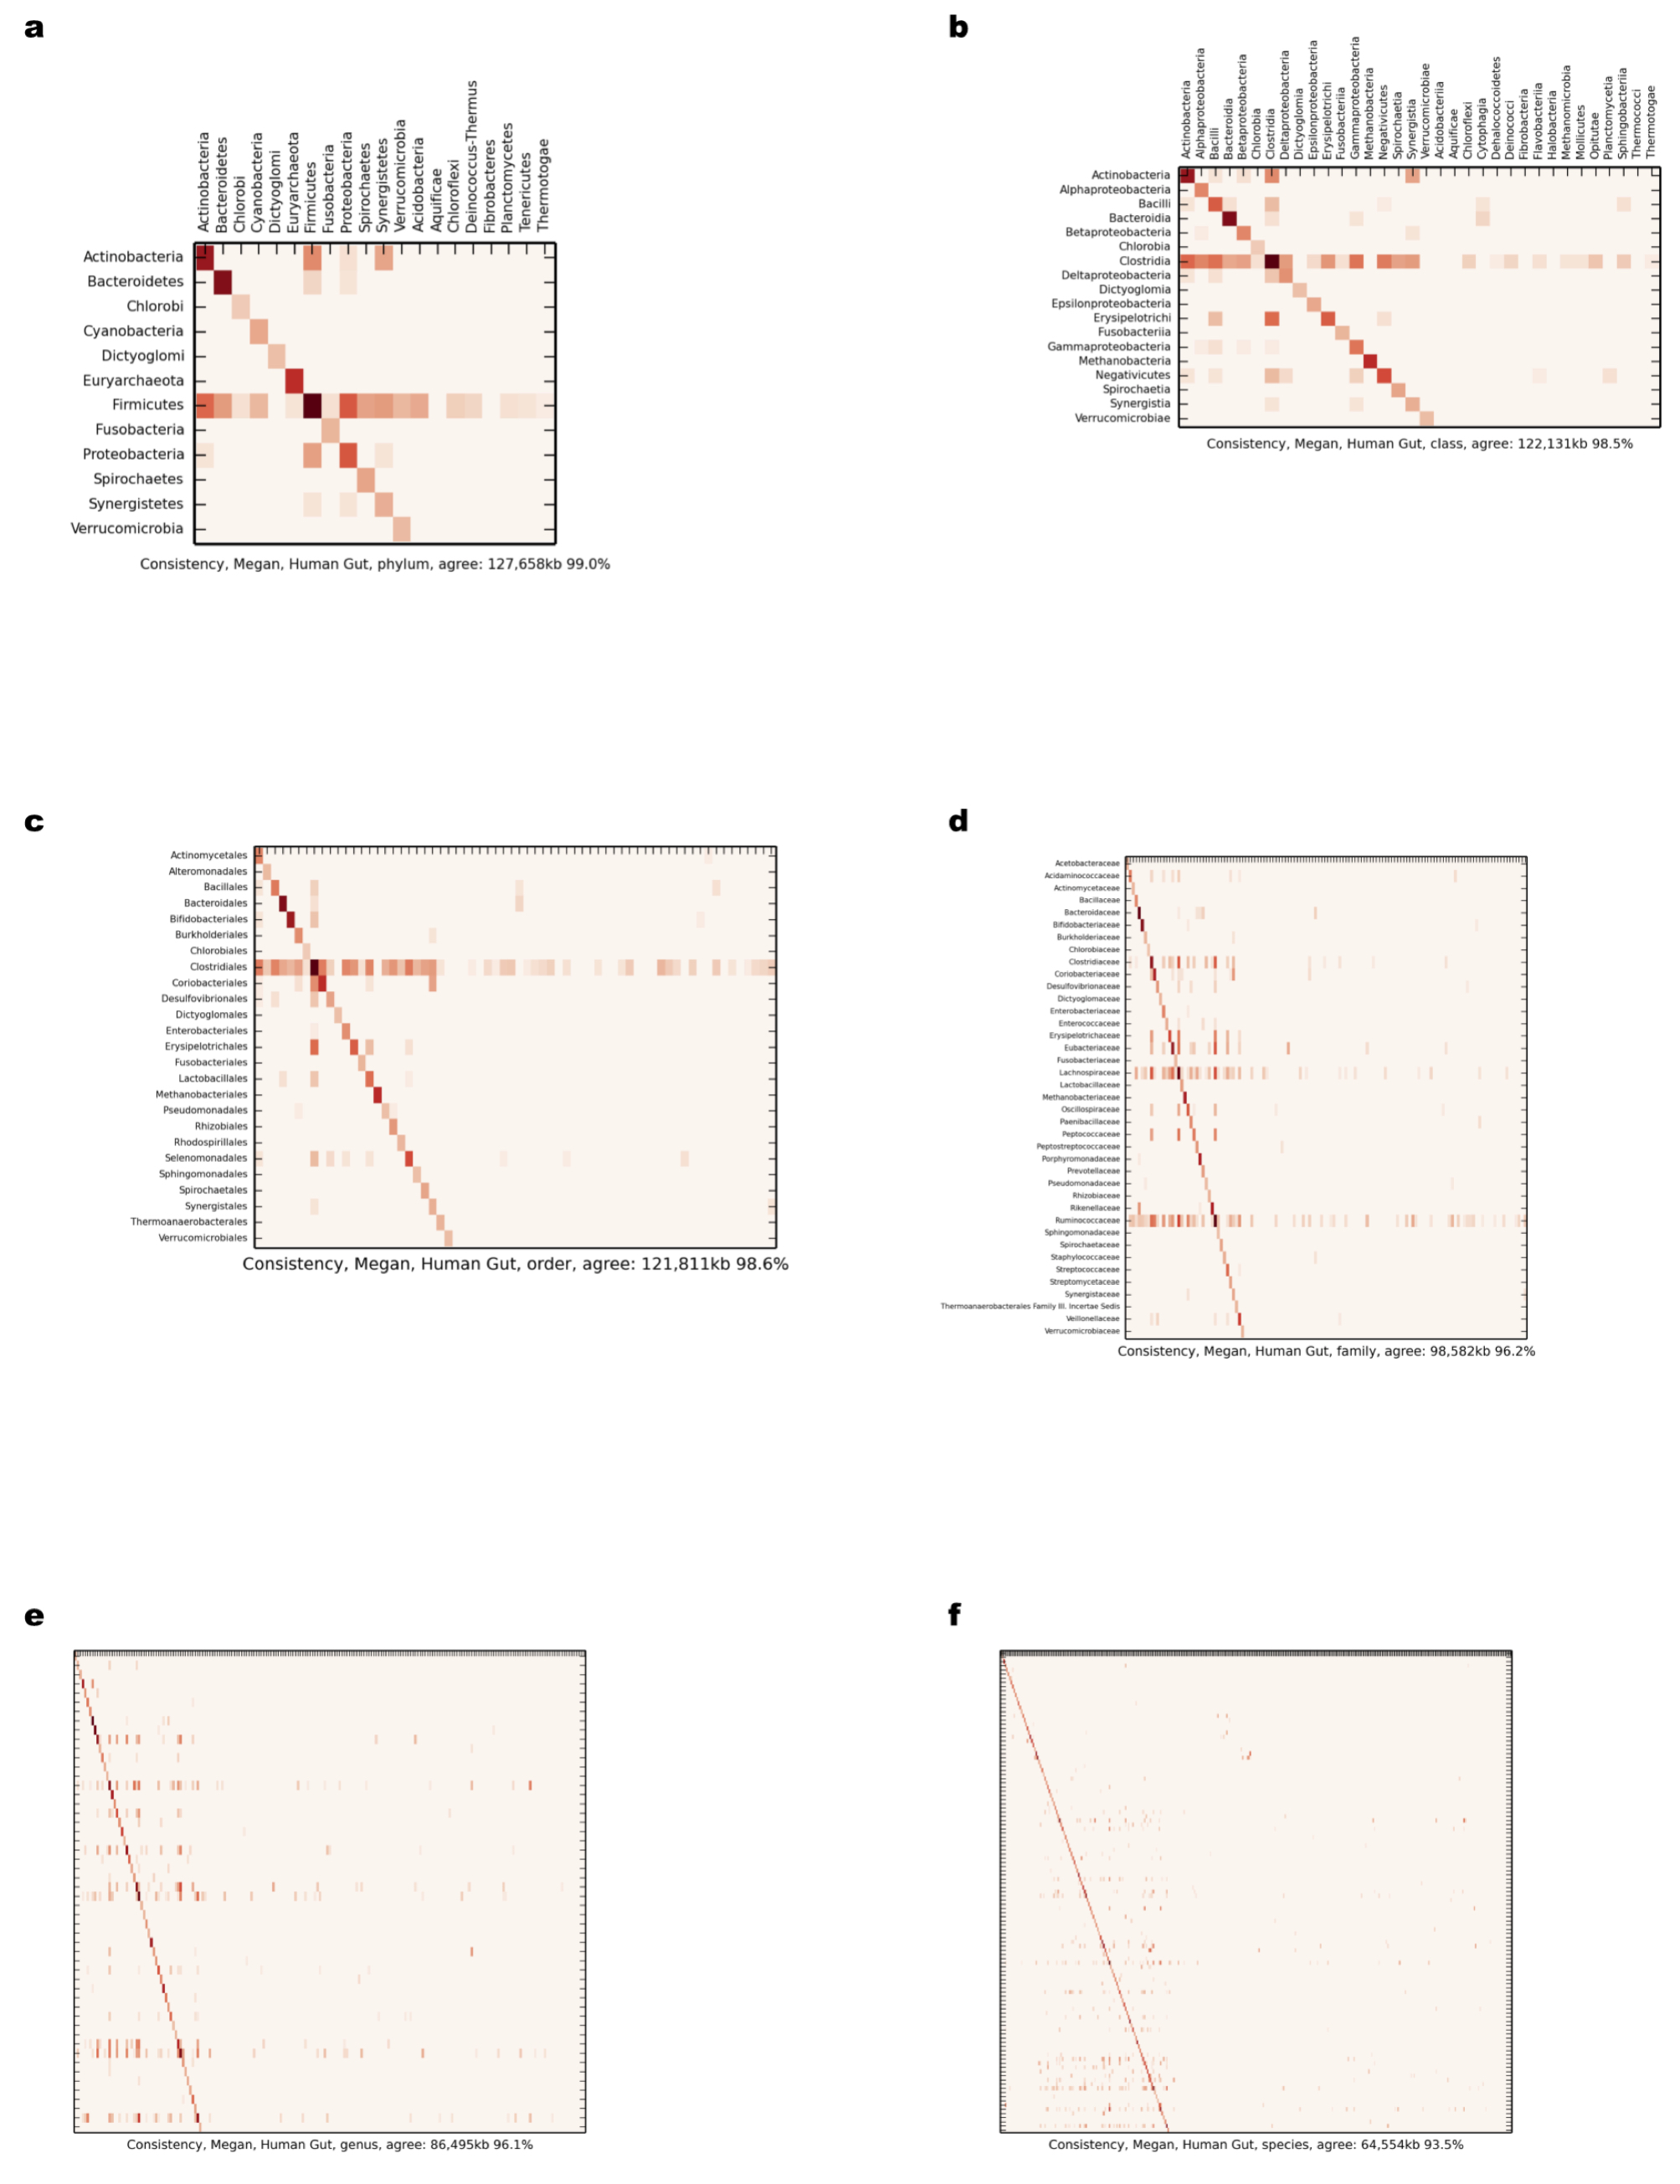
Comparison of scaffold and contig assignments using MEGAN4 for the human gut dataset
The comparisons were performed at different taxonomic ranks using heat maps (Supplemental Information 1, Sections 3.2.1 and 3.10.1). The rows correspond to scaffolds and the columns correspond to contig assignments. (A) Phylum; (B) class; (C) order; (D) family; (E) genus; (F) species.
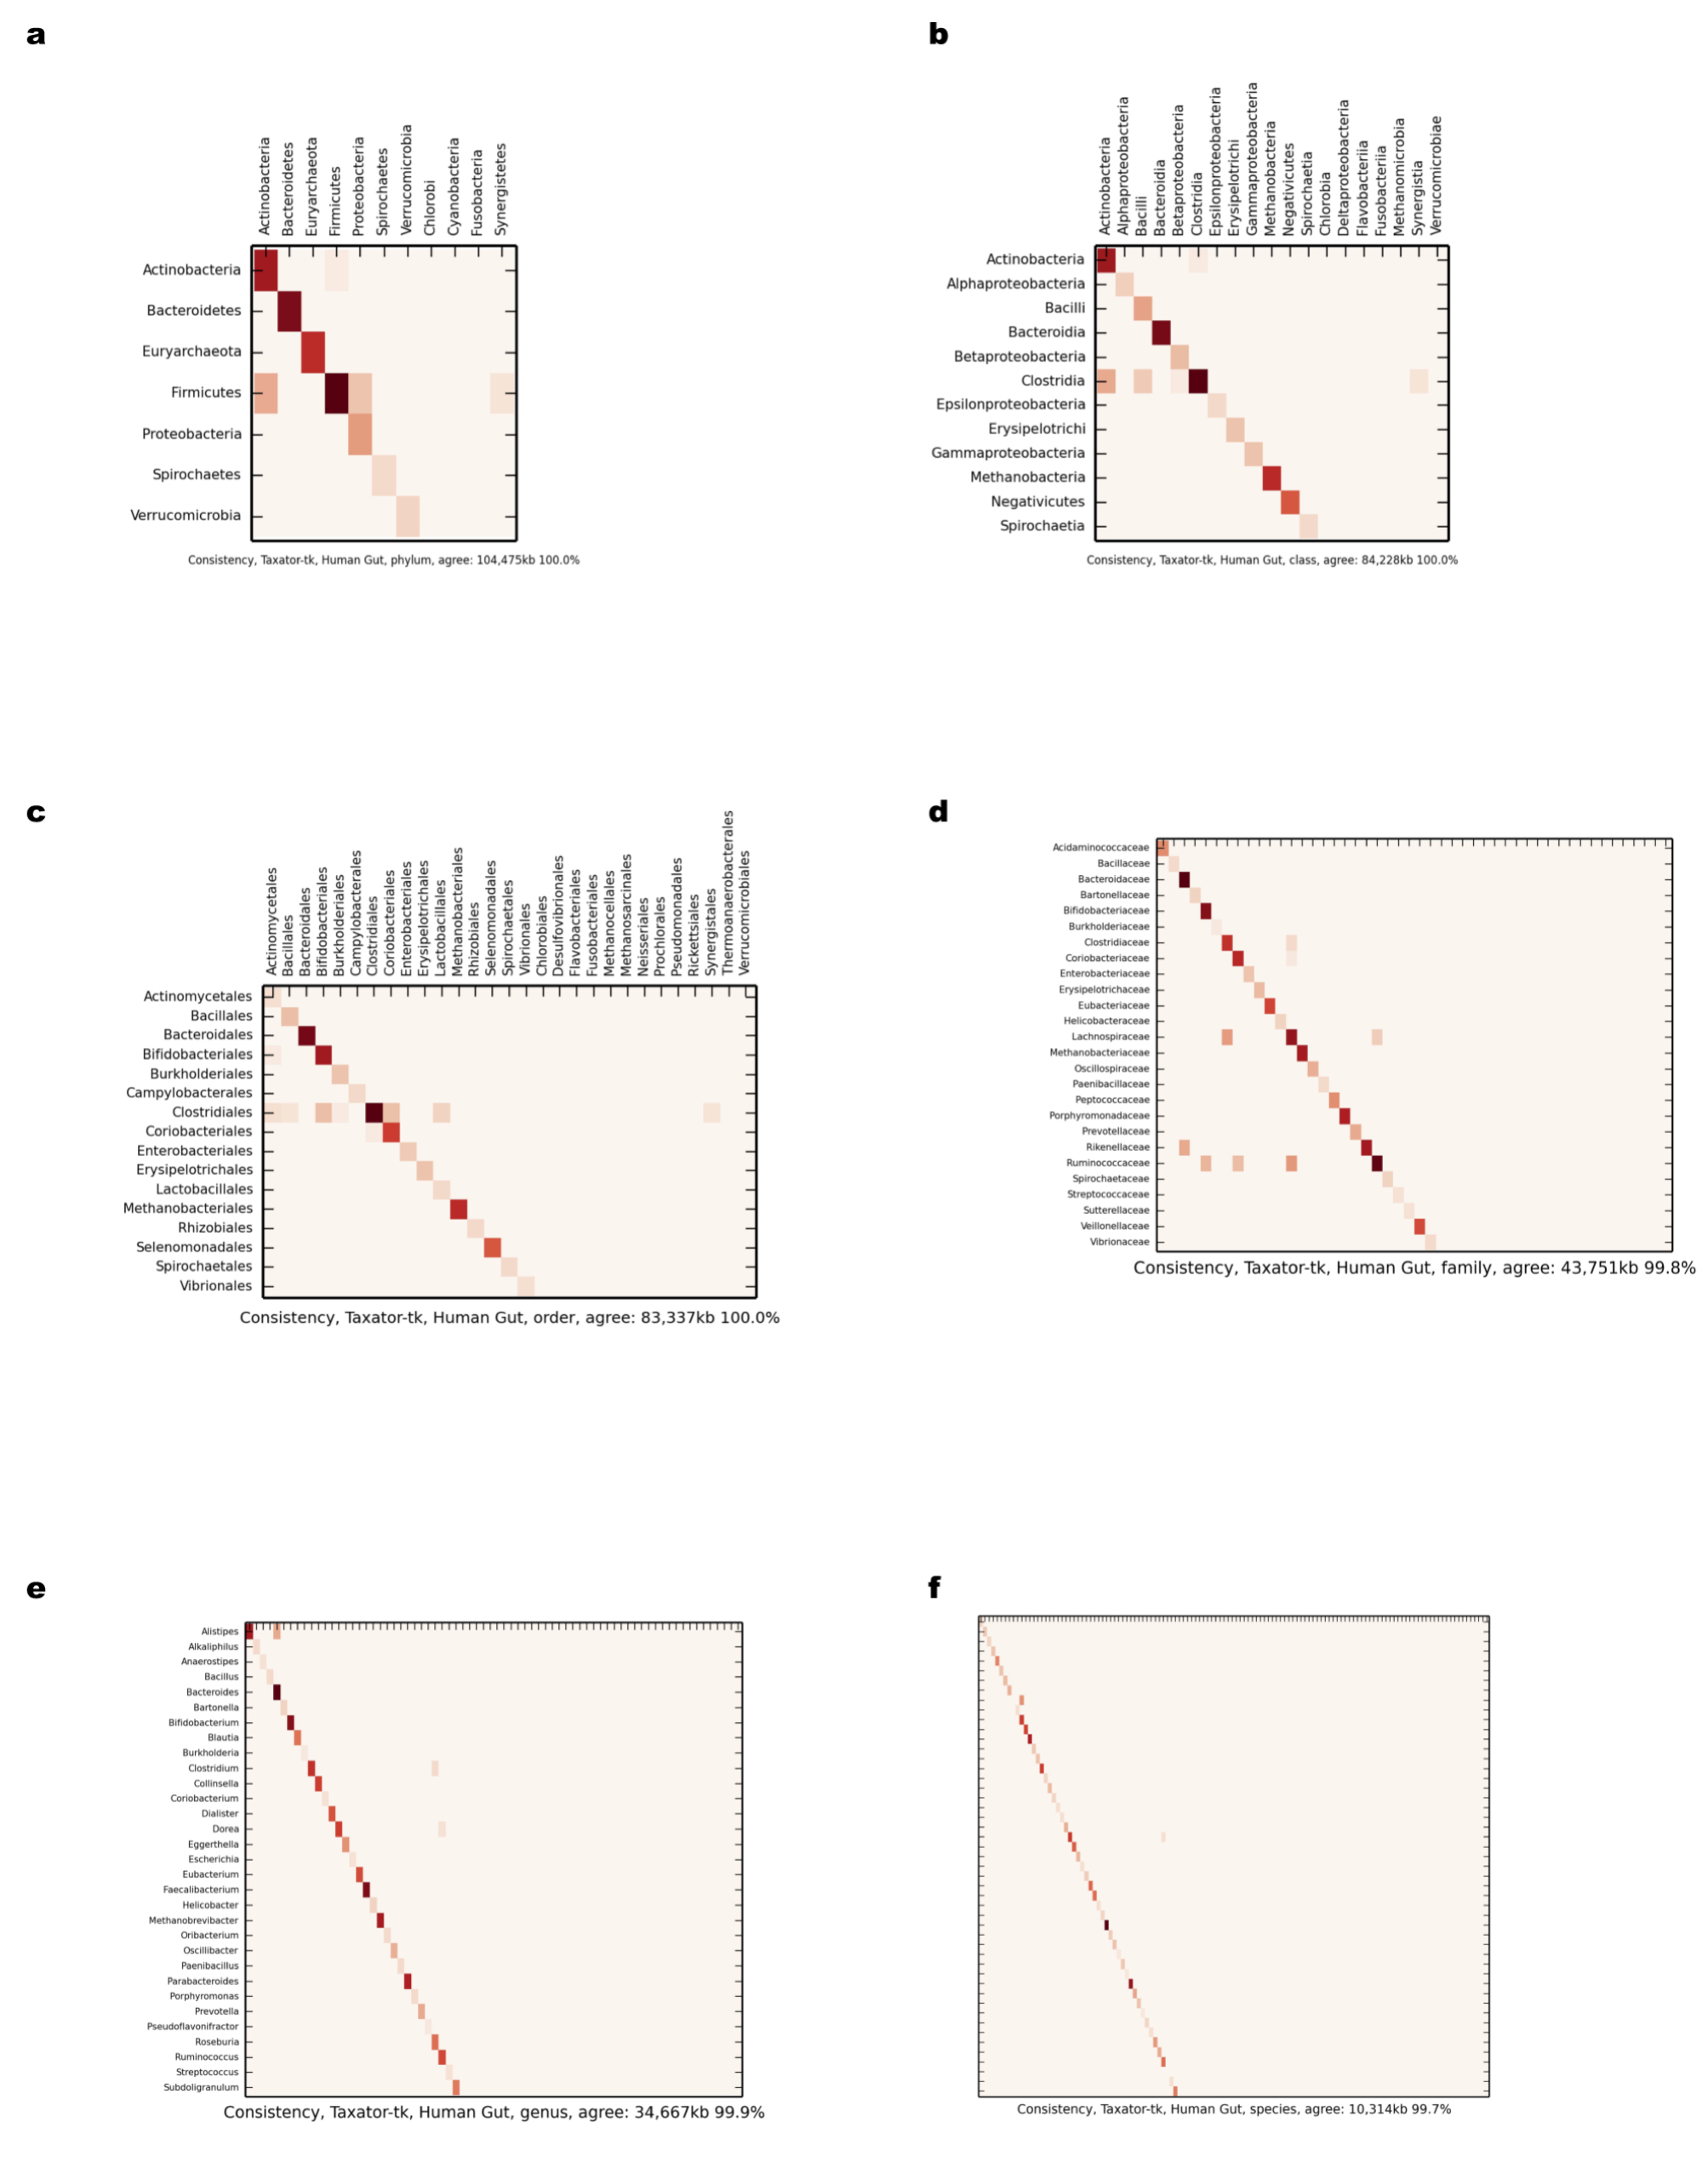
Comparison of scaffold and contig assignments using taxator-tk for the human gut dataset
The comparisons were performed at different taxonomic ranks using heat maps (Supplemental Information 1, Sections 3.2.1 and 3.10.1). The rows correspond to scaffolds and the columns correspond to contig assignments. (A) Phylum; (B) class; (C) order; (D) family; (E) genus; (F) species.
Benchmark results for the simulated datasets with the Kraken software
Precision (P) and recall (R) (Supplemental Information 1, Section 3.9) at different taxonomic ranks were calculated for the Kraken software in four test scenarios (Table 1: Test Scenarios 1, 5, 8, 9, Supplemental Information 1, Section 3.1) using the simulated datasets with the uniform (A and B) and log-norm (C and D) distribution.
Runtime comparison of the k-mer counting algorithms Jellyfish, KAnalyze, and the new k-mer counting algorithm implemented in PPS+
The relevant combination of k-mers that is typically counted for taxonomic binning is marked in bold. The benchmark was run in one thread on a server with an Intel Xeon (CPU X5660, 2.8 GHz) processor, nevertheless we observed that Jellyfish 1.1.1 took approximately 30% more CPU resources than specified. Parallel runs of the methods can be done by splitting the input FASTA file, running multiple instances of a tool for each file separately in parallel and merging of the result files, thus the runtimes scale approximately linearly with the number of CPUs used. As a benchmark dataset, concatenated contigs from (Turnbaugh et al., 2010) (255 Mb) were used.
Scaffold-contig consistency of the chunked cow rumen dataset.
Contigs of the cow rumen dataset of at least 10 kb were divided into chunks of 2 kb for evaluation of assignment consistency (Supplemental Information 1, Section 3.2.2). Scaffold-contig consistency of the assignments made by PPS+, the generic PPS model, MEGAN4, Kraken and taxator-tk for the chunked cow rumen dataset, computed via different definitions (Supplemental Information 1, Section 3.10.2). The table also contains the number of kb of contigs assigned at low taxonomic ranks (family, genus and species) and the corresponding consistency (% agreement) (Supplemental Information 1, Section 3.10.1). Bold numbers correspond to the best values, whereas italic numbers indicate the worst values.
Scaffold-contig consistency of the human gut metagenome dataset
Scaffold-contig consistency of the assignments made by PPS+, the generic PPS model, MEGAN4, Kraken and taxator-tk of the human gut dataset (Supplemental Information 1, Section 3.2.1) computed using different definitions (Supplemental Information 1, Section 3.10). Bold numbers correspond to the best values, whereas italic numbers indicate the worst values.