
Inflammation and fibrosis in the coal dust-exposed lung described by confocal Raman spectroscopy
- Published
- Accepted
- Received
- Academic Editor
- Gwyn Gould
- Subject Areas
- Biochemistry, Cell Biology, Toxicology, Public Health, Histology
- Keywords
- Confocal Raman spectroscopy, Biochemical compositions, Collagen, Fibrosis, Lung inflammation, Coal workers’ pneumoconiosis
- Copyright
- © 2022 Wang et al.
- Licence
- This is an open access article distributed under the terms of the Creative Commons Attribution License, which permits using, remixing, and building upon the work non-commercially, as long as it is properly attributed. For attribution, the original author(s), title, publication source (PeerJ) and either DOI or URL of the article must be cited.
- Cite this article
- 2022. Inflammation and fibrosis in the coal dust-exposed lung described by confocal Raman spectroscopy. PeerJ 10:e13632 https://doi.org/10.7717/peerj.13632
Abstract
Background
Coal workers’ pneumoconiosis (CWP) is an occupational disease that severely damages the life and health of miners. However, little is known about the molecular and cellular mechanisms changes associated with lung inflammation and fibrosis induced by coal dust. As a non-destructive technique for measuring biological tissue, confocal Raman spectroscopy provides accurate molecular fingerprints of label-free tissues and cells. Here, the progression of lung inflammation and fibrosis in a murine model of CWP was evaluated using confocal Raman spectroscopy.
Methods
A mouse model of CWP was constructed and biochemical analysis in lungs exposed to coal dust after 1 month (CWP-1M) and 3 months (CWP-3M) vs control tissues (NS) were used by confocal Raman spectroscopy. H&E, immunohistochemical and collagen staining were used to evaluate the histopathology alterations in the lung tissues.
Results
The CWP murine model was successfully constructed, and the mouse lung tissues showed progression of inflammation and fibrosis, accompanied by changes in NF-κB, p53, Bax, and Ki67. Meanwhile, significant differences in Raman bands were observed among the different groups, particularly changes at 1,248, 1,448, 1,572, and 746 cm−1. These changes were consistent with collagen, Ki67, and Bax levels in the CWP and NS groups.
Conclusion
Confocal Raman spectroscopy represented a novel approach to the identification of the biochemical changes in CWP lungs and provides potential biomarkers of inflammation and fibrosis.
Introduction
Coal workers’ pneumoconiosis (CWP) develops from inhaling coal dust or mineral dust particles. As of 2018, there were 97,500 reported occupational diseases in China, and 90% of them were pneumoconiosis (Yuan et al., 2022). CWP patients have extensive fibrosis of the lung tissue, twisty, narrow, or distorted bronchi, and complications such as chronic obstructive pulmonary disease (COPD), which damages pulmonary function. In addition, coal dust particles in lung tissue can produce a variety of toxic effects, including oxidative stress, oxidative DNA damage, an acute stress reaction, and damage to large molecules such as lipoproteins (León-Mejía et al., 2018). The pathogenesis of CWP fibrosis has been reported to be the result of a continuous interaction between the coal dust particles and the chronic inflammatory response of the lung (Perret et al., 2017).
As a non-destructive technique for measuring biological tissue, confocal Raman spectroscopy provides accurate molecular fingerprints of label-free tissues and cells (Li et al., 2020). The spatial distribution of particular components is obtained by Raman spectroscopy, and 3D structural information from tissues has been constructed to identify each component of samples (Kang, Nguyen & Lue, 2021). Confocal Raman spectroscopy has been successfully used in tumor cell identification (Wen et al., 2021), stem cell research (Hsu et al., 2020), and the analysis of drug-resistant bacteria (Lu et al., 2022), and toxicology analysis (Zitouni et al., 2020). Several murine models of the effects of particulate matter on lung inflammation and damage have been constructed, with the types of particulate matter mainly including coarse and fine particulate matter, coal fly ash, and coal mine dust (Albrecht et al., 2002; Finnerty et al., 2007; Happo et al., 2008; Hargrove et al., 2018; Lee et al., 2021b). Our recent study reported confocal Raman spectroscopy to evaluate lung inflammation and injury in silicosis (Wang et al., 2022). We wonder if Raman spectroscopy could be extended to characterize other lung inflammation and fibrosis types, such as coal dust-induced inflammation and fibrosis.
In this study, an observation of pathological changes in lung tissue was carried out using a mouse model of CWP. Additionally, the changes in the nucleic acid, protein, and collagen of the mouse pneumoconiosis lungs were detected by Raman spectroscopy. We additionally analyzed the expression levels of NF-κB, p53, Bax, and Ki67 in lung tissues by immunohistochemical staining, finding that their levels were consistent with the Raman bands observed within the different groups. Thus, our work provides a novel approach for identifying the biochemical changes in lung tissues after coal dust exposure and represents a significant resource for understanding the mechanism of CWP.
Materials and Methods
Animals and coal dust
All animal studies were carried out in accordance with the National Institutes of Health’s Guide for the Care and Use of Laboratory Animals (NIH Publication No. 8023, revised 1978) and were approved by the Anhui University of Science and Technology’s Institutional Animal Care and Use Committee (No. 2020006). Changzhou Cavion Experimental Animal Co., Ltd. (license number SCXY (Su) 2011-0003) provided six to eight-week-old C57BL/6 male mice. The mice were housed in filtered-air ventilated cages with ad libitum access to food and drink in an environment with a 12-h light/dark cycle, temperature of 24 ± 1 °C, and humidity of 50 ± 5%.
Coal dust particles were collected in a coal mine in Anhui Province, China. The distribution of the particle size and the microelement content were analyzed in our previous study (Mu et al., 2022).
CWP mouse model
A CWP mouse model was established via the nasal inhalation of coal dust particles. The murine model was reported previously (Mu et al., 2022). Briefly, 20 mice were randomly divided into two groups: a control group (NS) and a coal dust exposure group. The mice were anesthetized by isoflurane inhalation and intranasally administered into the lung twice per week for 4 weeks (50 mg/ml/80 µl per week), and the NS group were administered saline (vehicle control). After 1 month, half of each group of mice was sacrificed. The experimental design is shown in Fig. 1.

Figure 1: Experimental design.
Mice were slightly anesthetized with isoflurane inhalation and coal dust particles were intranasally administered into their lungs at 4 mg/week for 4 weeks. Subsequently, the respiratory function of the mice was tested after 1 and 3 months before they were sacrificed. Lung tissue sections were obtained to evaluate changes in biochemical compositions using confocal Raman spectroscopy, in conjunction with immunohistochemistry and other staining methods.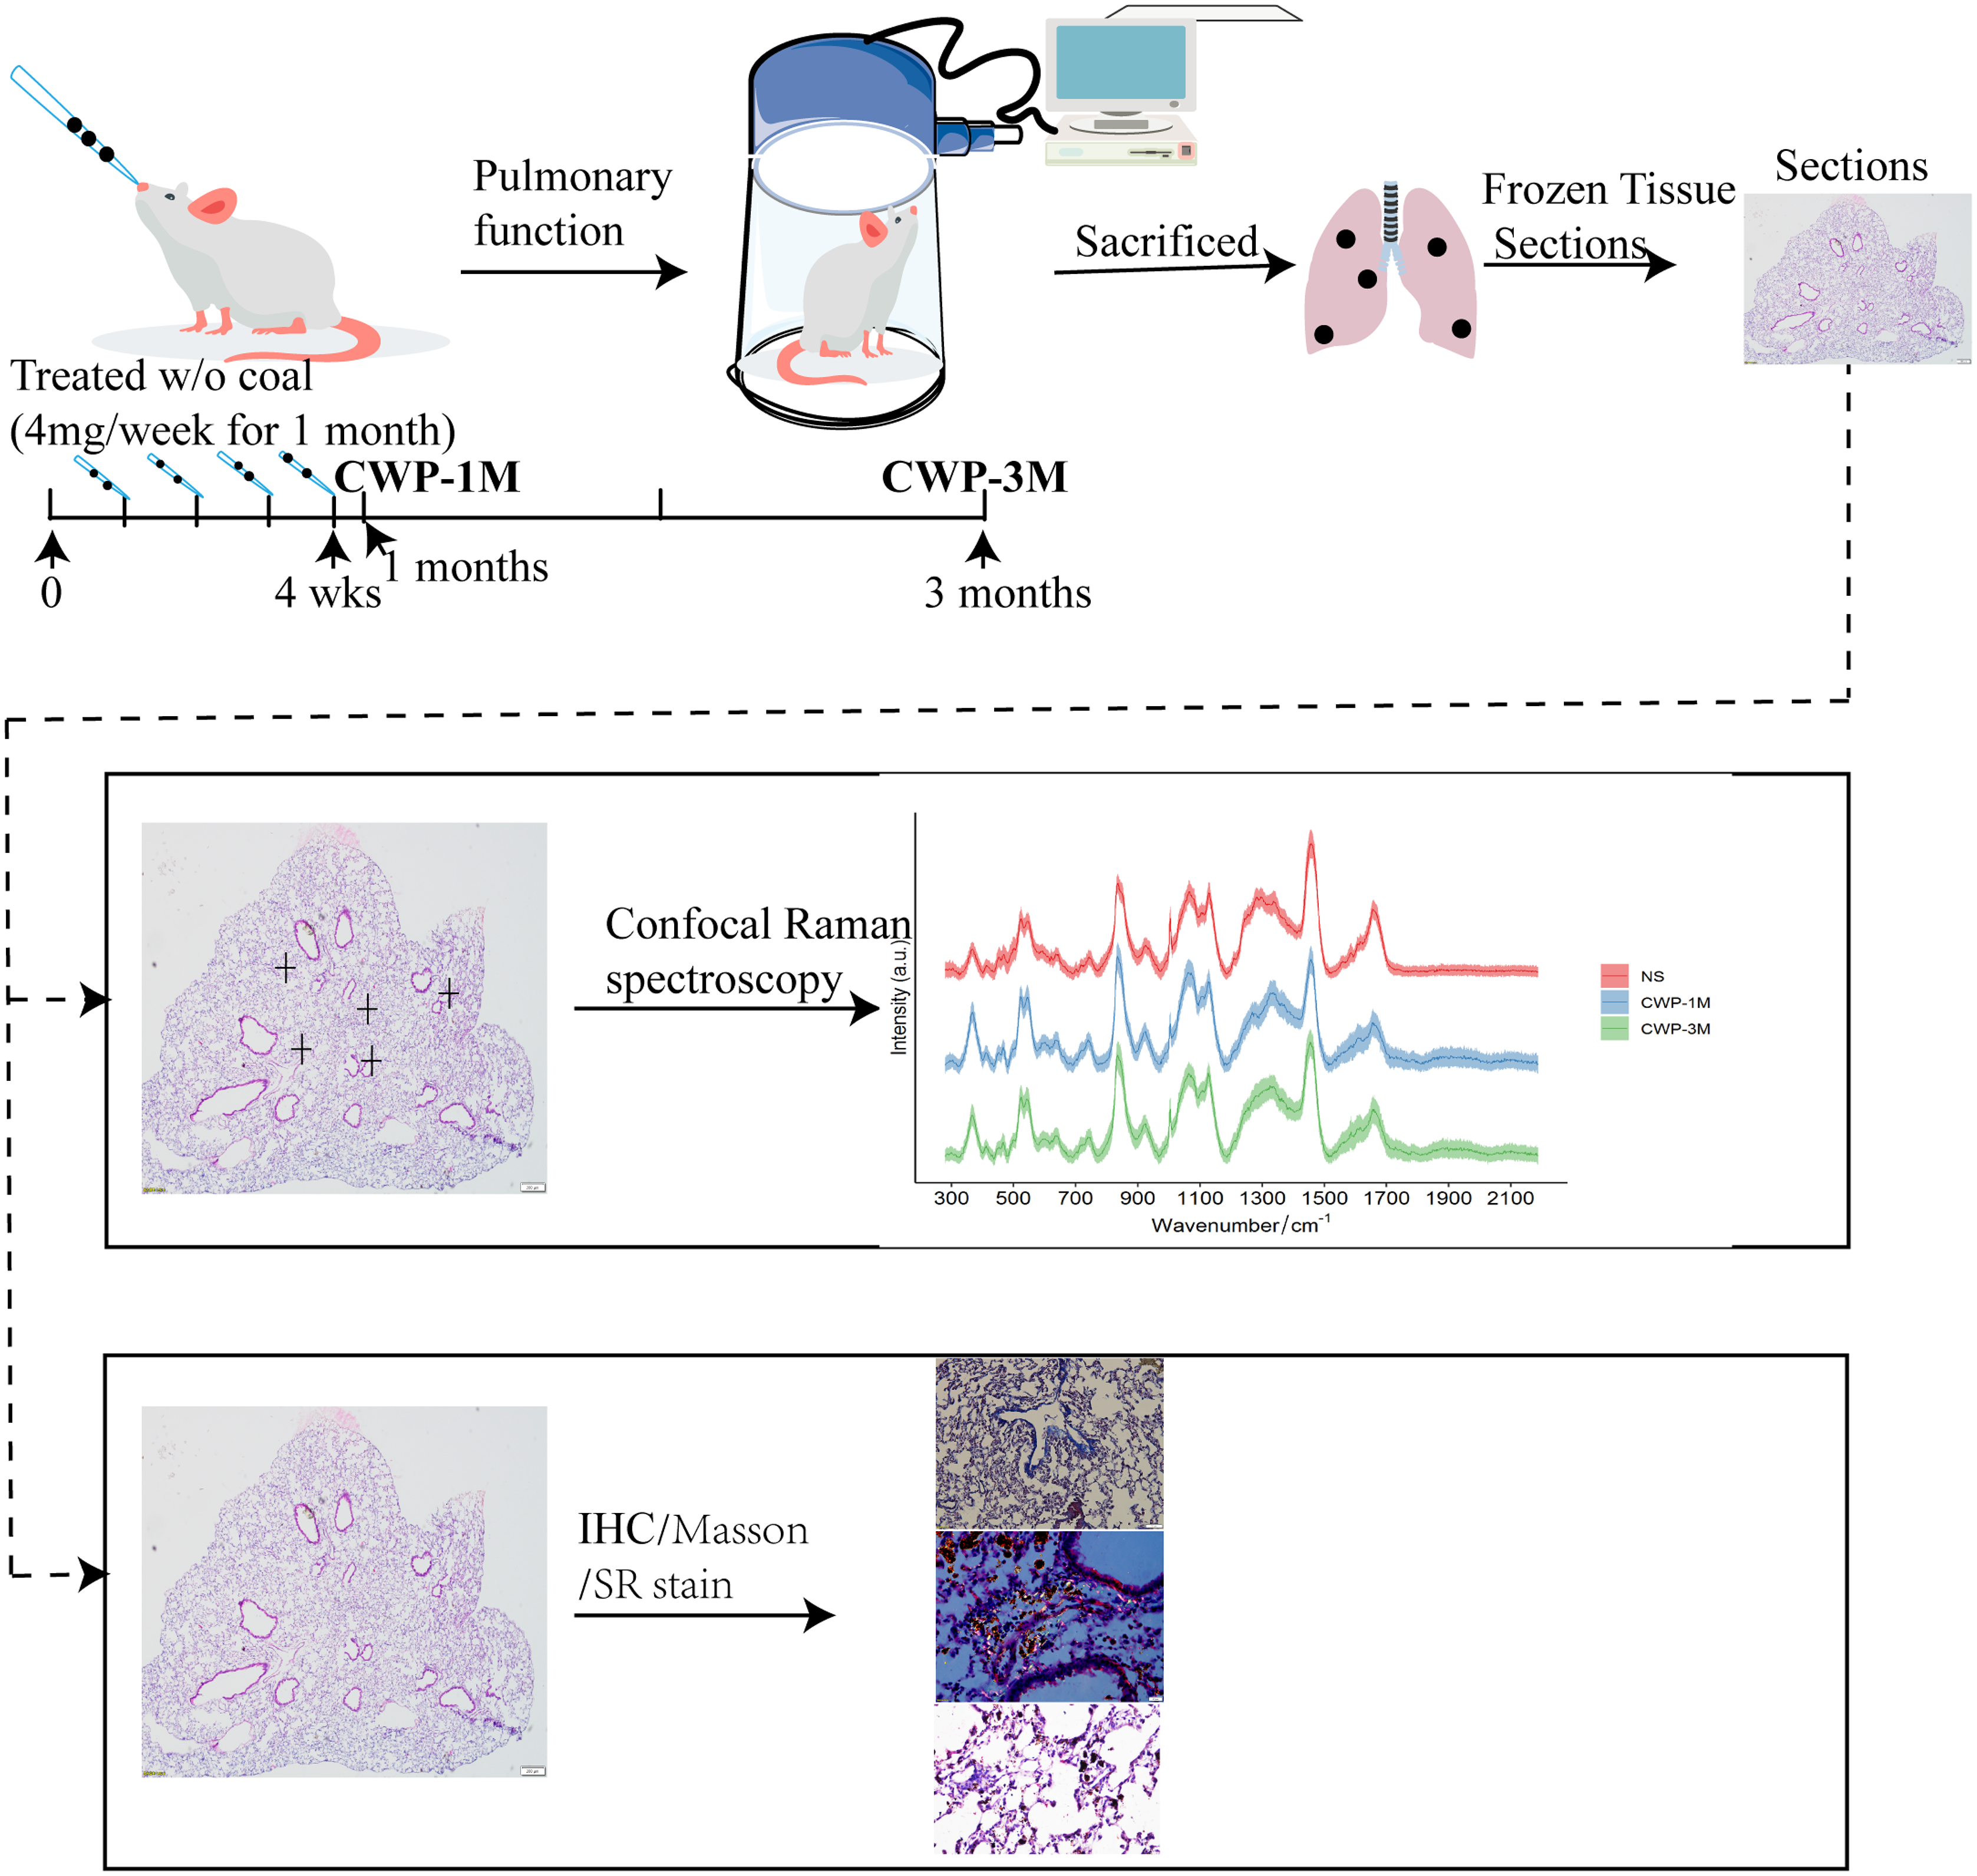
Pulmonary function test
As described previously (Sun et al., 2021), mice were placed in a whole-body plethysmograph (WBP-4MR, Shanghai, China). After 30 min of acclimation in the cavity, inspiration time (Ti), tidal volume (Tv), expiration time (Te), and breath frequency were recorded by software (ResMass 1.4.2, Shanghai, China).
Lung tissue preparation
After determination of pulmonary function, mice were sacrificed by cervical dislocation and the lung tissues were obtained. The samples were placed on a tissue base mold and covered with cryo-embedding media for frozen sections. After that, the frozen tissue was sliced into 5 μm (Leica CM 1950; Leica Nussloch, Germany). The frozen sections were used for Raman spectroscopy analysis and pathological staining.
Raman instrumentation
To collect Raman data, we used an Alpha300R confocal Raman microscope with a 532-nm excitation laser diode (WITec, Ulm, Germany). A 100× objective (numerical aperture, 0.9; ZEISS, Oberkochen, Germany) for incident laser beam focusing was used to conduct Raman scattering measurements at a 2-cm−1 spectral resolution and 1,200-g/mm grating. With LabSpec six, all SCRS were preprocessed with comic ray correction and polyline baseline fitting (Horiba Scientific, Kyoto, Japan). The entire spectrum region was vector normalized for spectral normalization. Vector normalization was chosen to address general instrumentation variability and sample and experimental factors (e.g., sample thickness) without significantly affecting the biological content. Normalizing a specific biocomponent was used to eliminate any presumptions of specific biomolecular alterations.
Section staining
For hematoxylin and eosin (H&E) staining of frozen tissue sections, we used the standard H & E process. Briefly, we stained the tissue with Mayer’s hematoxylin (C0105S; Beyotime, Shanghai, China), rinsed them in distilled water for 5 min, and stained them with eosin (C0105S; Beyotime, Shanghai, China) for 7 min. Finally, the sections’ dehydration, clearing, and sealing were conducted as standard.
For Masson’s staining of frozen tissue sections, we used Masson’s Trichrome Stain Kit (G1340; Solarbio, Beijing, China). Briefly, fixed frozen sections were rinsed three times in distilled water, submerged in Weigert’s iron hematoxylin for 7 min, and washed twice with distilled water. Next, acid ethanol differentiation was conducted for 10 s, and the sections were then rinsed in distilled water. Ponceau S was used for 15 min, and the sections were twice washed with double distilled water. After that, the slices were stained for 10 min with phosphomolybdic acid solution. the solution was discarded, and the sections were stained with aniline blue solution for 5 min. Next, the sections were rinsed once for 2–3 s with double distilled water. Finally, dehydration, clearing, and sealing the sections were conducted as usual.
For Sirius Red staining of frozen tissue sections, we used a Sirius Red staining kit (SBJ-0294; SenBeiJia Biological Technology, Co., Ltd., Nanjing, China). Briefly, fixed frozen sections were rinsed three times in distilled water and then stained with picrosirius red solution for 60 min. Then, the slide was rinsed with acetic acid solution and stained with Mayer’s hematoxylin for 10 min. Finally, dehydration, clearing, and sealing of the sections were performed as usual.
For immunohistochemical staining, fixed frozen sections were rinsed in distilled water three times, and the Quick Antigen Retrieval Solution (P0090; Beyotime, Shanghai, China) was used for antigen retrieval. Next, 3% bovine serum albumin was used to block nonspecific binding, and the sections were incubated at 4 °C overnight with anti-Ki67 antibody (ab15580; Abcam, Cambridge, UK; 1:500 dilution), anti-NF-κB (8242S; Cell Signaling Technology, Danvers, MA, USA; 1:1,000 dilution), anti-p53 (10442-1-AP; Proteintech, Rosemont, IL, USA; 1:200 dilution), and anti-Bax (26593-1-AP; Proteintech, Rosemont, IL, USA; 1:500 dilution). After three washes in phosphate-buffered saline, the slides were incubated with secondary antibodies (ImmPRESS®-AP Horse Anti-Mouse/Rabbit IgG Polymer Detection Kit, Alkaline Phosphatase, MP-5402, MP-5401, Vector) at room temperature for 1 h and washed three times with phosphate-buffered saline. Alkaline phosphatase was used as the chromogen for 1 h. Next, the sections were counterstained with hematoxylin. Finally, dehydration and sealing of slices were performed as standard. No primary antibody was used in the negative control.
Trained pathologists count the number of positive cells in the appropriate fields per section to avoid the false positive inclusion of debris staining.
Data analysis
All spectrum data were used for principal component analysis (PCA) and linear discriminant analysis (LDA) in multivariate analysis, and data were presented as mean ± standard error of the mean (SEM). One-way ANOVA with post hoc Tukey’s test was used throughout the study. P < 0.05 was considered statistically significant. ImageJ software was used for localization quantitation.
Results
Coal dust exposure causes weight loss with lung inflammation and respiratory impairment
The body weight of mice in the CWP group decreased rapidly on the third day after exposure and was below baseline with continuous exposure on the 15th day before recovering slowly after the coal dust exposure stopped (Fig. 2A). Pulmonary function tests were carried out using whole-body plethysmography to evaluate the effect of coal dust exposure on mouse lung function. There was a significant difference in breathing frequency between the NS and CWP-3M groups (mean = 11,641, one-way ANOVA, q = 4.018, p = 0.0368, n = 5, df = 12). Consistently, the Ti/Te ratios were significantly lower in the CWP-1M and CWP-3M groups than in the NS group (CWP-1M vs NS: mean = 0.5790, q = 5.051, p = 0.0099, n = 5, df = 12; CWP-3M vs NS: mean = 0.6087, q = 4.398, p = 0.0228, n = 5, df = 12). In the NS group, the mice had a balanced Ti/Te ratio close to 1.0, with Ti and Te of equal durations. However, after exposure to coal dust, the Ti/Te ratio of the mice decreased, indicating an asymmetric breathing cycle. Overall, these results showed that mice in the CWP-1M and CWP-3M groups had declined lung functions. As shown in Fig. 2C, the inflammatory cells in the lung tissues of the mice in the NS group were slightly infiltrated, and the alveolar structure was normal. Inflammatory cell infiltration was found in the coal dust-exposed lung tissue of the CWP-1M group, and the alveolar structure was badly destroyed, with the tracheal wall thickening. Inflammatory cell infiltration was more apparent in the lungs of the CWP-3M group mice than in the CWP-1M group, especially around the trachea with the accumulation of coal dust particles and the interstitial inflammation was further aggravated (Fig. 2C).
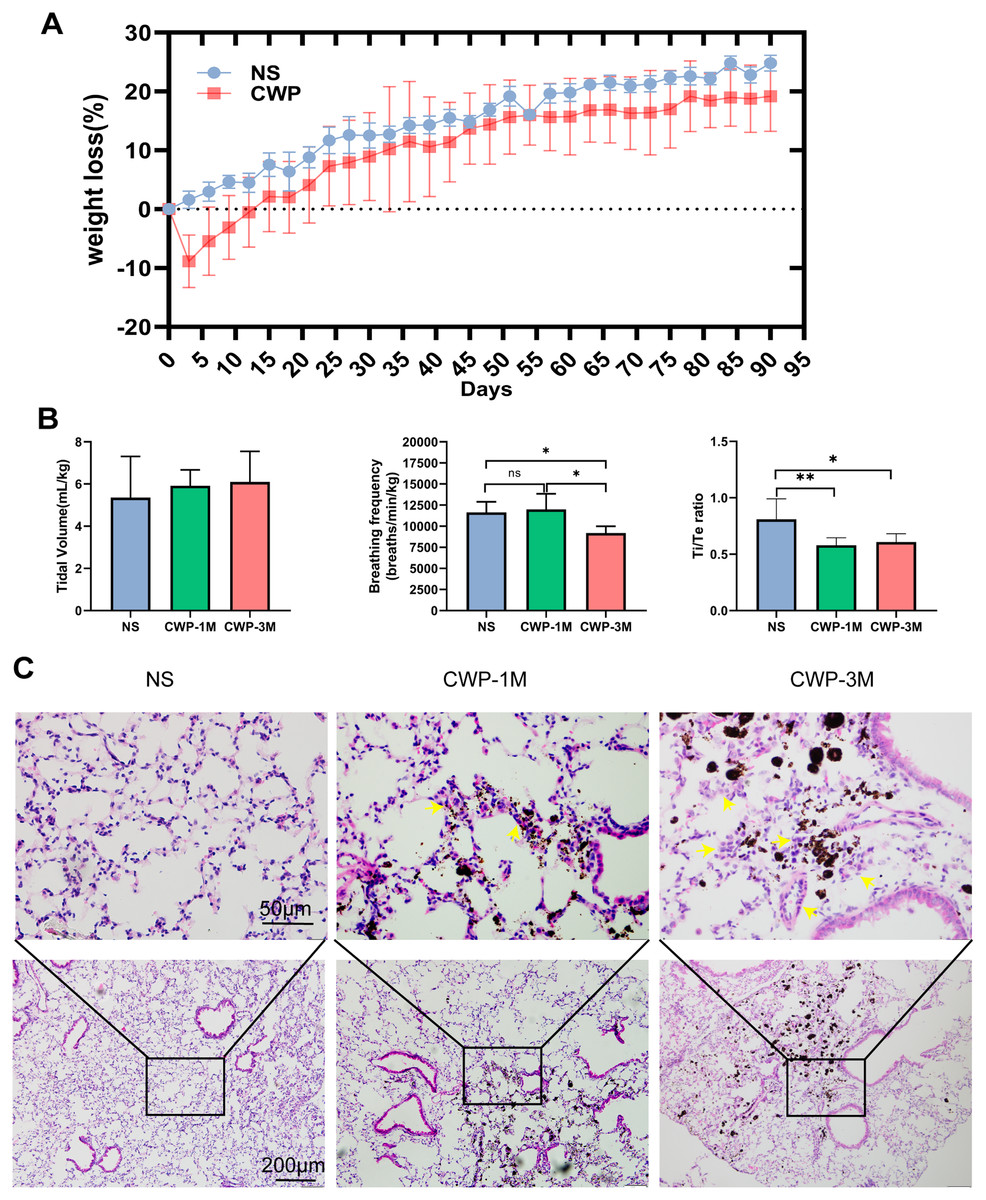
Figure 2: Exposure of mice to coal dust causes weight loss and induces apparent pulmonary inflammation.
(A) Body weight was measured every 3 days. (B) Pulmonary tidal volume, breathing frequency, and the Ti/Te ratio after exposure of mice to coal dust particles. n = 5, *P < 0.05, **P < 0.01 vs the saline (NS) group. (C) Representative H & E staining of lung tissues from the different groups (400× magnification, scale bar = 50 μm; 200× magnification, scale bar = 200 μm). (NS, saline group; CWP-1M, coal dust exposure for 1 month; CWP-3M, coal dust exposure for 3 months).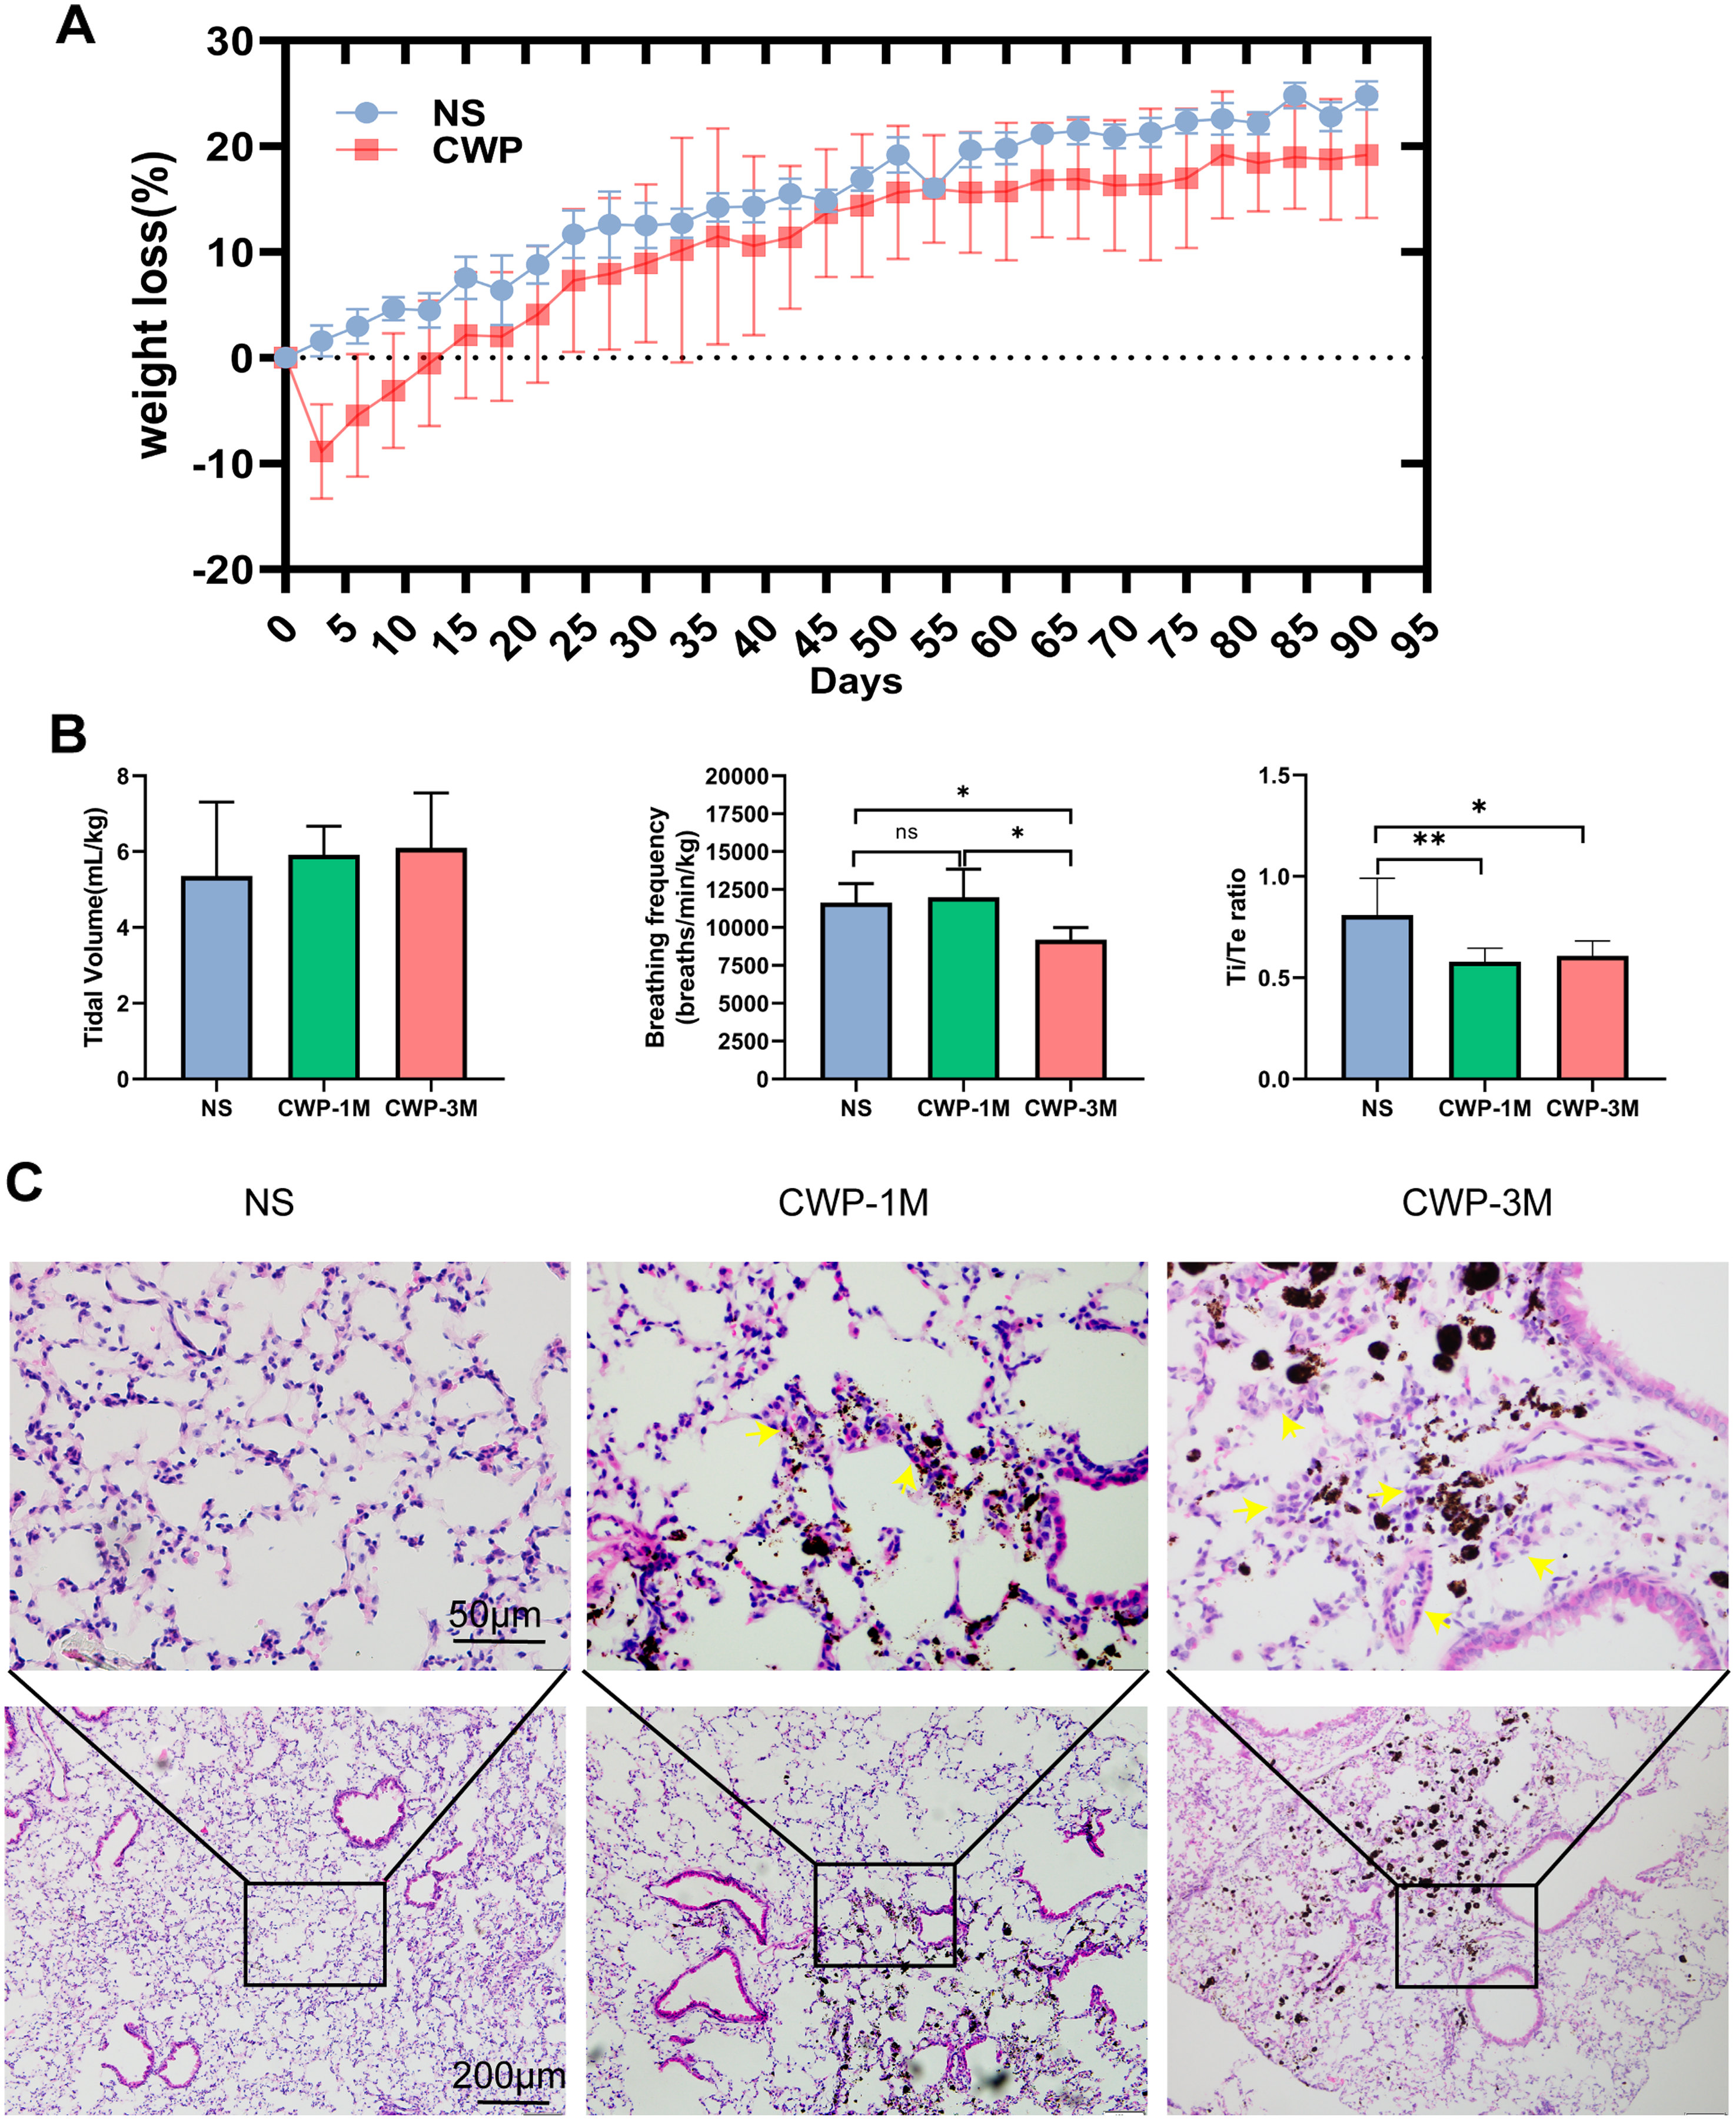
Coal dust exposure causes changes in biochemical components detected by Raman spectroscopy
Confocal Raman microscopy was used to determine the effect of coal dust particles on lung tissues and detect the changes in these tissues’ physical and chemical properties in the lung tissues of the three groups. In the CWP groups, the Raman spectra of lung tissue sections revealed a distinct band assignment indicating alterations in different cell components (Fig. 3A). The differences in Raman peak intensity across the groups reflected differences in cell metabolism and lung tissue components exposed to coal dust particles. Table 1 lists all of the band assignments detected by confocal Raman spectroscopy. Significant changes were evident in cholesterol (548 and 1,087 cm−1), lipids (1,080 and 1,465 cm−1), amino acids (750, 850, 1,004, 1,036, 1,123, and 1,552 cm−1), nucleic acid (1,572 cm−1), cytochrome C (746 cm−1), and, most importantly, the fingerprint region (1,248 and 1,448 cm−1), which represents collagen.
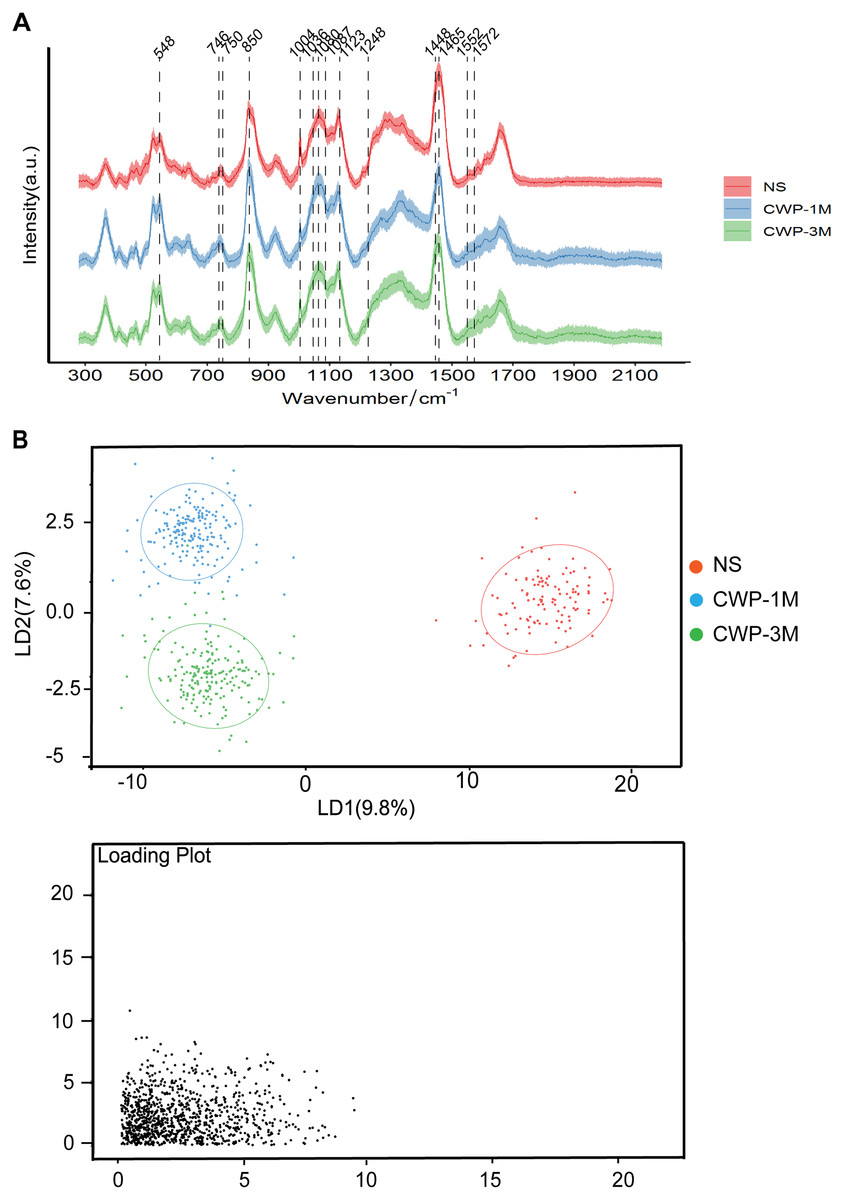
Figure 3: Coal dust exposure causes changes in the biochemical components detected by Raman spectroscopy.
(A) The fingerprint regions of average Raman spectra collected from NS, CWP-1M, and CWP-3M mice. The variations in the Raman spectrum characteristics among the different groups are labeled. (B) LDA distinguished three groups. (NS, saline group; CWP-1M, coal dust exposure for 1 month; CWP-3M, coal dust exposure for 3 months).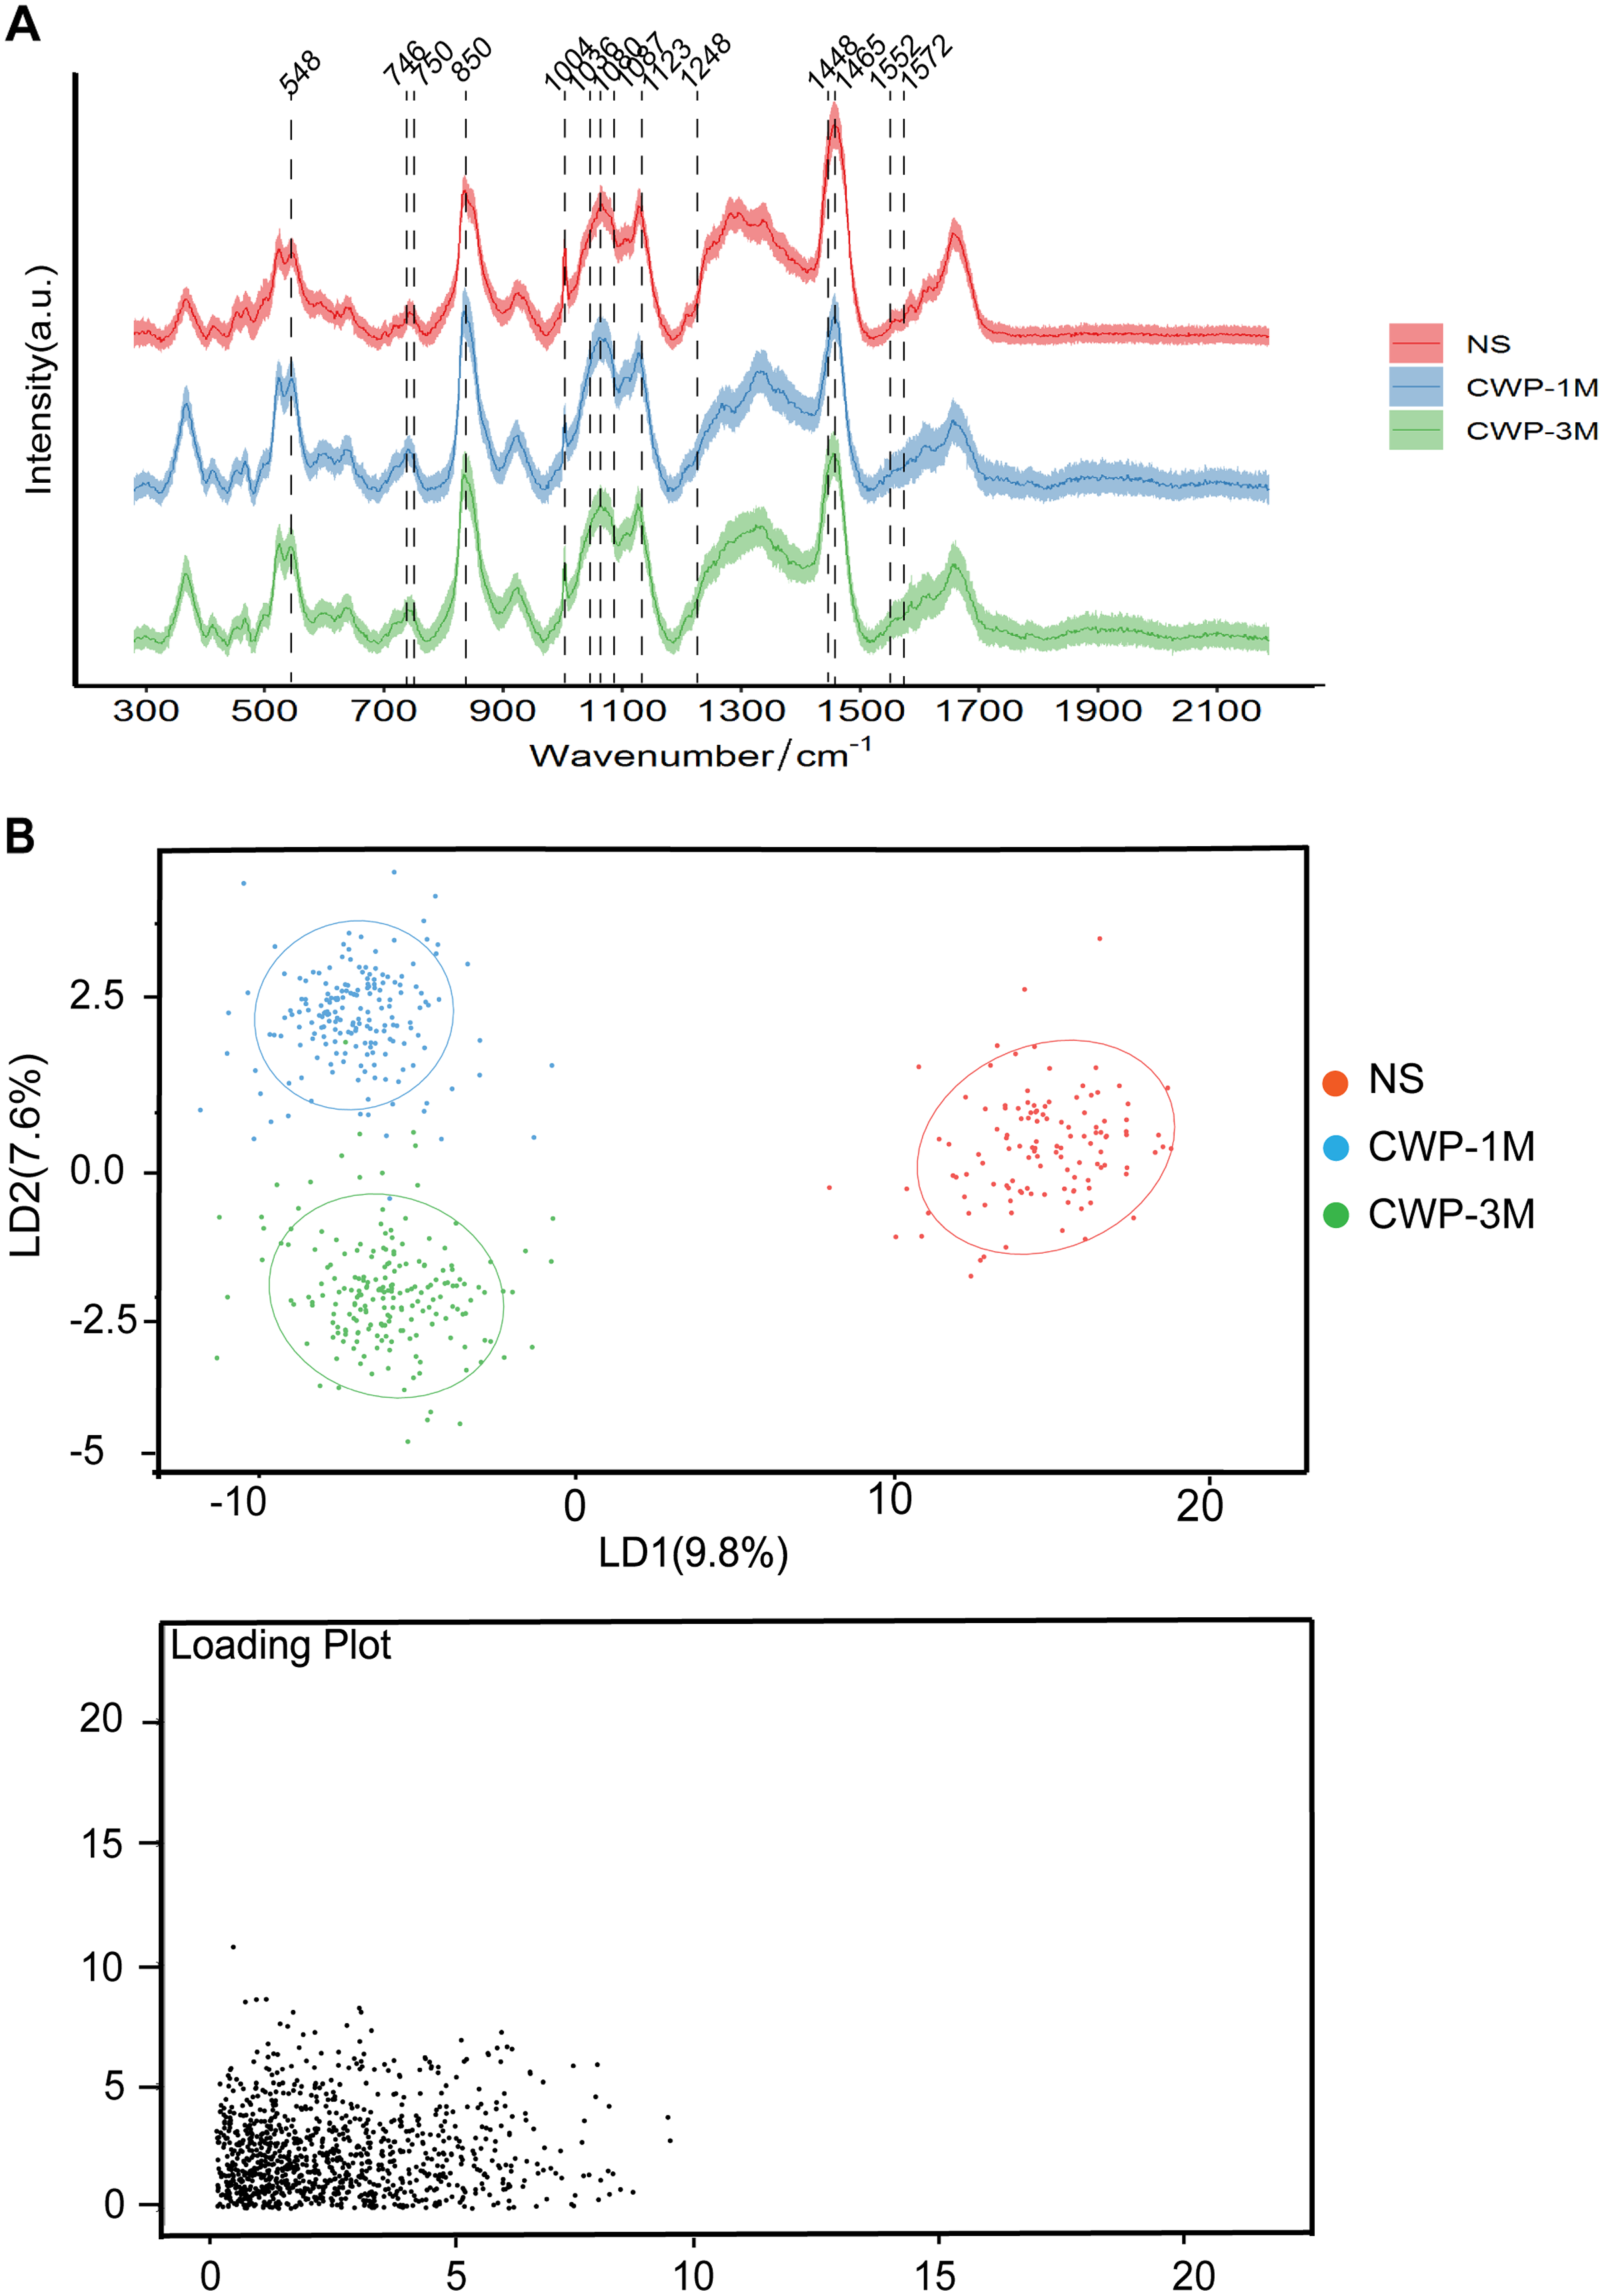
| Raman wavenumber (cm−1) |
Biomolecule assignment | Molecular vibration | References |
|---|---|---|---|
| 548 | Cholesterol | Bending vibrations of (C–H) | Czamara et al. (2015) |
| 746 | Cytochrome C | ν(pyr breathing); ν(C-C) | Okada et al. (2012), Zhang, Ge & Yu (2021) |
| 750 | Tryptophan | Symmetric breathing | Song et al. (2020a) |
| 850 | Tyrosine, proline | ν(C-C), δ(CCH)ring breathing | Song et al. (2020a) |
| 1,004 | Phenylalanine | Ring breathing | Sinica et al. (2019) |
| 1,036 | Arginine | Cγ-Cδ bond | Zhu et al. (2011) |
| 1,080 | Typical phospholipids | P-O stretching vibration | Malini et al. (2006) |
| 1,087 | Cholesterol | C-C stretching | Czamara et al. (2015) |
| 1,123 | proteins | C-N stretching | Song et al. (2020a) |
| 1,248 | Collagen, proline | Amide III of β-sheet | Song et al. (2020b) |
| 1,448 | Collagen, phospholipids | δ(CH2), δ(CH3), δ(CH2) scissoring | Song et al. (2020a) |
| 1,465 | Lipids | Amide I ν(C=C) | Movasaghi, Rehman & Rehman (2007) |
| 1,552 | Tryptophan | ν(C=C) | Song et al. (2020a) |
| 1,572 | Nucleic acids | Ring breathing modes in the DNA bases | Song et al. (2020a) |
PCA (Fig. S1) and LDA (Fig. 3B) were used to reduce the dimension and highlight the spectral signatures of the different groups. The NS, CWP-1M, and CWP-3M groups were clearly separated by LD-1 and LD-2, which accounted for 17.4% of the variance (Fig. 3B). LDA was able to discriminate cell populations better than PCA. The loading plots indicate those spectroscopic features most relevant for this variability.
Comparisons of the Raman band intensity among the different groups
To confirm the variations in lung tissue biomolecules among the different CWP and NS groups, we analyzed the significance of differences in band intensities (Fig. 4). The intensities of the 548 and 1,087 cm−1 cholesterol bands, a result of the bending vibrations of (C–H) and (C–C), were significantly higher in the CWP-1M group than in the NS group (548 cm−1: mean = 0.1348, one-way ANOVA, q = 13.57, p < 0.0001, n = 188, df = 507; 1,087 cm−1: mean = 0.1480, q = 5.761, p = 0.0002, n = 188, df = 507) and CWP-3M group (548 cm−1: mean = 0.1348, one-way ANOVA, q = 11.93, p < 0.0001, n = 188, df = 507; 1,087 cm−1: mean = 0.1480, one-way ANOVA, q = 5.402, p = 0.0004, n = 188, df = 507) (Fig. 4A). These bands reflect changes in cholesterol during cell metabolism and damage, which are reflected in the cell membrane indirectly (Chakraborty et al., 2020). This suggests that 1 month of coal dust exposure damaged the cell membranes. The same was seen for lipids but, interestingly, the intensity of the 1,465 cm−1 lipid band was significantly lower in the CWP-1M group than in the NS group (mean = 0.1981, one-way ANOVA, q = 28.67, p < 0.0001, n = 188, df = 507) and CWP-3M group (mean = 0.1981, one-way ANOVA, q = 11.53, p < 0.0001, n = 188, df = 507) (Fig. 4B). At the lipid band of 1,080 cm−1, the intensity of that of the CWP-1M group was higher than that of the NS (mean = 0.1786, one-way ANOVA, q = 9.095, p < 0.0001, n = 188, df = 507) and CWP-3M group (mean = 0.1786, one-way ANOVA, q = 7.720, p = 0.0136, n = 188, df = 507), and there was no significant difference in the other two groups. This shows that the P–O stretching vibration can better represent the changes in the phospholipid bilayers of the lung tissue cell membrane.

Figure 4: Comparisons of the Raman band intensity among different groups.
Raman band intensities in the different groups were quantified to assess (A) cholesterol (548 and 1,087 cm−1), (B) lipids (1,090 and 1,658 cm−1), and (C) amino acids (750, 850, 1,004, 1,036, 1,123 and 1,552 cm−1). One-way ANOVA with post hoc Tukey’s test was used. The results represent means ± SEM. An asterisk (*) indicates P < 0.05, three asterisks (***) indicate P ≤ 0.001. (NS, saline group; CWP-1M, coal dust exposure for 1 month; CWP-3M, coal dust exposure for 3 months).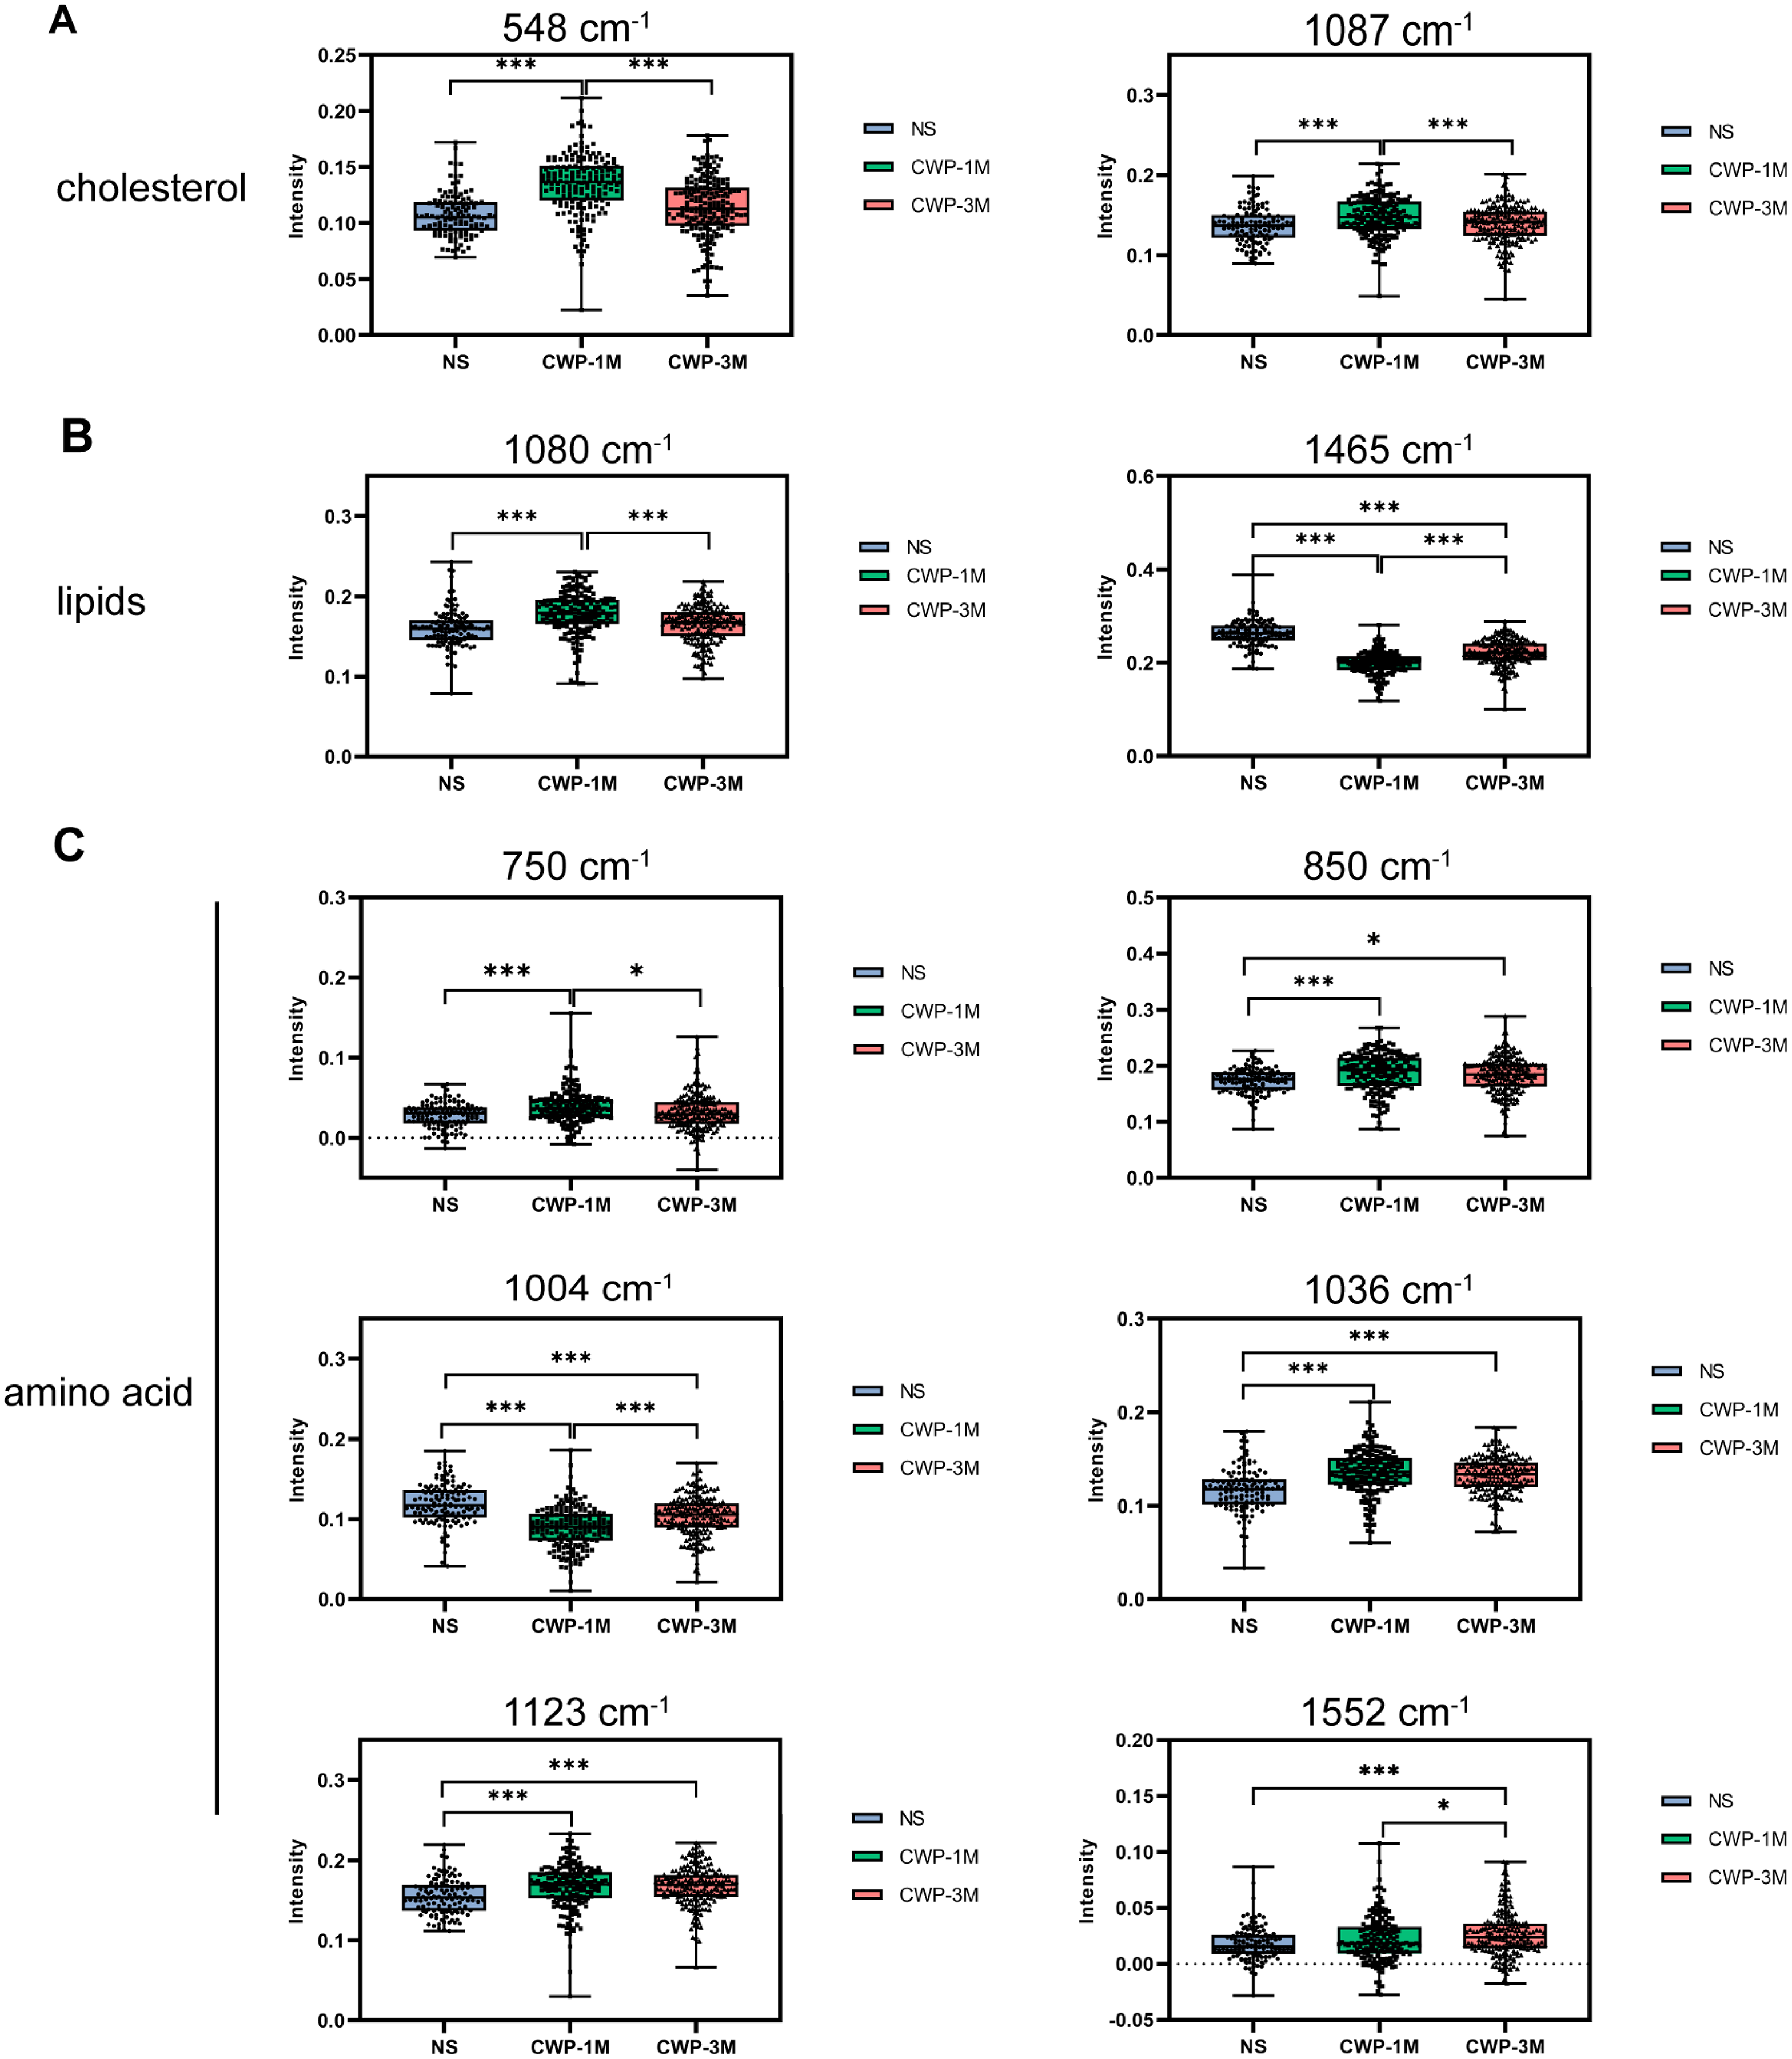
The diverse types of amino acids in lung tissues were dramatically altered following coal dust exposure, as shown in Fig. 4C. The CWP-1M group had higher amino acid content than the NS group, as evidenced by variations in the intensity of the 750, 850, 1,036, 1,123, and 1,552 cm−1 bands. In contrast, in the CWP-1M group, phenylalanine, indicated by 1,004 cm−1, was lower than in the other two groups.
Cholesterol and lipid as potential biomarkers of inflammation in CWP lungs
To further examine the results of the peak Raman spectra, we used immunohistochemical methods to more visually show the changes in the lung tissue after exposure to coal dust. As a key protein in the inflammatory response (Lee et al., 2021a), NF-κB was higher in the CWP-1M group than in the CWP-3M and NS groups and higher in the CWP-3M group than in the NS group (Figs. 5A and 5B). This suggests that there is more inflammation during early exposure than later exposure. The results were consistent with the intensity of the 548 and 1,087 cm−1 cholesterol bands identified by confocal Raman spectroscopy (Fig. 4A). These results were also consistent with the 1,080 cm−1 lipid band. p53 is a particularly prominent transcriptional coregulator of TGF-β1 fibrosis response genes (Higgins et al., 2021). The expression of p53 was especially marked in the CWP-3M group (Figs. 5A and 5C), which was significantly higher than that in the CWP-1M and NS groups (CWP-3M vs CWP-1M, one-way ANOVA, q = 7.562, p = 0.0042, n = 3, df = 6; CWP-3M vs NS, one-way ANOVA, q = 19.70, p < 0.0001, n = 3, df = 6). These findings indicate cholesterol and lipid as potential biomarkers of lung inflammation in CWP lungs.

Figure 5: Coal dust exposure upregulates NF-κB and p53 expression in lung tissue.
(A) NF-κB and p53 were detected in lung tissue from the different groups (400× magnification, scale bar = 50 μm). (B and C) Quantitative results of NF-κB-positive (B) and p53-positive (C) cells per three high-power fields. One-way ANOVA with post hoc Tukey’s test was used. The results represent means ± SEM. An asterisk (*) indicates P < 0.05, two asterisks (**) indicate P ≤ 0.01, three asterisks (***) indicate P ≤ 0.001. (NS, saline group; CWP-1M, coal dust exposure for 1 month; CWP-3M, coal dust exposure for 3 months).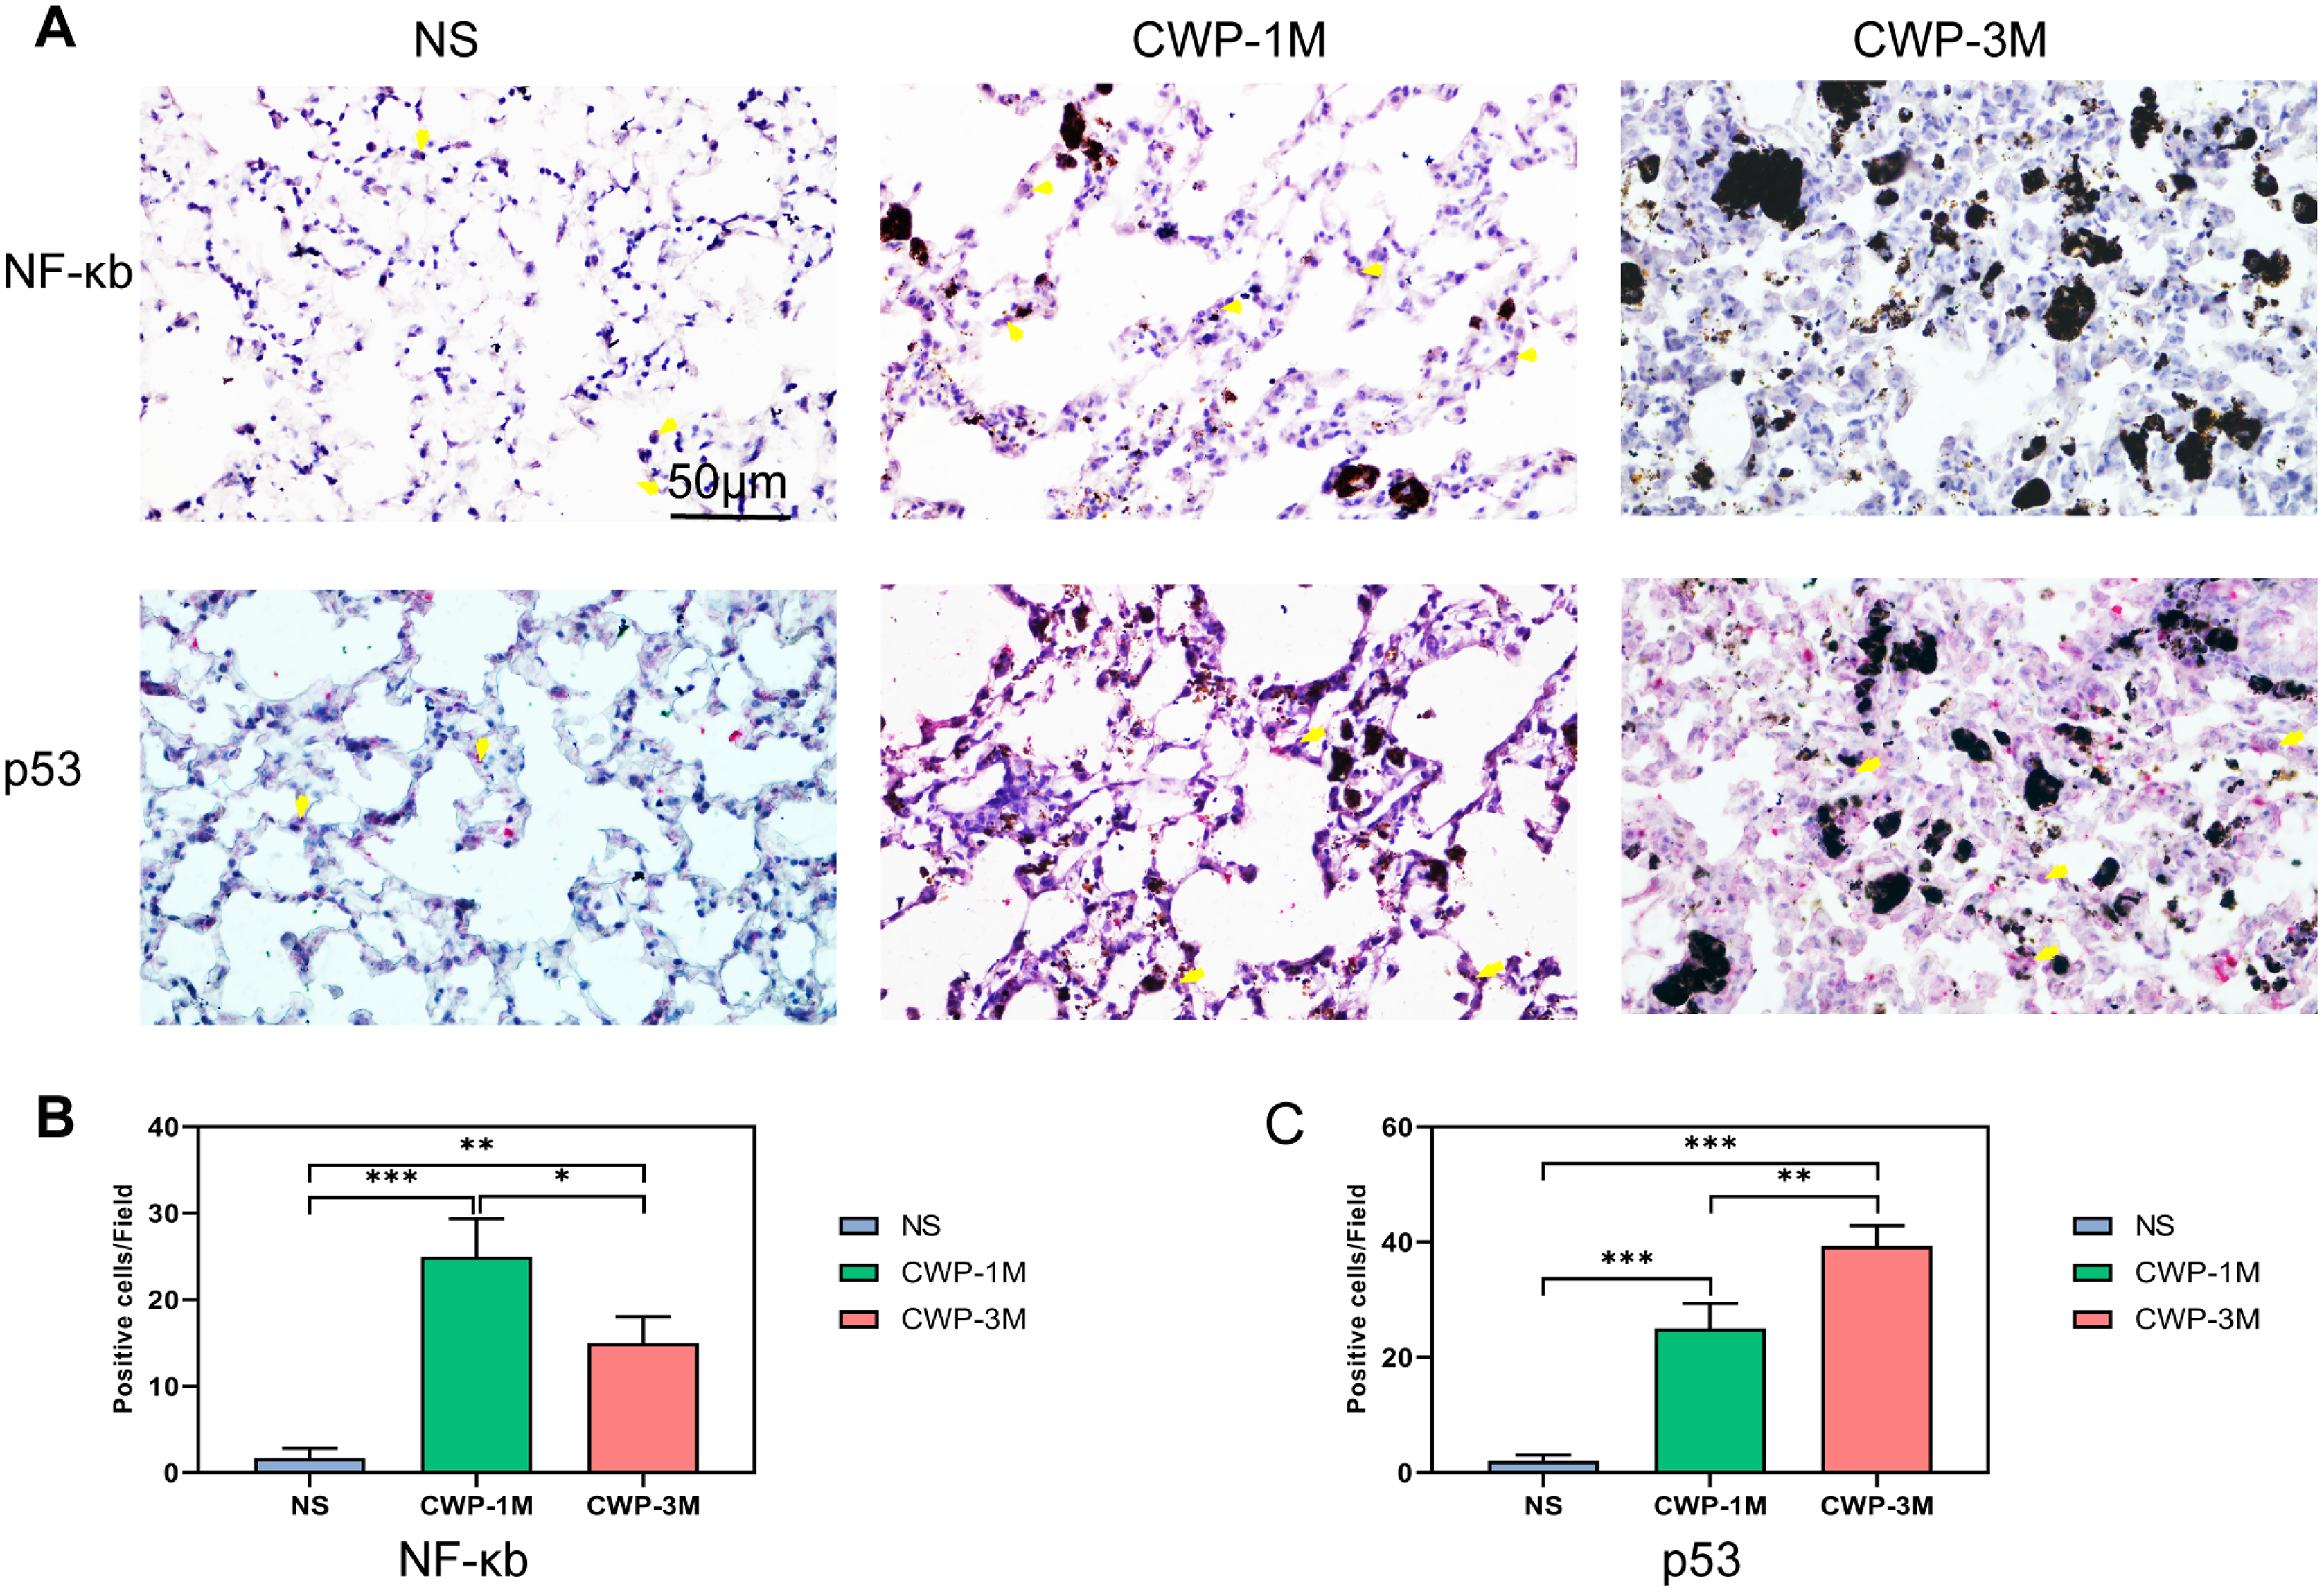
Potential biomarkers of lung proliferation and apoptosis in CWP lungs
To determine if coal dust can cause lung cell proliferation, we used Ki67 as an indicator of proliferation (Jee et al., 2021). The cell proliferation was significantly higher in the CWP-3M group than in the CWP-1M and NS groups. Similarly, the proliferation of the CWP-1M group was higher than that of the NS group (Figs. 6A and 6B). These results were consistent with the intensity of the 1,572 cm−1 nucleic acid band identified by confocal Raman spectroscopy (Fig. 6D). Interestingly, Bax, which is an apoptotic gene (Zhaorigetu et al., 2021), was significantly expressed in the CWP-1M group, but not in the CWP-3M group (Figs. 6A and 6C), and there was no significant difference between the NS and CWP-3M groups (mean = 2.00, one-way ANOVA, q = 0.8464, p = 0.8261, n = 3, df = 6). Similarly, this variation was consistent with the change in cytochrome C. Cytochrome C plays a very important role in cell apoptosis (Zhang, Ge & Yu, 2021), and the changes in cytochrome C showed increasing levels of apoptosis in CWP lungs (Fig. 6E). This phenomenon revealed that both cell proliferation and apoptosis are present in CWP groups, with apoptosis occurring in the early stage and proliferation present at all stages.
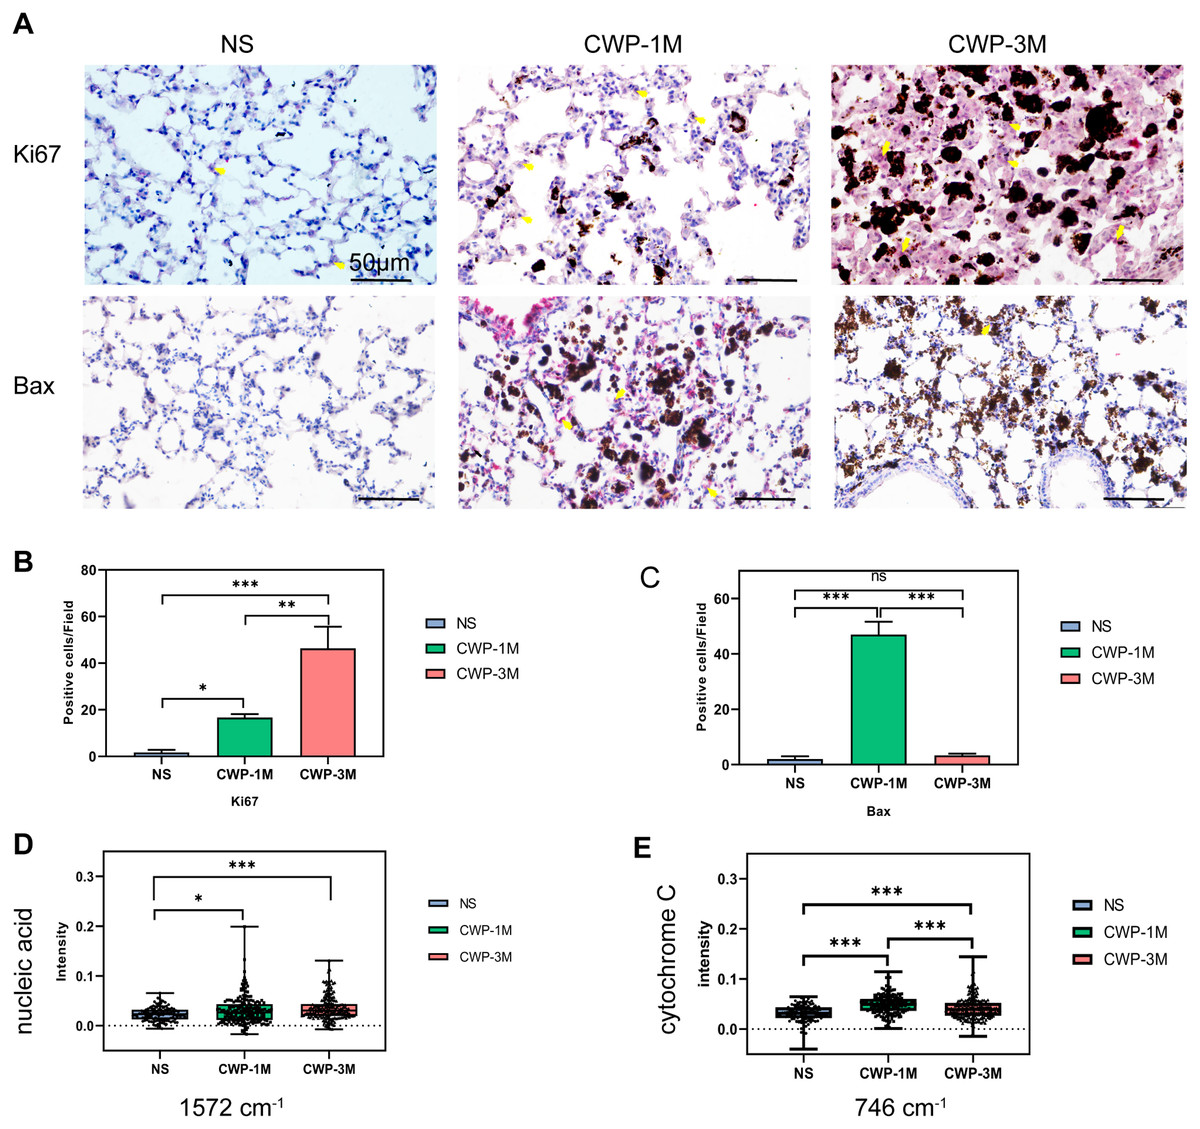
Figure 6: The Raman bands quantified to assess nucleic acid and cytochrome C were identified with Ki67 and Bax expression in lung tissue.
(A) Ki67 and Bax were detected in lung tissue from different groups (400× magnification, scale bar = 50 μm). (B and C) Quantitative results of Ki67-positive (B) and Bax-positive (C) cells per three high-power fields. (D and E) Intensity was semi-quantitatively analyzed to compare differences in the specific bands at (D) 1,572 cm−1 (nucleic acids) and (E) 746 cm−1 (cytochrome C) in different groups. One-way ANOVA with post hoc Tukey’s test was used. The results represent means ± SEM. One asterisk (*) indicates P < 0.05, two asterisks (**) indicate P ≤ 0.01, three asterisks (***) indicate P ≤ 0.001. (NS, saline group; CWP-1M, coal dust exposure for 1 month; CWP-3M, coal dust exposure for 3 months).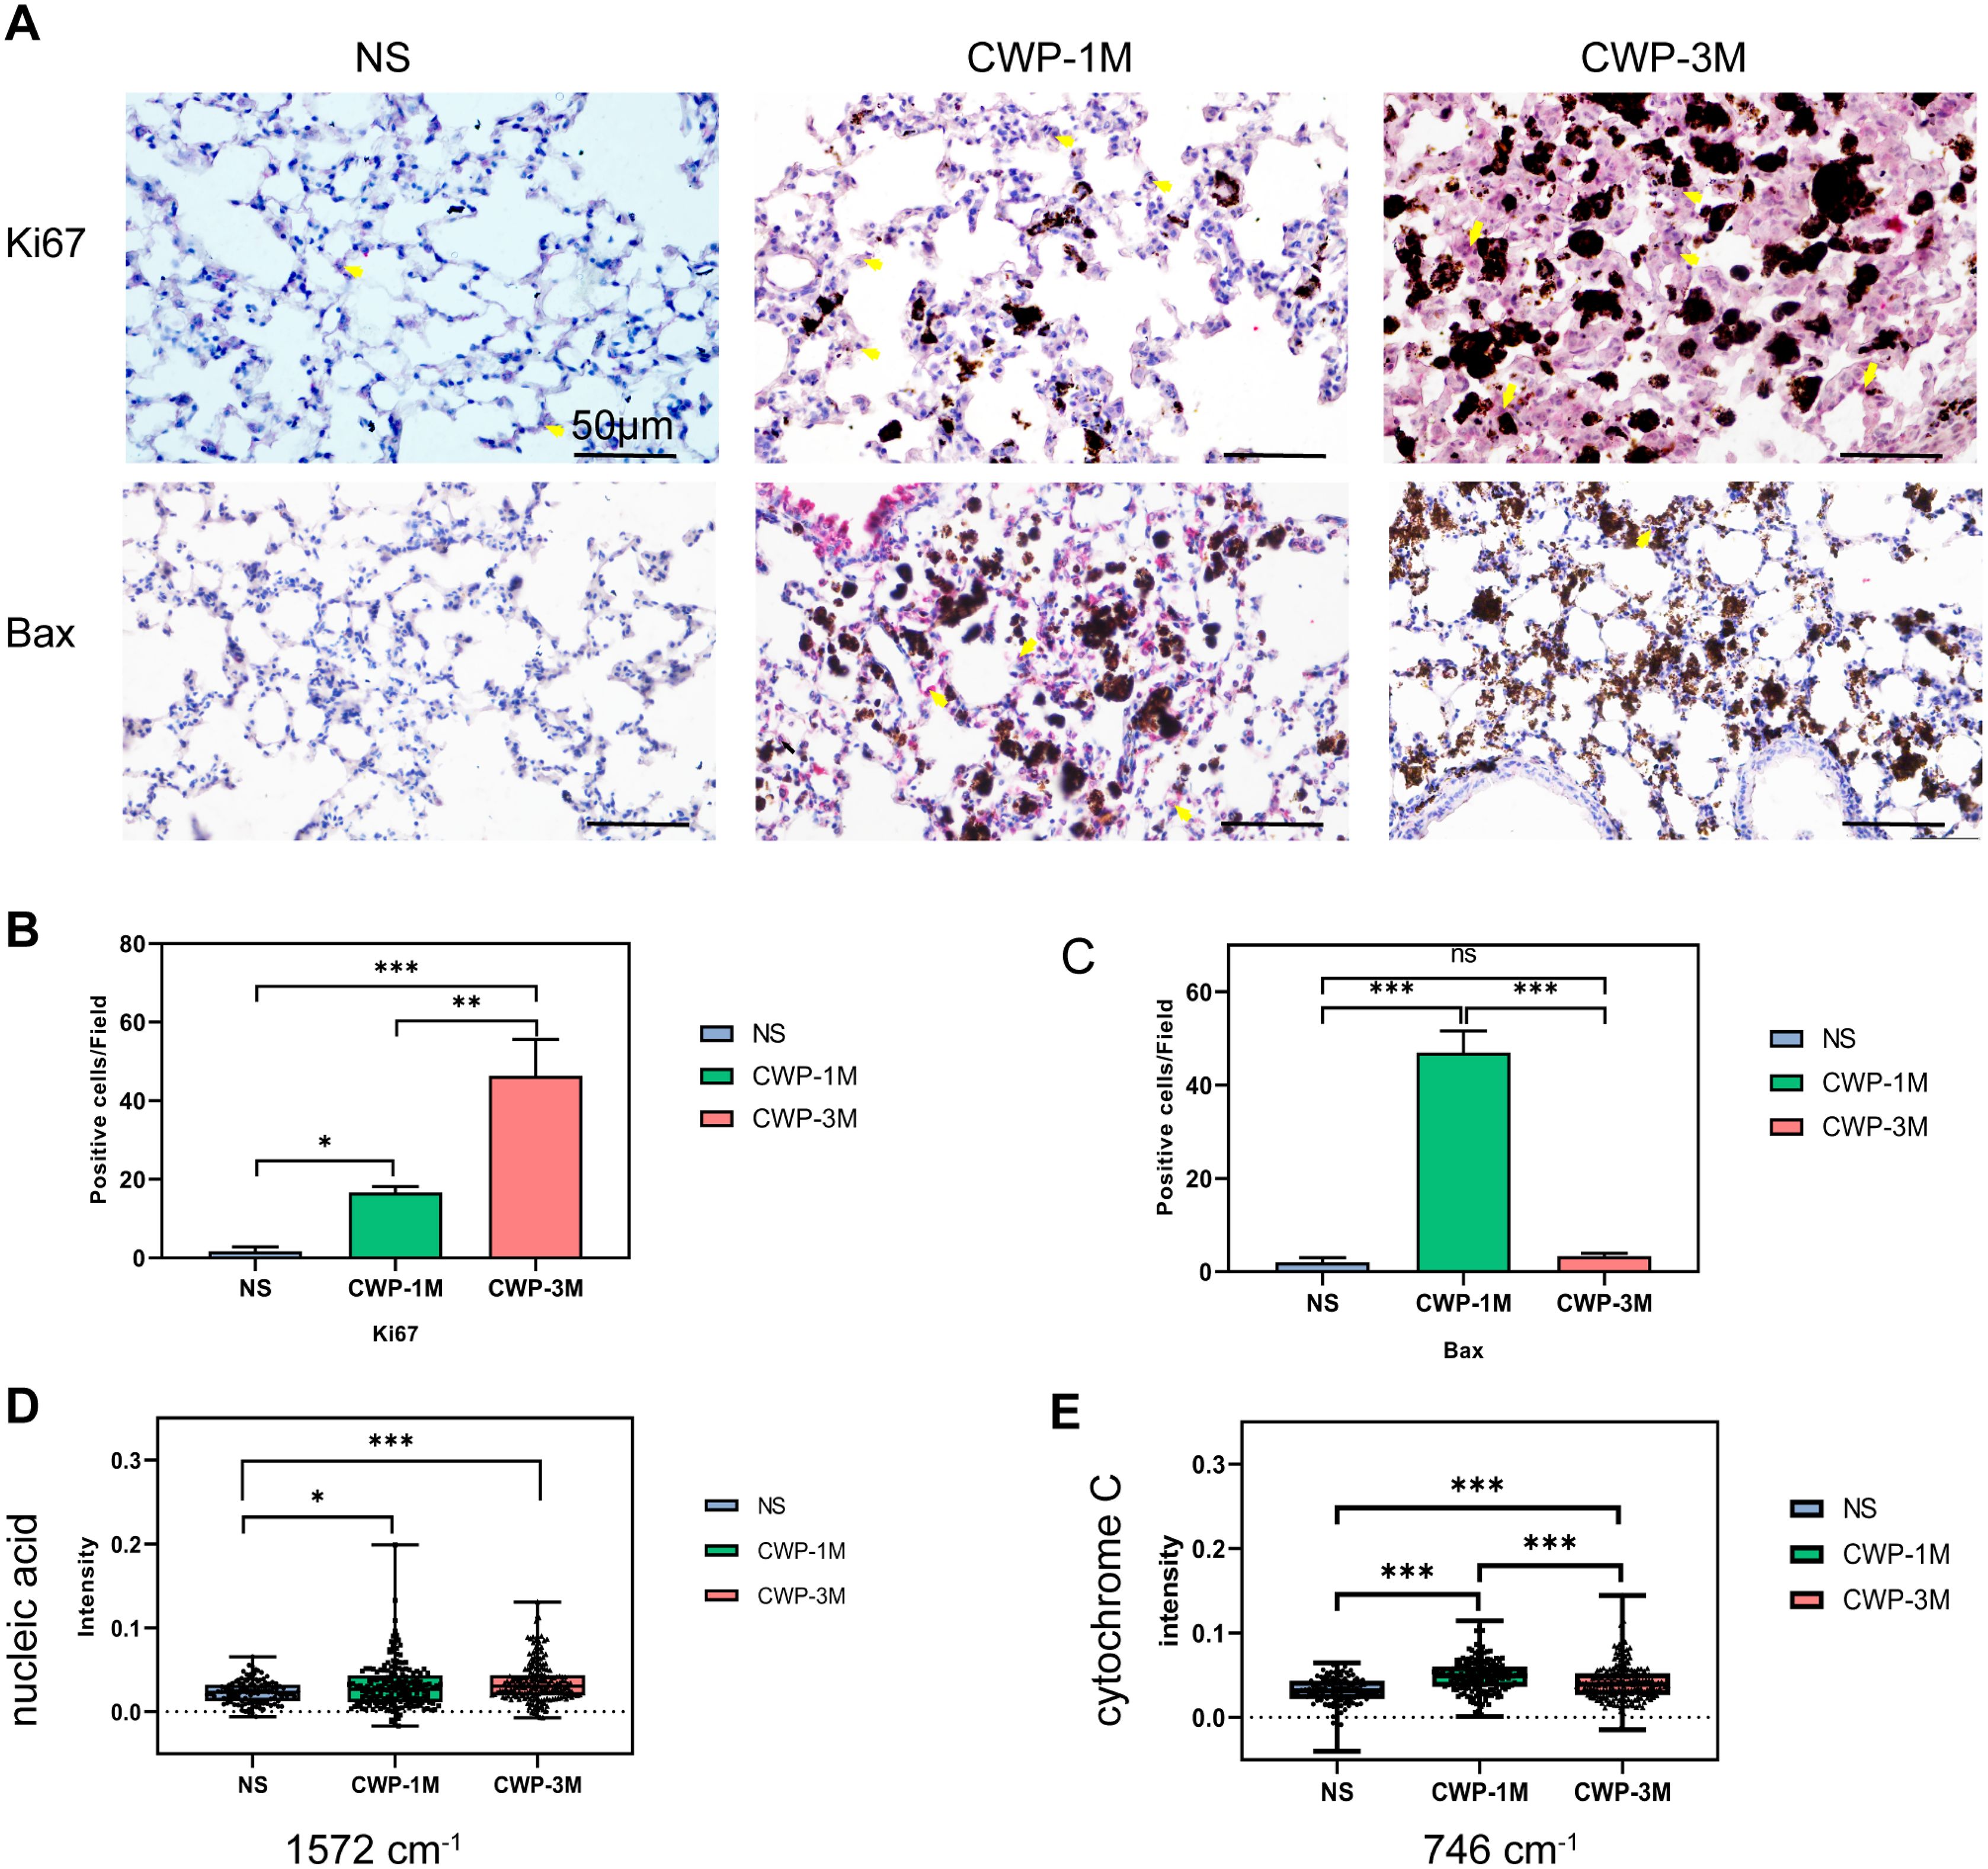
Pulmonary fibrosis and collagen accumulation caused by coal dust can be assessed by confocal Raman spectroscopy
We compared the results of traditional Masson’s staining with Sirius Red staining to see if long-term exposure to coal dust particles can cause lung fibrosis (Fig. 7A). Meanwhile, we detected collagen characteristic spectra peaks in 1,248 and 1,448 cm−1. As seen from the Masson’s staining, more blue collagen fibers were identified in the lung of the CWP-3M group than in the CWP-1M group. In contrast, just a minor number of blue collagen fibers were found in the NS group. By using ImageJ software to calculate the percentage of blue collagen in the total lung tissue, it was found that the collagen content in the CWP-3M group was significantly higher than that in the CWP-1M and NS groups (CWP-3M vs CWP-1M: mean = 13.55, one-way ANOVA, q = 13.13, p = 0.0002, n = 3, df = 6, CWP-3M vs NS: mean = 13.55, one-way ANOVA, q = 24.09, p < 0.0001, n = 3, df = 6, Fig. 7B). With Sirius Red staining, type I collagen was yellow or red, type III collagen was green, and type II collagen was blue-green or grayish-blue under a polarizing microscope. As can be seen in Fig. 7A, the CWP-3M group had much more red and yellow collagen than the CWP-1M and NS groups, and some of the collagen was coated with coal dust particles surrounding the trachea. The refraction of coal dust particles hampered the evaluation of tissue collagen by Sirius under polarized microscopy, which would affect the evaluation of collagen area by ImageJ (Fig. 7B).
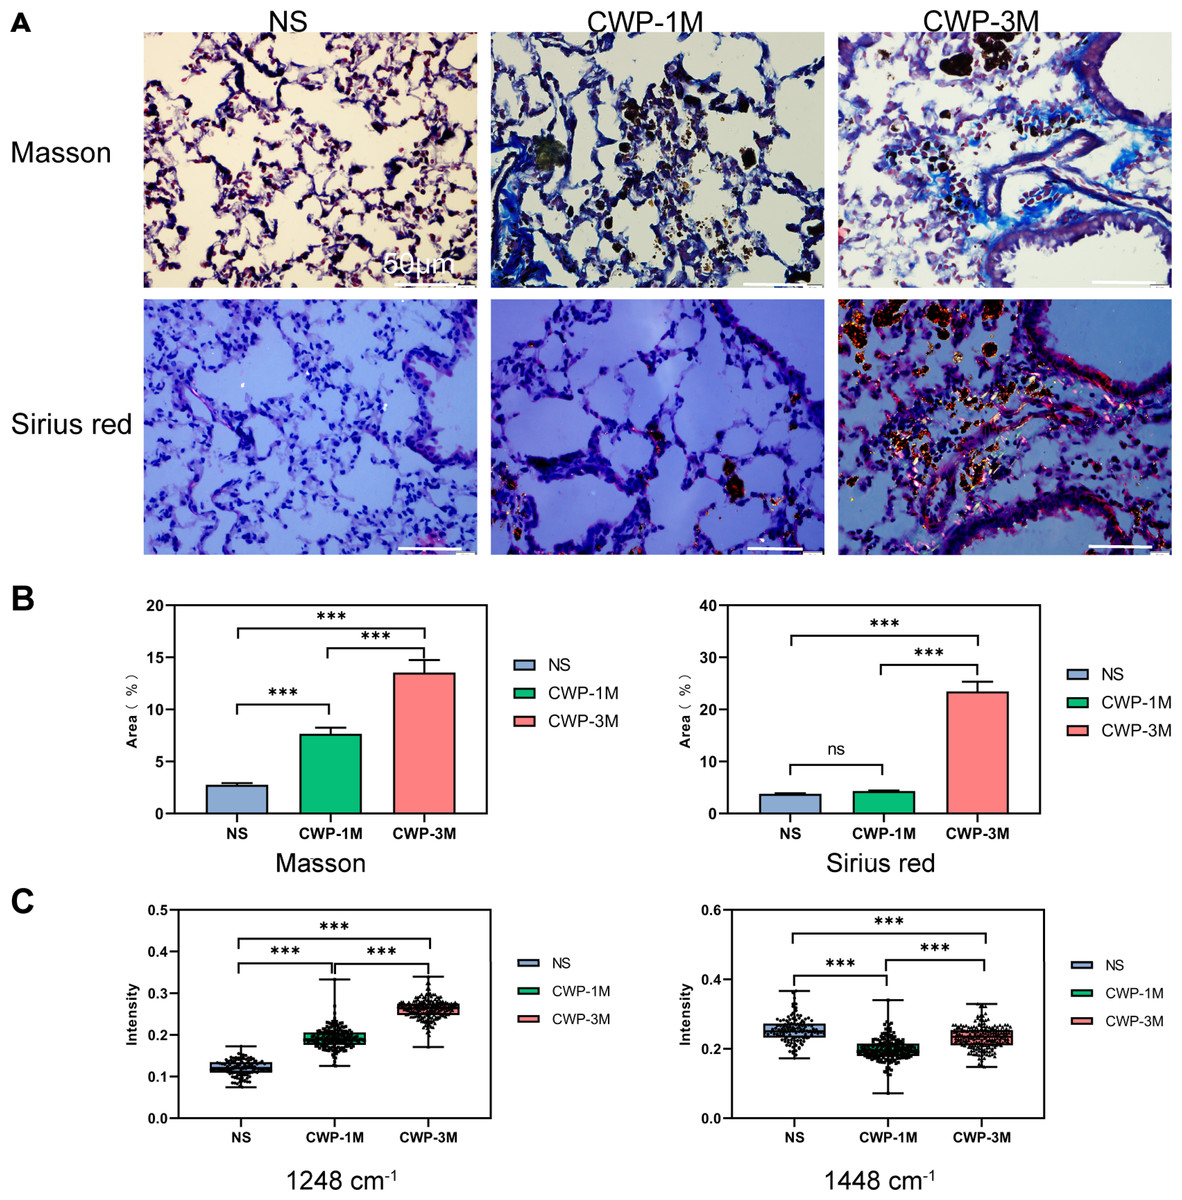
Figure 7: The Raman bands quantified to assess collagen changes were identified with Masson’s staining and not Sirius Red staining.
(A) Representative images of Masson trichrome staining and Sirius Red staining for each group (400× magnification, scale bar = 50 μm). (B) Quantification of the fibrotic area from Masson’s staining and Sirius Red staining. (C) Raman band intensities in the different groups were quantified to assess collagen (1,248 and 1,448 cm−1). One-way ANOVA with post hoc Tukey’s test was used. The results represent means ± SEM. ns indicates P ≥ 0.05, three asterisks (***) indicate P ≤ 0.001.
Many studies have confirmed that Raman spectroscopy can evaluate collagen content according to the characteristic peak of collagen (Bergholt, Serio & Albro, 2019; Janko et al., 2010), and we selected the typical peaks of collagen in the lung tissues (1,248 and 1,448 cm−1). The results showed that the collagen intensity of the 1,248 cm−1 band was significantly higher in the CWP-3M group than in the CWP-1M and NS groups. Similarly, the intensity of the 1,448 cm−1 collagen band was significantly higher in the CWP-3M group than in the CWP-1M and NS groups. The comparison of the peak strength of the collagen was consistent with that of Masson’s staining.
Discussion
Coal workers often inhale coal dust particles in the working environment, which can readily cause CWP. The pathological characteristics of CWP are pneumonia and pulmonary fibrosis (Go & Cohen, 2020), and our model showed that the lung tissue of mice was significantly damaged and altered by exposure to coal dust. For example, the collagen fibers of the tissue increased significantly over time, indicating that the lung tissue fibrosis caused by the coal dust progressed slowly, in contrast to that caused by silica, asbestos, and bleomycin (Cao et al., 2021; Watanabe et al., 2021). We take 16 mg coal dust to a mouse in a month, which is approximately a miner 10 to 20 years exposure (Henneberger & Attfield, 1997; Borm & Tran, 2002). These suggested that the mouse model was constructed in accordance with the development of CWP. Histopathological H&E staining showed that inflammatory cells infiltrated the lung tissue of mice exposed to coal dust and destroyed the alveolar structure. Over time, the inflammatory cell infiltration became more obvious, the bronchial wall thickened, the coal dust particles around the trachea accumulated more significantly, and the interstitial inflammation was further aggravated (Fig. 2C). These pathological changes in the lung tissue induced a pulmonary function decline in the mice. Overall, these results indicate that the early physical stimulation of lung tissue by coal dust particles causes a tissue-specific response, which is consistent with the model of early silica-induced pulmonary fibrosis (Sai et al., 2021; Zhang et al., 2021). As an important molecule in the inflammatory process (Ng et al., 2021; Zhou et al., 2021), the immunohistochemical expression of NF-κB in lung tissue was significantly increased, indicating that the inflammatory response of lung tissue was increased during coal dust exposure.
As a label-free detection technique, confocal Raman spectroscopy has considerable advantages in the molecular-level analysis of lung tissue. The differences in Raman intensities suggested alterations in cell metabolism and composition in lung tissue exposed to coal dust particles in the different groups. LDA demonstrated that confocal Raman spectroscopy could accurately differentiate normal and CWP lung tissue. Consistently, the changes in the biomolecules identified by Raman spectroscopy coincided with the immunohistochemical expression of various key molecules (Figs. 5 and 6). From the inflammatory perspective, the expression of NF-κB was higher in CWP-1M lung tissues than in those of CWP-3M. This result suggests that the inflammation caused by coal dust exposure is gradually relieved, as also shown by the similar results for cholesterol. As a structural component that maintains membrane permeability and fluidity, cholesterol is essential for the function and integrity of mammalian cells. Inside the cell, cholesterol homeostasis is tightly controlled to ensure normal cellular processes (Sèdes et al., 2018). Besides, cholesterol homeostasis is highly regulated at the cellular level and interacts with G protein-coupled receptors (GPCRs), important receptors involved in protein-mediated signal transduction, affecting cell transport, metabolism, secretion, differentiation, growth, inflammation, and immune responses (Pucadyil & Chattopadhyay, 2006). Also, cholesterol ring peaks have been detected at 702 cm−1 (Yue et al., 2014), we did not observe the key peak, but using 548 and 1,087 cm−1, cholesterol was also evaluated in the three groups. However, there are many prominent bands in the cholesterol spectrum (Czamara et al., 2015), particularly 548 and 1,087 cm−1, associated with the C–C and C–H stretching modes (Kočišová, Antalík & Procházka, 2013; Le Cacheux et al., 1996) and which were consistent with NF-κB, and whether there is a corresponding trend in other inflammatory indicators needs further verification.
In addition, phospholipids and cholesterol play an important role in cell membrane stability and endoplasmic reticulum synthesis (Krause & Regen, 2014; Lagace & Ridgway, 2013). Compared among the three groups, it can be seen that the content of phospholipids at 1,080 cm−1 was the highest in the CWP-1M group, higher than in the NS group and CWP-3M group, and that the content of cholesterol was higher in the CWP-3M group than in the NS group. These findings indicate that, after coal dust exposure, considerable apoptosis occurred in the cells to resist the damage caused by the coal dust.
After 3 months of coal dust exposure, the tissue was in a repair state, and the cytochrome C results at 746 cm−1 were consistent with those of cholesterol. These results were also consistent with the immunohistochemical results of Bax. As one of the most important pro-apoptotic genes (Zhaorigetu et al., 2021), Bax expression was significantly upregulated in the CWP-1M group, while that in the NS and CWP-3M groups was almost at the baseline level, showing that the CWP-1M group had the highest level of apoptosis. The changes in cytochrome C (746 cm−1), which can also represent apoptosis, were also correlated with the changes in cholesterol and phospholipids. The upregulation of Bax can lead to the release of cytochrome C, thereby inducing apoptosis. The release of cytochrome C from mitochondria is the key event of apoptosis (Gama et al., 2014). Interestingly, the Amide I ν(C=C) lipid band represented by 1,465 cm−1 was not consistent with the change in the phospholipid peak of 1,080 cm−1, indicating that P–O stretching vibration could better represent the change in the phospholipid of the lung tissue cell membrane in this study.
Amino acid synthesis and catabolic metabolism are interweaved with cell redox homeostasis (Vettore, Westbrook & Tennant, 2020), with the changes in the different amino acids (bands at 750, 850, 1,004, 1,036, 1,123, and 1,552 cm−1) shown on Raman spectra indicating active cellular metabolism in lung tissue. We observed an increase in amino acid signal, but a reduction in the phenylalanine peak at 1,004 cm−1. The contradictory phenomenon may indicate that coal dust causes amino acid metabolism disorder in lung tissue (Chen et al., 2020; Engelen & Schols, 2003). As a related antigen of proliferating cells, Ki67 is closely linked to mitosis and is indispensable in cell proliferation (Plantier et al., 2018). Our immunohistochemical results for Ki67 showed that active lung tissue proliferation was higher in the CWP-3M group than in the CWP-1M and NS groups. El-Zammar, Rosenbaum & Katzenstein (2009) suggested that the low proliferative activity of fibroblasts in common interstitial pneumonia and scar tissue supported the hypothesis of abnormal wound healing in common interstitial pneumonia. Therefore, future studies will focus on the cell types undergoing proliferation in the CWP-1M and CWP-3M groups. The nucleic acid peak at 1,572 cm−1 also indicated that the cells exhibited clear proliferation after coal dust exposure. The intensity of the 783–790 cm−1 Raman spectra were very weak with no apparent Raman signal. These peaks do not corroborate the analysis at 1,572 cm−1. A total of 1,572 cm−1 represent “Ring breathing modes in the DNA bases”, and 786 cm−1 represent “symmetric phosphodiester stretch or ring breathing modes of pyrimidine bases”, the reason for this difference may be due to the influence of molecular structure. We concluded that 1,572 cm−1 was more representative for the nucleic acid peak in lung tissues (Song et al., 2020a). The Raman spectra of nucleic acid may have different exhibitions at the cell proliferation early-stage and late-stage when cells proliferate, 1,572 cm−1 indicating the cell in the early stage of proliferation (Su et al., 2017).
Coal dust exposure caused an increase in collagen, which is an important component of the extracellular matrix. In our study, Masson’s staining can evaluate collagen very well but, due to the auto-fluorescence of coal dust particles (Yang et al., 2020), Sirius Red staining can lead to biased results under polarizing microscopy, which is why we believe that Sirius Red staining cannot adequately evaluate collagen content. Collagen peak intensities of 1,248 and 1,448 cm−1 can be used to determine the collagen content of tissues. Although, most lipid species produce characteristic CH2 modes at 1,440–1,448 cm−1 (Movasaghi, Rehman & Rehman, 2007), we assign the 1,448 cm−1 to collagen (Song et al., 2020a), which is consistent with the Masson’s staining results. Thus, confocal Raman spectroscopy has advantages in evaluating the fibrosis degree of lung tissues exposed to coal dust.
Conclusions
In summary, confocal Raman spectroscopy revealed major changes in biochemical molecules associated with coal pneumoconiosis. To our knowledge, we are the first to use confocal Raman spectroscopy to analyze the biochemical changes in the CWP lungs. This approach will help expand our understanding of the toxicity of coal dust in the lung. In addition, we described cholesterol, lipid, nucleic acid, cytochrome C, and collagen band detected by Raman spectroscopy as potential biomarkers of inflammatory, proliferation, cell apoptosis, and collagen fibers in CWP lungs.
Supplemental Information
Scatterplots of the PCA scores for the different groups.
(a) PC1 vs PC2; (b) PC1 vs PC3; and (c) PC2 vs PC3.