
The predictive value of PRDM2 in solid tumor: a systematic review and meta-analysis
- Published
- Accepted
- Received
- Academic Editor
- Vladimir Uversky
- Subject Areas
- Bioinformatics, Genomics, Oncology
- Keywords
- Solid tumor, PRDM2, Diagnostic biomarker, Tumor suppressor gene, Systematic review, Meta-analysis
- Copyright
- © 2020 Tanadi et al.
- Licence
- This is an open access article distributed under the terms of the Creative Commons Attribution License, which permits unrestricted use, distribution, reproduction and adaptation in any medium and for any purpose provided that it is properly attributed. For attribution, the original author(s), title, publication source (PeerJ) and either DOI or URL of the article must be cited.
- Cite this article
- 2020. The predictive value of PRDM2 in solid tumor: a systematic review and meta-analysis. PeerJ 8:e8826 https://doi.org/10.7717/peerj.8826
Abstract
Background
Many studies have reported the presence of Positive Regulatory/Su(var)3-9, Enhancer-of-zeste and Trithorax Domain 2 (PRDM2) downregulation in cancer. However, its potential as a diagnostic biomarker is still unclear. Hence, a systematic review and meta-analysis were conducted to address this issue.
Introduction
As of 2018, cancer has become the second leading cause of death worldwide. Thus, cancer control is exceptionally vital in reducing mortality. One such example is through early diagnosis of cancer using tumor biomarkers. Having a function as a tumor suppressor gene (TSG), PRDM2 has been linked with carcinogenesis in several solid tumor. This study aims to assess the relationship between PRDM2 downregulation and solid tumor, its relationship with clinicopathological data, and its potential as a diagnostic biomarker. This study also aims to evaluate the quality of the studies, data reliability and confidence in cumulative evidence.
Materials & Methods
A protocol of this study is registered at the International Prospective Register of Systematic Reviews (PROSPERO) with the following registration number: CRD42019132156. PRISMA was used as a guideline to conduct this review. A comprehensive electronic search was performed from inception to June 2019 in Pubmed, Cochrane Library, ProQuest, EBSCO and ScienceDirect. Studies were screened and included studies were identified based on the criteria made. Finally, data synthesis and quality assessment were conducted.
Results
There is a significant relationship between PRDM2 downregulation with solid tumor (RR 4.29, 95% CI [2.58–7.13], P < 0.00001). The overall sensitivity and specificity of PRDM2 downregulation in solid tumors is 84% (95% CI [39–98%]) and 86% (95% CI [71–94%]), respectively. There is a low risk of bias for the studies used. TSA results suggested the presence of marked imprecision. The overall quality of evidence for this study is very low.
Discussion
We present the first meta-analysis that investigated the potential of PRDM2 downregulation as a diagnostic biomarker in solid tumor. In line with previous studies, our results demonstrated that PRDM2 downregulation occurs in solid tumor. A major source of limitation in this study is the small number of studies.
Conclusions
Our review suggested that PRDM2 is downregulated in solid tumor. The relationship between PRDM2 downregulation and clinicopathological data is still inconclusive. Although the sensitivity and specificity of PRDM2 downregulation are imprecise, its high values, in addition to the evidence that suggested PRDM2 downregulation in solid tumor, hinted that it might still have a potential to be used as a diagnostic biomarker. In order to further strengthen these findings, more research regarding PRDM2 in solid tumors are encouraged.
Introduction
Cancer has long been considered a catastrophic public health problem due to its high mortality rates. With an estimate of 9.6 million death, cancer has now become the second leading cause of death worldwide. Moreover, the incidence of cancer is also growing at an alarming rate due to the exponential increase of the aging population and changes in the distribution of cancer risk factors. It was estimated that the incidence of cancer would rise to 18.1 million new cases in 2018. To summarise, one in six women and one in five men will develop cancer, while one in 10 women and one in eight men are dying as a result of cancer (Bray et al., 2018; World Health Organization, 2018).
Thus, cancer control is extremely vital in reducing mortality. One example of cancer control is early diagnosis of cancer. This could be achieved through the use of tumor biomarkers. However, despite the potential of biomarkers for early detection of cancer, its implementation in the clinical setting is still lacking (Goossens et al., 2015; Schiffman, Fisher & Gibbs, 2015; World Health Organization, 2017). This could be attributed to weak clinical performances, such as low sensitivity, low specificity or low predictive values (Diamandis, 2012). Hence, further research to identify novel biomarkers should be performed.
Positive Regulatory/Su(var)3-9, Enhancer-of-zeste and Trithorax Domain 2 (PRDM2) is a tumor suppressor gene (TSG) that regulates protein expression through the methylation of lysine 9 in histone H3. Hence, PRDM2 also belongs to the nuclear histone/protein methyltransferase superfamily. Its gene products are also involved in DNA-binding and transcription factor binding-activities, implicating its role in carcinogenesis (Sorrentino et al., 2018; Zhang et al., 2015). Studies have also reported PRDM2 downregulation in cancers that exhibit high incidence and mortality, such as bladder cancer, breast cancer, cervical cancer, colorectal cancer, endometrial cancer, esophageal squamous cell carcinoma, gastric carcinoma, hepatocellular carcinoma, lung cancer, pancreatic cancer, prostate cancer, T-cell prolymphocytic leukemia and thyroid carcinoma (Cheng, Gao & Lou, 2010; Cui et al., 2016; Johansson et al., 2018; Lal et al., 2006; Michalak & Visvader, 2016; Oshimo et al., 2004; Pandzic et al., 2017; Rossi et al., 2009; Sakurada et al., 2001; Tan et al., 2014; Wu et al., 2016; Yang et al., 2017; Zhang et al., 2016). Furthermore, in a meta-analysis that found a total of 22 genes methylated in hepatocellular carcinoma, PRDM2 was one of the genes with the most significant result and is on par with the well-known APC and p16 (Zhang et al., 2016). Hence, PRDM2 might play an important role in malignancies. However, the potential of PRDM2 as a diagnostic biomarker is still unclear.
Therefore, we performed a systematic review and meta-analysis that investigated PRDM2 expression level in solid tumor, as well as its potential as a diagnostic biomarker. If there is sufficient data, we will also investigate if there is any correlation between PRDM2 expression level with clinicopathological data.
Material and Methods
Study registration and methodology
A protocol of this study is registered at the International Prospective Register of Systematic Reviews (PROSPERO) with the following registration number: CRD42019132156 (https://www.crd.york.ac.uk/prospero/display_record.php?RecordID=132156) (National Institute for Health Research, 2019). Preferred Reporting Items for Systematic Reviews and Meta-analyses (PRISMA) flow diagram was used as a guideline to conduct our systematic review and meta-analysis (Moher et al., 2009).
Search strategy and study selection
A comprehensive electronic search was done in PubMed, Cochrane Library, ProQuest, EBSCO and ScienceDirect from inception to July 2019 using the following search terms: (PRDM2 OR RIZ OR RIZ1 OR RIZ2 OR KMT8 OR KMT8A OR MTB-ZF OR HUMHOXY1) AND (Cancer OR Cancers OR Malignant OR Malignancy OR Malignancies OR Neoplasm OR Neoplasms OR Neoplasia OR Neoplasias OR Tumor OR Tumors OR Tumour OR Tumours). The search was performed by two independent reviewers (Alfredo Bambang and Indra Putra Wendi). Any differences were solved through a discussion with a third reviewer (Anton Sumarpo).
All of the search outputs were exported into the EndNote software. Duplicates were removed, and screening was performed based on the title and abstract of the study. Probable or included studies were identified and assessed for eligibility according to the criteria above. Finally, included studies were identified, and data extraction was performed.
A study is included if it meets the following criteria: (1) The study used human subjects; (2) The study investigated the relationship between PRDM2 expression level and solid tumor through the use of gene expression analysis; (3) The study used histopathological examination as a comparator; (4) The study is a clinical trial or cross-sectional study. A study is excluded if: (1) The study does not have a control group (people without cancer or non-cancer specimens); (2) The study did not use an appropriate or did not state the gene expression analysis method used; (3) The expression level of PRDM2 in the study is not clearly stated or unquantifiable; (4) The study is a review, case series, conference abstracts, in vitro or in vivo study. (5) The study is not written in English.
Data extraction
The included studies were then analyzed further and the following informations are extracted: First author, publication year, country of origin, age, gender, race, type of cancer, cancer differentiation state, stage of cancer, type of control, number of cases and controls, gene expression analysis method, PRDM2 expression level and conclusion of the study. In the case of missing data, the authors will be contacted via email to request access to those missing data.
Data synthesis and statistical analysis
Sensitivity and specificity of PDRM2 were assessed in order to elucidate the potential of PRDM2 expression level as a diagnostic biomarker in solid tumor. Sensitivity and specificity are said to be significant if >50%. Risk ratio (RR) with a 95% confidence interval (CI) was used to determine the relationship between PRDM2 expression level and risk of cancer, as well as the relationship between PRDM2 expression level and clinicopathological data. If heterogeneity is present, Random Effects Model (REM) will be used. However, if heterogeneity is absent, Fixed Effects Model (FEM) will be used instead.
Cochrane’s Q test (chi-squared test) and Higgins I2 statistics were used to assess for the presence of heterogeneity statistically. Heterogeneity is said to be present if P < 0.10 or I2 > 75% (Higgins & Green, 2011; Higgins et al., 2003). To assess for the presence of heterogeneity visually, a forest plot will be generated. Meta-regression and subgroup analysis will be conducted when there are at least 10 studies used in the meta-analysis (Baker et al., 2009). The possible causes of heterogeneity are: Age, gender, ethnicity, country of origin, type of cancer, cancer differentiation state, stage of cancer and genotyping method.
Funnel plot and Deek’s test will be used to assess publication bias when the number of included studies is at least 10. If the funnel plot is asymmetric, publication bias is present. If the P-value for Deek’s test is <0.10, there is funnel plot asymmetry (Deeks, Macaskill & Irwig, 2005). If publication bias is found, the trim and fill method will be used to correct this bias (Duval & Tweedie, 2000).
Furthermore, sensitivity analysis was performed to elucidate the effect and stability of a single study on the pooled estimates by deleting one study at a time. Additionally, sensitivity analysis was also conducted to compare the pooled estimates using odds ratio (OR) and RR, as well as using REM and FEM. All statistical analyses were generated using RevMan 5.3 and STATA 12.0.
Quality assessment and data reliability
In order to claim that the meta-analysis conducted has been conclusive, the required information size has to be achieved. Thus, a trial sequential analysis (TSA) was performed using TSA software in order to determine the required information size (Wetterslev, Jakobsen & Gluud, 2017). Quality of evidence will be assessed using Quality Assessment of Diagnostic Accuracy Studies-2 (QUADAS-2) which consists of the following key domains: patient selection, index test, reference standard, as well as flow and timing (Whiting et al., 2011).
Confidence in cumulative evidence
Grading of Recommendations, Assessment, Development, and Evaluations (GRADE) was used to evaluate the confidence in cumulative evidence. Overall certainty of evidence can be written as high, moderate, low or very low (Schünemann et al., 2013).
Results
Search results
Using variants of the keywords “PRDM2” and “cancer”, we performed a search from inception to July 2019 in PubMed, Cochrane Library, ProQuest, EBSCO and ScienceDirect. After duplicate removal, a total of 3,928 records was obtained. Titles and abstracts were screened and 58 potential studies were identified. Out of these 58 studies, 52 were excluded due to the studies being unable to meet the inclusion criteria (ineligible), in vitro and/or in vivo, used unsuitable methods, written in non-English, or is a review. The remaining six studies (Akahira et al., 2007; Dong et al., 2012; Ge et al., 2015; Geli et al., 2005; Jiang et al., 1999; Tan et al., 2018) were included in the systematic review while only five studies (Akahira et al., 2007; Dong et al., 2012; Geli et al., 2005; Jiang et al., 1999; Tan et al., 2018) were included in the meta-analysis. This is because Ge et al. (2015) did not mention the number of samples and controls that expressed PRDM2 downregulation in renal cell carcinoma. Thus, only five studies were included in the meta-analysis. The Preferred Reporting Items for Systematic Reviews and Meta-analyses (PRISMA) flow diagram for this study is shown in Fig. 1.
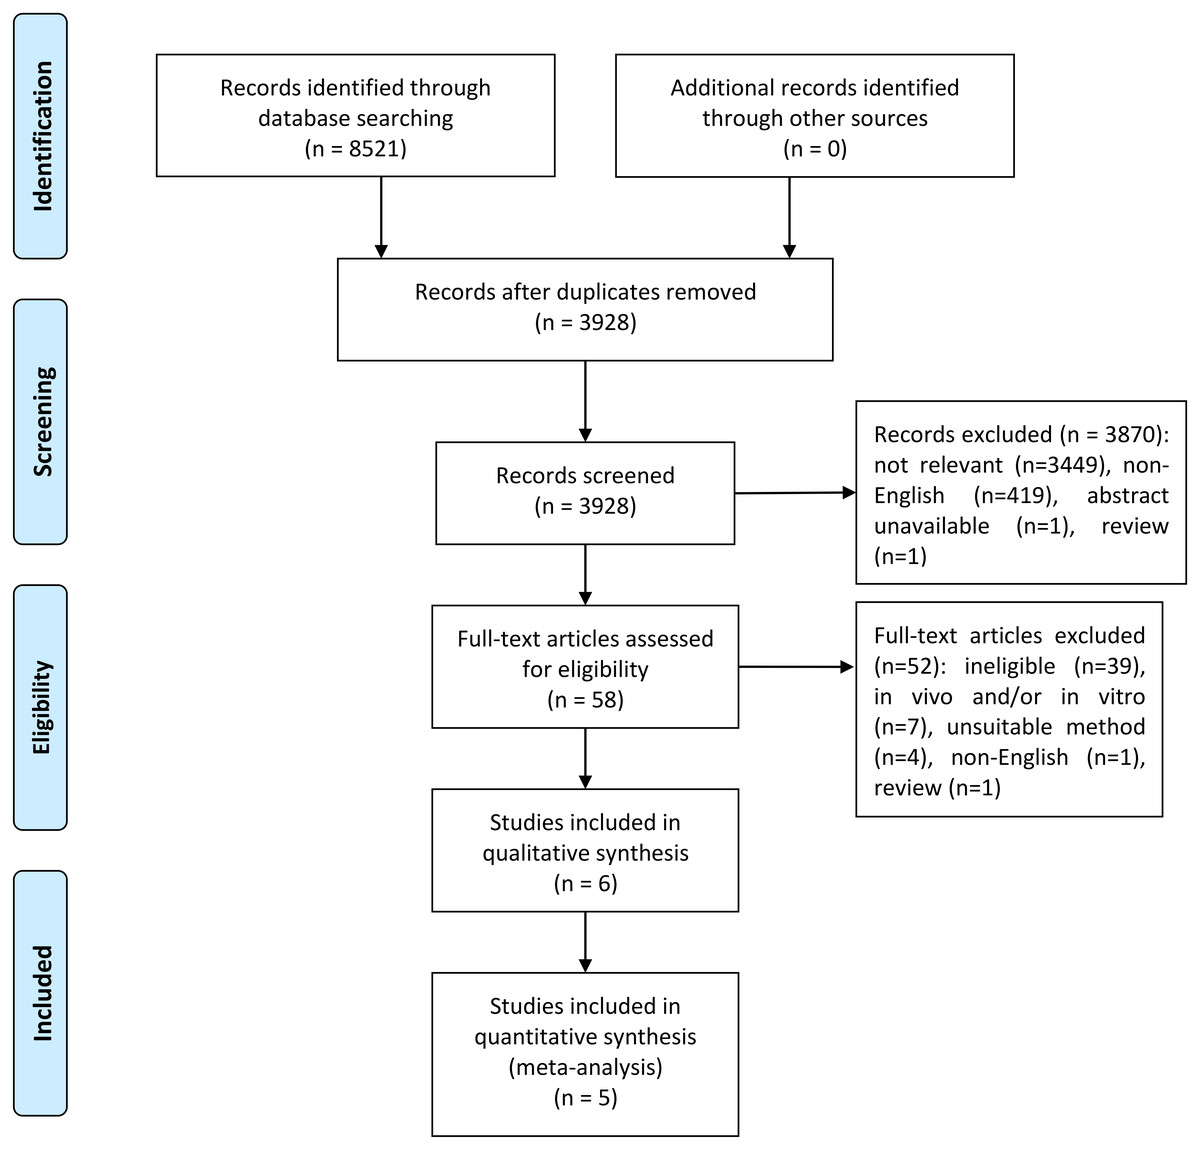
Figure 1: PRISMA flow diagram for selection of included studies.
The studies that were eligible for systematic review were published from 1999 to 2015. There were a total of 314 samples of solid tumors and 225 controls obtained from patients in China (Dong et al., 2012; Ge et al., 2015; Tan et al., 2018), Japan (Akahira et al., 2007), Sweden (Geli et al., 2005) and United States of America (Jiang et al., 1999). All of these six studies are cross-sectional studies. The solid tumors included in this study are ovarian cancer (Akahira et al., 2007), esophageal squamous cell carcinoma (Dong et al., 2012), renal cell carcinoma (RCC) (Ge et al., 2015), pheochromocytoma (Geli et al., 2005), abdominal paraganglioma (Geli et al., 2005), hepatoma (Jiang et al., 1999), lung squamous cell carcinoma (LSCC) (Tan et al., 2018) and lung adenocarcinoma (LAC) (Tan et al., 2018). Out of these six studies, one used immunohistochemistry (IHC) only (Akahira et al., 2007), three used reverse transcription-polymerase chain reaction (RT-PCR) only (Ge et al., 2015; Geli et al., 2005; Jiang et al., 1999) and two used both IHC and RT-PCR (Dong et al., 2012; Tan et al., 2018). A summary of the main characteristics of the included studies for systematic review and meta-analysis is presented in Tables 1 and 2, respectively.
Systematic review results
All six studies concluded that PRDM2 gene expression is significantly decreased in solid tumor compared to control, with the P-value ranging from <0.05 to <0.001 using CI 95%. Akahira et al. (2007) stated that there was a significant correlation between PRDM2 downregulation with cancer grade (P < 0.0345) and stage (P < 0.0153) in ovarian cancer. On the other hand, Ge et al. (2015) stated otherwise, concluding that there was no significant relationship between RCC with tumor progression (P = 0.19). A study by Geli et al. (2005) reported that decreased PRDM2 gene expression was not correlated significantly with gender and tumor size, but was found to be weakly correlated with younger age (Spearman rank-order correlations; R = 0.4). Other clinicopathological data were either absent or not investigated in the studies. Hence, the role of PRDM2 downregulation in cancer grade, stage, gender, age and other clinicopathological data is still unclear. Due to the lack of sufficient clinicopathological data, only PRDM2 gene expression and its sensitivity and specificity were further analysed in the meta-analysis.
| Study | Country | Age | Gender | Race | Method | No. of sample | No. of control | Cancer | PRDM2 expression | P value | ||||
|---|---|---|---|---|---|---|---|---|---|---|---|---|---|---|
| Type | Stage | Differentiation | ||||||||||||
| I + II | III + IV | Well/ Moderate | Poor | |||||||||||
| Akahira et al. (2007) | Japan | <50 (n = 42∕67) | ND | Asian | IHC | 164 | 6a | Ovarian cancer | 69 | 95 | 107h | 36h | Decreasedi | <0.05 |
| > =50 (n = 68∕97) | ||||||||||||||
| Dong et al. (2012) | China | ND | ND | Asian | RT-PCR | 40 | 40b | Esophageal squamous cell carcinoma | ND | ND | ND | ND | Decreasedi | <0.05j |
| IHC | ||||||||||||||
| Ge et al. (2015) | China | ND | ND | Asian | qRT-PCR | 20 | 20c | Renal cell carcinoma | ND | ND | ND | ND | Decreasedi | <0.001k |
| Geli et al. (2005) | Sweden | ND | 7 M | Caucasian | qRT-PCR | 11 | 6d | Pheochromocytoma (n = 4) | ND | ND | ND | ND | Decreasedi | <0.001l |
| 4 F | Abdominal paraganglioma (n = 7) | |||||||||||||
| Jiang et al. (1999) | United States of America | ND | ND | Caucasian | RT-PCR | 4 | 3e | Hepatoma | ND | ND | ND | ND | Decreasedi | ND |
| Tan et al. (2018) | China | <60 (n = 30) | 56 M | Asian | RT-PCR | 75 | 150f | LSCC (n = 52) | 63g | 12g | 46g | 29g | Decreasedi | <0.05m |
| > =60 (n = 45) | 19 F | IHC | LAC (n = 23) | |||||||||||
Notes:
- F
-
Female
- IHC
-
Immunohistochemistry
- LAC
-
Lung adenocarcinoma
- LSCC
-
Lung squamous cell carcinoma
- M
-
Male
- ND
-
Not determined
- PRDM2
-
Positive Regulatory/Su(var)3-9, Enhancer-of-zeste and Trithorax Domain 2
- qRT-PCR
-
Quantitative reverse transcription-polymerase chain reaction
- RT-PCR
-
Reverse transcription-polymerase chain reaction
| Study | Method | No. of sample | No. of control | Cancer type | TP | FP | FN | TN |
|---|---|---|---|---|---|---|---|---|
| Akahira et al. (2007) | IHC | 164 | 6 | Ovarian cancer | 110 | 0 | 54 | 6 |
| Dong et al. (2012) | IHC | 12 | 12 | Esophageal squamous cell carcinoma | 12 | 4 | 0 | 8 |
| Geli et al. (2005) | qRT-PCR | 11 | 6 | Pheochromocytoma (n = 4) | 9 | 0 | 2 | 6 |
| Abdominal paraganglioma (n = 7) | ||||||||
| Jiang et al. (1999) | qRT-PCR | 4 | 3 | Hepatoma | 4 | 1 | 0 | 2 |
| Tan et al. (2018) | IHC | 75 | 150 | LSCC (n = 52) | 22 | 10 | 53 | 140 |
| LAC (n = 23) |
Notes:
- FN
-
False negative
- FP
-
False positive
- IHC
-
Immunohistochemistry
- LAC
-
Lung adenocarcinoma
- LSCC
-
Lung squamous cell carcinoma
- qRT-PCR
-
Quantitative reverse transcription-polymerase chain reaction
- TN
-
True negative
- TP
-
True positive
Meta-analysis results
Five studies were included in this meta-analysis to further investigate the relationship between PRDM2 downregulation with solid tumor (Akahira et al., 2007; Dong et al., 2012; Geli et al., 2005; Jiang et al., 1999; Tan et al., 2018). The pooled analysis suggested that PRDM2 gene expression is decreased in solid tumor (RR 4.29, 95% CI [2.58–7.13], P < 0.00001; Fig. 2). Based on this pooled analysis, three sensitivity analyses were conducted to evaluate the stability of our findings: with and without the deletion of Jiang et al. (1999) (Fig. 3), RR or OR (Fig. 4), and FEM or REM (Fig. 5). All three sensitivity analyses did not have meaningful differences, proving that our results are stable.
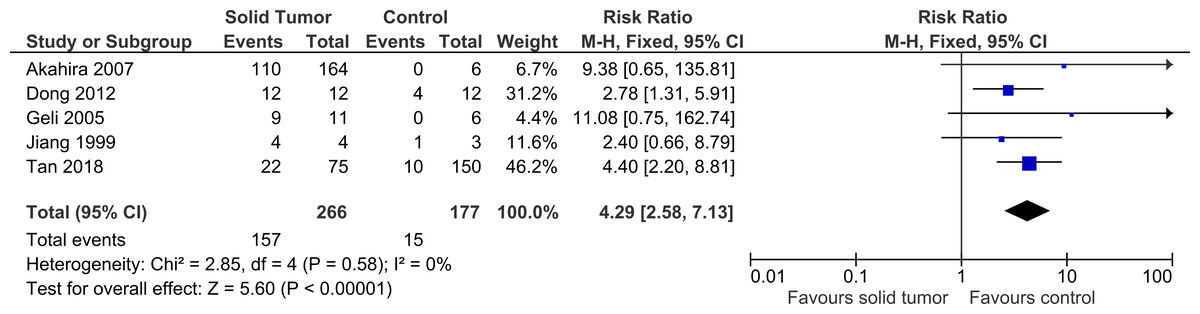
Figure 2: Forest plot of PRDM2 downregulation in solid tumors and control.
Studies with notable weights are Tan et al. (2018) (46.2%) and Dong et al. (2012) (31.2%). The results from this forest plot demonstrated that PRDM2 downregulation occurs more often in solid tumor when compared to control (RR 4.29, 95% CI [2.58–7.13], P < 0.00001). There was no significant heterogeneity in this analysis (X2 = 2.85, I2 = 0%). The horizontal line represents 95% CI. The blue box is the result of each individual study. The black diamond at the bottom of the plot is the pooled analysis of all studies. CI, Confidence interval. df, Degree of freedom. I2, Test of heterogeneity. M-H, Mantel-Haenszel.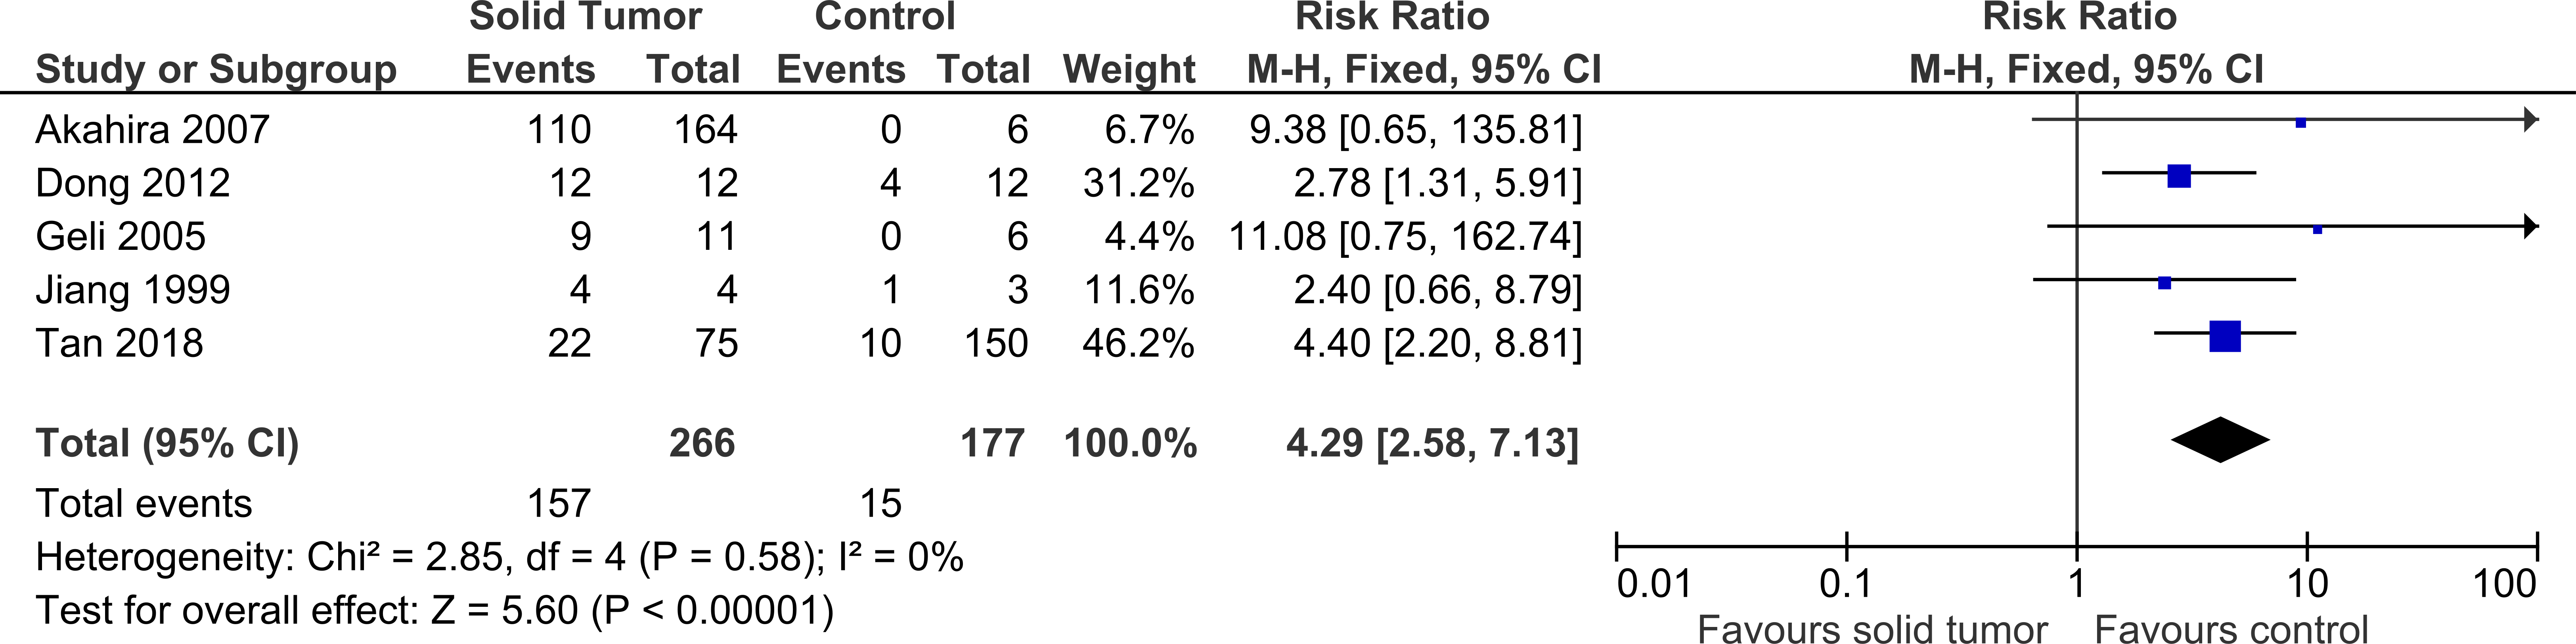
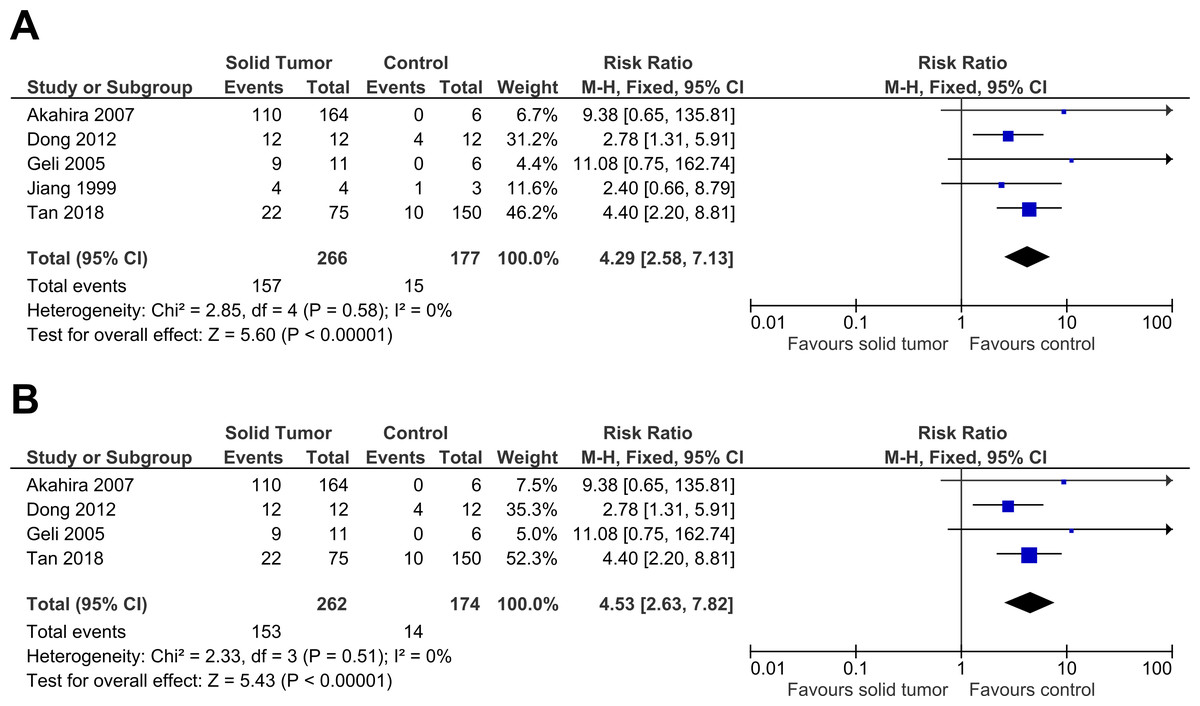
Figure 3: Sensitivity analysis to compare the use of all studies with deletion of a study.
The deleted study, Jiang et al. (1999), is a study that has the most questionable results based on the risk of bias assessment. There was a significant result for both analyses: (A) Without deletion of Jiang et al. (1999): RR 4.29, 95% CI [2.58–7.13], P < 0.00001, X2 = 2.85, P < 0.58, I2 = 0%; (B) With deletion of Jiang et al. (1999): RR 4.53, 95% CI [2.63–7.82], P < 0.00001, X2 = 2.33, P < 0.51, I2 = 0%. The deletion of Jiang et al. (1999) increased RR by 1.1 times higher with the 95% CI 1.2 times wider. The deletion of study also slightly lowered heterogeneity. This sensitivity analysis proved that the results were stable. The horizontal line represents 95% CI. The blue box is the result of each individual study. CI, Confidence interval. df, Degree of freedom. I2, Test of heterogeneity. M-H, Mantel-Haenszel.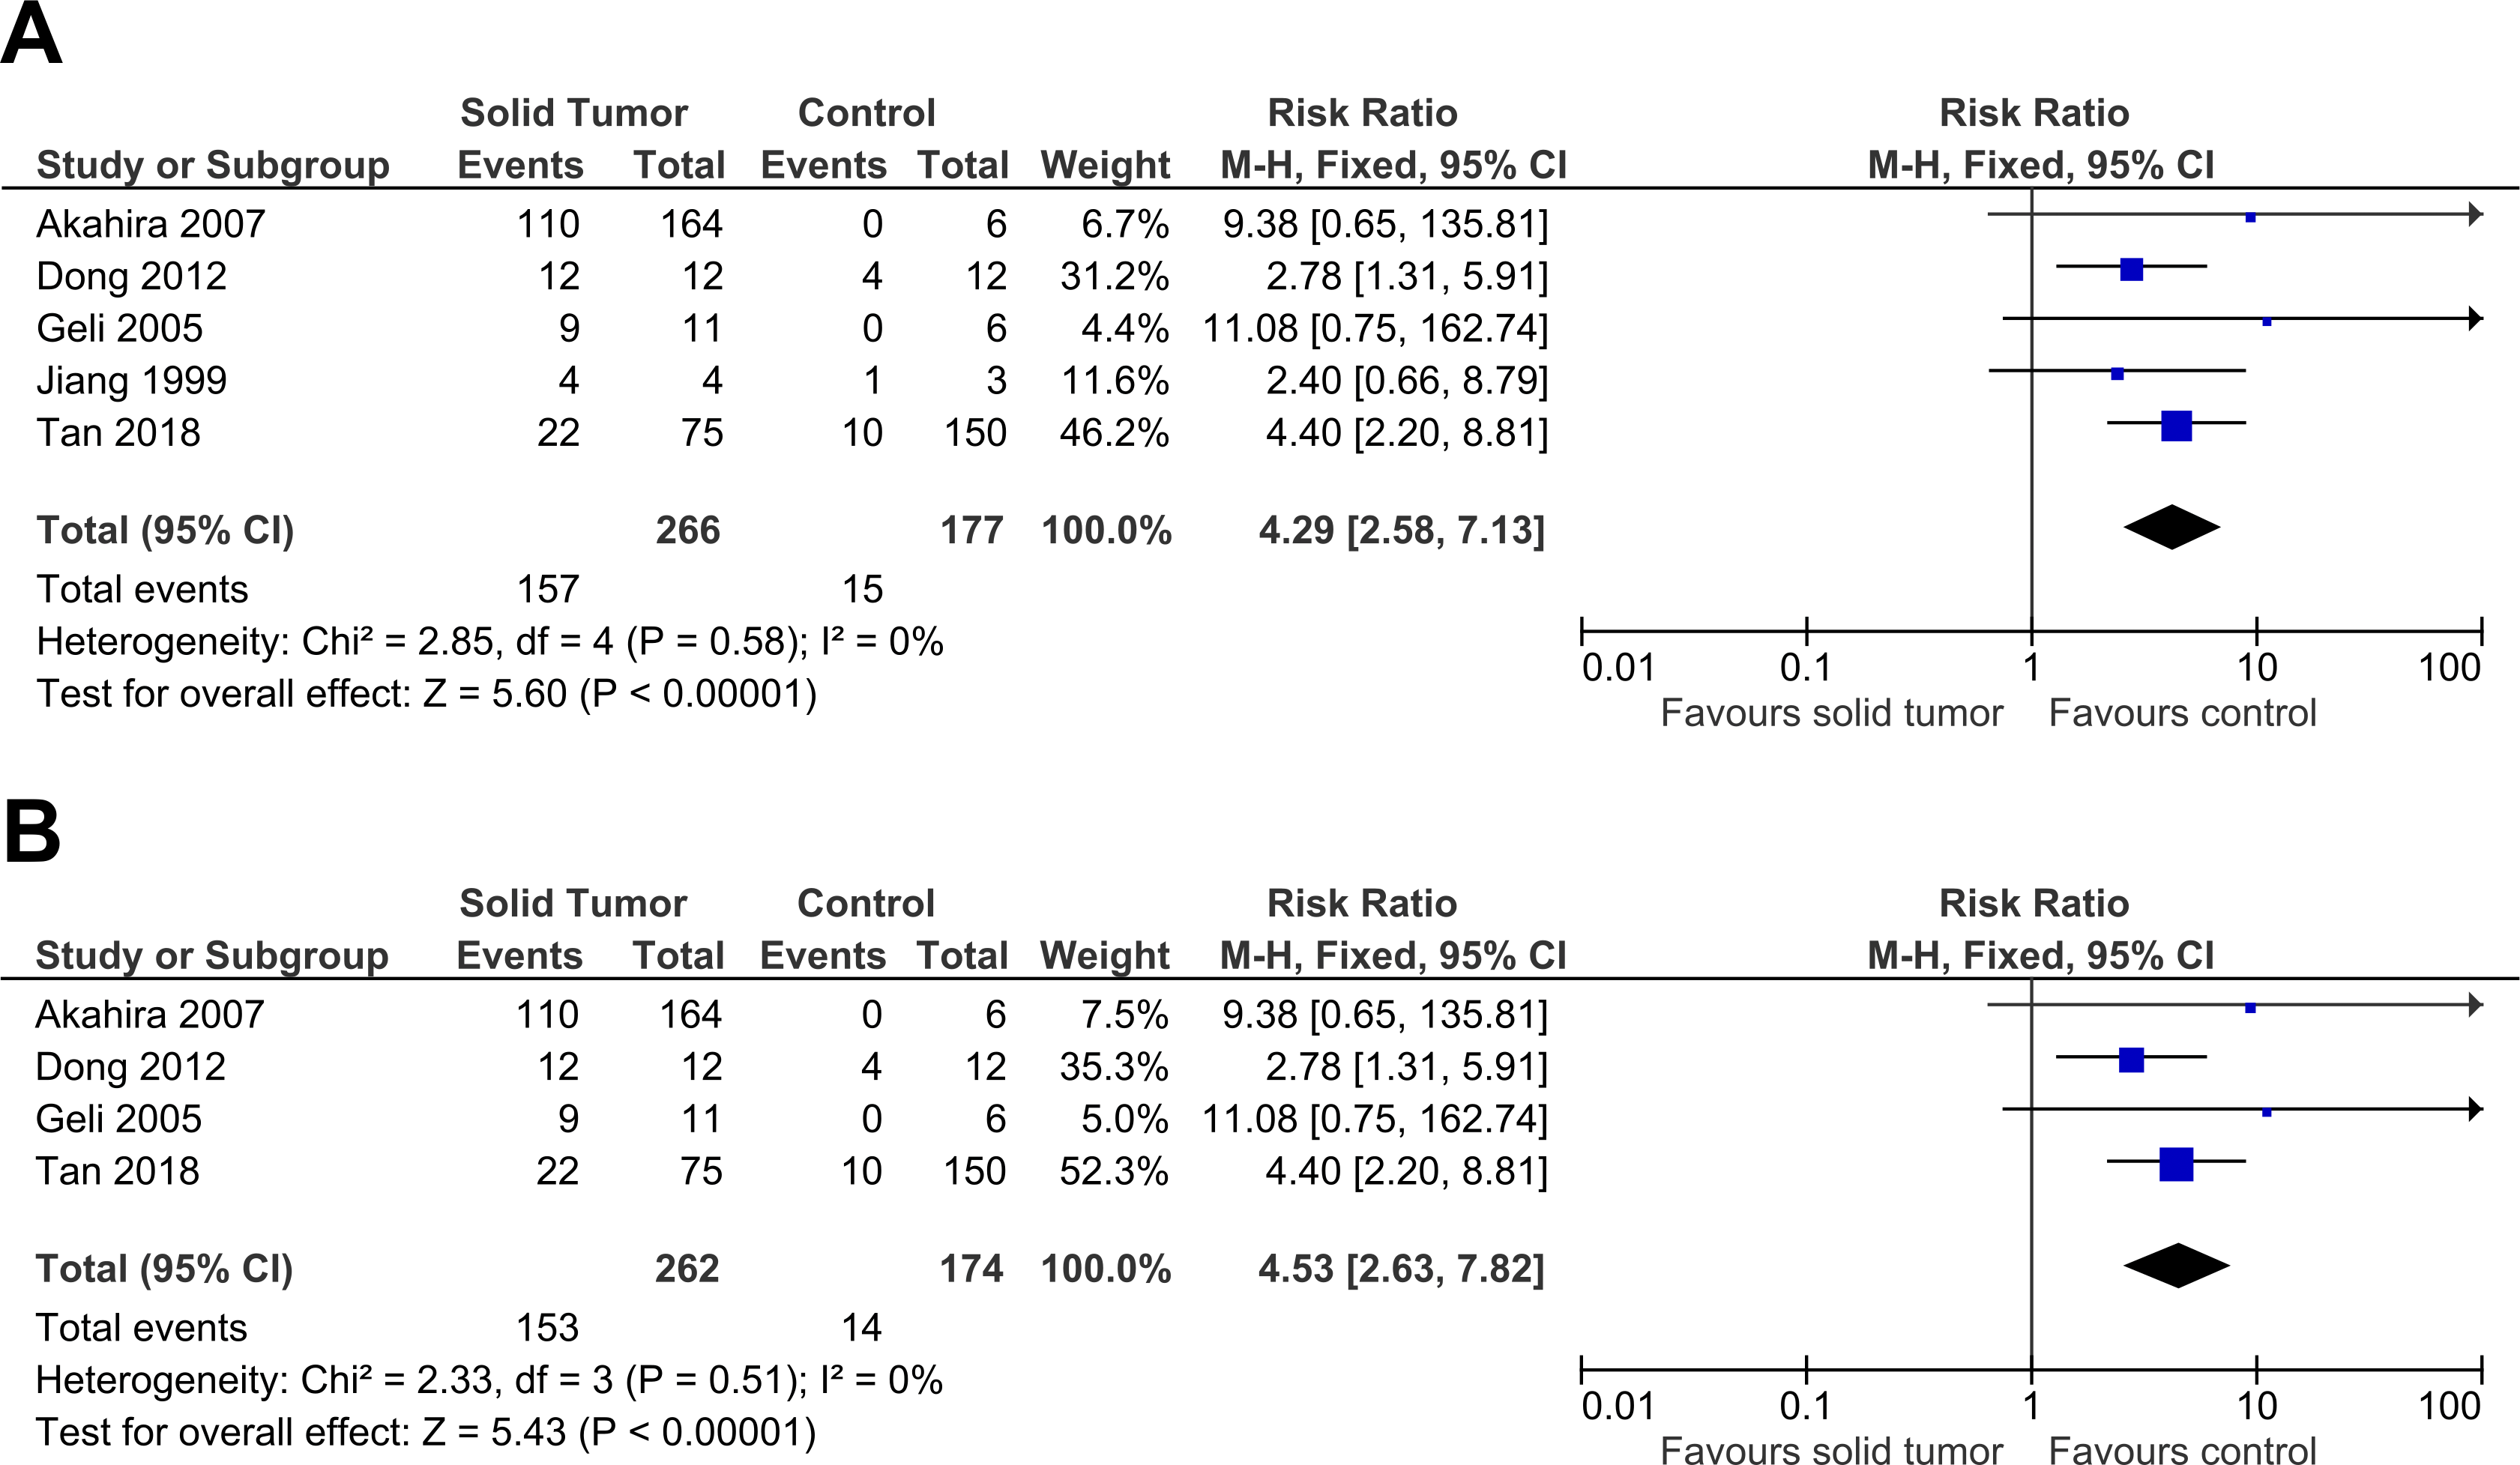
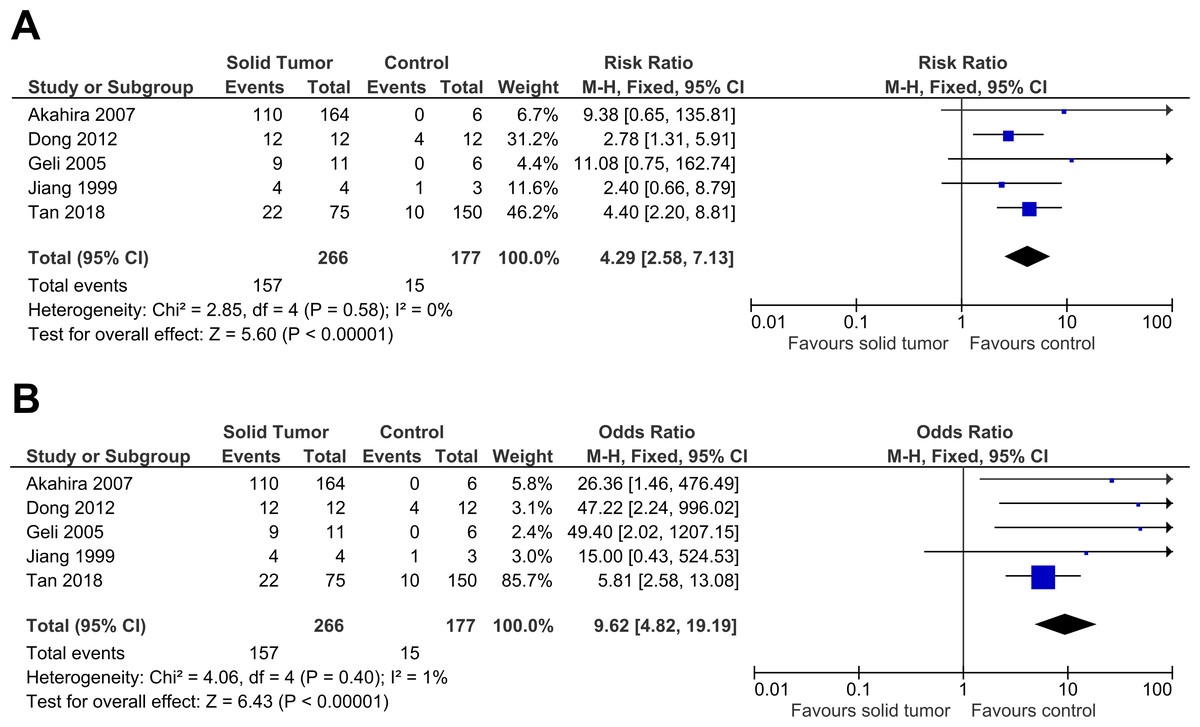
Figure 4: Sensitivity analysis to compare the use of Risk Ratio (RR) with Odds Ratio (OR).
There was a significant result for both analyses: (A) RR: RR 4.29, 95% CI [2.58–7.13], P < 0.00001; (B) OR: OR 9.62, 95% CI [4.82–19.19], P < 0.00001. The use of OR gave a result two times higher with the 95% CI three times wider when compared to RR. RR had a slightly lower heterogeneity when compared to OR (RR: X2 = 2.58, P < 0.58, I2 = 0%; OR: X2 = 4.06, P < 0.40, I2 = 1%). This sensitivity analysis proved that the results were stable. The horizontal line represents 95% CI. The blue box is the result of each individual study. The black diamond at the bottom of the plot is the pooled analysis of all studies. CI, Confidence interval. df, Degree of freedom. I2, Test of heterogeneity. M-H, Mantel-Haenszel.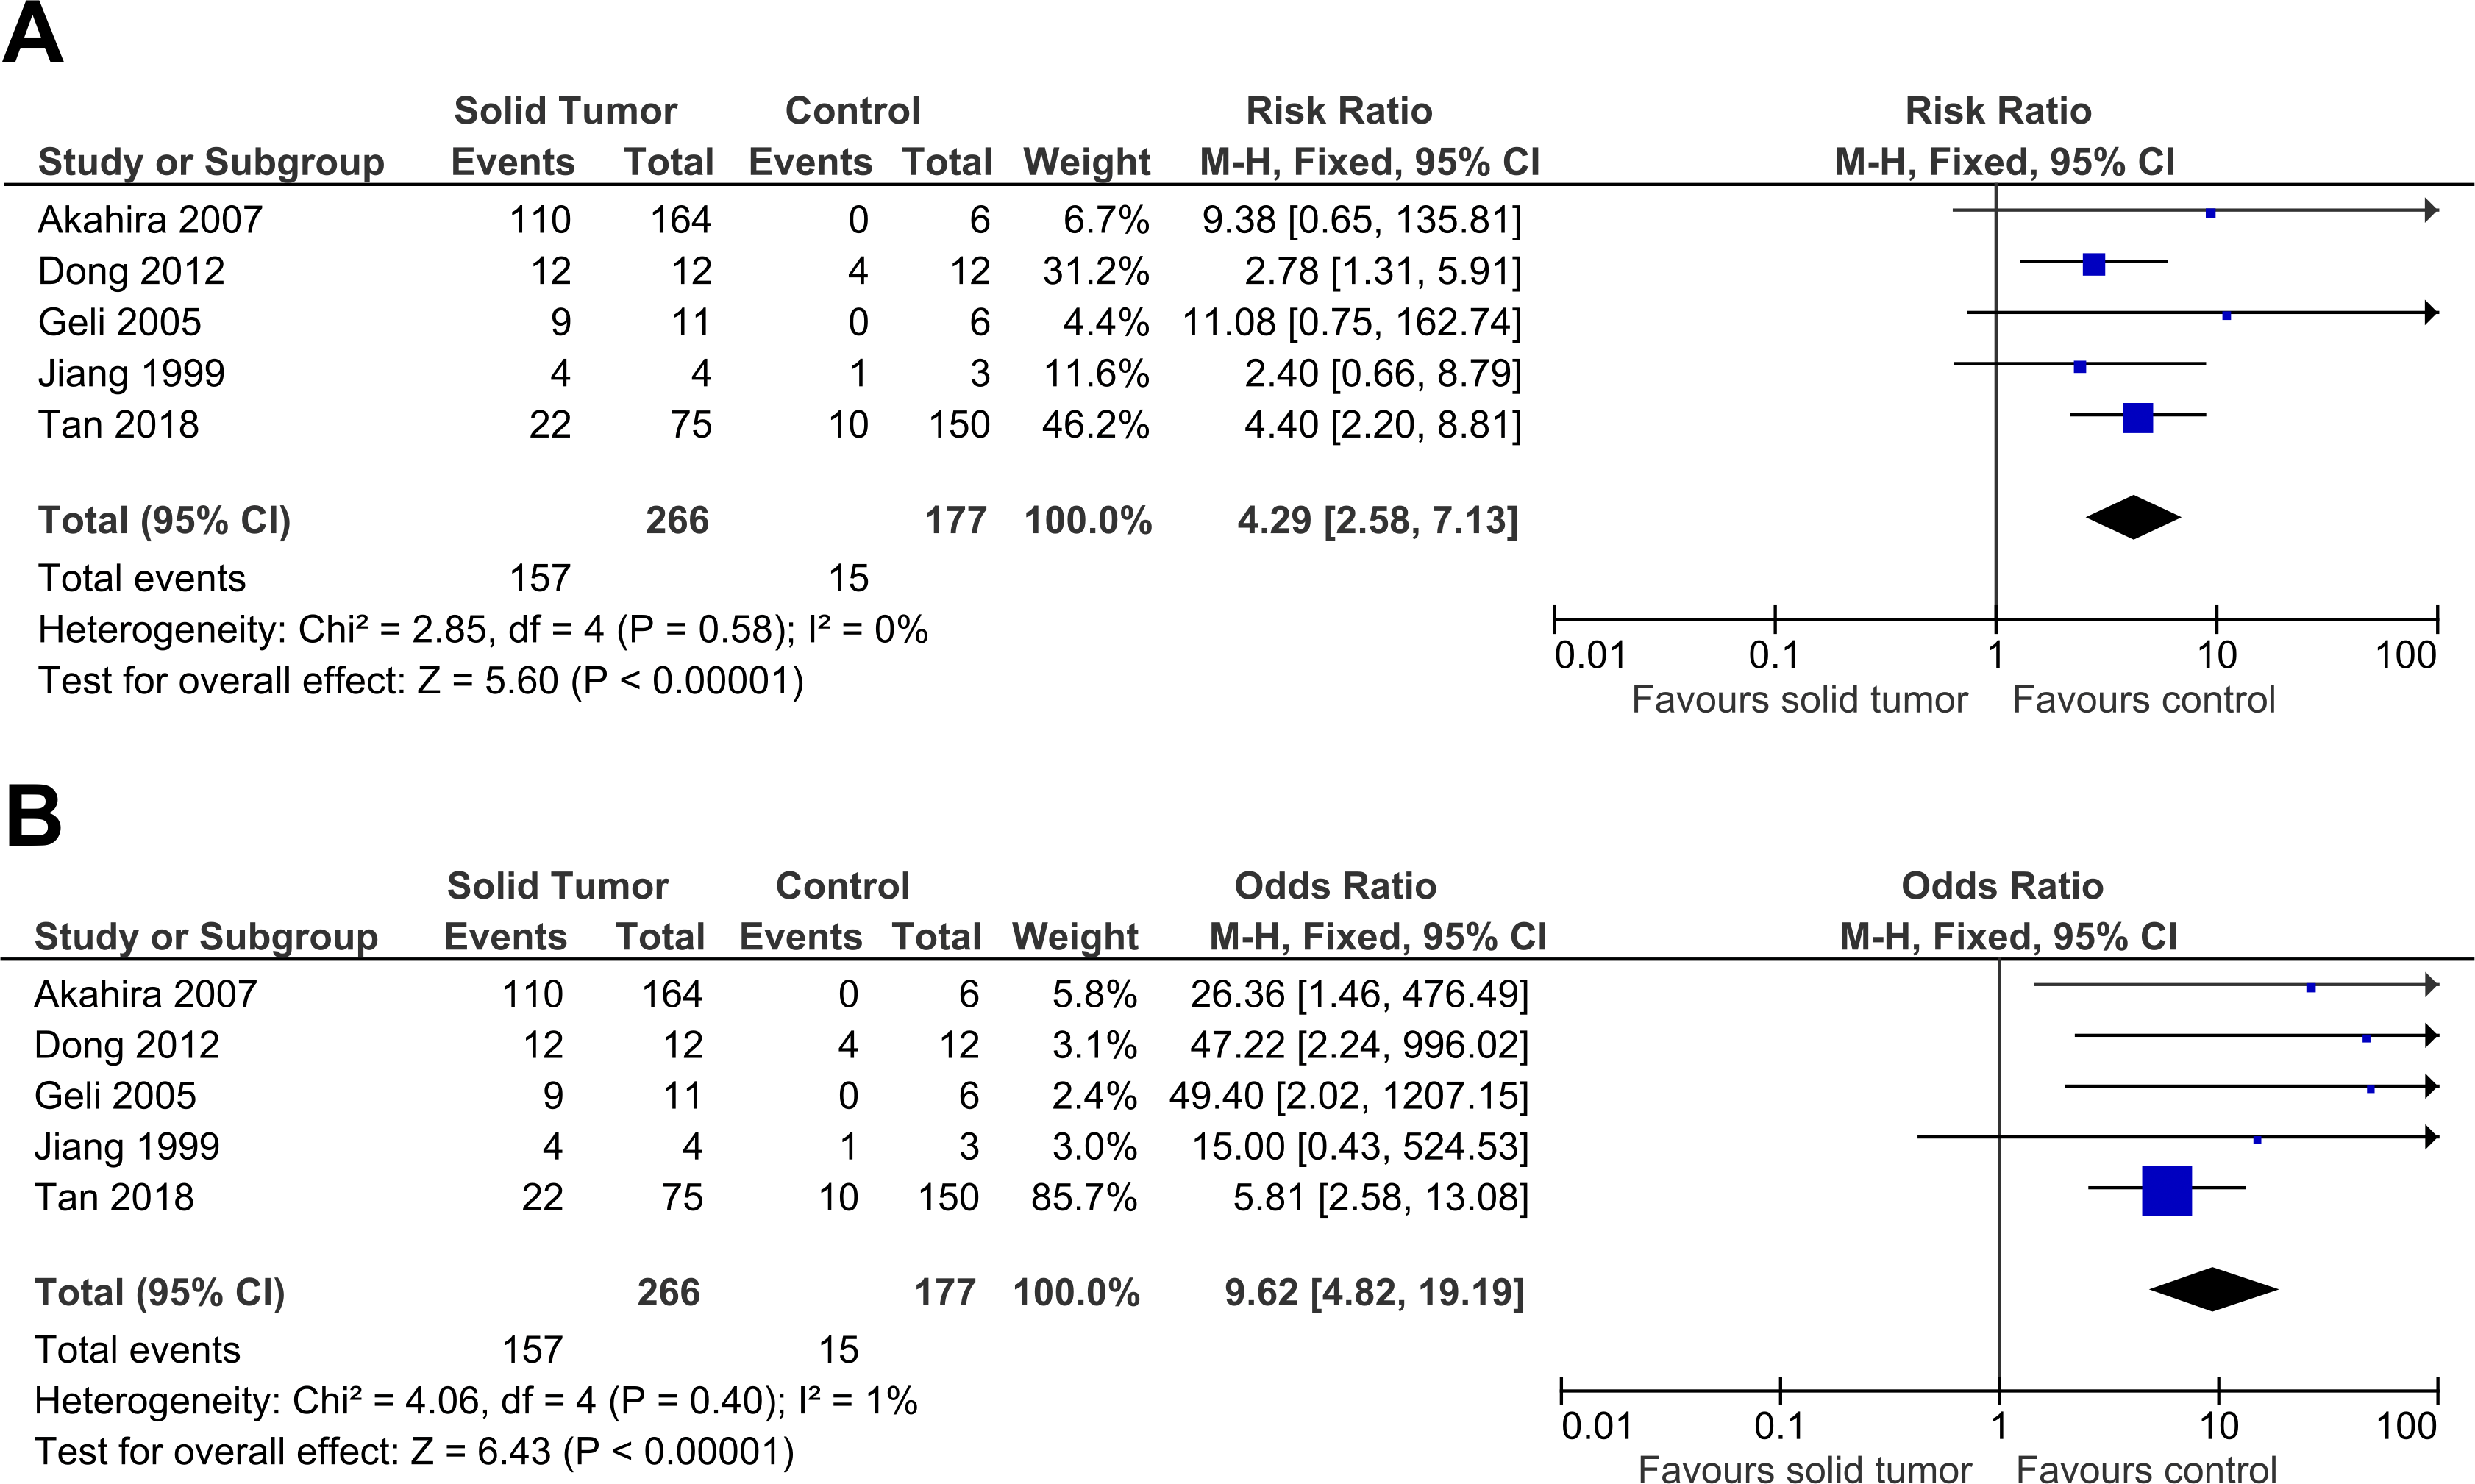

Figure 5: Sensitivity analysis to compare the use of Fixed Effects Model (FEM) with Random Effects Model (REM).
There was a significant result for both analyses: (A) FEM: RR 4.29, 95% CI [2.58–7.13], P < 0.00001; (B) REM: RR 3.61, 95% CI [2.28–5.72], P < 0.00001. FEM increased RR by 1.2 times higher with 95% CI 1.3 times wider. This sensitivity analysis proved that the results were stable. The horizontal line represents 95% CI. The blue box is the result of each individual study. The black diamond at the bottom of the plot is the pooled analysis of all studies. CI, Confidence interval. df, Degree of freedom. I2, Test of heterogeneity. M-H, Mantel-Haenszel.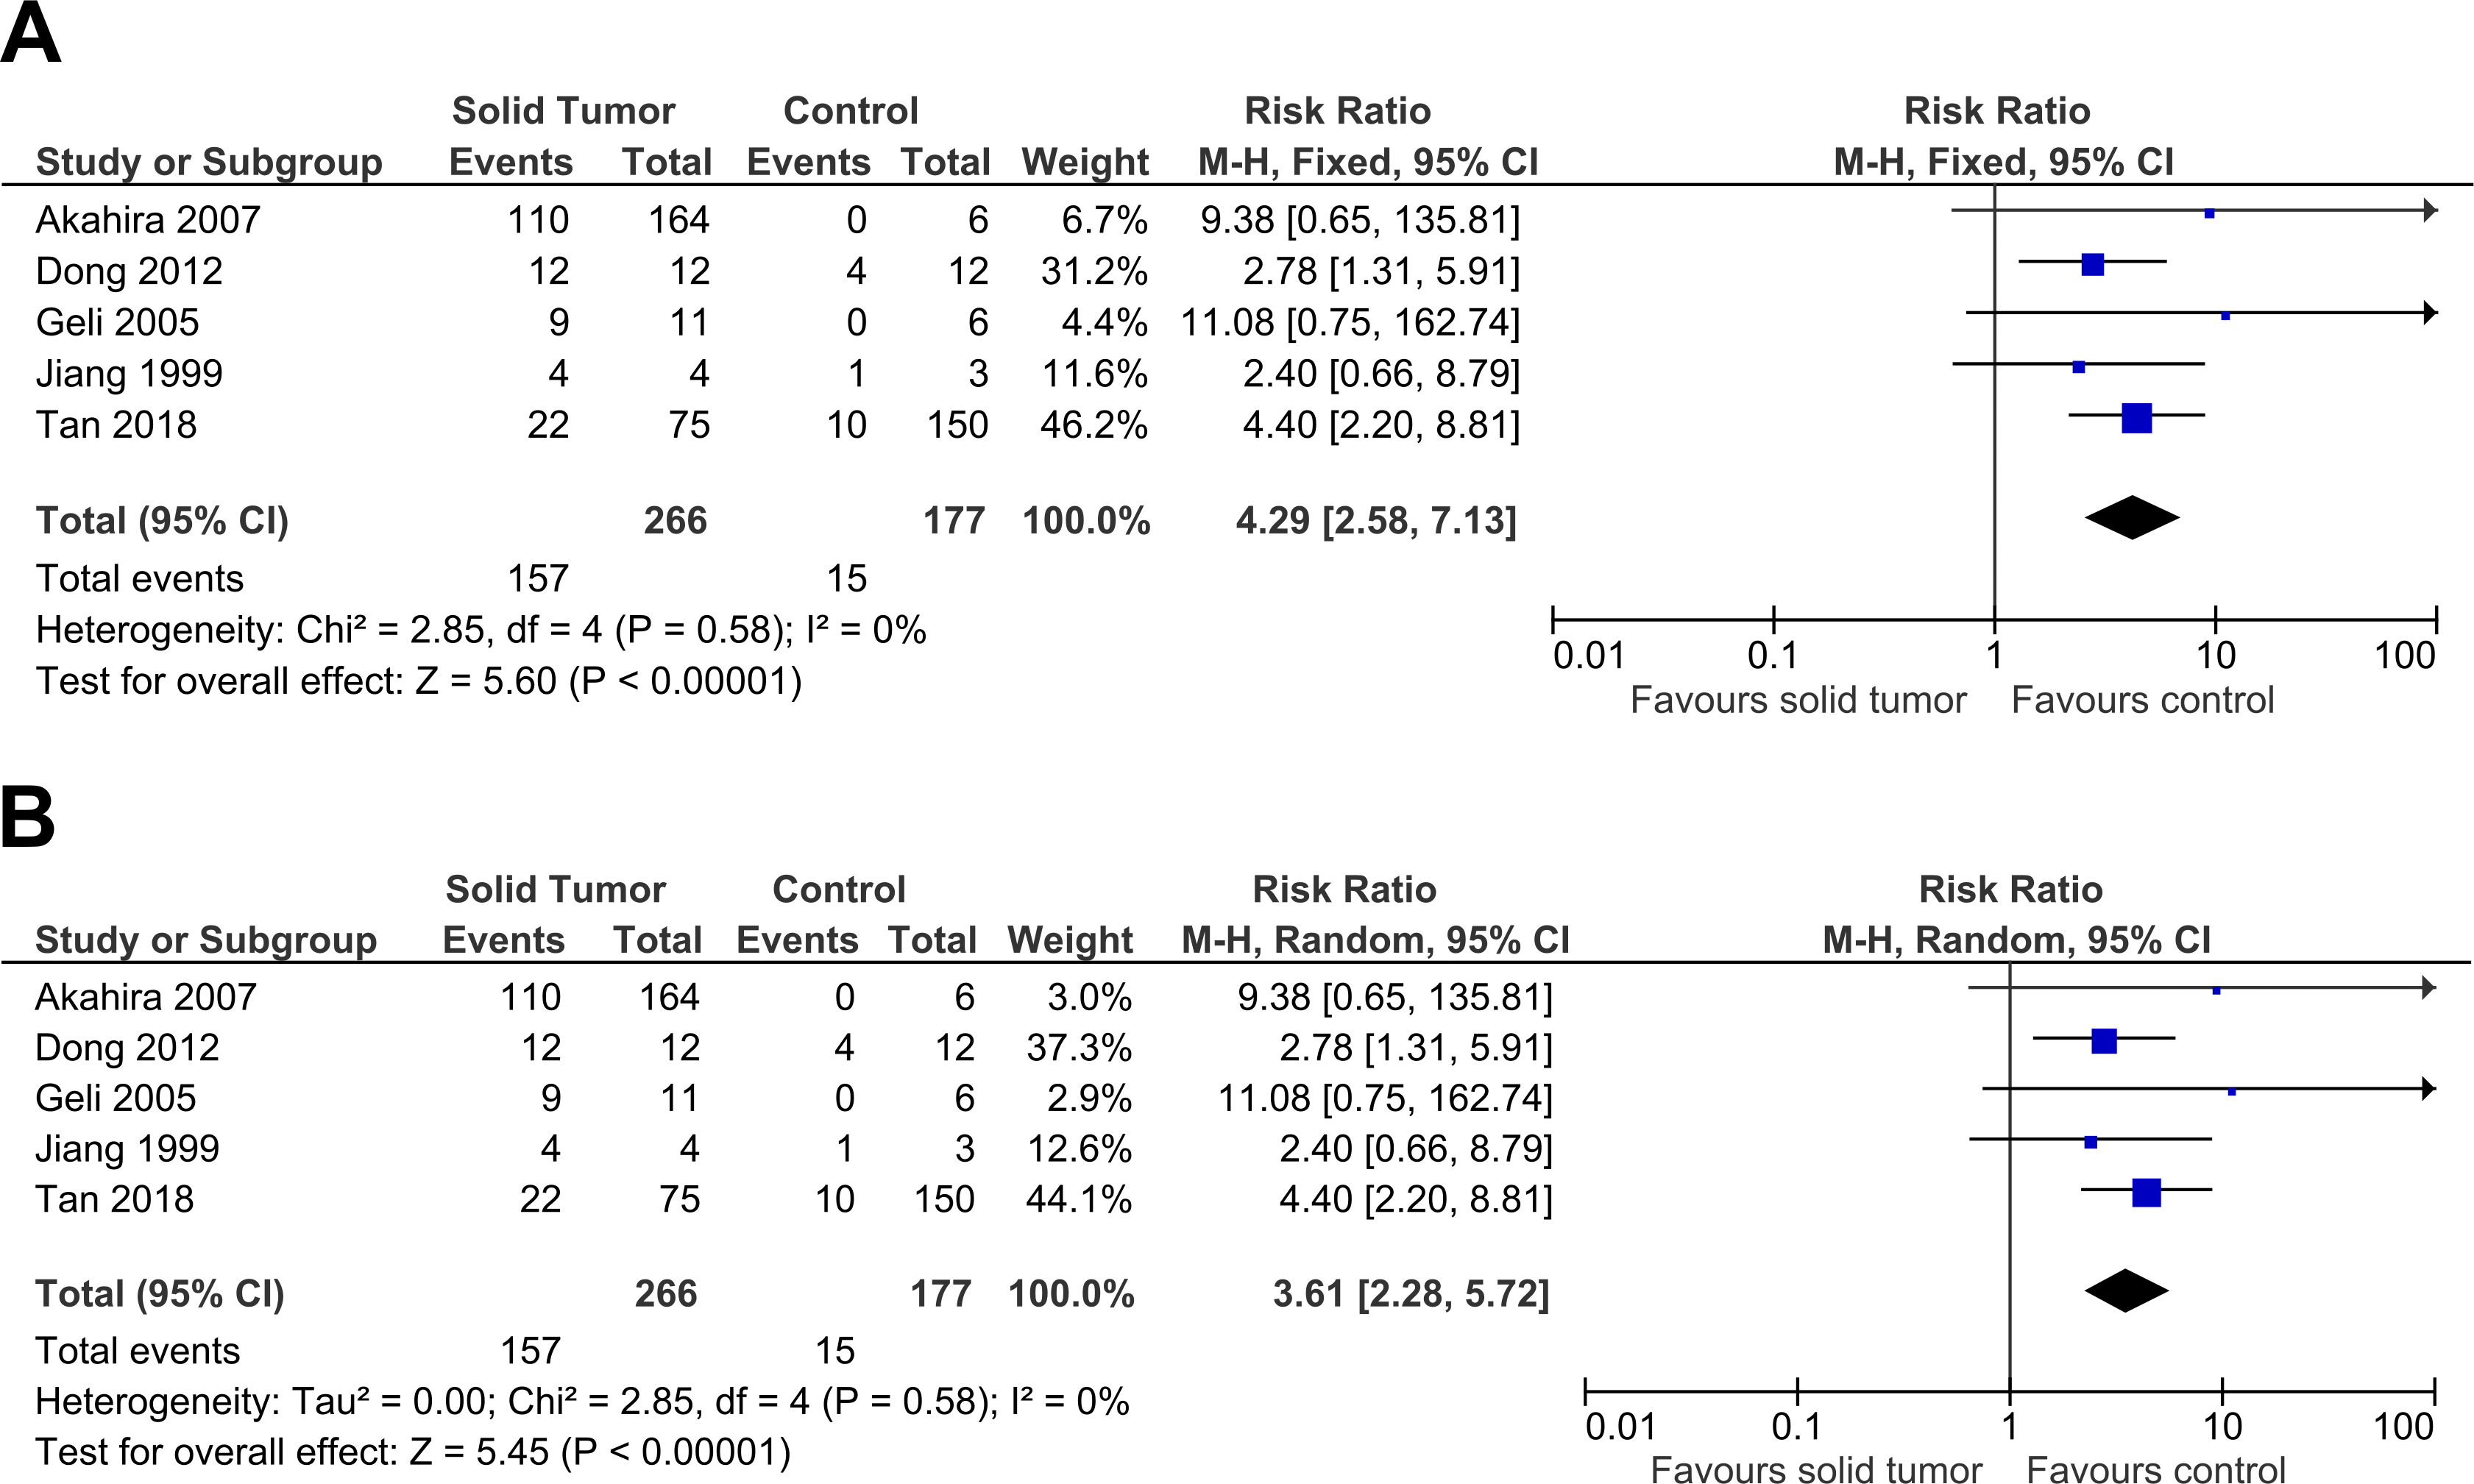
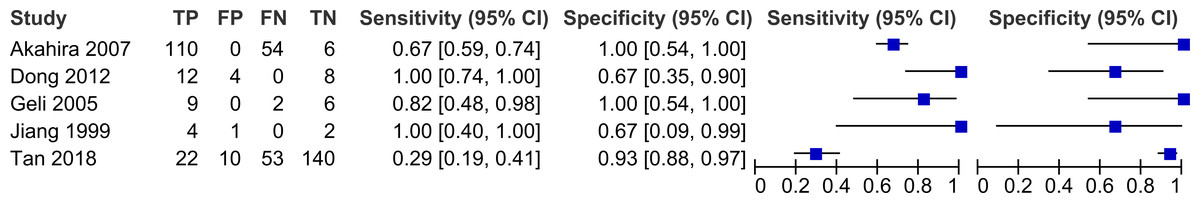
Figure 6: Forest plot for sensitivity and specificity of decreased PRDM2 gene expression in solid tumor.
Studies that have high sensitivities include Dong et al. (2012) (Sensitivity 1.00, 95% CI [0.74–1.00]) and Jiang et al. (1999) (Sensitivity 1.00, 95% CI [0.40–1.00]). Studies that have high specificities are Akahira et al. (2007) (Specificity 1.00, 95% CI [0.54–1.00]) and Geli et al. (2005) (Specificity 1.00, 95% CI [0.54–1.00]). The horizontal line represents 95% CI. The blue box is the result of each individual study. CI, Confidence interval. FN, False negative. FP, False positive. TN, True negative. TP, True positive.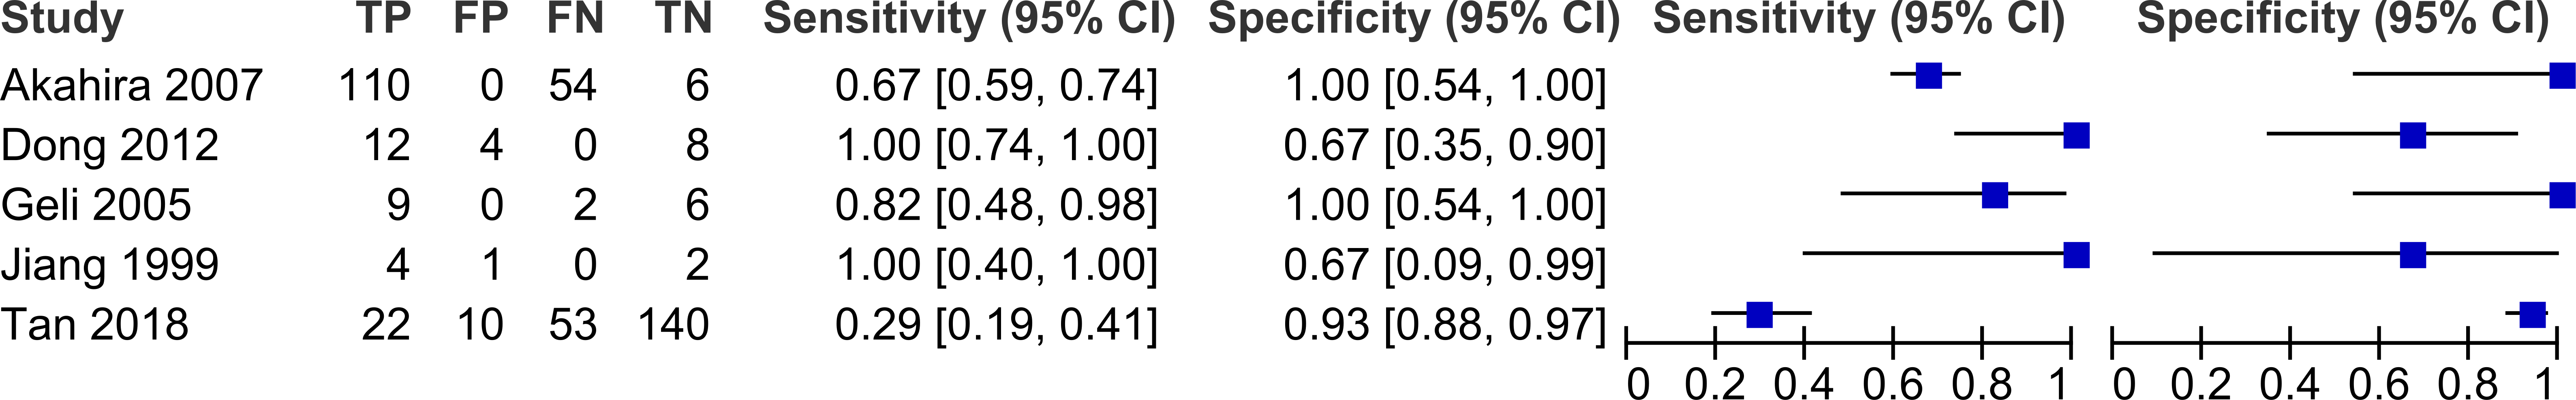
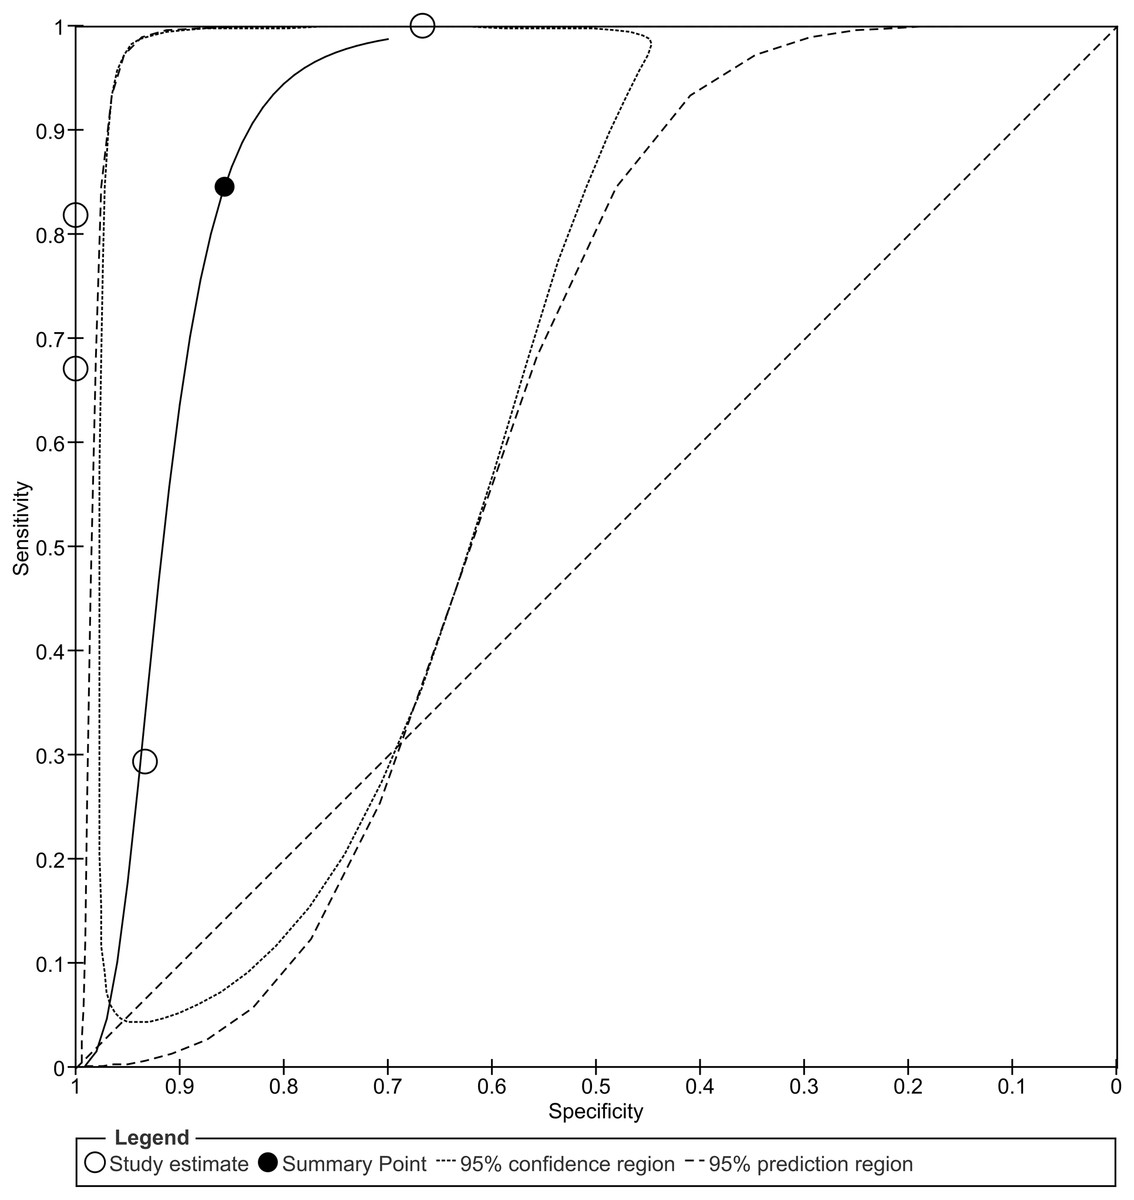
Figure 7: Summary receiver operating characteristic (SROC) curve of decreased PRDM2 gene expression in solid tumor.
The overall sensitivity and specificity is 84% (95% CI [39–98]%) and 86% (95% CI [71–94]%), respectively. The calculation of these results can be viewed at Fig. S1. The black circle (summary estimate) represents the summary estimate of sensitivity and specificity. The dotted lines around the summary point represents the 95% confidence region. The dashed lines represent the 95% prediction region (the region within which we are 95% certain that the results of a new study will lie).
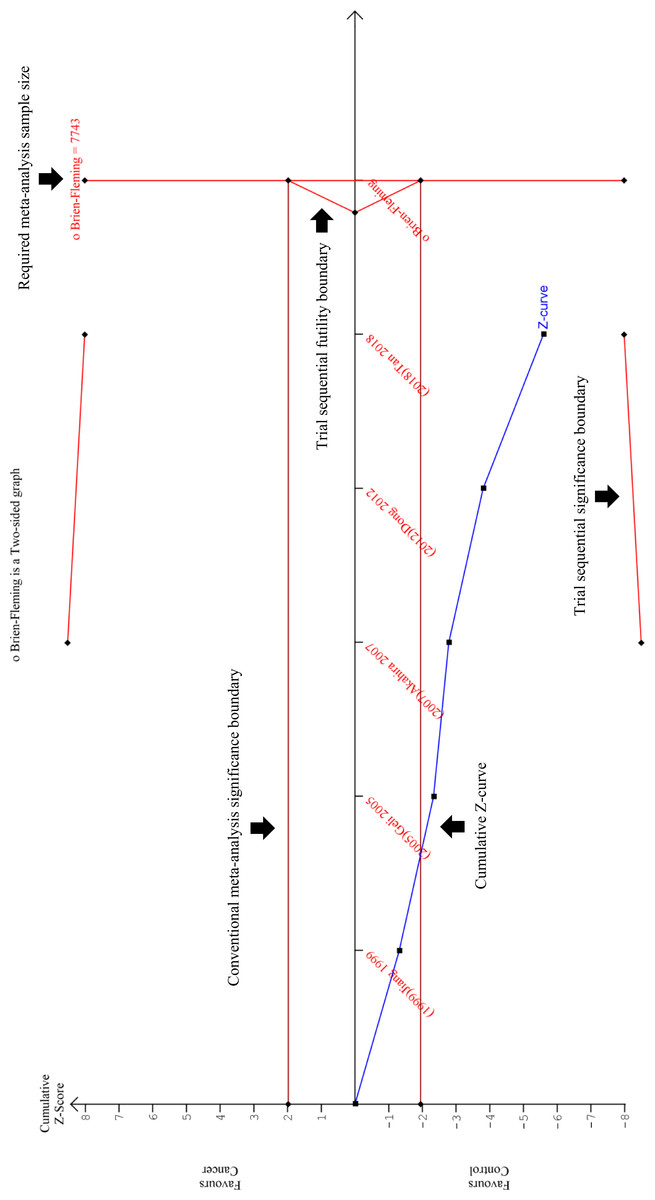
Figure 8: Trial Sequential Analysis (TSA) results of the meta-analysis.
The cumulative Z-curve (blue line) crossed the conventional meta-analysis significance boundary (horizontal red lines at Z = +1,96 and Z = −1,96), confirming that type I error was avoided. However, the cumulative Z-curve has not crossed the trial sequential significance boundary (diagonal red line at the top and bottom of the plot), suggesting that type II error might have not been avoided. Furthermore, the cumulative Z-score has also failed to reach the vertical red line on the right, indicating that this review has not reached the required sample size which is 7743. It is interesting to note that the cumulative Z-curve did not cross the trial sequential futility boundary (triangular red line on the right), implying that the addition of new samples could potentially improve the TSA results. In conclusion, this TSA analysis proved that this meta-analysis still requires more samples in order ensure that type II error was avoided. This is a magnified version of the TSA. The TSA results on a standard scale can be viewed at Fig. S2.
The sensitivity and specificity of PRDM2 downregulation in solid tumor were also assessed in order to investigate its potential as a diagnostic biomarker. A split forest plot displaying the sensitivity and specificity of the included studies is shown in Fig. 6. As demonstrated in the summary receiver operating characteristic (SROC) curve (Fig. 7), the summary sensitivity and specificity of decreased PRDM2 gene expression in solid tumor is 84% (95% CI [39–98]%) and 86% (95% CI [71–94]%), respectively. This result is in favor of PRDM2 downregulation as a potential diagnostic biomarker. However, the confidence interval for PRDM2 downregulation is wide, suggesting that there is marked imprecision. This was later confirmed on TSA (Fig. 8). In Fig. 8, the line representing the cumulative Z-curve failed to cross the significance boundary and did not reach the required number of studies which is 7743. Therefore, it can be concluded that the usage of PRDM2 downregulation as a diagnostic biomarker in solid tumor is still inconclusive.
Quality assessment of included studies
The quality of the included studied was evaluated using the QUADAS-2 tool, and a summary of the results can be viewed in Table 3. As shown in Table 3, in the index test domain there are four studies (Ge et al., 2015; Geli et al., 2005; Jiang et al., 1999; Tan et al., 2018) having an unclear risk of bias. These four studies did not directly state whether the index test (gene expression analysis) was interpreted independently from the reference standard (histopathological examination). Thus, we decided that unclear was most fit as the risk of bias. One of the studies, Jiang et al. (1999) also had missing information on how the patients were recruited, leading to an unclear risk of bias for one other domain. In general, the quality of the included studies was robust, ensuring the reliability of our systematic review and meta-analysis.
Confidence in cumulative evidence
By assessing five domains, including the risk of bias (by using the results from QUADAS-2 risk of bias assessment), indirectness, inconsistency, imprecision (by using the results from TSA) and risk of publication bias, a GRADE evidence profile was constructed as shown in Table 4. To be noted, all of the included studies used diagnostic accuracy test as their design, whereby all of the samples and controls will undergo both the index test and reference standard. Ideally, diagnostic studies should randomize which of the samples and controls will undergo the index test only and which will undergo the reference standard only. Hence, this made the design susceptible to indirectness. In addition, most of the included studies have wide confidence interval and inconclusive TSA results. Thus, serious was placed in the imprecision domain. As for publication bias, since the number of included studies is <10, publication bias could not be evaluated. Unfortunately, this does not entirely rule out the possibility of publication bias being present in our study, and thus we decided to downgrade the quality of evidence further. Overall, we have very low confidence in the pooled estimates obtained for our meta-analysis.
Discussion
In this study, we have successfully generated the first meta-analysis that investigated the potential of PRDM2 downregulation as a diagnostic biomarker in solid tumor. Compared to previous primary studies on PRDM2 thus far, we investigated the significance of PRDM2 with solid tumor on the level of a review. This includes the evaluation of quality assessment, data reliability and confidence in cumulative evidence, proving that our study was more comprehensive.
Meta-regression, funnel plot and Deek’s test were not performed due to the small number of studies obtained. Due to the inability to confirm the presence of publication bias, we also could not perform trim and fill method. Since our results indicated that there was no heterogeneity in the studies used, a subgroup analysis was not required.
| Study | Quality Assessment of Diagnostic Accuracy Studies-2 (QUADAS-2) | ||||||
|---|---|---|---|---|---|---|---|
| Risk of bias | Applicability concerns | ||||||
| Patient selection | Index test | Reference standard | Flow and timing | Patient selection | Index test | Reference standard | |
| Akahira et al. (2007) | Low | Low | Low | Low | Low | Low | Low |
| Dong et al. (2012) | Low | Low | Low | Low | Low | Low | Low |
| Ge et al. (2015) | Low | Unclear | Low | Low | Low | Low | Low |
| Geli et al. (2005) | Low | Unclear | Low | Low | Low | Low | Low |
| Jiang et al. (1999) | Unclear | Unclear | Low | Low | Low | Low | Low |
| Tan et al. (2018) | Low | Unclear | Low | Low | Low | Low | Low |
| Outcome | No. of studies | Design | Grading of Recommendations, Assessment, Development, and Evaluations (GRADE) | |||||
|---|---|---|---|---|---|---|---|---|
| Risk of bias | Indirectness | Inconsistency | Imprecision | Publication bias | Quality of evidence | |||
| True positives (patients/samples with solid tumor) | 5 studies (443 patients/samples) | Cross-sectional studies | Not serious | Seriousa | Not serious | Seriousb | NDc | |
| Very low | ||||||||
| False negatives (patients/samples incorrectly classified as not having solid tumor) | 5 studies (443 patients/samples) | Cross-sectional studies | Not serious | Seriousa | Not serious | Seriousb | NDc | |
| Very low | ||||||||
| True negatives (patients/samples without solid tumor) | 5 studies (443 patients/samples) | Cross-sectional studies | Not serious | Seriousa | Not serious | Seriousb | NDc | |
| Very low | ||||||||
| False positives (patients/samples incorrectly classified as having solid tumor) | 5 studies (443 patients/samples) | Cross-sectional studies | Not serious | Seriousa | Not serious | Seriousb | NDc | |
| Very low | ||||||||
Notes:
- ND
-
Not determined
- QUADAS-2
-
Quality Assessment of Diagnostic Accuracy Studies-2
- TSA
-
Trial sequential analysis
In line with previous studies, our results demonstrated that PRDM2 downregulation occurs in ovarian cancer, esophageal squamous cell carcinoma, hepatoma and lung cancer. According to Sorrentino et al. (2018), PRDM2 downregulation has also been reported in neuroblastoma, breast cancers, melanoma, parathyroid adenoma and Merkel cell carcinoma. However, our included studies did not investigate those solid tumors. Another notable difference is the inconclusive results linking PRDM2 downregulation with cancer stage and grade even though PRDM2 downregulation has been associated with cancer progression (Sun et al., 2011). A possible explanation for these inconsistencies might be due to the fact that our study only accepted human studies, and thus limited the possibility of encountering such studies. Interestingly, all of the individual studies did not have a standardised baseline to define PRDM2 downregulation. Although this could lead to possible heterogeneity, our study demonstrated otherwise.
Following these findings, an important question to address is whether PRDM2 downregulation could be used as a diagnostic biomarker in solid tumor. As described above, the high sensitivity and specificity of PRDM2 downregulation suggested its potential as a diagnostic biomarker. However, these values have wide confidence intervals and inconclusive TSA results, implying there was marked imprecision (Chai-Adisaksopha, Thorlund & Iorio, 2016; Tan & Tan, 2010). Thus, the use of PRDM2 downregulation as a diagnostic biomarker is still inconclusive. This imprecision might be due to the small number of sample and controls used in the individual studies or low variability in the subjects used (Carlson & Morrison, 2009). In addition, there was also a vast difference between the sample and control size, whereby the sample size is much larger. We believe that this was because some of the studies did not obtain their sample and control from the same subject. This made acquirement of control samples, such as normal ovaries or normal adrenal cells, much more difficult when compared to pathological samples that are readily retrieved for examination. Although our present study could not fully prove the potential of PRDM2 downregulation as a diagnostic biomarker due to its imprecision, it is important to highlight that these results can potentially improve with the addition of new studies. This has been proven by our TSA results whereby the line representing the cumulative Z-curve did not cross the futility boundary.
Another issue that should be addressed in the future is whether the quality of our evidence is satisfying enough. The quality of evidence is judged based on five domains: risk of bias, indirectness, inconsistency, imprecision and publication bias. It should be noted that all of the studies used in this review are diagnostic accuracy studies which are considered a proxy to randomised-controlled trials. Hence, indirectness is present, and this could lead to overestimation of sensitivity and specificity, resulting in the downgrading of the quality of evidence (Schmidt & Factor, 2013). As discussed before, imprecision is present, and publication bias could not be assessed, leading to further downgrading. Together, these three domains led to the downgrading of the quality of evidence from high to very low. Although there is very low confidence for our results, it is important to highlight once again that these results can improve if new studies are added.
Limitations of our study are the lack of RCTs as part of our included studies which made it difficult to evaluate the internal validity of our results (Carlson & Morrison, 2009). As mentioned before, our study also lacks clinicopathological data in order to assess the potential of PRDM2 further. Interestingly, none of the included studies investigated PRDM2 gene expression in the same type of solid tumor. Hence, we were unable to evaluate in which type of solid tumor is PRDM2 downregulation most suitable to be used as a biomarker. Furthermore, there was no standardised baseline among studies. Another limitation of this study involves the issue of only using studies written in English, leading to the possibility of language bias. Most of the individual studies have a wide confidence interval and inconclusive TSA results, indicating there is insufficient knowledge about the effect and that further research should be done. Based on the points above, it can be concluded that a major source of limitation is due to the small number of studies.
Conclusions
In conclusion, our review suggested that PRDM2 gene expression is decreased or downregulated in solid tumor. Due to insufficient data, we are unable to determine the relationship between PRDM2 downregulation and clinicopathological data. Although the sensitivity and specificity of PRDM2 downregulation are imprecise, its high values, in addition to the evidence that suggested PRDM2 downregulation in solid tumor, hinted that it might still have a potential to be used as a diagnostic biomarker. Furthermore, its imprecision could potentially be solved through the addition of new studies. Thus, we suggest more research to be conducted, especially those with RCT as their design, to fully elucidate the potential of PRDM2 downregulation in solid tumor. More study is urgently needed to determine a standardised baseline for PRDM2 downregulation level. We would also recommend more research regarding the relationship between PRDM2 gene expression with clinicopathological data to further evaluate the potential of PRDM2 gene expression in solid tumor. Finally, once there is sufficient data available, we suggest a new systematic review and meta-analysis to be done in order to renew the findings of our study.