
Suppression of osteogenic differentiation and mitochondrial function change in human periodontal ligament stem cells by melatonin at physiological levels
- Published
- Accepted
- Received
- Academic Editor
- Dunxian Tan
- Subject Areas
- Cell Biology, Developmental Biology, Dentistry
- Keywords
- Melatonin, Mitochondrial function, Mitochondrial dynamics, Osteogenic differentiation, Periodontal ligament stem cell
- Copyright
- © 2020 Zheng et al.
- Licence
- This is an open access article distributed under the terms of the Creative Commons Attribution License, which permits using, remixing, and building upon the work non-commercially, as long as it is properly attributed. For attribution, the original author(s), title, publication source (PeerJ) and either DOI or URL of the article must be cited.
- Cite this article
- 2020. Suppression of osteogenic differentiation and mitochondrial function change in human periodontal ligament stem cells by melatonin at physiological levels. PeerJ 8:e8663 https://doi.org/10.7717/peerj.8663
Abstract
N-Acetyl-5-methoxytryptamine (melatonin, MT) at pharmacological concentrations promotes the osteogenic differentiation of human bone marrow-derived mesenchymal stem cells; however, its role at physiological concentrations (1 pM–10 nM) remains unclear. We explored the effects of 1 pM–1 µM MT on the osteogenic differentiation of human periodontal ligament stem cells (hPDLSCs) and its underlying mitochondrial dynamics-mediated mechanisms. T he PDLSC phenotype was detected by flow cytometry and evaluated for three-line differentiation. Alkaline phosphatase activity assay and Alizarin red staining were used to evaluate osteogenic differentiation. Osteogenesis-related gene and protein expression levels were measured by quantitative reverse transcription -polymerase chain reaction and western blotting. Mitochondrial function assays were performed using reactive oxygen species, ATP and NAD+/NADH kits and molecular mechanisms of mitochondrial dynamics-related proteins were assessed by western blotting. Our results have shown that physiological MT concentrations induced differentiation of hPDLSCs and down-regulated osteopontin (OPN) and osteocalcin (OCN) expression levels, which were restored or even up-regulated by 1 µM MT (lowest pharmacological concentration). Compared to the osteogenic induction alone, this treatment decreased the intracellular ATP content, whereas the intracellular reactive oxygen species level and NAD+/NADH ratio were increased. Mitochondrial function- and dynamics-related protein expression levels were consistent with those of osteogenic genes following osteogenic induction and MT treatment of hPDLSCs at various physiological concentrations. Physiological MT concentrations inhibited the osteogenic differentiation of hPDLSCs and simultaneously altered mitochondrial function. These findings provide insights into the stem cell tissue engineering and functions of MT.
Introduction
Human periodontal ligament stem cells (hPDLSCs) can be isolated from the human periodontal ligament (hPDL). Stem cell therapy and tissue engineering are promising treatments for bone defects, with hPDLSCs as possible ideal seed cells (Xu et al., 2019). hPDLSCs have good osteogenic, neural chondrogenic, and adipogenic differentiation abilities (Zhu & Liang, 2015). Cell differentiation is associated with the mitochondria, particularly its dynamics and biogenesis (Seo, Yoon & Do, 2018). Forni et al. (2016) suggested that mitochondrial fusion and fission play a vital role in mitochondrial network remodeling during differentiation.
Mitochondria, as subcellular structures, have various functions including ATP production, cellular Ca2+ buffering and apoptosis (Arruda & Hotamisligil, 2015; Kato et al., 2017). Cell differentiation requires a considerable amount of energy, in which the mitochondrion plays a vital role (Shen et al., 2018). Furthermore, the loss of stem cell pluripotency and differentiation is associated with an increased mitochondrial oxidative capacity (Mitra, 2013). Mitochondrial biogenesis and dynamics are involved in the osteogenic differentiation of mesenchymal stem cells (Chen et al., 2008). Additionally, mitofusin-2 (MFN2), dynamin-related protein1, mitochondrial fission factor (MFF), and translocase of outer membrane 20 (TOM20) may regulate mitochondrial dynamics (Grey et al., 2000).
N-Acetyl-5-methoxytryptamine (melatonin, MT) is mainly synthesized by the pineal gland and affects sleep induction, antitumor, anti-inflammatory and free radical scavenging activities (Mauriz et al., 2013). MT plays an important role in bone metabolism by promoting osteoblast osteogenesis (Zhou et al., 2019). The osteoblast-inducing, bone-enhancing effects of MT involved osteoblasts and osteoclasts through the regulation of melatonin type 2 (MT2) receptor, MEK1/2 and MEK5 (Maria et al., 2018). MT was also found to suppress osteoclastic and osteoblastic activities in goldfish scales (Suzuki & Hattori, 2002) and protect against the oxidative stress-induced hPDL osteoblast senescence phenotype and osteoclast differentiation (Bae et al., 2018). Two ranges of MT concentrations, 0.01–10 and 1–100 nM, are considered as physiological and pharmacological, respectively (Moriya et al., 2007). MT dosage of 5 and 100 nM directly stimulates hBMSCs and osteoblast osteogenic differentiation via the MT2 receptor pathway (Radio, Doctor & Witt-Enderby, 2006; Sharan et al., 2017). It has been shown that a continuous exposure for 21 days to 50 nM MT is required to induce osteoblast differentiation from human mesenchymal stem cells (hAMSCs) through the formation of MT2R/Gi/β-arrestin/MEK/ERK1/2 complexes and subsequently induce osteogenesis (Sethi et al., 2011). Studies of MT have typically used pharmacological concentrations (Lee, Le & Kang, 2018; Li et al., 2019); however, few studies have used physiological concentrations in normal cells such as hPDLSCs.
The development of endosymbiotic evolution theory supports that MT is synthesized and metabolized by the mitochondria and chloroplasts (Zhao et al., 2019). A previous study showed that MT inhibits proliferation and promotes differentiation via mitochondrial complex I and IV activity (Liu et al., 2013). Additionally, MT treatment enhanced cisplatin and radiation cytotoxicity in head and neck squamous cell carcinoma by stimulating mitochondrial reactive oxygen species (ROS) generation, apoptosis and autophagy (Fernandez-Gil et al., 2019). Furthermore, MT may restore normal mitochondrial function (Reiter, Tan & Galano, 2014). Thus, strategies for achieving MT-induced changes in mitochondrial function are needed.
We investigated the effects of physiological MT concentrations on osteogenic differentiation of hPDLSCs and preliminarily explored the associated mechanisms of mitochondrial dynamics.
Materials & Methods
Isolation and culture of hPDLSCs
The study protocol was approved by the Medical Ethics Committee of the Hospital of Stomatology Sun Yat-sen University, China (KQEC-2019-10). We extracted and collected 15 healthy human premolars from 15 healthy adult patients aged 18–25 years undergoing orthodontic therapy at the Hospital of Stomatology, Sun Yat-sen University. All participating patients signed a written informed consent form. hPDLSCs were isolated and cultured as previously described (Seo, Miura & Gronthos, 2004). In our study, cells grown in alpha modified Eagle’s medium (α-MEM) containing 10% fetal bovine serum (FBS) were used at passage 3–5 for subsequent experiments. hPDLSCs were cultured in osteogenic medium (OS, 10% FBS, 0.1 mM dexamethasone, 0.2 mM ascorbic acid, and 10 mM β-glycerophosphate; Sigma-Aldrich, St. Louis, MO, USA). The hPDLSCs were cultured in basal growth medium or OS with MT at various concentrations (0, 1 pM, 0.1 nM, 10 nM and 1 µM, Sigma-Aldrich) for 3, 7 or 21 days. All above media and reagents were purchased from Gibco (Grand Island, NY, USA) unless otherwise noted.
Multipotential differentiation
hPDLSCs were induced in OS, adipogenic medium (Cyagen Biosciences, Santa Clara, CA, USA), and chondrogenic medium (Cyagen Biosciences) for 21 days. Next, the cells were fixed in 4% paraformaldehyde and stained with 1% Alizarin red staining (ARS) solution (Cyagen Biosciences) for the osteogenesis assay. Additionally, 3 mg/mL oil red O (Sigma-Aldrich) was used for adipogenesis analysis and Alcian blue staining for the chondrogenic assay. The images were viewed using an inverted microscope (Zeiss AG, Oberkochen, Germany).
Cell surface marker expression of hPDLSCs
Passage 3 hPDLSCs were prepared for flow cytometric analysis to detect stem cell surface makers. The cells were incubated in TrypLE buffer (Gibco) to obtain single-cell suspensions and then resuspended in phosphate-buffered saline (PBS) containing 2% FBS. The cells were incubated with the mesenchymal markers CD34, CD45, CD73, CD90, CD164 and CD166 (BD Biosciences, Franklin Lakes, NJ, USA) for 30 min at 4 °C. Cell samples were analyzed by flow cytometry (Beckman Coulter, Brea, CA, USA).
MT affects hPDLSCs viability
The hPDLSCs were treated with different concentrations of MT (0, 1 pM, 0.1 nM, 10 nM, and 1 µM). Cell viability was tested with the cell counting kit-8 (CCK8, Dojindo, Kumamoto, Japan) after 0, 24, 48, 72 and 96 h according to the manufacturer’s instructions. The absorbance was determined at a wavelength of 450 nm.
Alkaline phosphatase (ALP) activity assay
hPDLSCs were cultured in OS supplemented with different concentrations of MT for 3 days. Next, a commercial ALP kit (Jiancheng, Nanjing, China) was used to measure ALP activity following the manufacturer’s instructions. The generation of p-nitrophenol in the presence of ALP was determined by measuring the OD at a wavelength of 520 nm. The OD was normalized to the protein concentration.
Quantitative assay of ARS
hPDLSCs were exposed to MT at various concentrations in OS for 21 days. The cells were stained with ARS and images were acquired with a camera (Nikon, Tokyo, Japan). Next, 500 µL of 0.1 M hexadecylpyridinium chloride monohydrate (Sigma) was added to each well to dissolve the contents at 37 °C for 30 min. Subsequently, 100 µL of samples was transferred to the wells of a 96-well plate, and the absorbance of the supernatant was measured at 562 nm.
Quantitative real-time reverse transcription-polymerase chain reaction (qRT-PCR) analysis
The hPDLSCs were cultured for 7 days, and total mRNA was extracted using a RNA-Quick purification kit (YISHAN Biotechnology, Shanghai, China) according to the manufacturer’s instructions. Next, first-strand cDNA was synthesized using PrimeScript™ reverse transcription (RT) Master Mix (TaKaRa, Shiga, Japan). PCR was performed with SYBR Green I Master Mix (Roche Applied Science, Basel, Switzerland) following the manufacturer’s protocol. Gene-specific primers used in this study were commercially synthesized, and their sequences are listed in Table 1.
| Gene abbr. | Species | Forward primers, 5′–3′ | Reverse primers, 5′–3′ | |
|---|---|---|---|---|
| OPN | Human | GTGATTTGCTTTTGCCTCCT | GCCACAGCATCTGGGTATTT | |
| OCN | Human | AGCAAAGGTGCAGCCTTTGT | GCGCCTGGGTCTCTTCACT | |
| GAPDH | Human | TCTCCTCTGACTTCAACAGCGACA | CCCTGTTGCTGTAGCCAAATTCGT | |
Western blotting
The hPDLSCs were lysed for 30 min at 7 days post osteogenic induction. Cell extracts containing 40 µg total protein were loaded and separated by 4–20% sodium dodecyl sulphate-polyacrylamide gel electrophoresis (SurePAGE, Ubiotechnology, Guangdong, China) and transferred onto a polyvinylidene fluoride membrane (Millipore, Billerica, MA, USA). The membranes were blocked in Tris-buffered saline +0.1% Tween-20 (TBST) containing 5% bovine serum albumin (BioFroxx, Einhausen, Germany) for 2 h at 20 °C–25 °C after transfer. The membranes were immunoblotted with the following primary antibodies at a 1:1,000 dilution: polyclonal rabbit anti-OPN (Novus Biologicals, Littleton, CO, USA); polyclonal rabbit anti-OCN (Novus Biologicals), mitochondrial dynamics antibody sampler kit (Cell Signalling Technology, Danvers, MA, USA); and monoclonal mouse anti-β-actin (Beyotime, Shanghai, China) overnight at 4 ° C. This was followed by incubation with secondary antibodies at 20 °C–25 °C for 1 h. Immunoreactive bands were visualized by chemiluminescence detection reagents (Millipore, Temecula, CA) according to the manufacturer’s instructions. Band intensities were quantified using ImageJ 1.36b (NIH, Bethesda, MD, USA).
Measurement of intracellular ATP content
The hPDLSCs were cultured for 7 days, after which the ATP level was measured with an enhanced ATP assay kit (Beyotime) according to the manufacturer’s instructions. Absorbance was measured with a luminometer (GloMax Multiplus plate reader, Promega, Madison, WI, USA). Luminescence intensity was divided by the total number of cells.
Measurement of intracellular ROS
hPDLSCs were cultured for 7 days in TrypLE buffer to obtain single-cell suspensions, resuspended in α-MEM containing 2% FBS, incubated with 5 µM CellROX® green reagent (Invitrogen, Carlsbad, CA, USA) at 37 °C for 30 min, and then washed with PBS three times. The fluorescence intensity of 1 × 10⁴ cells was recorded by flow cytometry.
NAD+/NADH assay
hPDLSCs were cultured for 7 days. Intracellular NAD+ and NADH levels were measured using an NAD+ and NADH assay kit (Beyotime) according to the manufacturer’s instructions. The absorbance of the supernatant was measured at 450 nm, and the NAD+/NADH ratio was calculated as follows: [NAD+ − NADH]/NADH.
Statistical analysis
All data are expressed as the means ± S.D. One-way analysis of variance was used to compare groups, and Fisher’s least significant difference (LSD) was used for post-hoc analysis. P < 0.05 was considered to indicate statistical significance. All experiments were performed in triplicate and SPSS 22.0 software (SPSS, Inc., Chicago, IL, USA) was used for statistical analysis.
Results
Isolation and characterization of PDLSCs
hPDLSCs were successfully obtained and exhibited a homogeneous, large, fibroblast-like morphology (Fig. 1A). hPDLSCs showed morphological changes and osteogenic/adipogenic/chondrogenic differentiation potential after 3 weeks of induction (Figs. 1B–1D). The mesenchymal stem cell (MSC) properties of the hPDLSCs were characterized by identifying cell surface markers. hPDLSCs were positive for the mesenchymal markers cluster of differentiation 73 (CD73, 96.54%), CD90 (99.78%), CD146 (71.30%), and CD166 (93.74%) but negative for the hematopoietic markers CD34 and CD45 in flow cytometric analysis (Figs. 1E–1J). These results suggest that hPDLSCs were successfully isolated and had good osteogenic differentiation ability.

Figure 1: Characterisation of hPDLSCs and effect of MT on cell viability in hPDLSCs.
(A) Primary hPDLSCs were obtained by tissue block culture (scale bar = 200 µm). (B) Alizarin red staining of hPDLSCs after 3 weeks of osteogenic induction (scale bar = 100 µm) (C) Oil red o staining of hPDLSCs after 3 weeks of adipogenic differentiation (scale bar = 50 µm). (D) Alcian blue staining of hPDLSCs after 3 weeks of chondrogenic differentiation (scale bar = 50 µm). (E–J) Flow cytometry showed hPDLSCs were positive for the MSC markers CD73, CD90, CD146 and CD166 but negative for the haematopoietic markers CD34 and CD45. (K) Cell viability was measured by CCK8 assay and showed no significant difference in cell viability between the MT treatment groups and basal growth medium treatment group (NS: no significant difference).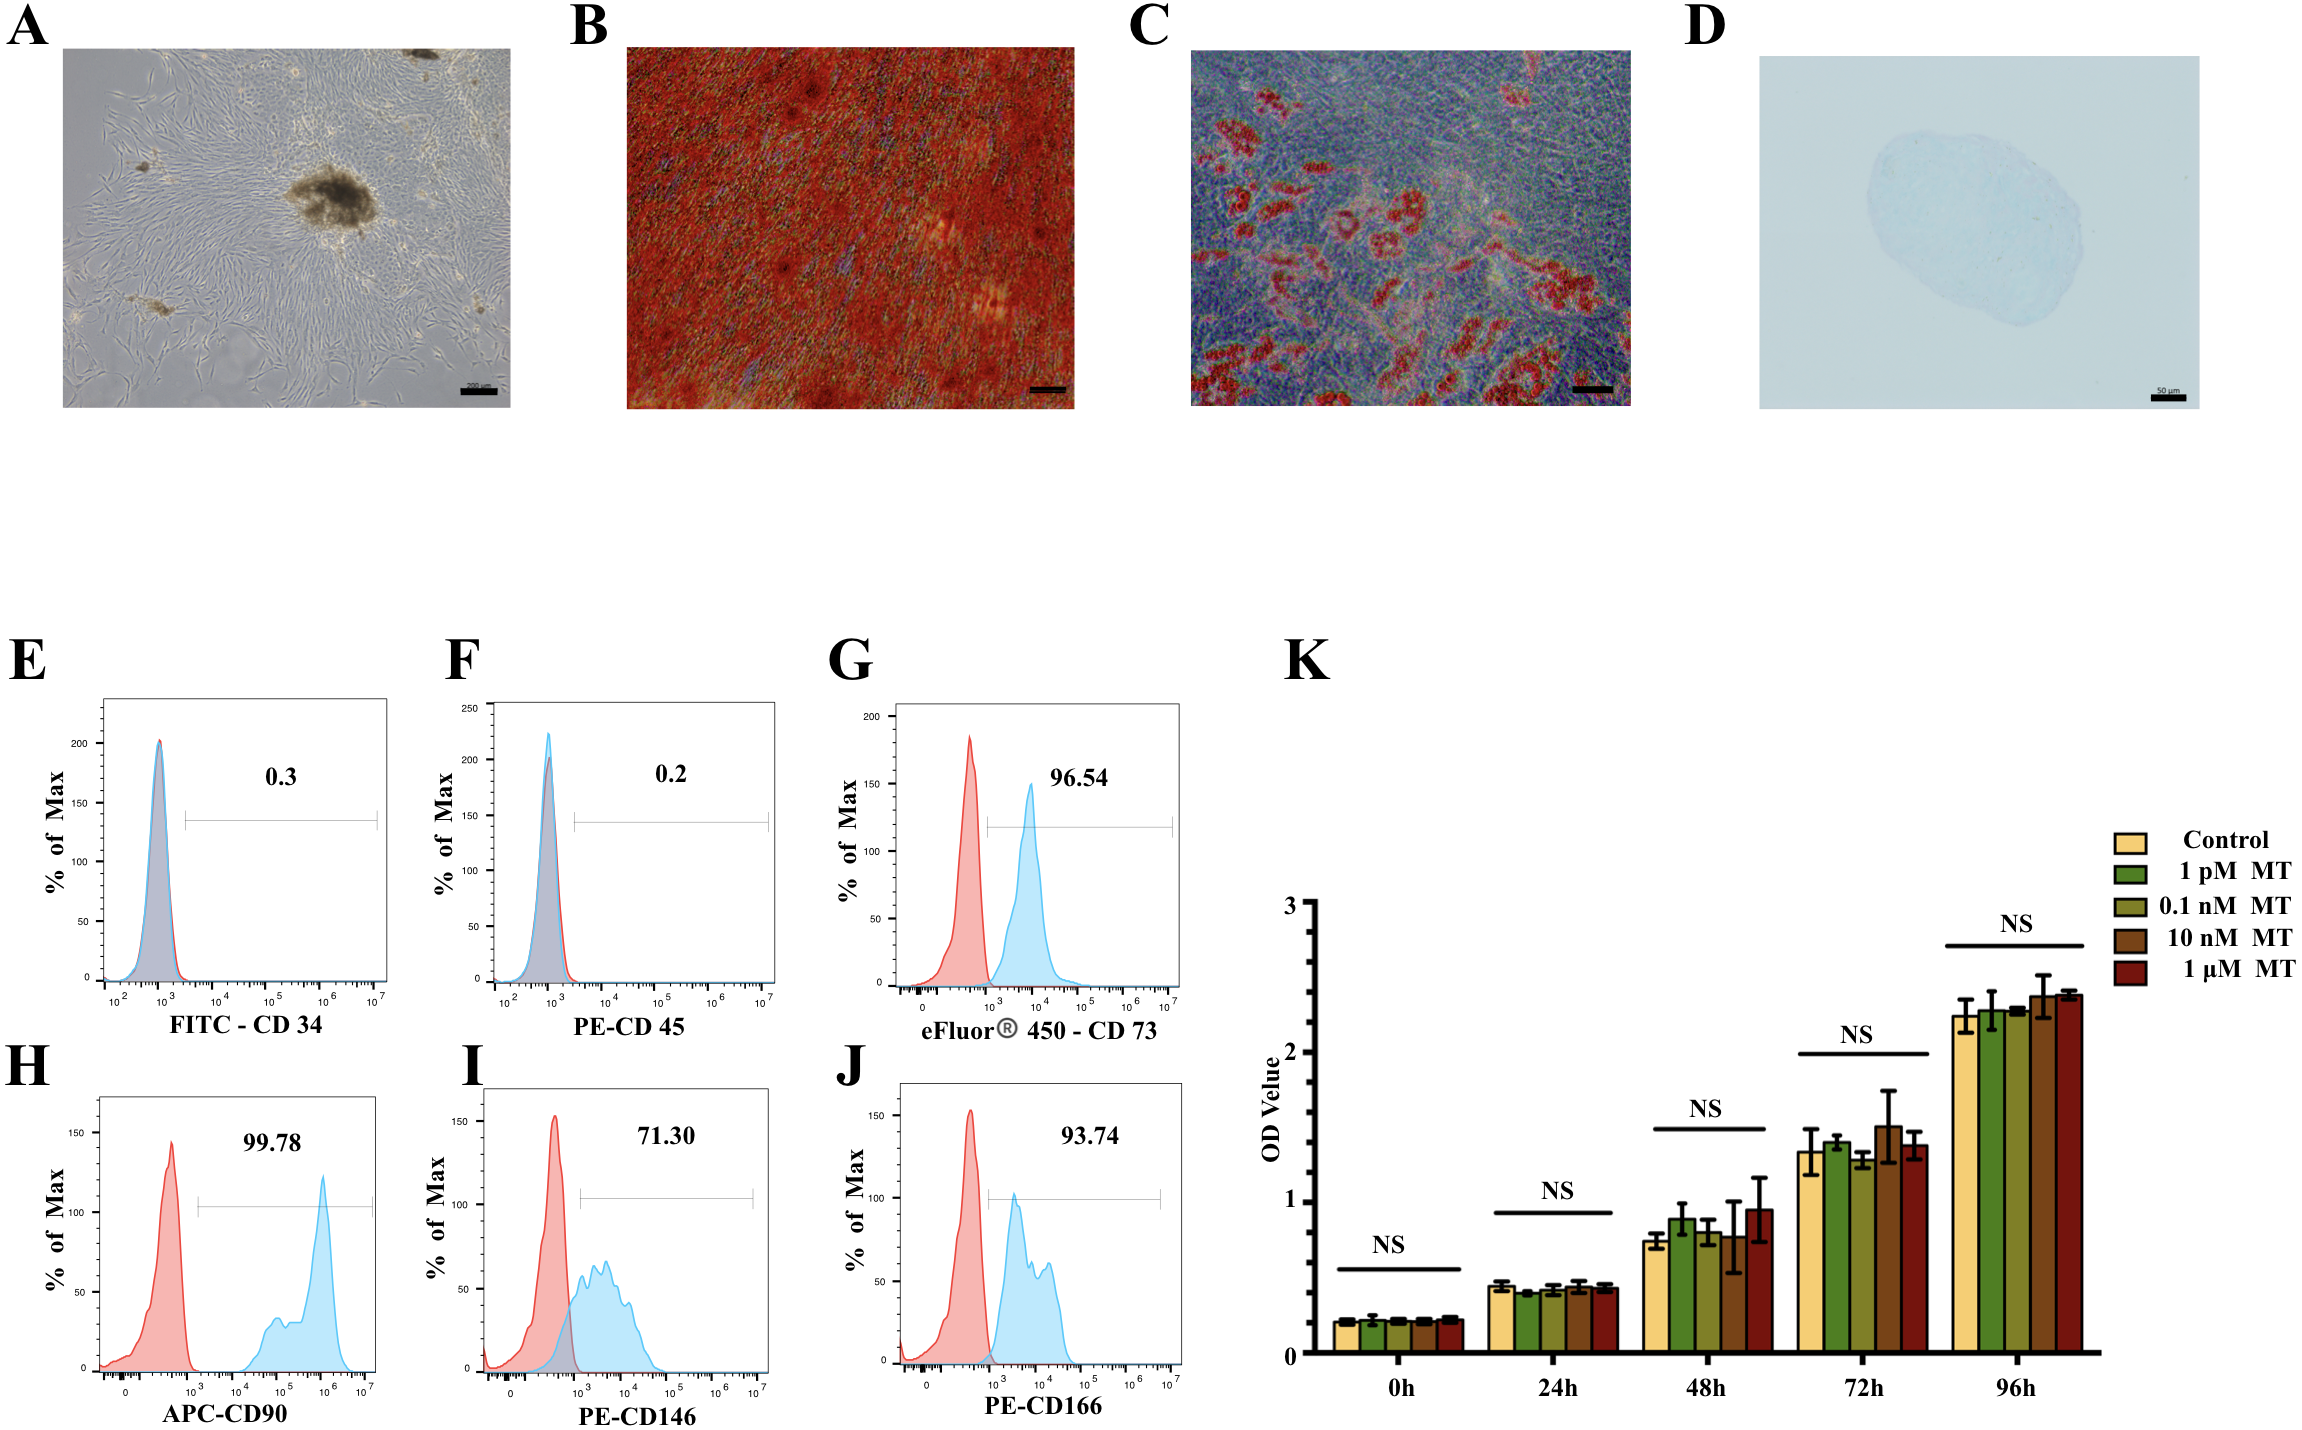
MT does NOT affect the viability of hPDLSCs
There was no significant difference between the MT groups and basal growth medium group (P > 0.05) (Fig. 1K). The cell growth rate was relatively stable, and the growth of each group relative to the previous time point was significantly different (data shows in Dataset S3). These results indicate that MT has no apparent cytotoxicity.
Physiological concentrations of MT affect hPDLSCs osteogenic differentiation
The ARS experiments indicated that 1 pM–10 nM MT reduced the effect of the OS (P < 0.05, Figs. 2A, 2B). We also found that treatment with MT at 1 pM, 0.1 nM, and 10 nM caused a greater decrease in ALP activity than OS alone. Particularly, the highest decrease in ALP activity was observed in the 0.1 nM MT-treated group (P < 0.05, Fig. 2C). In contrast, treatment with the pharmacological MT concentration of 1 µM increased ALP activity, but there was no significant difference compared to OS alone.
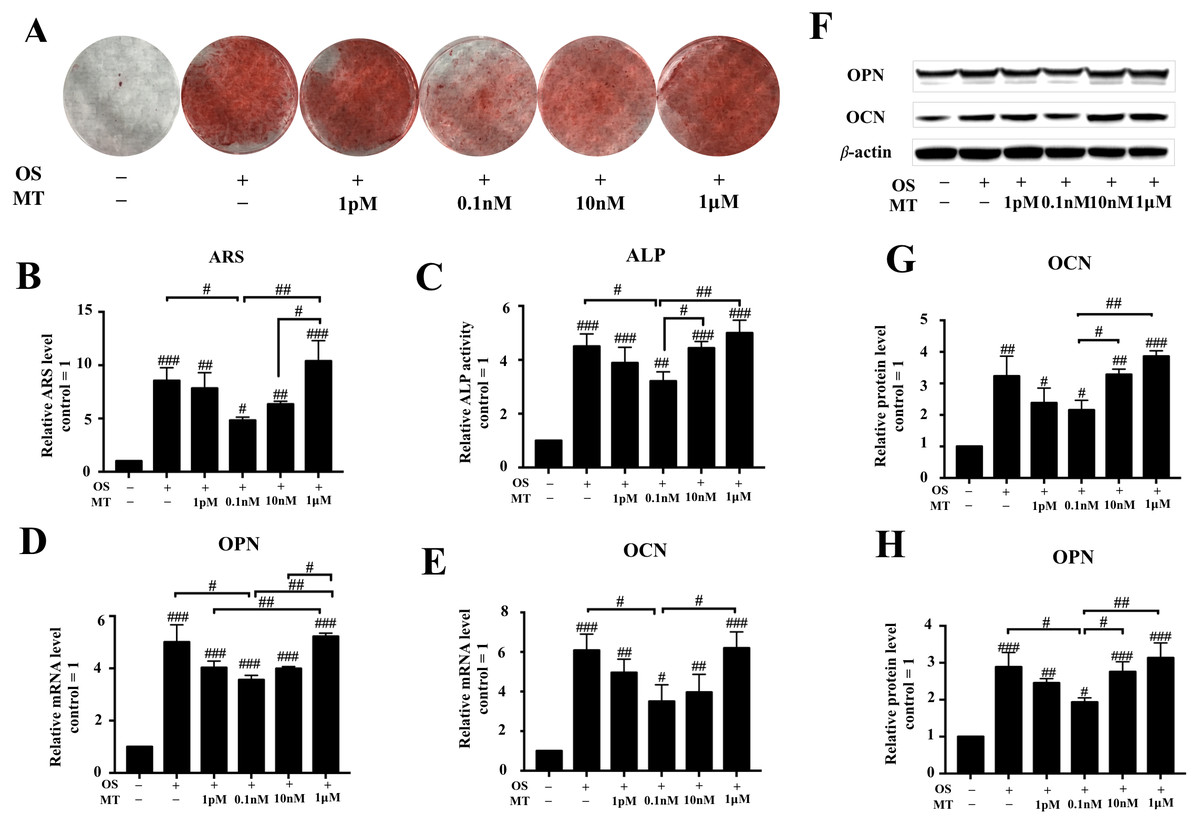
Figure 2: Effect of MT on osteogenic differentiation of hPDLSCs.
(A) Gross appearance was observed with a camera; (B) Quantitative evaluation of Alizarin red staining in hPDLSCs. (C) ALP activity was measured. (D–E) The mRNA levels of OPN and CON were determined by qRT-PCR. (F–I) Effect of MT on osteogenic differentiation in protein levels of OCN and OPN in hPDLSCs. Representative immunoblots are shown (F) β-actin was used as the internal control. (G–H) Relative quantitative analysis of grey values of different proteins; the optical density was examined with ImageJ software. Each value is presented as the mean ± SD; n = 3; #P < 0.05, ##P < 0.01, ###P < 0.001, respectively, vs. basal growth medium groups or between the two groups indicated by a solid black line.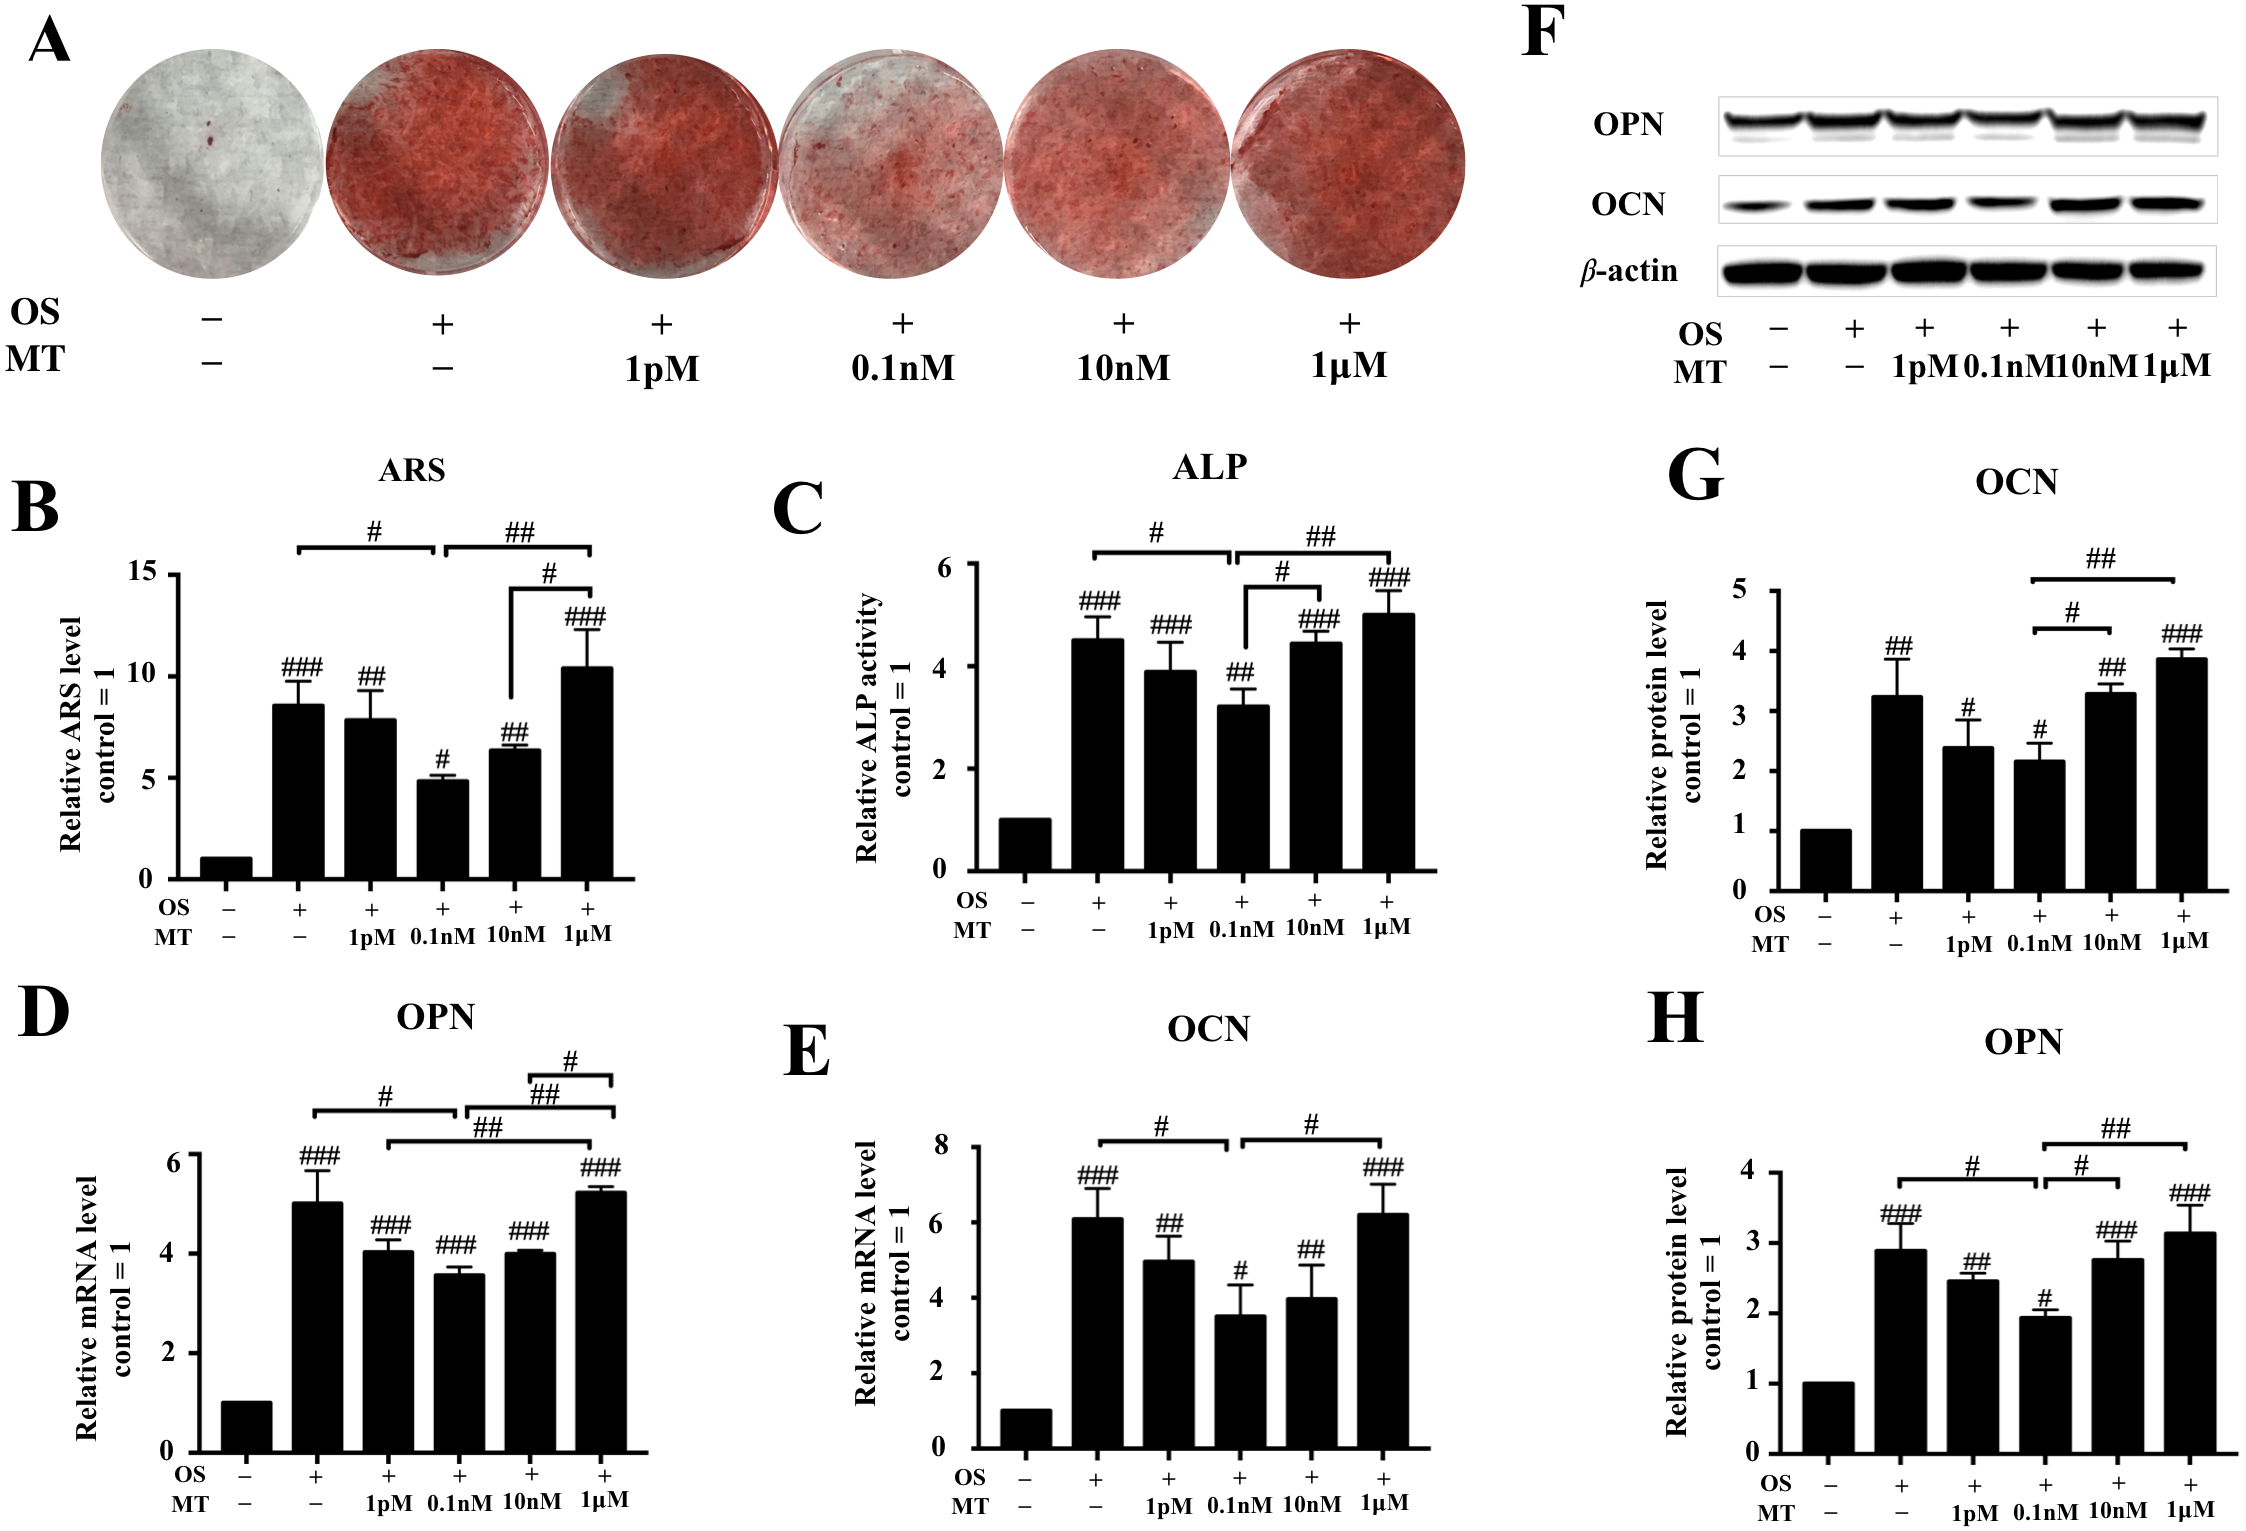
Next, we detected the expression levels of OPN and OCN, which are considered as closely associated with osteogenic differentiation, by qRT-PCR and western blotting after day 7 of osteogenic induction. The analysis showed that physiological MT treatment downregulated the osteogenic markers OCN and OPN (Figs. 2D, 2E–2H). In the differentiated groups, 0.1 nM MT showed the highest reduction compared to OS alone (P < 0.05), and the suppressive effect was abrogated at the lowest pharmacological concentration (1 µM). These results indicate that physiological concentrations of MT but not 1 µM reduced the differentiation-promoting effect of OS on hPDLSCs.
Changes in mitochondrial respiratory function of hPDLSCs following osteogenic induction and MT treatment
We detected the intracellular ROS activity of hPDLSCs by flow cytometry. We found that ROS generation in the osteogenic induction group was lower than that in basal growth medium group, whereas the 0.1 nM MT-treated group showed higher levels than any other MT-treated group with OS (P < 0.05, Figs. 3A, 3B). Furthermore, measurement of the intracellular ATP and NAD+/NADH levels showed that osteogenic differentiation increased the production of intracellular ATP, whereas 1 pM, 0.1 nM and 10 nM MT reduced this effect (P > 0.05, Fig. 3C). We also found that the NAD+/NADH ratio was reduced in the OS group (P <0.001, Fig. 3D). Notably, the increase in the ratio was not concentration-dependent at physiological concentrations of MT. Furthermore, the 1 pM and 0.1 nM MT-treated groups showed significant differences from the OS alone group (P <0.05).
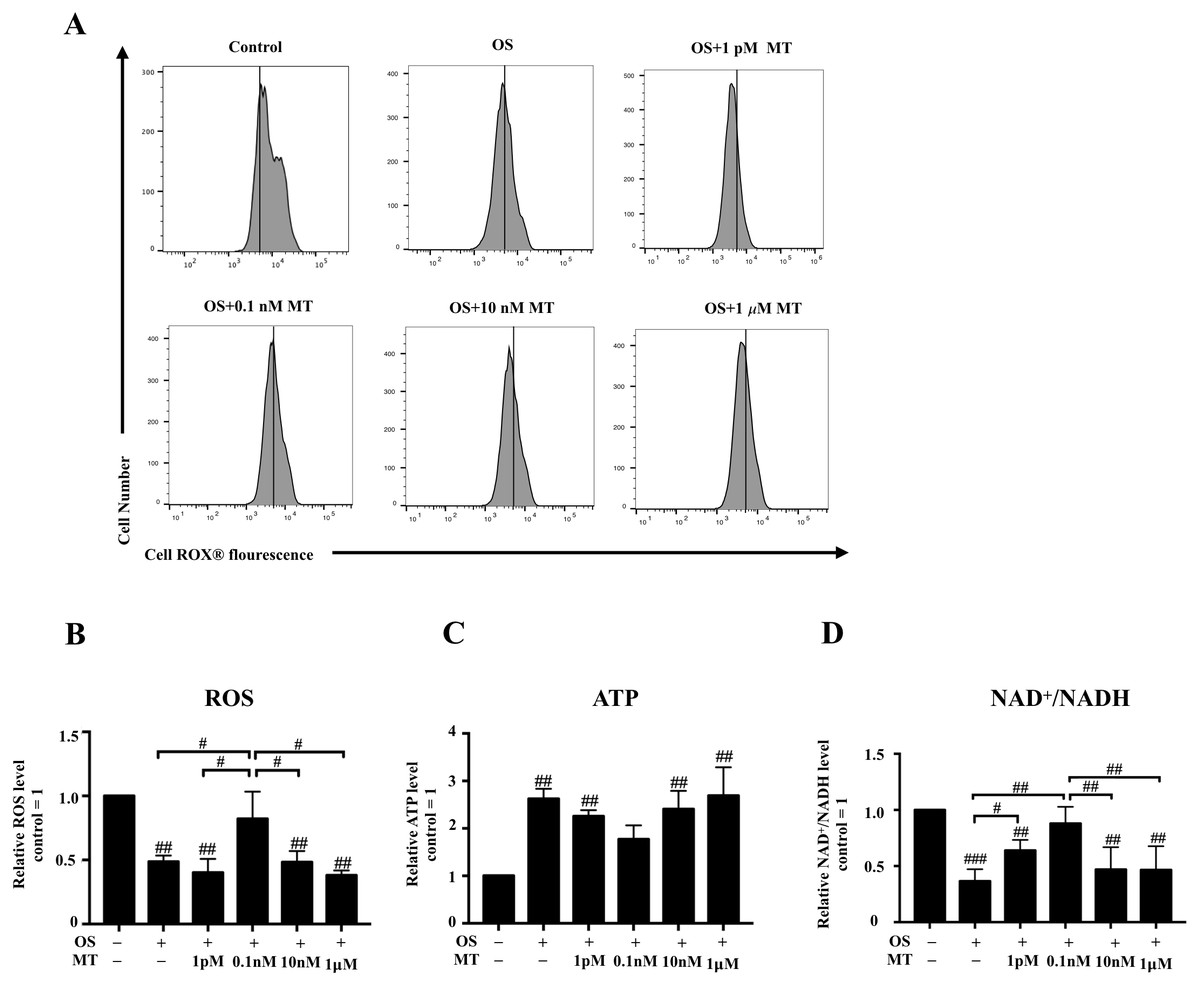
Figure 3: Effect of MT on mitochondrial respiratory function in hPDLSCs during osteogenic induction.
(A) ROS production of hPDLSCs was measured by flow cytometry, and the mean fluorescence values for the vehicle control cells are indicated by vertical lines in each graph; (B) Quantitative evaluation of ROS in hPDLSCs; (C) Intracellular ATP content of hPDLSCs in each group was detected by chemiluminescence microplate reader; (D) NAD+/NADH ratio in each group was detected. Each value is presented as the mean ± SD; n = 3; #P < 0.05, ##P < 0.01, ###P < 0.001, respectively, vs. basal growth medium or between the two groups indicated by the solid black line.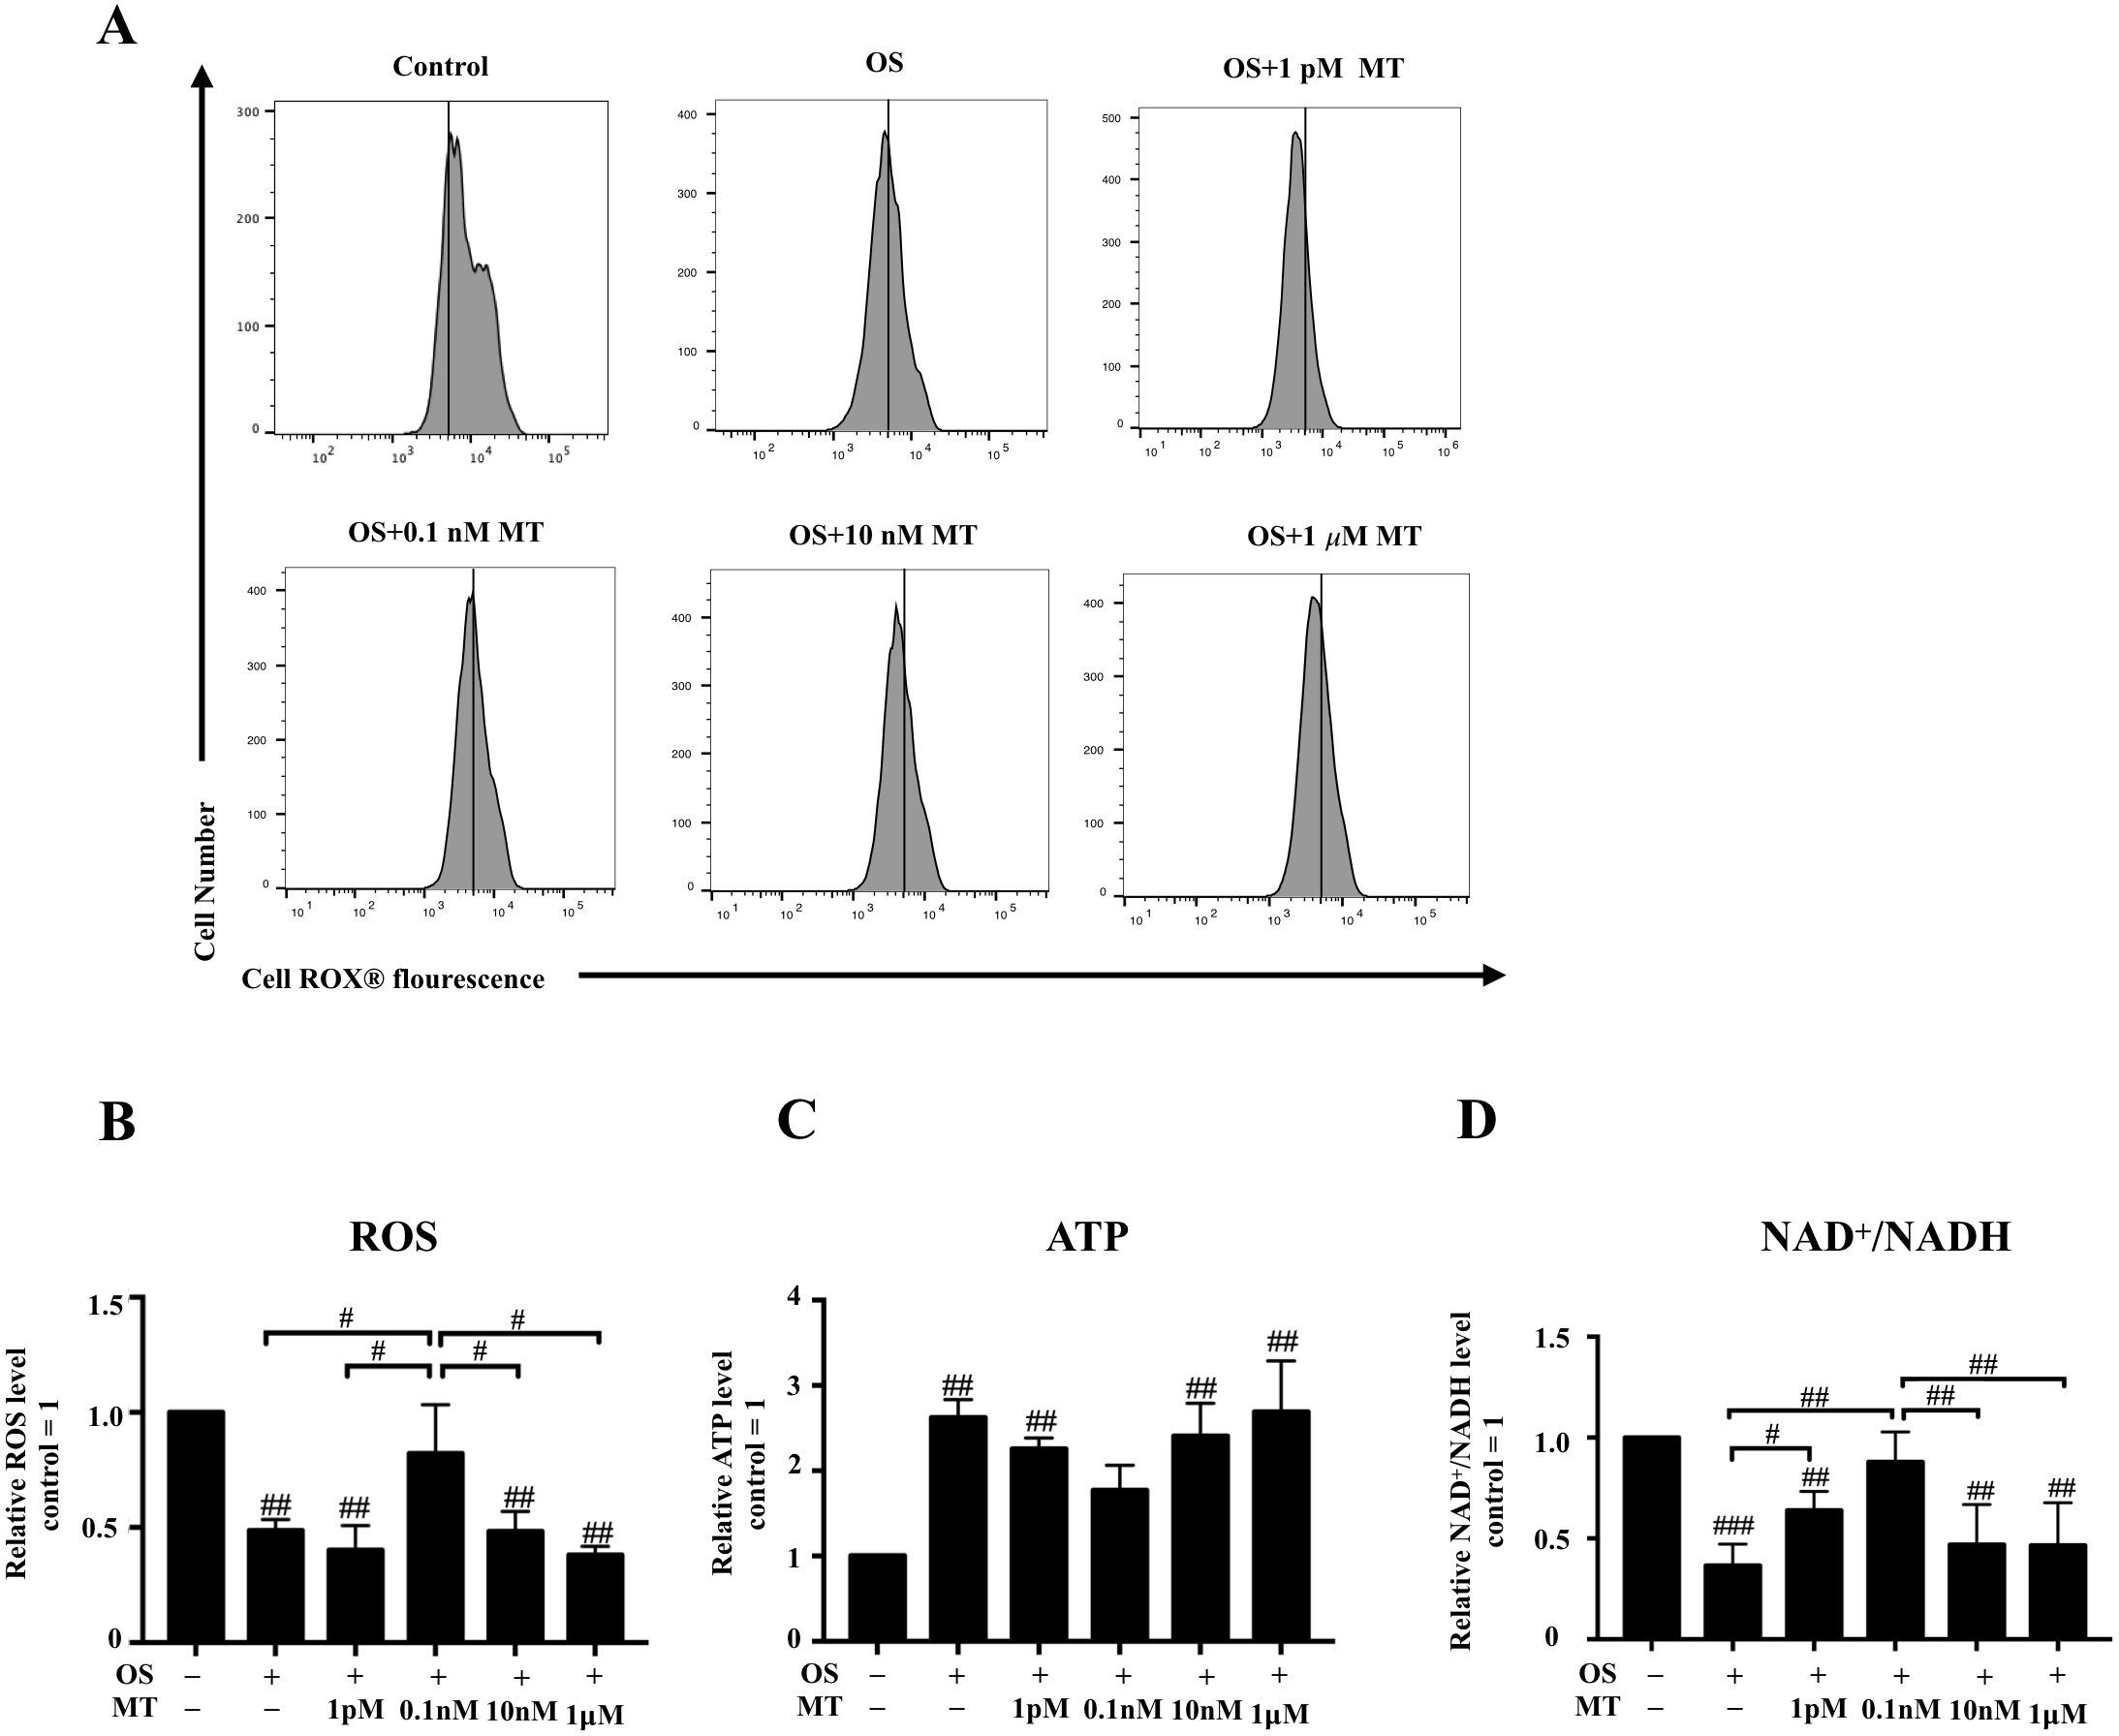
Effects of MT on mitochondrial dynamics during osteogenesis
The protein levels of mitochondrial dynamics were assessed by western blotting. The expression of MFF and P-MFF was initially increased and then decreased with increasing MT concentrations (Figs. 4A, 4C, 4D). In addition, the expression levels of MFN-2 and TOM20 first decreased and then increased with increasing MT concentrations (Figs. 4A, 4B, 4E). The expression of MFN-2 and TOM20 was significantly decreased at 0.1 nM MT compared to in the OS alone group (P <0.01, P <0.001, respectively, Figs. 4B, 4E). We also found that at MT concentrations >0.1 µM, the expression of MFN-2 and TOM20 was gradually increased, which continued up until 1 µM. Furthermore, the expression levels of MFN-2 and TOM20 at 1 µM MT were comparable to or even higher than those in the OS alone group (Figs. 4B, 4E).
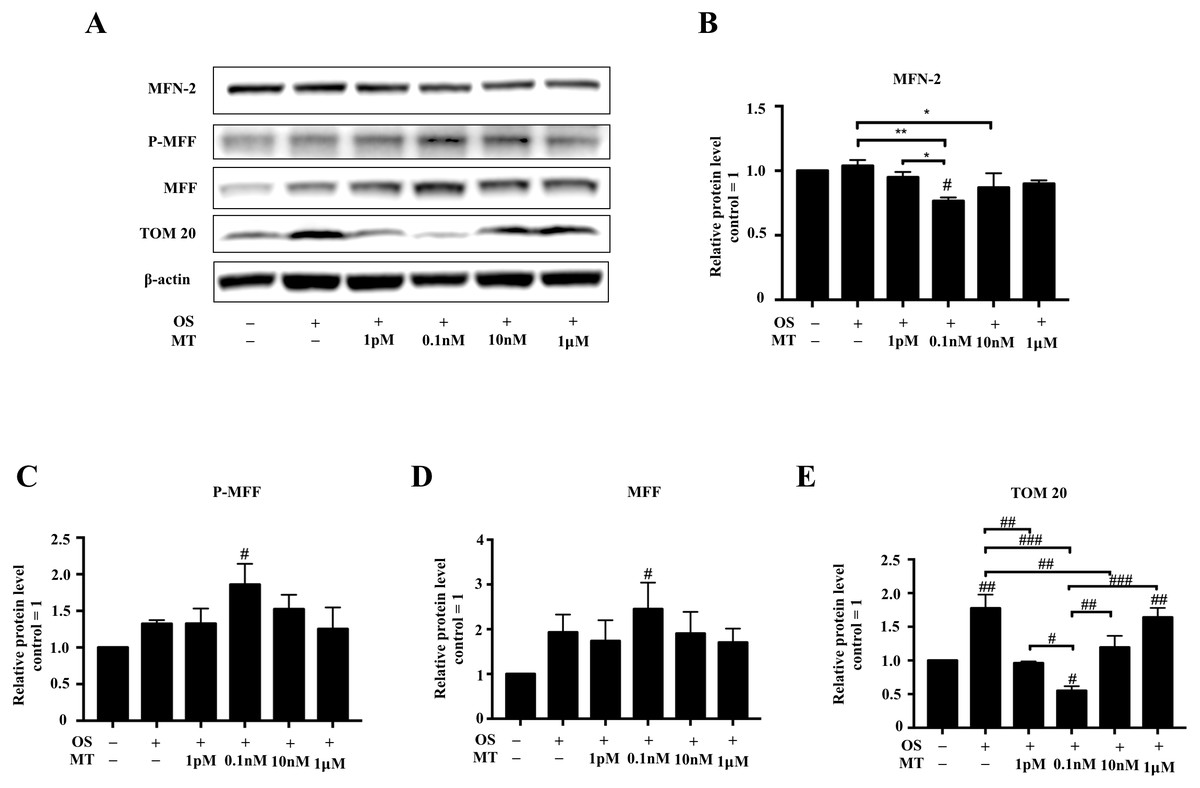
Figure 4: Effect of MT on mitochondrial dynamics within hPDLSCs osteogenic induction.
(A–E) Effect of osteogenic medium on protein levels of MFN-2, P-MFF, MFF, and TOM20 in hPDLSCs. Representative immunoblots are shown (A), β-actin was used as the internal control; (B–E) Relative quantitative analysis of grey values of different proteins; the optical density was examined with ImageJ software. Each value is presented as the mean ± SD; n = 3; #P < 0.05, ##P < 0.01, ###P < 0.001, respectively, vs. basal growth medium or between the two groups indicated by the solid black line.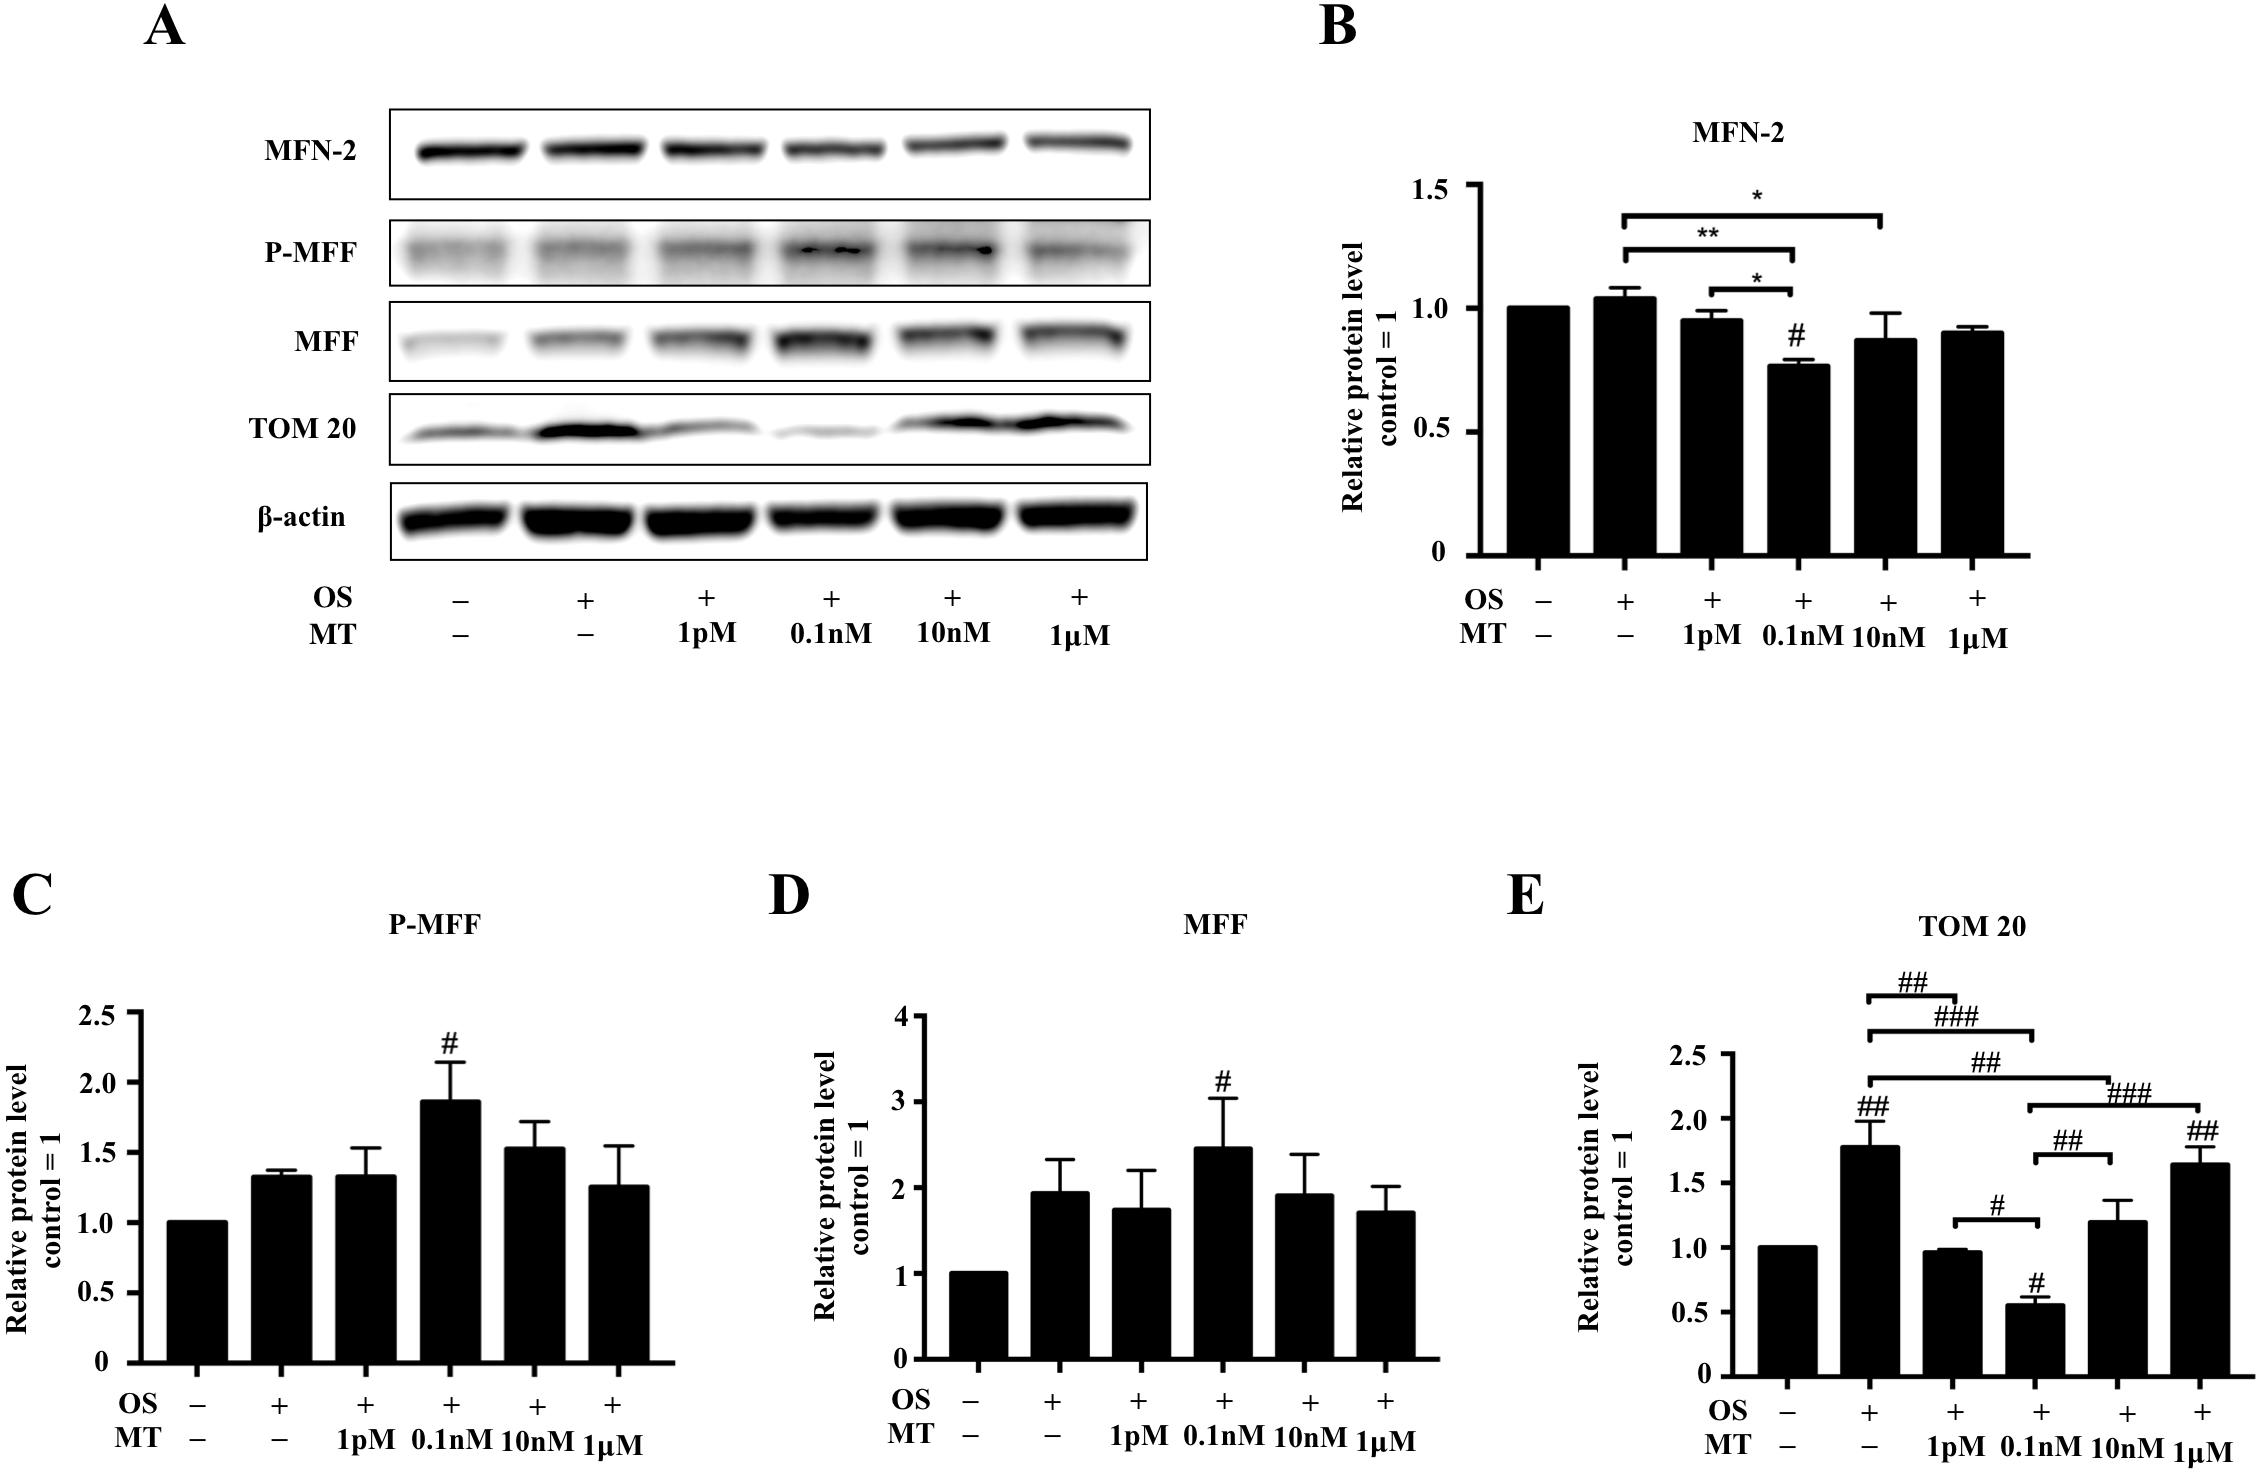
Discussion
Studies have indicated that MT promotes the osteogenic differentiation of cells in vitro and in vivo at pharmacological concentrations (Lee, Le & Kang, 2018; Li et al., 2019). Our results showed that at physiological concentrations (1 pM–10 nM), MT decreased the expression of osteogenesis-related genes and mineralized nodules in hPDLSCs. In addition, we verified that at pharmacological concentrations, MT increased the mineralized nodules in hPDLCs (Figs. S1A, S1B), which is consistent with reported results (Lee, Le & Kang, 2018). These findings indicate that MT exhibits dual effects: MT not only promoted the osteogenic differentiation of BMSCs, but also suppressed osteogenic differentiation. The normal PDL must to maintain certain periodontal ligament spaces and elasticity to prevent excessive hyperplasia of the alveolar bone and cementum. Failure to achieve this can lead to reduced periodontal ligament spaces and disappearance of the PDL (Menicanin et al., 2015). We speculated that the low concentrations of MT from blood circulation can reach the PDL, where it plays a role in balancing bone formation and absorption. One study showed that MT at pharmacological concentrations inhibits osteoclast differentiation (Zhou et al., 2017). A possible explanation for these results is that the action of MT is concentration- and cell type-dependent.
The energy supply of MSCs shifted from glycolysis to aerobic metabolism during differentiation into osteoblasts (Chen et al., 2008). Hypoxia inhibited the osteogenesis of MSCs (Pattappa et al., 2011). Mitochondria play a key role in the osteogenesis of MSCs (Zhang et al., 2017). The mitochondria are best known for their ability to produce ATP in eukaryotic cells. NADH, which has an oxidation state of NAD +, is one of the major electron donors in the mitochondrial respiratory chain. NAD+/NADH represents the reductant-oxidant state in mitochondria, which is one of the best parameters for characterizing mitochondrial function (Ni et al., 2014). Our results revealed an increase in ATP levels and decrease in the NAD+/NADH ratio during hPDLSC differentiation, which was inhibited by physiological MT concentrations. However, at <10 nM, the weakening of cellular aerobic respiration was obvious compared to in the osteogenic induction group. Therefore, MT may affect aerobic respiratory function in the mitochondria. Mitochondria may be involved in both producing MT and blocking cytochrome c release, which drives the selective G protein- coupled receptor (GPCR) in the outer membrane (Suofu et al., 2017). Cellular oxidative phosphorylation is reflected by not only cellular ATP production, but also by ROS (Zhang et al., 2017). We observed a decrease in ROS levels in hPDLSCs following osteogenic induction, which is consistent with some previous studies (Chen et al., 2008; Zhang et al., 2017). During mitochondrial function enhancement, ROS accumulation can lead to cell damage, which is not conducive to osteogenesis (Tahara, Navarete & Kowaltowski, 2009). MT has been suggested to scavenge ROS (Lee, Le & Kang, 2018); however, in this study, ROS levels were increased after MT treatment, indicating that MT does not play a scavenging role at physiological concentrations. Thus, the role of MT in ROS clearance remains to be confirmed.
MFN2 is a mitochondrial fusion protein belonging to the transmembrane GTPases family and is conserved from yeast to humans. Mitochondrial fission accessory proteins such as MFF and P-MFF both play pivotal roles in mitochondrial fission (Seo, Yoon & Do, 2018). The expression of MFN2 in this study was down-regulated, whereas that of P-MFF and MFF was increased by physiological concentrations of MT. This phenomenon is consistent with the down-regulation of osteogenic genes and changes in the mitochondrial function of hPDLSCs. Furthermore, our results are consistent with those of previous studies showing elevation of MFN2 expression with decreased P-MFF expression following enhanced cell differentiation (McBride, Neuspiel & Wasiak, 2006). TOM20 is a protein encoded by TOMM20 in humans. This protein is anchored to the outer membrane by an N-terminal hydrophobic segment and exposes the receptor domain to the cytosol. Its main function is to induce cytosolic synthesis of mitochondrial proprotein recognition and transportation, and then promote the movement of proprotein to the TOM40 translocation pore with TOM22 (Yamamoto et al., 2011). We found that as the osteogenic capacity declined, the expression of TOM20 decreased. TOM20 in the outer mitochondrial membrane (OMM) influences the kinetics of material import into the mitochondria and thus contributes to importing malate dehydrogenase (MDH) (Grey et al., 2000). Inhibition of MDH is shown to inhibit NADH expression (Yang et al., 2018). It has been reported that the melatonin type 1 (MT1) receptors are expressed in the OMM and mitochondria release MT, which is bound to high-affinity MT1 located in OMM with its ligand-binding domain (Suofu et al., 2017). Therefore, we hypothesized that at physiological concentrations, MT may affect TOM20 expression and MT1 receptor. TOM20 protein further affects MDH in the mitochondria, thereby decreasing NADH levels. Decreased expression of reducible NADH levels may increase ROS levels and thus decrease osteogenic differentiation in hPDLSCs. The potential regulation of TOM20 expression by physiological concentrations of MT and its effects on the mitochondrial dynamics of osteogenic differentiation in hPDLSCs require further evaluation.
Conclusions
Our study showed that administration of MT at physiological concentrations inhibited osteogenic differentiation and associated mitochondrial functions in hPDLSCs. Furthermore, increasing concentrations of MT weakened this inhibition and showed a tendency to promote osteogenic differentiation. At physiological concentrations, MT may also affecte the mitochondrial dynamics-related proteins TOM20, MFN2, MFF and P-MFF during cell differentiation. Our study indicates that MT exhibited dual effects that were concentration- and cell type-dependent. These findings provide insight into stem cell tissue engineering strategies and MT function.
Supplemental Information
The original figure of OPN protein band detected using an Image Quant Las 4,000 mini imaging system shown in Fig. 2F
The original figure of MFF protein band detected using an Image Quant Las 4,000 mini imaging system shown in Fig. 4A
The original figure of OCN protein band detected using an Image Quant Las 4,000 mini imaging system shown in Fig. 2F
The original figure of P-MFF protein band detected using an Image Quant Las 4,000 mini imaging system shown in Fig. 4A
The original figure of TOM 20 protein band detected using an Image Quant Las 4,000 mini imaging system shown in Fig. 4A
The effect of of MT at pharmacological concentration on the osteogenic differentiation of hPDLSCs
(A–B) Cells were treated with MT at pharmacological concentrations with osteogenic medium for 21 days; (A) Gross appearance is displayed by camera; (B). Quantitative evaluation of Alizarin red staining for hPDLSCs. (each value is presented as the mean ±SD; n = 3; #P < 0.05, ##P < 0.01, ###P < 0.001, respectively, vs. basal growth medium group; ∗P < 0.05, ∗∗P < 0.01, ∗∗∗P < 0.001, respectively, vs. OS alone group).
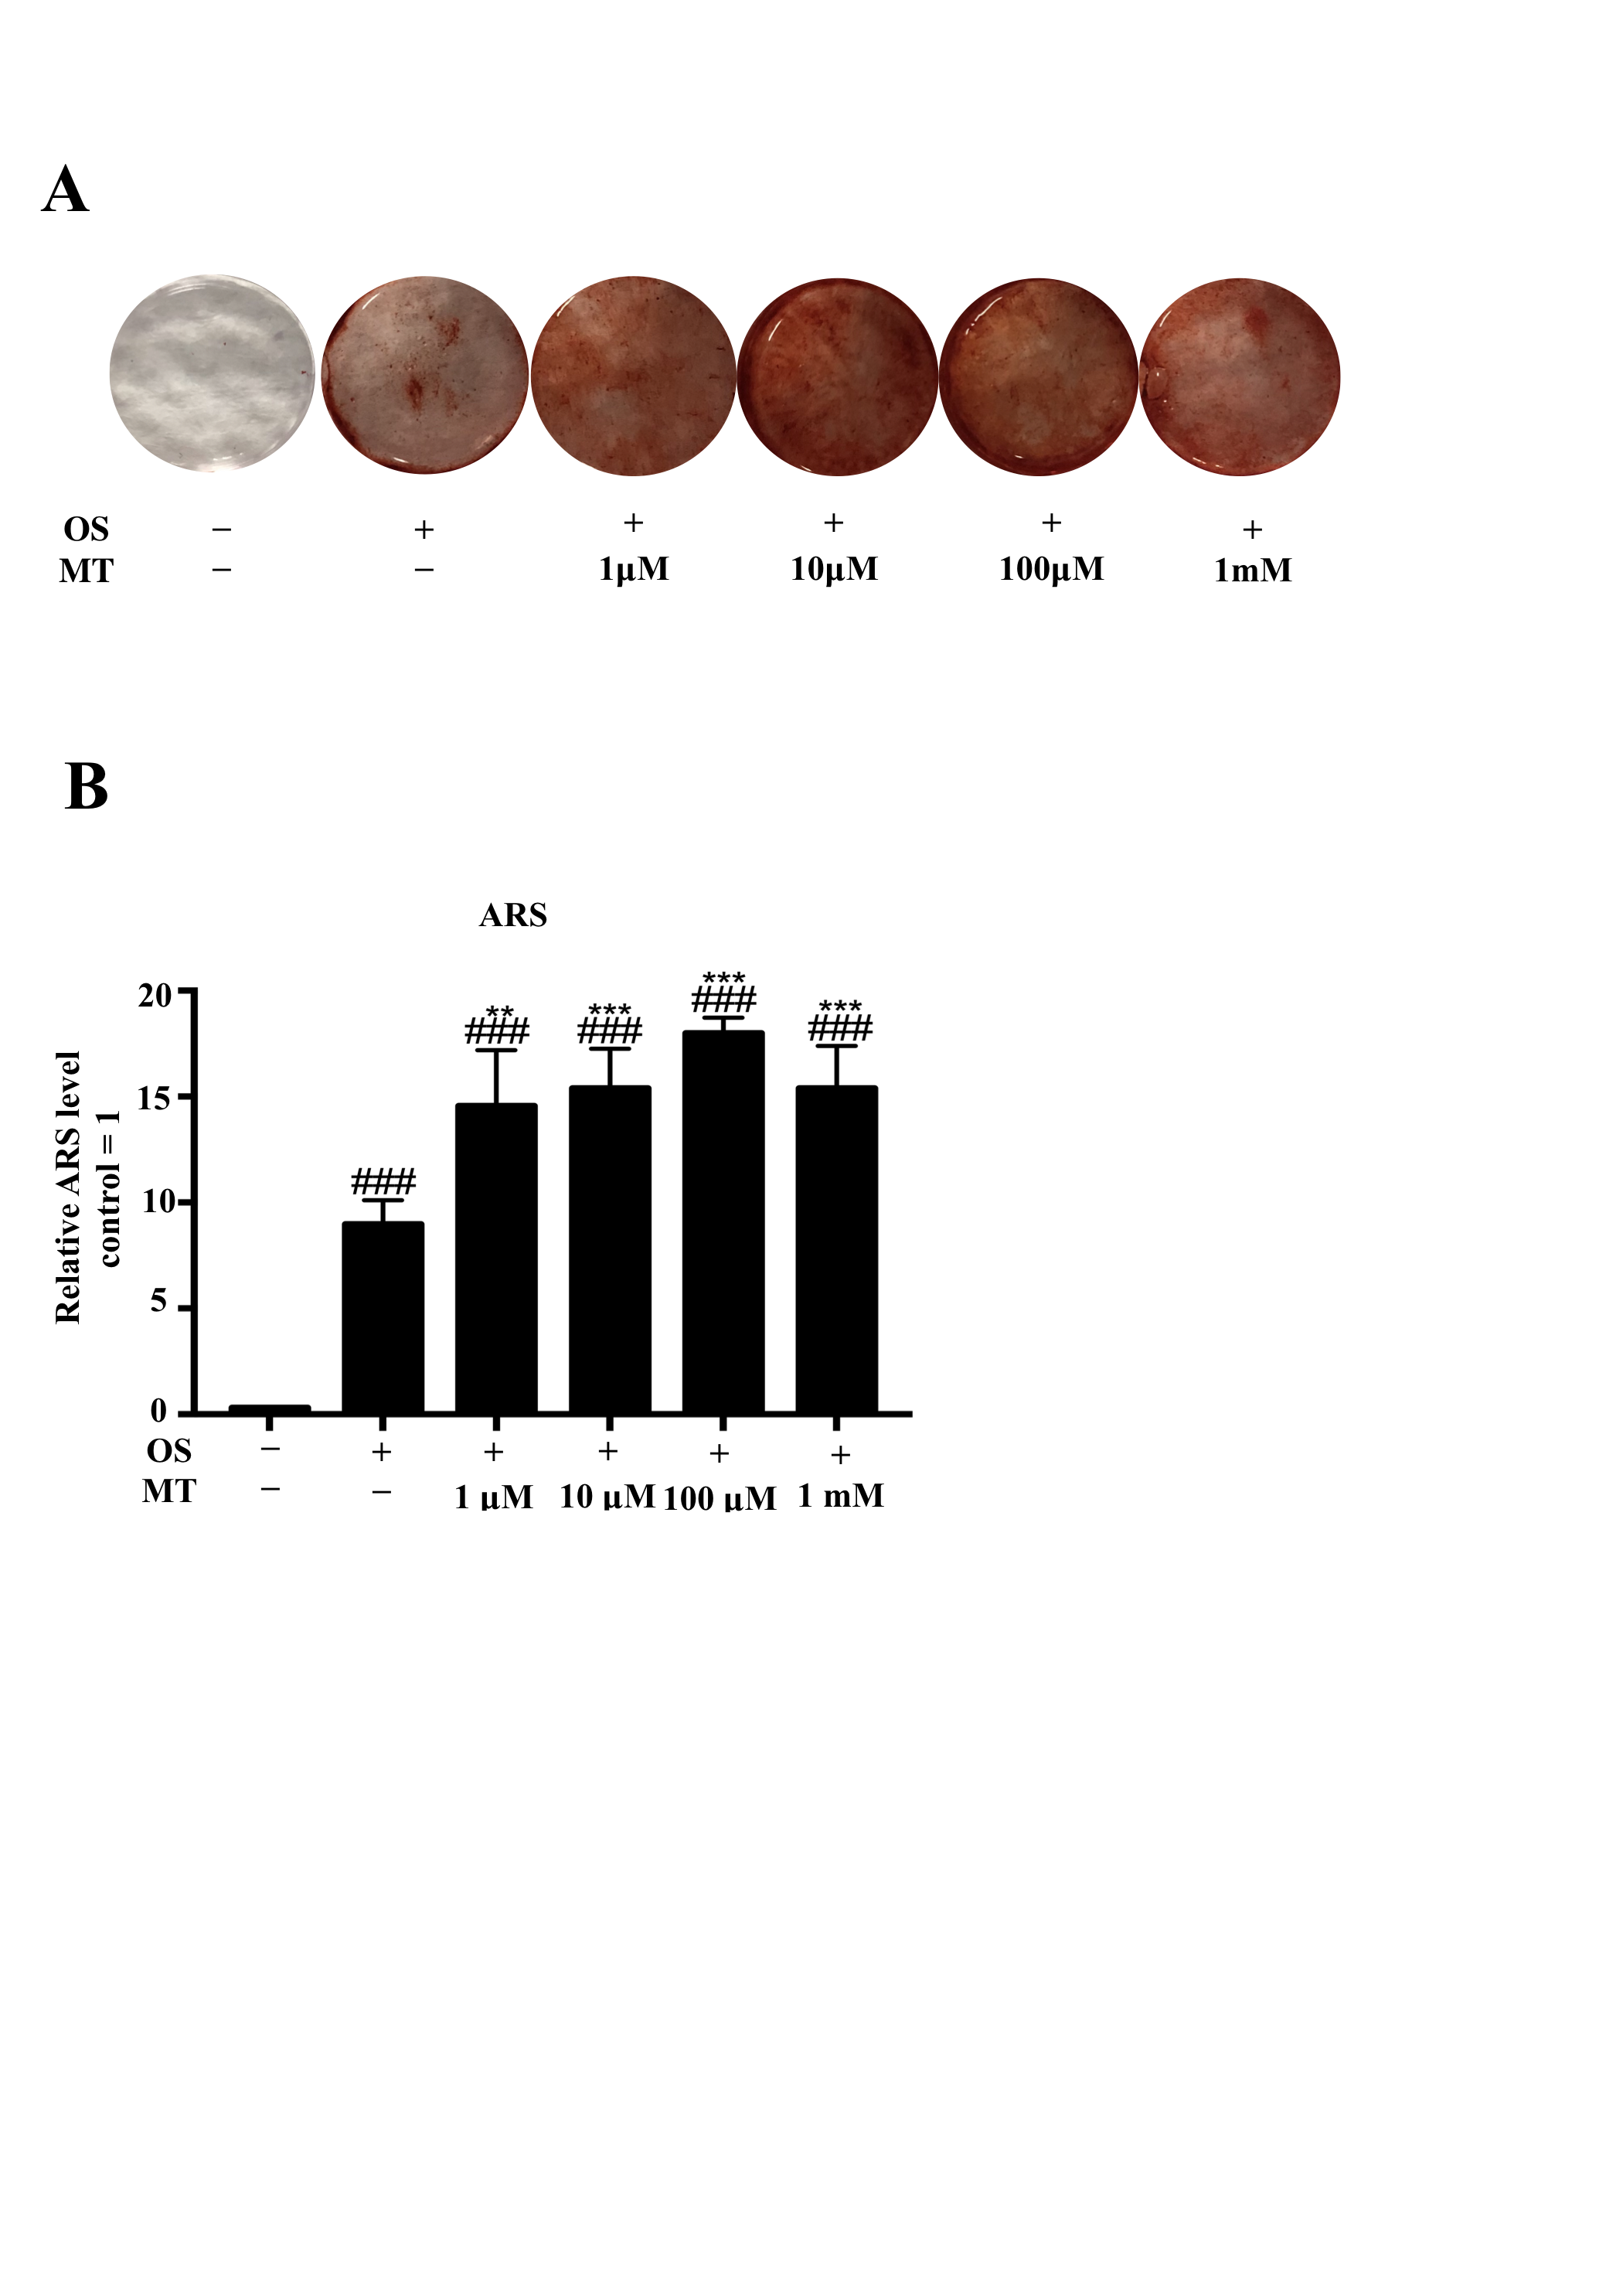
TEM images of mitochondrial dynamics in hPDLSCs
(A) bar: 0.5
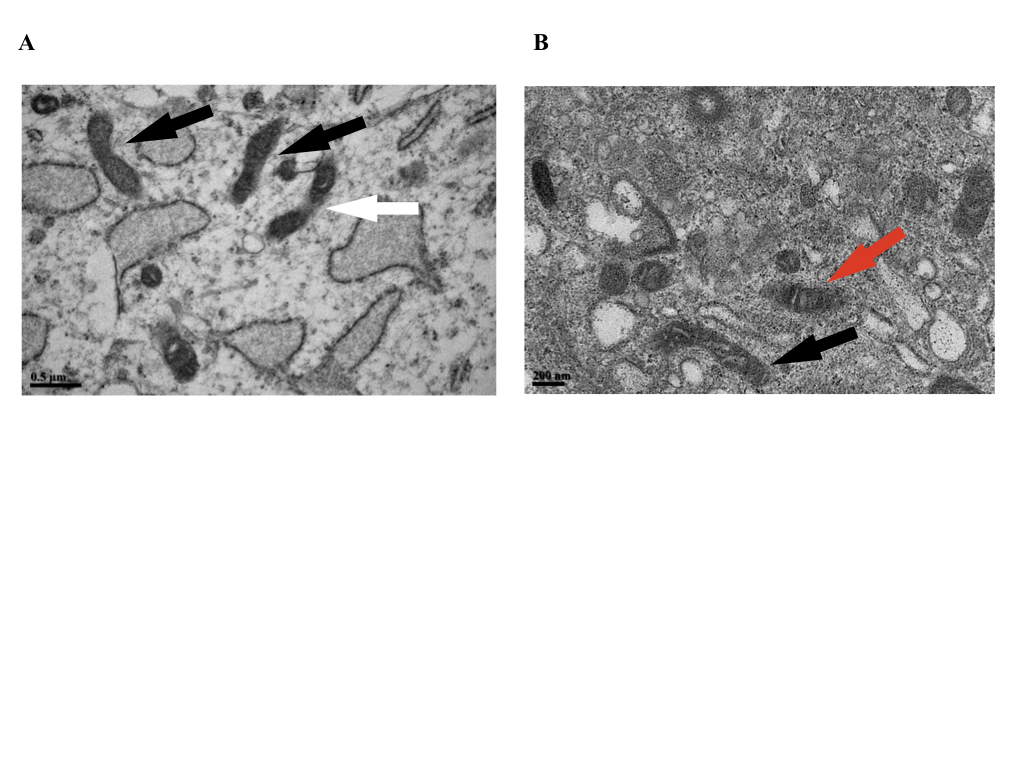
Band intensities of OPN
These data were quantified by using ImageJ 1.36b (NIH Freeware, USA).
Band intensities of OCN
These data were quantified by using ImageJ 1.36b (NIH Freeware, USA)
Band intensities of MFN2
These data were quantified by using ImageJ 1.36b (NIH Freeware, USA).
Band intensities of p-MFF
These data were quantified by using ImageJ 1.36b (NIH Freeware, USA).
Band intensities of MFF
These data were quantified by using ImageJ 1.36b (NIH Freeware, USA).
Band intensities of Tom20
These data were quantified by using ImageJ 1.36b (NIH Freeware, USA).