
A prognostic nomogram for neuroblastoma in children
- Published
- Accepted
- Received
- Academic Editor
- Hsueh-Fen Juan
- Subject Areas
- Bioinformatics, Oncology, Pediatrics
- Keywords
- Neuroblastoma, TARGET, Nomogram, Prognosis
- Copyright
- © 2019 Li and Meng
- Licence
- This is an open access article distributed under the terms of the Creative Commons Attribution License, which permits unrestricted use, distribution, reproduction and adaptation in any medium and for any purpose provided that it is properly attributed. For attribution, the original author(s), title, publication source (PeerJ) and either DOI or URL of the article must be cited.
- Cite this article
- 2019. A prognostic nomogram for neuroblastoma in children. PeerJ 7:e7316 https://doi.org/10.7717/peerj.7316
Abstract
Introduction
Neuroblastoma is one of the most common extracranial solid tumors in children, which accounts for about 7–10% in children’s tumors. The prognosis group of patients with neuroblastoma could not only improve the efficacy of high-risk patients, but also reduce the effects of drug complications for surviving patients.
Material and Methods
Patients diagnosed with neuroblastoma between 1986 and 2012 were selected form the TARGET database. The nomogram was built with potential risk factors based on COX regression analysis. The precision of the 3-year and 5-year survival of the nomograms was evaluated by the area under receiver operating characteristic (ROC) curve (AUC).
Results
A total of 757 child neuroblastoma patients were selected from the TARGET database. Univariate analysis showed that age of diagnosis (>520 day), race of American Indian or Alaska Native, stage 4 in International Neuroblastoma Staging System (INSS), MYCN status, DNA ploidy, and high mitosis-karyorrhexis index were associated with overall survival (OS). Multivariate analysis showed age of diagnosis (>520 day), stage 4 in INSS and DNA ploidy were independent risk factors of OS. The concordance index (C-index) of the nomogram was 0.704 (95% CI [0.686–0.722]) in the training cohort while the C-index in the validation cohort was 0.672 (95% CI [0.644–0.700]). AUC values of ROC curves for 3-year OS and 5-year OS in the training cohort were 0.732 and 0.772, respectively. The nomogram performed better compared with INSS staging system, tumor histology and children’s oncology group (COG) risk group with C-indexes of 0.662 (95% CI [0.648–0.676]), 0.637 (95% CI [0.622–0.652]) and 0.651 (95% CI [0.637–0.665]), respectively.
Conclusions
The nomogram showed stronger predictive power than the INSS staging system, tumor histology and COG risk group. Precise estimates of the prognosis of childhood neuroblastoma might help doctors make better treatment decisions.
Introduction
Neuroblastoma is one of the most common extracranial solid tumor in children, which accounts for about 7–10% in children’s tumors (Ahmed et al., 2017; Kholodenko & Kalinovsky, 2018; Nakagawara et al., 2018). Neuroblastoma originates from nerve sympathetic cells and can occur in sympathetic neuronal cells of embryonic neural crest cells. It can arise anywhere along the sympathetic nervous system chain, including the abdomen, adrenal gland, chest, neck, and pelvis, and is often transferred to the parts such as focal lymph node, marrow, skeleton, and liver (Mlakar et al., 2017). Early diagnosis of neuroblastoma is difficult, with a high degree of malignancy and easy to metastasis. The cancer mortality rate of neuroblastoma in children is just fall behind leukemia and brain tumors, which accounts for about 11% (Becker & Wilting, 2018). The prognosis of patients with neuroblastoma is quite variant. The prognosis group of patients with neuroblastoma was classify in to high-risk patients and low-risk patients, which could not only improve the efficacy of high-risk patients, but also reduce the effects of drug complications for surviving patients. Therefore, it is necessary to analyze the prognosis of patients with neuroblastoma.
Clinically, prognostic factors of neuroblastoma include factors such as age of diagnose, International Neuroblastoma Staging System (INSS) stage, MYCN status, and tumor histology (Whittle et al., 2017). MYCN is a prognostic related gene of neuroblastoma. Approximately 25% of patients presented with MYCN gene amplification which was regarded as a biomarker for poor prognosis (Zhou et al., 2018). Levels of DNA ploidy have been found to be one of significant prognostic factors. Patients with DNA aneuploid neuroblastoma died less frequently than those with DNA diploid tumors (Eckschlager et al., 1996). The INSS staging system is widely used in the clinical staging of primary organs and metastases in neuroblastoma. In addition, the children’s oncology group (COG) risk group (London et al., 2017) is a commonly used system for therapeutic decision-making reference, which dividing patients with neuroblastoma into low-risk, intermediate-risk, and high-risk groups. The COG risk group imports factors such as INSS stage, age of diagnose, MYCN, tumor histology, and DNA ploidy status.
The therapeutically applicable research to generate effective treatment (TARGET) database is a project containing experimental and clinical materials of a number of caners of children. TARGET project is affiliated to the Center for Cancer Genomics of the National Cancer Institute and is aimed to use data to guide the development of effective and less toxic therapies. In this study, we collected and analyzed the information of child neuroblastoma patients from the TARGET database and explored possible prognostic nomogram for more accurate assessment of the prognosis of patients of children with neuroblastoma.
Materials and Methods
Data source and eligibility criteria
We downloaded clinical data of patients with neuroblastoma from the TARGET project database (https://ocg.cancer.gov/) (Pugh et al., 2013; Zhou et al., 2019). The inclusion criterion was that the patients were diagnosed with neuroblastoma from 1986 to 2012. Exclusion criteria were as follows: unknown age of diagnosis, uncertain gender, undetermined race, uncertain INSS stage, uncertain MYCN amplification status, unknown DNA ploidy status, undetermined tumor histology, unclear pathological histology results, uncertain mitosis-karyorrhexis index (MKI), unknown COG risk group, and the age is over 18 years old.
The categorical measurements were described as counts and percentages, and the continuous measurements were presented as mean and range. The t-test was used to continuous measurements, while the Chi-square for compare ones. P < 0.05 was considered statistically significant. Overall survival (OS) were used as primary end points. OS was defined as the interval from the time of diagnosis to death or last follow-up regardless of death cause. Optimal cutoff value of age was determined by “survminer” package of R software (Kassambara et al., 2019). The nomogram was built with potential risk factors based on COX regression analysis in the training cohort. concordance index (C-index) was used to estimate predictive performance of the nomogram. The larger the C-index, the more accurate the model prediction. The C-index of the nomogram was compared with the C-index of INSS staging system, tumor histology and COG risk group. Calibration plots were used to compare the observed and predicted probabilities for the nomogram. The precision of the 3-year and 5-year survival of the nomograms was evaluated by the area under ROC (Receiver operating characteristic) curve (AUC). The flow diagram is shown in Fig. S1.
Results
Patient characteristics
The original cohort with a total of 1,119 patients was involved. A total of 757 patients complied with inclusion criteria. The median OS was 1,668 days (range 10–5,216 days). The 3-year and 5-year OS rates were 75.54% and 44.39%, respectively. We used R software (3.5.2) as our statistical analysis tool. Optimal cutoff value of age of diagnosis was 520 days. 70% of all patients were randomly selected to form the training cohort for the construction of nomogram while the rest 30% patients served as the validation cohort. The demographics and clinicopathologic characteristics of training cohort (n = 532), validation cohort (n = 225) and all patients (n = 757) are shown in Table 1.
| Demographics or characteristic | Training cohort n = 532 (%) | Validation cohort n = 225 (%) | P-value |
|---|---|---|---|
| Sex | 0.976 | ||
| Female | 224 (42.11) | 95 (42.22) | |
| Male | 308 (57.89) | 130 (57.78) | |
| Age, days | 0.719 | ||
| ≤520 | 175 (32.89) | 71 (31.56) | |
| >520 | 357 (67.11) | 154 (68.44) | |
| Race | 0.960 | ||
| White | 443 (83.27) | 183 (81.33) | |
| Native Hawaiian or other Pacific Islander | 6 (1.13) | 2 (0.89) | |
| Black or African American | 66 (12.41) | 32 (14.22) | |
| Asian | 15 (2.82) | 7 (3.11) | |
| American Indian or Alaska Native | 2 (0.28) | 1 (0.44) | |
| INSS stage | 0.911 | ||
| Stage 1 | 49 (9.21) | 23 (10.22) | |
| Stage 2 | 37 (6.95) | 18 (8.00) | |
| Stage 3 | 53 (9.96) | 23 (10.22) | |
| Stage 4 | 393 (73.87) | 161 (71.56) | |
| MYCN status | 0.551 | ||
| Not amplified | 378 (71.05) | 155 (68.89) | |
| Amplified | 154 (28.95) | 70 (31.11) | |
| Ploidy | 0.864 | ||
| Diploid (DI=1) | 195 (36.65) | 81 (36.00) | |
| Hyperdiploid (DI>1) | 337 (63.35) | 144 (64.00) | |
| MKI | 0.819 | ||
| Low | 214 (40.23) | 85 (37.78) | |
| Intermediate | 158 (29.7) | 70 (31.11) | |
| High | 160 (30.08) | 70 (31.11) | |
| Histology | 0.514 | ||
| Unfavorable | 368 (69.17) | 161 (71.56) | |
| Favorable | 164 (30.83) | 64 (28.44) | |
| COG risk group | 0.155 | ||
| Low risk | 105 (19.74) | 34 (15.11) | |
| Intermediate risk | 58 (10.90) | 33 (14.67) | |
| High risk | 369 (69.36) | 158 (70.22) |
Prognostic factors of OS in the training cohort
To analyze prognostic factors of OS, we used the univariate analysis and multivariate analysis. As shown in Table 2, univariate analysis showed that age of diagnosis (>520 days), race of American Indian or Alaska Native, stage 4 in INSS, MYCN status, DNA ploidy, high MKI were associated with OS. Meanwhile, multivariate analysis showed age of diagnosis (>520 days), stage 4 in INSS and DNA ploidy were independent risk factors of OS.
| Demographics or characteristic | No. | Univariate analysis | Multivariate analysis | ||
|---|---|---|---|---|---|
| HR (95%CI) | P | HR (95%CI) | P | ||
| Sex | |||||
| Female | 224 | ||||
| Male | 308 | 0.916 [0.682–1.229] | 0.558 | 0.798 [0.588–1.084] | 0.148 |
| Age, days | |||||
| ≤520 | 175 | ||||
| >520 | 357 | 4.720 [2.963–7.519] | 0.000 | 1.750 [1.041–2.944] | 0.035 |
| Race | |||||
| White | 443 | ||||
| Native Hawaiian or other Pacific Islander | 6 | 1.126 [0.279–4.548] | 0.868 | 1.122 [0.273–4.609] | 0.873 |
| Black or African American | 66 | 0.912 [0.578–1.439] | 0.691 | 0.787 [0.495–1.251] | 0.311 |
| Asian | 15 | 0.801 [0.297–2.162] | 0.662 | 0.711 [0.258–1.958] | 0.509 |
| American Indian or Alaska Native | 2 | 5.639 [1.393–22.829] | 0.015 | 3.486 [0.829–14.666] | 0.088 |
| INSS Stage | |||||
| Stage 1 | 49 | ||||
| Stage 2 | 37 | 3.061 [0.277–33.779] | 0.361 | 2.148 [0.191–24.170] | 0.536 |
| Stage 3 | 53 | 4.679 [0.523–41.901] | 0.168 | 2.926 [0.317–26.993] | 0.344 |
| Stage 4 | 354 | 34.724 [4.860–248.092] | 0.000 | 17.073 [2.257–129.178] | 0.006 |
| Stage 4S | 39 | 4.751 [0.494–45.708] | 0.177 | 4.633 [0.481–44.638] | 0.185 |
| MYCN status | |||||
| Not Amplified | 378 | ||||
| Amplified | 154 | 1.935 [1.434–2.612] | 0.000 | 1.226 [0.843–1.782] | 0.286 |
| Ploidy | |||||
| Diploid (DI = 1) | 195 | ||||
| Hyperdiploid (DI > 1) | 337 | 0.410 [0.306–0.550] | 0.000 | 0.641 [0.470–0.876] | 0.005 |
| MKI | |||||
| Low | 214 | ||||
| Intermediate | 158 | 1.385 [0.950–2.021] | 0.090 | 0.884 [0.595–1.314] | 0.543 |
| High | 160 | 2.176 [1.532–3.090] | 0.000 | 1.094 [0.716–1.673] | 0.677 |
Prognostic nomogram for OS
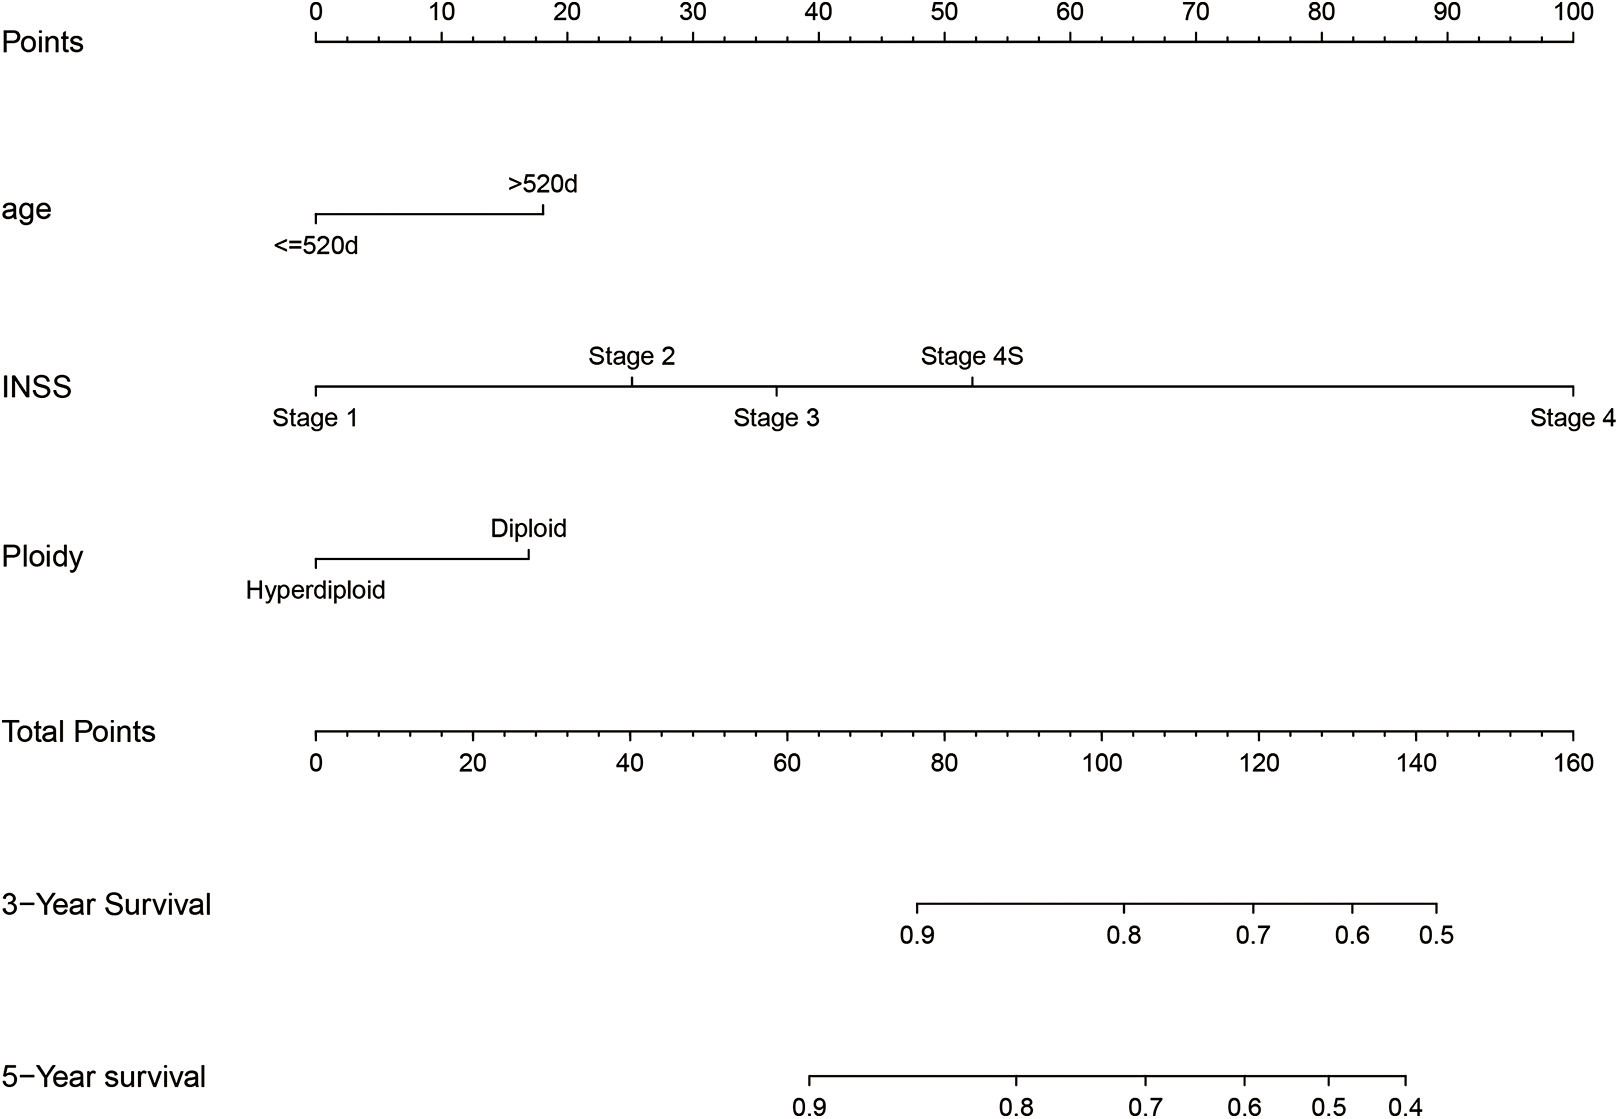
We integrated the factors including age of diagnose, INSS stage and DNA ploidy to form the prognostic nomogram (Fig. 1). The C-index of the nomogram was 0.704 (95% CI [0.686–0.722]) in the training cohort while the C-index in the validation cohort was 0.672 (95% CI [0.644–0.700]). As shown in Fig. 2, the AUC values of ROC curves for 3-year OS and 5-year OS in the training cohort were 0.732 and 0.772, respectively. Besides, the AUC values of ROC curve for 3-year OS and 5-year OS in the validation cohort were 0.703 and 0.743, respectively. The calibration plots for the probability of 3-year OS and 5-year OS indicated no apparent departure form ideal line with optimal agreement between prediction by nomogram and observation in both training cohort and validation cohort.
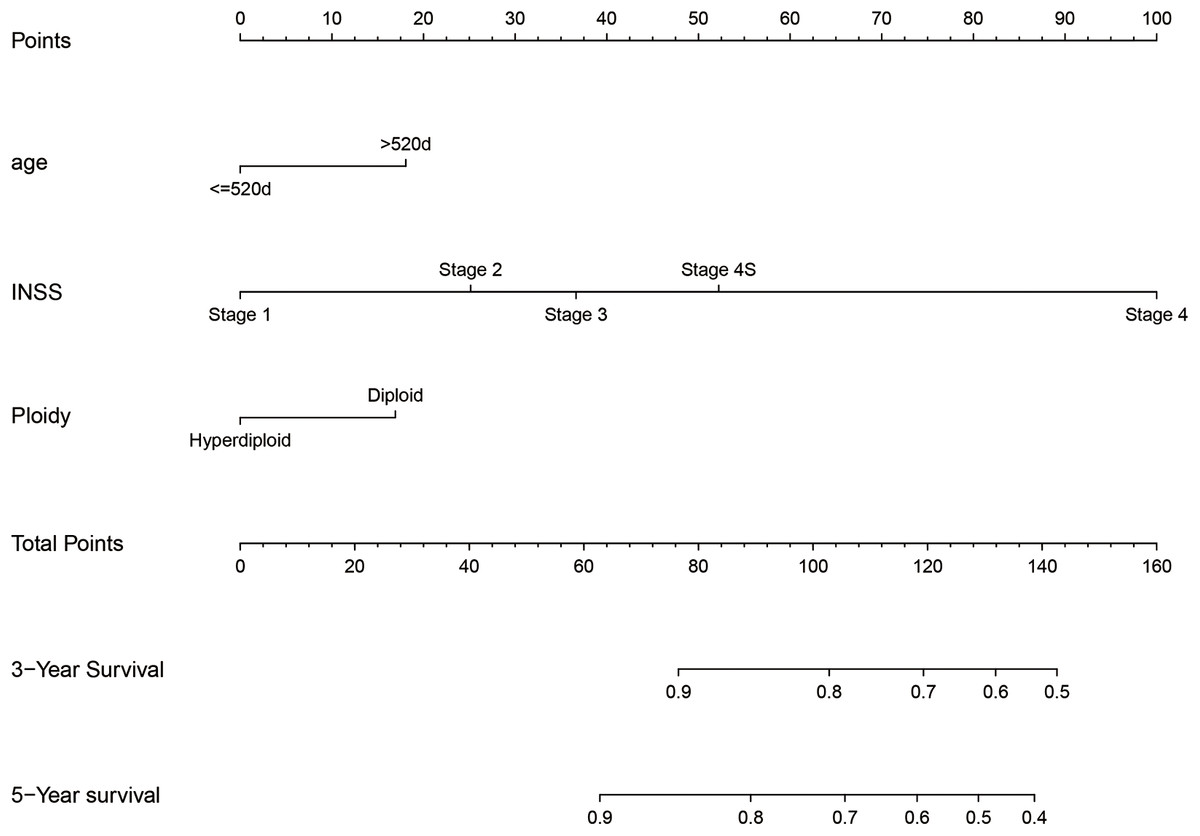
Figure 1: Nomogram to predict the probability of 3-year OS and 5-year OS.
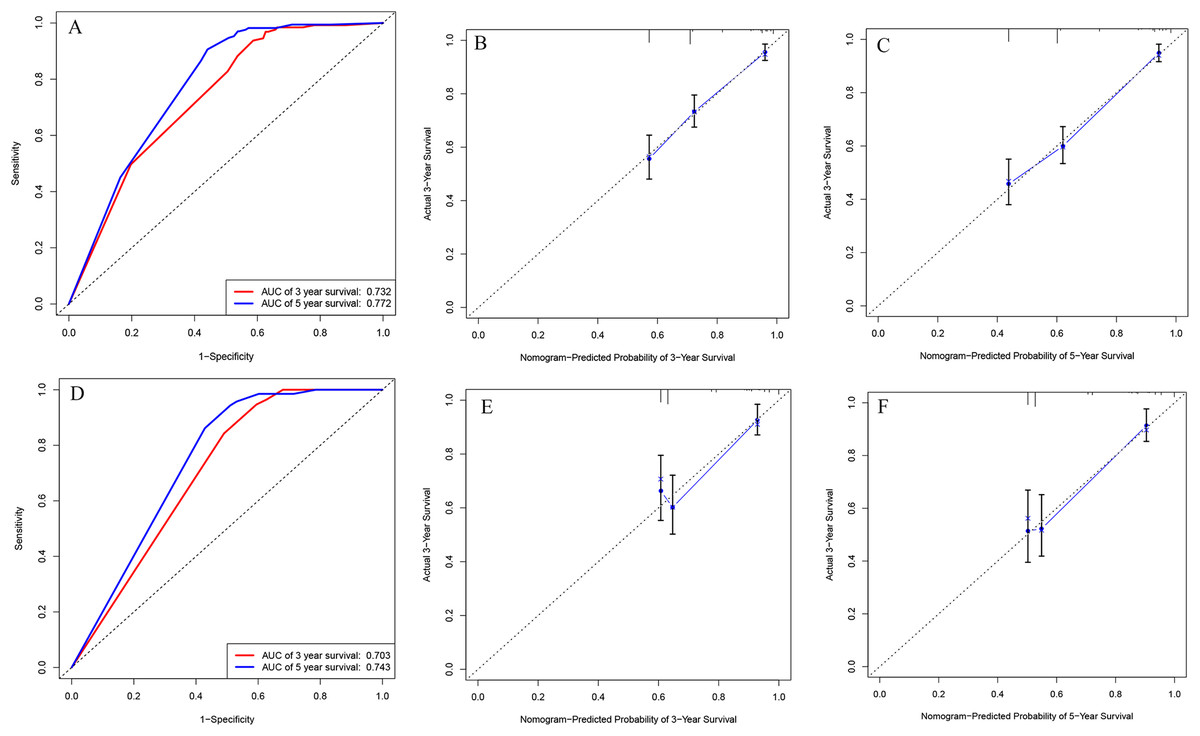
Figure 2: ROC curves and calibration plots of the nomogram in training and validation cohorts.
(A) ROC curves for discrimination in the training set. (B) Calibration plot of observed and predicted probabilities for the nomogram in the training set at 3 years. (C) Calibration plot of observed and predicted probabilities for the nomogram in the training set at 5 years. (D) ROC curves for discrimination in the validation set. (E) Calibration plot of observed and predicted probabilities for the nomogram in the validation set at 3 years. (F) Calibration plot of observed and predicted probabilities for the nomogram in the validation set at 5 years.
We also analyzed the ROC curves and calculated C-index for the prognostic ability of INSS staging system, tumor histology, and COG risk group. As shown in Fig. 3, the AUC values of ROC curves for 3-year OS and 5-year OS in the training cohort were 0.679 and 0.732 in INSS staging system, respectively. The AUC values of ROC curves for 3-year OS and 5-year OS in the training cohort were 0.646 and 0.701 in tumor histology system, respectively. The AUC values of ROC curves for 3-year OS and 5-year OS in the training cohort were 0.669 and 0.719 in COG risk group. The C-indexes for INSS staging system, tumor histology and COG risk group were 0.662 (95% CI [0.648–0.676]), 0.637 (95% CI [0.622–0.652]) and 0.651 (95% CI [0.637–0.665]) in the training cohort, respectively. While C-indexes for INSS staging system, tumor histology and COG risk group were 0.649 (95% CI [0.630–0.668]), 0.641 (95% CI [0.621–0.661) and 0.663 (95% CI [0.645–0.681]) in the validation cohort, respectively.
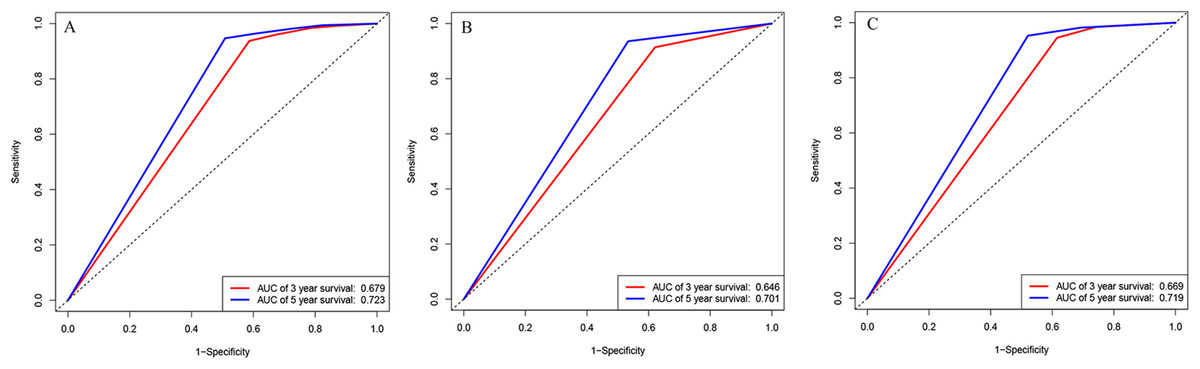
Figure 3: ROC curves.
ROC curves of (A) INSS staging system, (B) histology groups of Shimada system, and (C) COG staging system in training cohort.
Survival curves for prognostic factors
At last, we analyzed the correlation between the prognostic factors in the nomogram and the OS, and drew the survival curves (Fig. 4). The description of risk levels in the training cohort is shown in Table S3. We found that age, race, INSS staging system, MYCN, DNA ploidy status, MKI, and calculated risk scores were associated with overall survival.
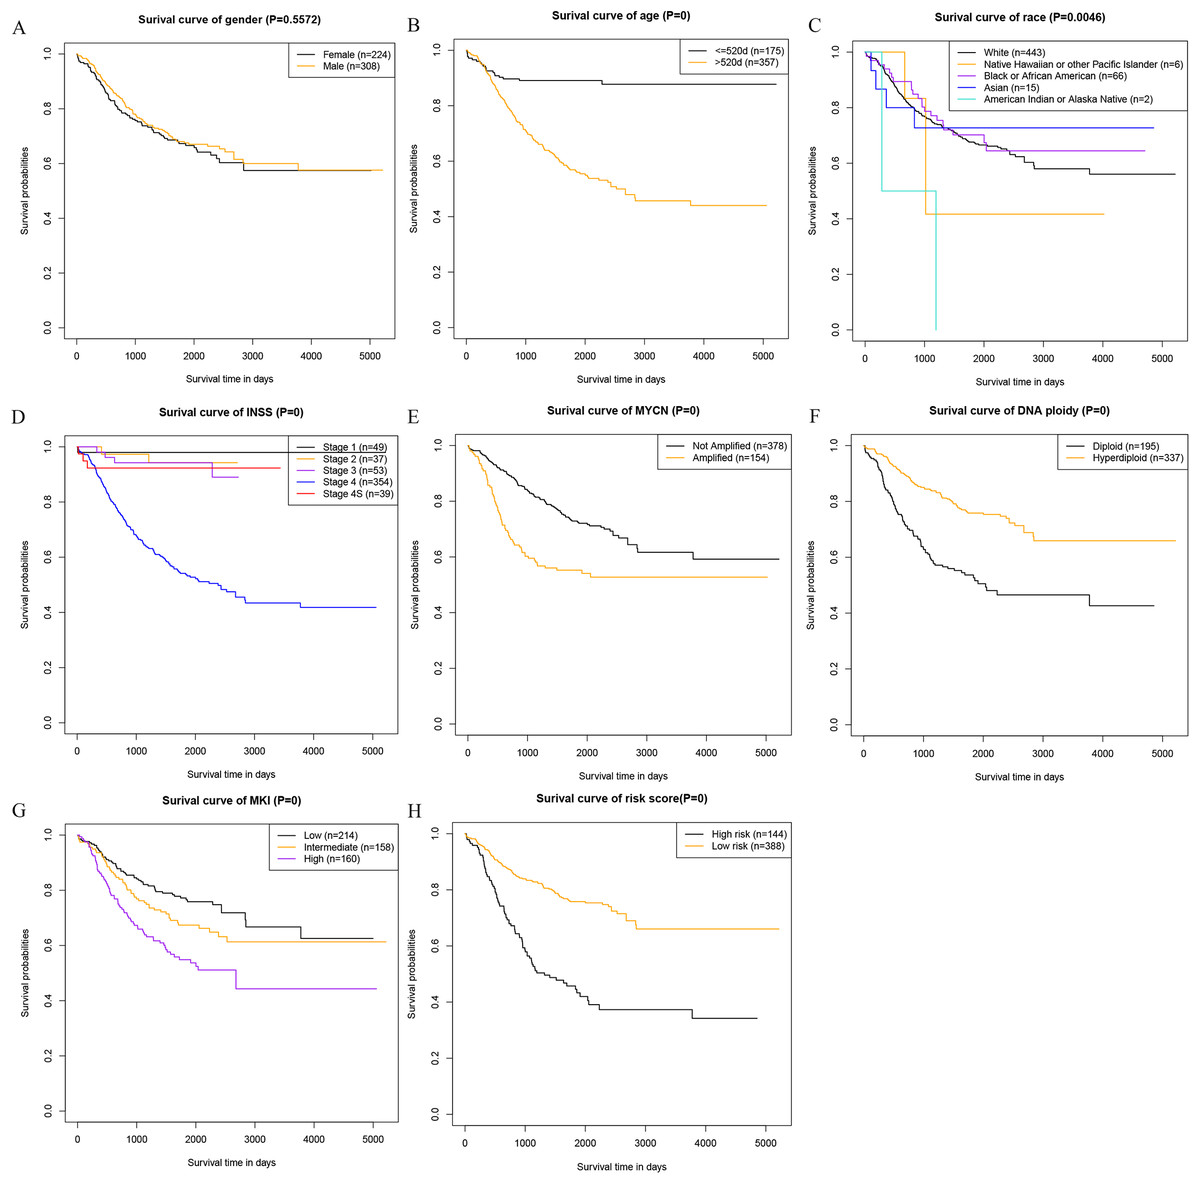
Figure 4: Kaplan–Meier survival curves of the training cohort.
(A) Kaplan–Meier survival curves of gender. (B) Kaplan–Meier survival curves of age. (C) Kaplan–Meier survival curves of race. (D) Kaplan–Meier survival curves INSS. (E) Kaplan–Meier survival curves of MYCN. (F) Kaplan–Meier survival curves Ploidy. (G) Kaplan–Meier survival curves MKI. (H) Kaplan–Meier survival curves risk score.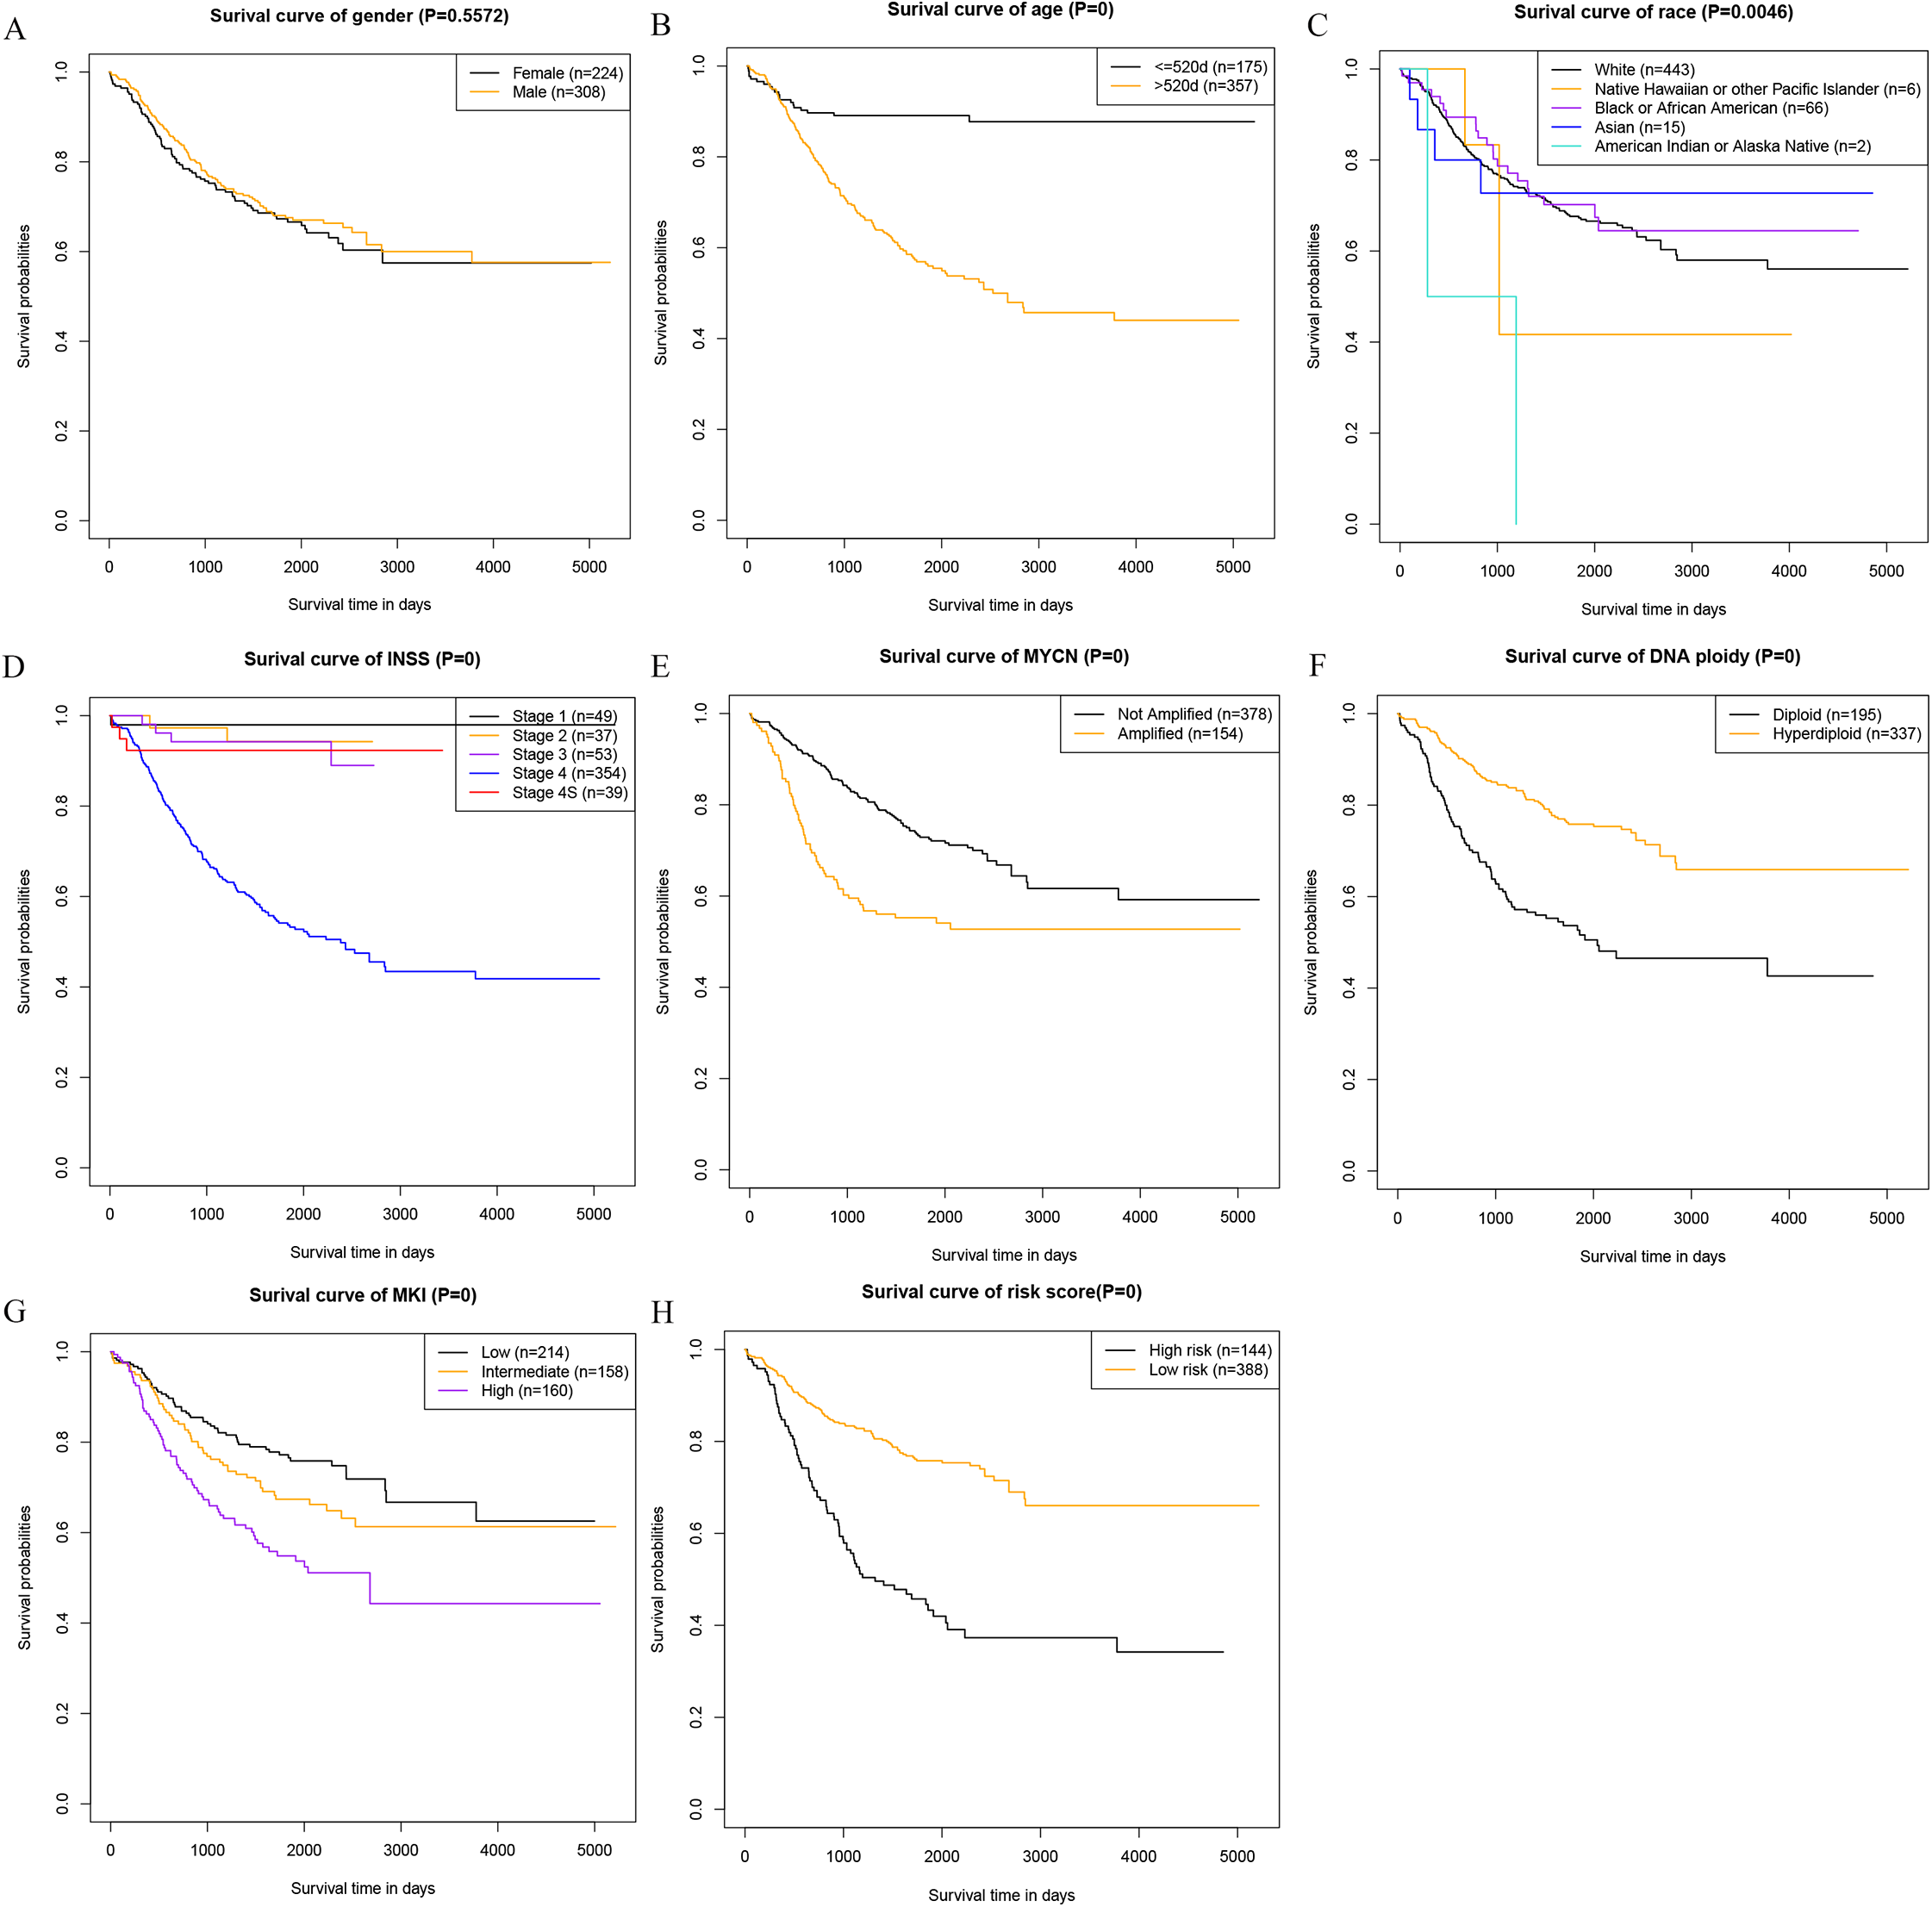
Clinical use of the nomogram
For example, one case of the cohort whose age was 1,758 days (>520 days) was identified as stage 4 in INSS and hyperdiploid status. The estimated point was about 18 + 100 + 0 =118. The estimated 3-year survival rate and 5-year survival rate was about 80% and 72%, respectively. Actually, this patient died at the age of 2,846 days (7.80 years).
Discussion
Our study found that age of diagnosis (>520 days), stage 4 in INSS and DNA ploidy were independent prognostic risk factors for neuroblastoma in children. Then the prognostic nomogram was constructed based on age of diagnose, INSS stage, and DNA ploidy status to predict 3-year OS and 5-year OS. The nomogram can provide a relatively accurate estimate of the prognosis of patients. There are many reports that the nomogram has higher accuracy than the conventional tumor staging system (He et al., 2018; Wang et al., 2018; Wang et al., 2013). The nomogram showed stronger predictive power than the INSS staging system, tumor histology, and COG risk group.
The nomogram is mainly used to predict the relevant conditions of the disease. In terms of tumors, the nomogram is mainly used for prognostic models such as tumor patient mortality, lymph node metastasis, and complications (Jiang et al., 2019; Wei et al., 2019). The nomogram is a new form of disease risk estimation that can aid clinical decision making (Botticelli et al., 2019). Studies based on the Surveillance, Epidemiology, and End Results Program (SEER) database showed that gender had no significant difference in the OS of neuroblastoma in children (Stokes et al., 2015). These results were consistent with our findings. Zhao reported clinical data of 155 children with neuroblastoma under the age of 18. It was found that the patients had 3-year and 5-year overall survival rate of 96.2% and 94.1%, and compared with 12–18 months, 12 month-old-children had a better prognosis. MYCN amplification, elevated LDH was associated with poor prognosis (Zhao et al., 2017). Campbell reviewed 4,672 patients with neuroblastoma and found that patients with MYCN amplification had lower event-free survival and lower overall survival (Campbell et al., 2017). Moreover, studies had shown that MYCN amplification in serum of patients with neuroblastoma was also associated with overall patient survival (Yagyu et al., 2016). Neuroblastoma patients with overexpressing MYCN and MYCN protein had lower survival rates (Bansal et al., 2017; Wang et al., 2015). In addition to MYCN gene abnormalities, deletion of 11q was also associated with prognosis in patients with neuroblastoma (Caren et al., 2010). Based on the SEER database, it was found that stage 4 disease, unfavorable DNA ploidy, MYCN gene amplification decreased the 5-year survival rates (Coughlan et al., 2017), while age, tumor location, stage are independent prognostic factors for neuroblastoma (Gutierrez et al., 2007).
The International Neuroblastoma Staging System staging system is widely used in patients with neuroblastoma, which is also a common prognostic indicator (Bansal et al., 2017; Tan et al., 2012). The International Neuroblastoma Pathology Classification (INPC) classifies neuroblastoma into the favorable histology (FH) group and the unfavorable histology (UFH) group. The FH group had an earlier onset and a good prognosis, while the UFH group had a poor prognosis (Nakazawa et al., 2015). The COG risk group was established in 1998 for prognosis of neuroblastoma. Age of diagnose, INSS stage, INPC, MYCN status, and DNA ploidy status are included in the COG risk group. After the application of the COG risk group, the survival of patients with neuroblastoma is greatly improved (Elzomor et al., 2018).
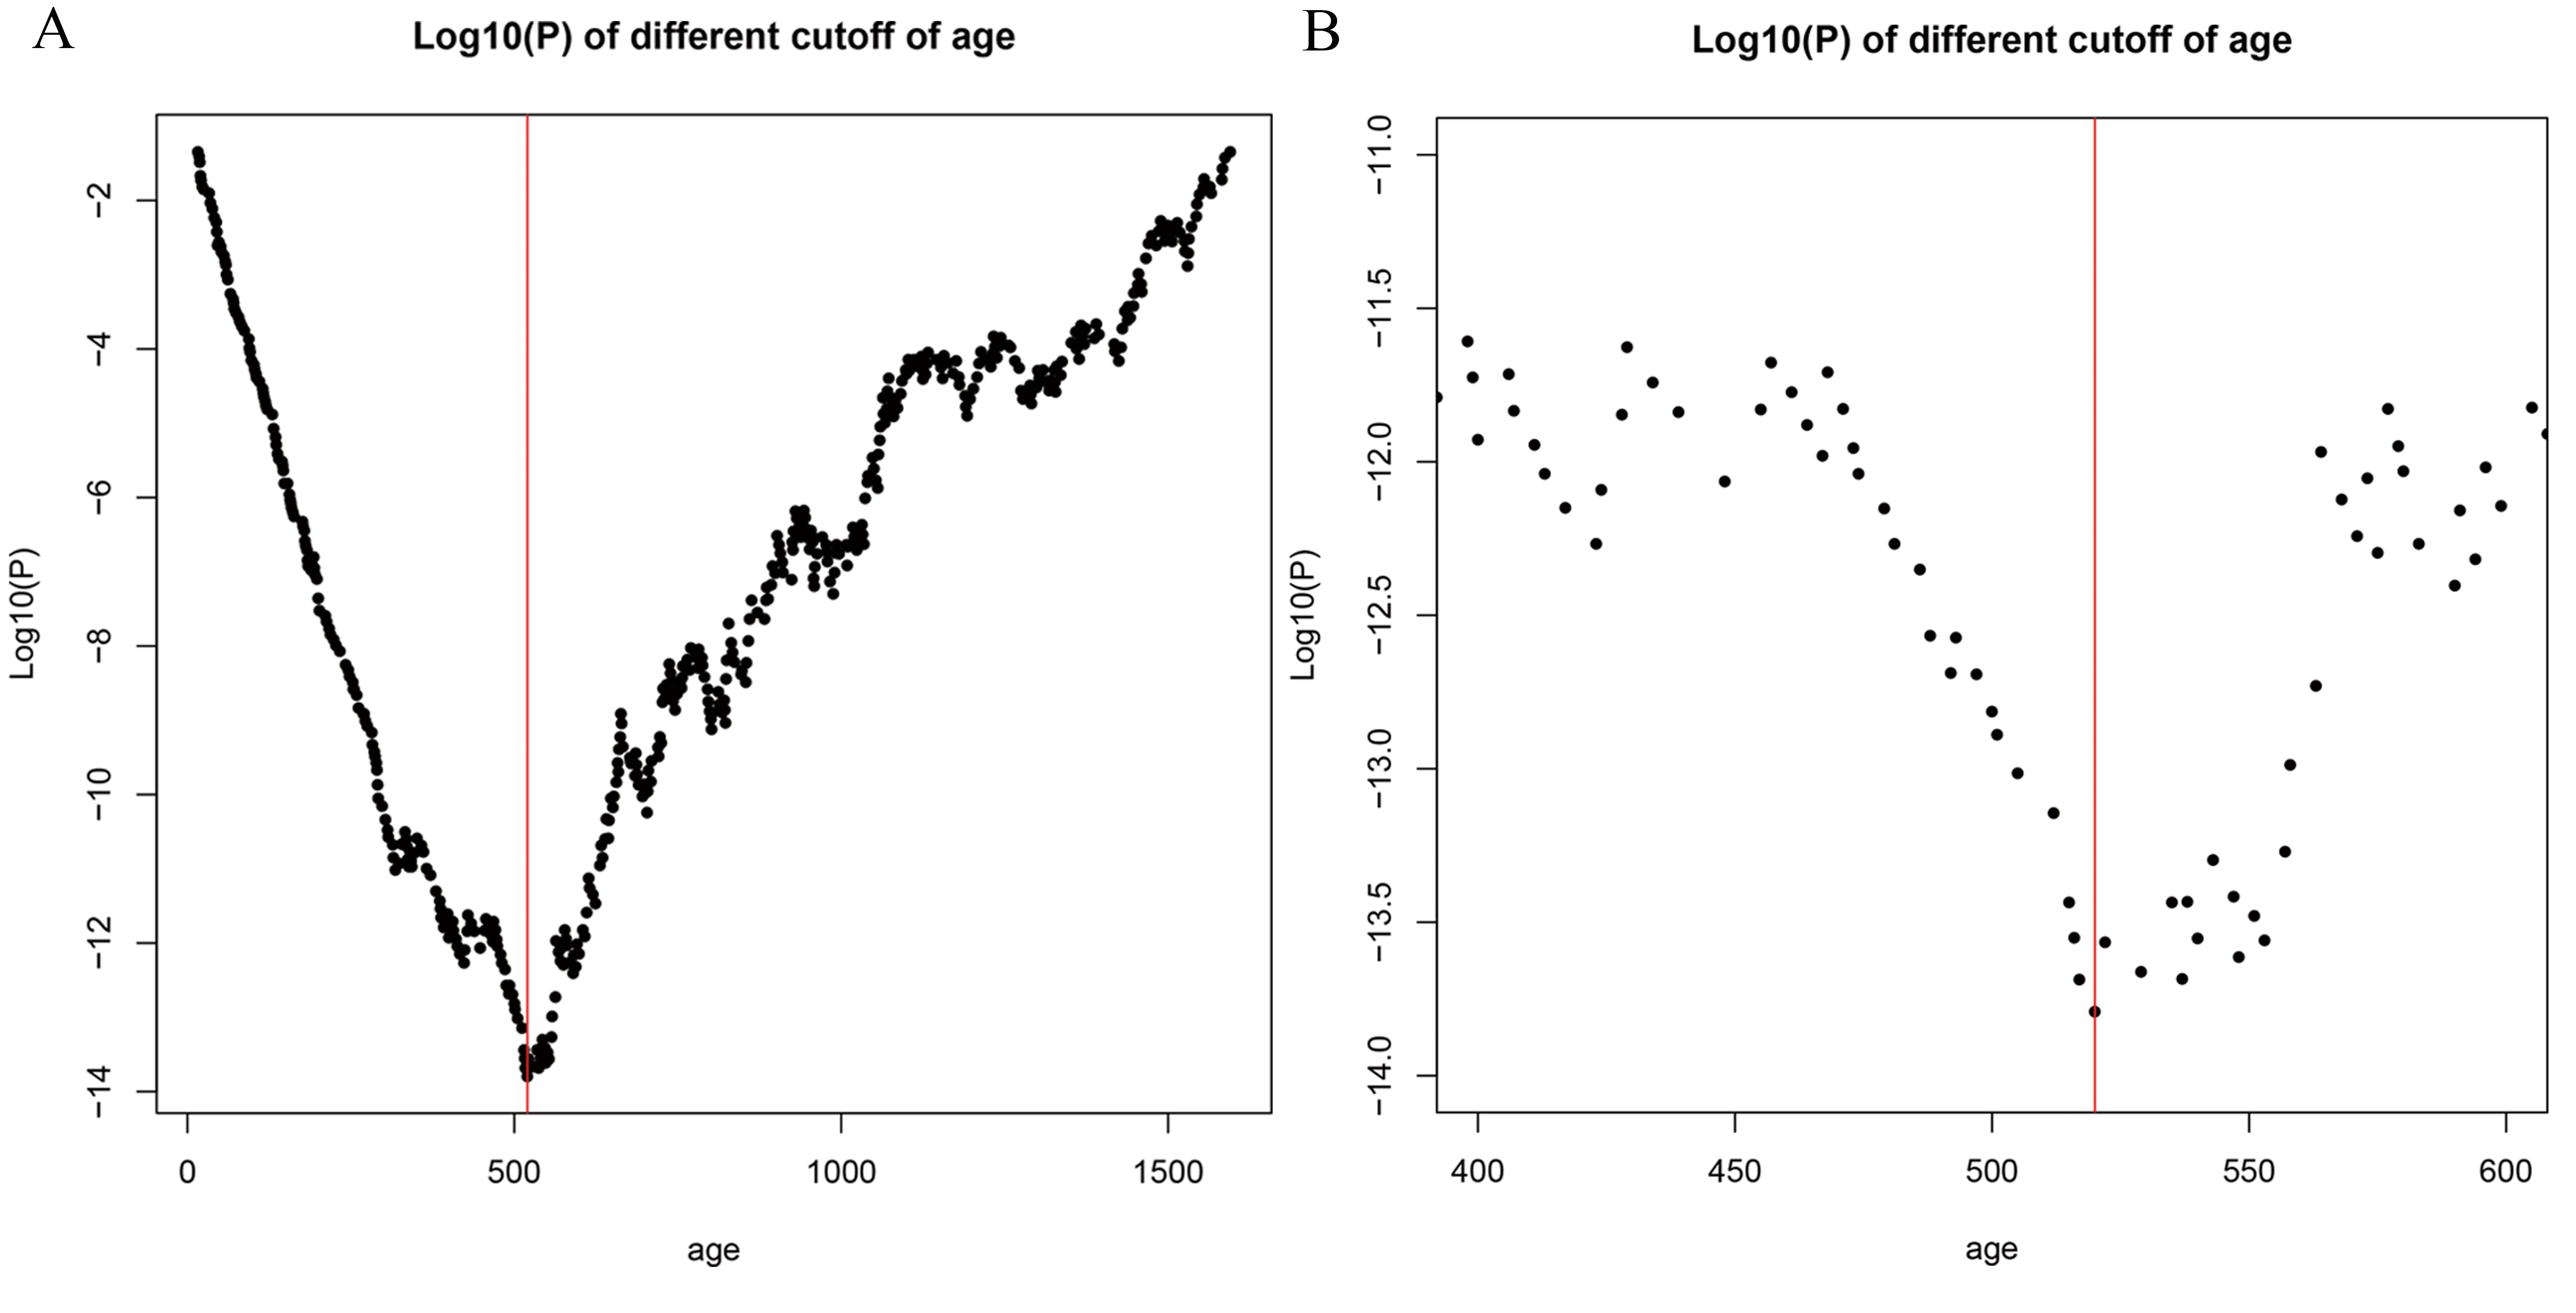
The optimal cutoff of age in this study was determined by the “survminer” package of R software using maximally selected rank statistics (the P-age curve is shown in Fig. S2). The cutoff was younger than that suggested by London et al. (2005) probably because of selection of cases or inclusion criteria.
However, there are also many limitations in this study. For example, the different treatment options of individuals and secondary cancer may influence the effectiveness of model. There are many breakthroughs in the treatment of neuroblastoma in recent years (Tolbert & Matthay, 2018), which may also have survival impact affecting the study results. Moreover, adding more updated data to the study can make the results more accurate. Other potential factors such as TERT rearrangements, ATRX mutations, CCND1 amplification may also perform well in prognosis of neuroblastoma. In addition, due to the limitations of the collected case data, the study case cannot include population characteristics in all regions, which may affect the nomogram to reflect all population characteristics.
Conclusion
Analysis of clinical data based on big data is an important source of clinical prognostic indicators. The vast majority of current clinical data analysis is based on the SEER database. The TARGET database is part of the National Cancer Institute project and its clinical data is rarely reported. As we known, we analyzed the primary data of childhood neuroblastoma for the first time. Based on the patients’ primary clinical data, the prognostic nomogram of the prognosis of childhood neuroblastoma was established, whose accuracy was higher than the INSS staging system, the INPC, and the COG risk group. Precise estimates of the prognosis of childhood neuroblastoma might help doctors assess the patients’ actual condition, select appropriate treatment options, and develop better follow-up plans.
Supplemental Information
Dataset S1.
Raw data exported from the TARGET database: gender, race, age at diagnosis, INSS stage, MYCN status, ploidy status, MKI status, histology status, and COG risk group.
Dataset S2.
Raw data exported from the TARGET database: gender, race, age at diagnosis, INSS stage, MYCN status, ploidy status, MKI status, histology status, and COG risk group.
Log10(P) of different cutoff of age.
(A) Log10(P)-age plot. (B) Close-up view of Fig. S2A.