

Abstract
Hydrophobic effect was utilized to self-assemble gold nanoparticles into oligomer structures, or plasmonic dimers, trimers, and so on. Langmuir–Blodgett film of n-octadecanamine was prepared on a glass substrate. Citrate-stabilized gold nanoparticles were adsorbed onto the film, resulting hydrophobic point decoration. The gold nanoparticles with the point decoration were removed from the substrate and self-assembled into plasmonic dimers in ethanol. The products were observed by an atomic force microscope, where not only dimers but also trimers and other aggregates were found. The yield of the plasmonic dimer was ∼13% without any purifications. We measured the scattering spectrum of the single plasmonic dimer, exhibiting the optical anisotropy.
Export citation and abstract BibTeX RIS
Metallic nanostructures or plasmonic structures can confine light waves in the nanometer space,1,2) and they have opened up novel optical functionalities never achieved with only bulk materials.3–7) The optical functionality of the metallic nanostructures can be engineered by not only the sort but also the geometry and great efforts have already been made on fabricating metallic nanostructures for plasmonic applications. However, almost all works have been focused on shape control of metallic nanoparticles (NPs), such as nanorods, nanoprisms and nanostars, with self-assembling methods.8) In the synthesis of metallic nanoparticles, metal ions are reduced to metal atoms and they are assembled into metallic nanoparticles according to the surface energy. Instead of the metal atoms, metallic NPs can be used as building blocks, resulting in hierarchical complex plasmonic structures. More sophisticated optical functionalities are expected with the hierarchical plasmonic structures. For instances, a looped structure of metallic NPs responds to the magnetic component of the electromagnetic wave.9) The aggregates of the metallic NPs have been used for surface-enhanced Raman scattering (SERS), exhibiting large field enhancement.10) Two dimensional NP array works also as a SERS active substrate.11–13) Such field enhancement is achieved, especially, at the nano-gaps. Recently, quantum mechanical effects have been studied with a tiny gap less than a few nm formed by NP-on-mirror.14–17)
NP-on-mirror provides single nano-gap, which is identical to a plasmonic NP dimer structure. Plasmonic dimer is composed of only two metallic NPs, which is the simplest structure among NP aggregates. SERS measurement was performed at the nano-gap of the plasmonic dimer, where Raman signals were significantly enhanced.18,19) For their practical uses, self-assembly is important in their fabrication, allowing low cost and mass production. The metallic NPs were bound with single-strand DNA through biotin–streptavidin binding, which was used as plasmon ruler.20) Semi-embedded NPs were used for formation of dimers, resulting oriented NP pairs.21) Surface of metallic NPs was asymmetrically functionalized to self-assemble NPs into dimers.22,23) DNA origami was used as a platform for Au–Au and Au–Ag dimer structures.24,25) Plasmonic dimers were assembled by linker-free approaches, enabling assemble/disassemble reversible control.26) The reversible control was achieved by changing the solvent quality between selective solvents and common solvents. Metal–organosilica Janus nanoparticles were used for such reversible dimer formation, where surfactant concentration was a parameter for assemble/disassemble control.27)
In this article, we report hydrophobic assembly of AuNPs into plasmonic dimers, which is a linker-free approach, with hydrophobic point decoration, as drawn in Fig. 1. Initially, the surface of the AuNPs is homogeneously hydrophilic because the surface is stabilized by citrates. The planar amphiphilic molecular film was prepared by Langmuir–Blodgett (LB) method with n-octadecanamine on a planar glass substrate. AuNPs were electrostatically adsorbed onto the LB film, resulting the hydrophobic point decoration. The surface of the adsorbed AuNP has two different chemical properties, both hydrophobic and hydrophilic surface, which is referred to as a patchy AuNP. We utilized the geometrical restriction on contact between a AuNP and a planar hydrophobic molecular film to perform the hydrophobic point decoration for each AuNP.22,23) The patchy AuNPs recognize each other through the hydrophobic interactions,28) leading to spontaneous formation of AuNP dimers after the Au patchy NPs were removed from the glass substrate in a hydrophilic solution. The AuNP dimers were evaluated by measuring the extinction spectrum, polarization dependence of the scattering spectrum, scanning electron microscope (SEM), and observation with atomic force microscope (AFM).
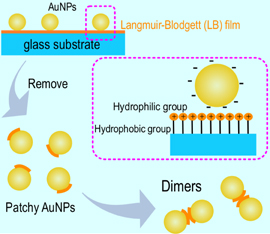
Fig. 1. Conceptual diagram for self-assembly of AuNPs into plasmonic dimers. LB film of n-octadecanamine was deposited on a glass substrate. AuNPs were electrostatically adsorbed, where the AuNPs were decorated with n-octadecanamine only at the contacting point with the film, resulting in patchy AuNPs. The patchy AuNPs were removed from the glass substrate, and self-assembled into dimer structures in ethanol solution.
Download figure:
Standard image High-resolution imageUltra-pure water was prepared by means of an Elix water purification system (Millipore), and used in all experiments. 50 mM of sodium tetrachloroaurate(III) dihydrate (Na2AuCl4  2H2O, 95.0%, Wako), 3 wt % of trisodium citrate dihydrate (C6H5Na3O7 2H2O, Wako) in aqueous solutions were prepared. 500 µL of NaAuCl4 solution, 100 mL of ultra-pure water and 200 µL of trisodium citrate solution were mixed in a glass bottle, and heated at 80 °C for 2 h. The extinction spectra of this AuNP solution were measured by an absorption photo-spectrometer (Shimadzu UV-3600). The geometrical shape of the assembled AuNPs was observed with an AFM (Bruker DimensionICON).
The surface of glass substrates was cleaned by UV/ozone cleaner for 3 min. The glass substrates were soaked in 30 g of toluene (C7H8, 99.5%, Kanto Chemical) including 1 mL of 1,1,1,3,3,3-hexamethyldisilazane (HMDS; C6H19NSi2, 96.0%, Tokyo Chem. Ind.) for 10 min. The glass substrates were taken out from the solution and sonicated for 10 min in 30 mL of ethanol. Finally, the glass substrates were dried.
0.5 mM of n-octadecanamine (C18: C18H39N, Tokyo Chem. Ind.) in chloroform (CHCl3, 99.0%, Wako) solution was prepared, and 20 µL of the C18 solution was spread evenly over the surface of water in a a LB trough (Filgen LB40-MWC), resulting a monolayer of C18 at an air/water interface. The monolayer was deposited onto the hydrophobic glass substrate at the surface pressure of 54 ± 3 mN/m.
Figure 2(a) shows π–A curve of C18 during the formation of single molecular film and deposition onto the hydrophobic glass substrate. The initial surface area was ∼47.5 cm2. Equilibrium-relaxation mode was employed, where the compression was performed with regular time intervals to relax the local stress of the single molecular film. As the surface area decreased the surface pressure increased where the density of molecules increases. The surface pressure was achieved at 51 mN/m, which was around the setting pressure, at ∼22 cm2 of the surface area. The deposition of the single molecular layer onto the hydrophobic glass substrate was started, where temporal decrease of the surface pressure was observed. The surface pressure was stable at 51 mN/m during the deposition process. The result means that the LB film was perfectly deposited on the glass substrate (LB/glass).

Fig. 2. (a) π–A curve of n-octadecanamine (C18) during deposition process onto a glass substrate. (b) Extinction spectra of AuNPs/LB/glass before (solid line) and after ultra-sonication (dotted line) in ethanol. A photograph of AuNPs/LB/glass is shown in the inset.
Download figure:
Standard image High-resolution imageThe LB/glass substrates were soaked for one night in AuNP (45–50 nm) solution (pH 7), where AuNPs adsorbed onto the LB/glass (AuNPs/LB/glass). The surface of the glass substrate was completely covered with AuNPs. The glass substrates covered with the AuNPs was soaked for 1 h in 30 mL of citric acid (C6H5Na3O7, 98.0%, Wako) aqueous solution (0.001 wt %) to inactivating surplus C18. After that, the glass substrates were sonicated for 5 min in 30 mL of ethanol. AuNPs with C18 were removed from the glass substrate and dispersed in the ethanol. The ethanol solution including AuNPs was concentrated by iterating centrifugation (5,000 rpm, 10 min) four times.
The extinction spectrum of the AuNPs/LB/glass [inset of Fig. 2(b)] was measured, as shown in Fig. 2(b). The extinction was observed over wide rage in visible and near-infrared region although the extinction peak of the AuNP solution was observed at 537 nm, as shown in Fig. 3. This result indicated that AuNPs adsorbed densely onto the LB film deposited on the glass substrate. Then, the AuNPs/LB/glass was ultra-sonicated in ethanol, and the extinction spectrum was measured. The extinction disappeared obviously by the ultra-sonication process, which indicates that the adsorbed AuNPs were removed from the glass substrate, as shown in Fig. 2(b). The glass substrate, from which the AuNPs had been removed, was immersed in a fresh AuNP solution again, and we measured the extinction spectrum. However, no extinction was observed in this substrate, which indicates that the LB film was completely removed from the glass substrate together with the AuNPs during the ultra-sonication process.
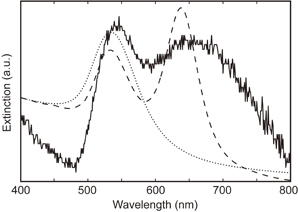
Fig. 3. Extinction spectra of AuNPs in ethanol solution after ultra-sonication (solid line) and AuNP solution (dotted line). Calculated extinction curve of AuNP dimer is also shown as dashed line.
Download figure:
Standard image High-resolution imageThe AuNPs removed from the LB/glass substrate exist in the ethanol solution. The AuNPs were partially decorated with C18, where patchy AuNPs were produced temporally. The surplus C18 molecules were inactivated by addition of sodium citrate solution before they were removed from the glass substrate. The Au patchy NPs were immediately self-assembled into dimers in the ethanol solution after they removed from the substrate. We condensed the solution including AuNPs with iterating centrifugation (5,000 rpm, 10 min) four times. We measured the extinction spectrum of the condensed solution, which is shown in Fig. 3. The two extinction peaks were clearly observed at 546 and 645 nm. The extinction peak was initially observed at 537 nm for AuNP solution. It is found that the extinction peak at 645 nm was newly generated through our fabrication process.
We calculated the extinction spectrum of the plasmonic dimer by discrete dipole approximation (see the online supplementary data at http://stacks.iop.org/JJAP/57/120311/mmedia). We assumed that the plasmonic dimer was composed of two AuNPs (40 nm) with the inter-particle gap of 0.5 nm in ethanol (n = 1.36). The calculated extinction curve is shown also in Fig. 3 with dashed line. Two peaks were found at 532 and 638 nm, which correspond to the transverse and longitudinal modes, respectively. The positions of the both peaks were similar to the experimental result. However, the longitudinal peak height was higher than the transverse peak in the simulation, which was different from the experimental result. It was also found that the longitudinal peak measured in the experiment was much broader than that in simulation. This result implies that the solution included not only dimers but also some other structures, like oligomers.
It was found that AuNPs were assembled and dispersed in the ethanol solution. The result implies the size of the assembled structures was not large, like oligomers that several NPs are assembled. In order to investigate the shape of the assembled AuNPs, we observed them with an AFM. Figure 4 shows the AFM image of the assembled AuNPs. We controlled the concentration of the solution for the average number of assembled AuNP structures (ca. 15 structures in the area of 3 µm by 3 µm) to distinguish each structure clearly. Additionally, three-dimensional (3D) image is shown as Fig. 4(b), indicating the height information of the AuNPs structures. The AuNP dimers, which are marked by the circles, were found among them. The 3D image indicates the height of the marked structures was ∼40 nm, corresponding to the diameter of the AuNPs. The LB film thickness of C18 was ∼2.7 nm, and then, we supposed that the AuNPs were stuck in the LB film by 2 nm at most, leading to less than ∼5% of hydrophobic coating of AuNP surface. Not only the dimers but also other assembled structures were observed on the glass substrate. However, few of larger aggregated structures, the size is more than 1 µm, were observed on the glass substrate. The assembled structures may be not large because these structures are dispersed in the solution. From these results, the largely assembled AuNPs are still oligomers, but not polymers.
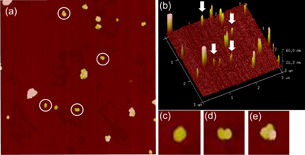
Fig. 4. AFM images of the assembled AuNPs in ethanol. (a) 2D AFM image (3 µm by 3 µm), where dimers are indicated by circles. (b) 3D AFM image of (a), where the red arrows indicate dimers. AFM images of (c) monomer, (d) dimer, and (e) trimer.
Download figure:
Standard image High-resolution imageWe observed totally 220 of the assembled AuNPs, and the yields of the fabricated AuNPs dimers, the monomer, the trimer and the other aggregates were 13, 33, 7, and 47%, respectively. The LB substrate with AuNPs was soaked in a citric acid solution to inactivate the surplus amines. Not only AuNPs with C18 but also the inactivated C18 molecules were removed from the glass substrate when it was washed in ethanol. Some of the inactivated C18 molecules may adsorb onto the hydrophobic part of AuNPs through hydrophobic bonding. Citric acid molecule has three negative charges at maximum. Therefore, the hydrophobic part can be charged again, which results in resurrection of the repulsive force for the dispersion. The resurrection of the repulsive force may cause 33% of the monomer. Furthermore, we calculated extinction spectra of monomer, dimer, trimer, and tetramer, where the calculation model were 2D, by finite-difference frequency-domain (FDTD) method (see the online supplementary data at http://stacks.iop.org/JJAP/57/120311/mmedia). The peak positions were different for each structure although all of them were observed at ∼670 nm. A large number of plasmon modes can be excited through the various orientations of those structures in the solution although we calculated only one orientation for each structure, which may be the reason for the broad peak observed in our experiment.
The AuNP monomers and oligomers were observed with an optical dark-field microscope equipped with a linear polarizer. The sample solution was dropped onto the glass substrate whose surface was modified with amino-groups. The samples were annularly illuminated for dark-field observation, and the scattered light was reflected back to the objective lens (×100, NA 0.90). The scattered light traveled through a linear polarizer, and detected by a CCD (Lumerane Infinity3-6URC). The light was partially reflected into an optical fiber (diameter: 50 µm), leading to a spectrometer (Princeton Instruments Spectra Pro. SP2300, PIXIS 100BR eXcelon) for measurement of scattering spectrum. The scattering spectrum from the AuNP dimer was measured at different rotational angles of the linear polarizer from 0 to 90°. Exactly the same AuNP dimer was observed with a scanning electron microscope (SEM). Osmium coater (Meiwafosis Neoc-Pro) was used for the conductivity at the surface of the glass substrate.
Figure 5 shows the dark-field image of the AuNP monomers/oligomers. The yellowish or reddish spots indicate AuNP oligomers, which was emerged at the longer wavelength peak in Fig. 3. We observed the same sample with a SEM. The inset shows the SEM image of the red-colored scatterer indicated by the white arrow, which revealed the scatterer was a plasmonic dimer. It was found that the diameters of AuNPs were ca. 50 and 20 nm, which was a hetero-dimer. We defined the rotational angle of the linear polarizer was 0° at this angle, where the polarization is parallel to the longitudinal axis of the plasmonic dimer.
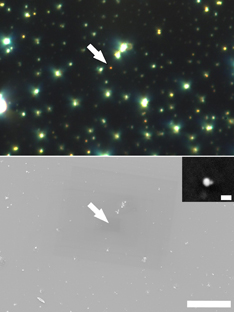
Fig. 5. (Top) Dark-field optical microscope image through linear polarizer at 0°. (Bottom) SEM image at exactly the same area observed with the dark-field optical microscope. The arrows both in top and bottom image indicate the same AuNPs. The inset is the magnified SEM image of the AuNPs. The scale bars are 10 µm and 100 nm for the SEM and the magnified SEM, respectively.
Download figure:
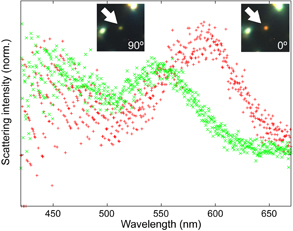
Standard image High-resolution imagePlasmonic dimer possesses anisotropic geometry, which gives different plasmon resonances between the longitudinal and transverse modes. Then, we measured scattering spectrum from the plasmonic dimer at the different polarization angles. Figure 6 shows the scattering spectra from the AuNP dimer (indicated by white arrow in Fig. 5) measured at 0 and 90°, where the polarization direction is parallel and perpendicular to the longitudinal axis of AuNP dimer structure, respectively. The scattering peak was observed at ∼595 nm when the polarizer was parallel to the longitudinal axis of AuNP dimer. The peak position was different from the extinction peak in Fig. 3 because the extinction spectrum was measured in ethanol solution. After rotating the polarizer by 90°, the peak was shifted to ∼540 nm, and scattered green light. The peak wavelength was continuously shifted during the rotation from 0 to 90° (see also the online supplementary data at http://stacks.iop.org/JJAP/57/120311/mmedia, scattering spectra at each rotational angles and movie). The optical property agrees with the geometrical anisotropy of dimer, two-fold rotational symmetry. We observed many other spots exhibiting similarly behaviours during the rotation of the polarization, indicating many plasmonic dimers were formed.
Fig. 6. Scattering spectra from a plasmonic dimer through the linear polarizer set at 0° (red) and 90° (green).
Download figure:
Standard image High-resolution image
We showed self-assembling method for AuNP oligomers using LB film. We prepared the LB film of n-octadecanamine on the planar glass substrate, and AuNPs (∼40 nm) were adsorbed on the film. The AuNPs partially decorated with n-octadecanamine, or patchy AuNPs, were removed from the glass substrate in ethanol solution. The patchy AuNPs spontaneously were linked each other in the solution through hydrophobic interactions. The assembled structures in the solution were fixed on the glass substrate, and observed with AFM. Besides the AuNP dimers, other oligomer structures were observed in the sample, and it was found that the yield of the dimer was ∼13% without any purifications. We observed two extinction peaks corresponding to the plasmonic modes from monomers and oligomers. The sample was also observed with the dark-field optical microscope, where those different scatterings were observed from the plasmonic monomers and the oligomers. Furthermore, the scattering spectrum from the AuNP dimer was measured with a linear polarizer at different polarization angles. The measurement revealed the scattering peak shifted continuously from ∼595 to ∼540 nm during the change of the rotation angle by 90°, which is characteristic to the two-fold symmetry. The inter-particle gap can be controlled by using different carbon lengths of LB film, which may be significant for controlling the functionality of the plasmonic dimers.
Acknowledgements
This research was supported by JSPS KAKENHI Grant Number JP15K04609. We gratefully thank Professor M. Fujii in National Institute of Technology, Toba College for FDTD program. NT gratefully thanks Professor N. Ikeda in Okayama University for AFM measurements.