

Abstract
Owing to its high spatial resolution, near-field spectroscopy is a useful method for sensing the stress in a narrow region of submicron order. Here, on the basis of the highly resolved images obtained by near-field luminescence spectroscopy, we propose a statistical method of analyzing grain anisotropy-induced stress in polycrystalline Al2O3. We focus on two characteristics of a spectra: the intensity ratio and peak shift of luminescence of two lines (R1 and R2) from Al2O3 to discuss crystal orientation and stress, respectively. By incorporating the concept of the crystal misorientation parameter using intensity ratio, an apparent correlation between the magnitude of stress and the misorientation is found. This correlation analysis provides an important insight for the investigation of local thermal stress in Al2O3.
Export citation and abstract BibTeX RIS
1. Introduction
For the proper operation management of structural components, the local residual stress in ceramics has been widely assessed by optical spectroscopy due to its capability to sense stress with high spatial resolution. Although Raman spectroscopy is a versatile tool for stress measurement available for various materials,1–3) the photoluminescence from Al2O3 offers a much sensitive stress detection owing to its strong signals, which has been applied to not only the monolithic bulk Al2O3,4–7) but also thermally grown Al2O3 films,8–12) and composite materials.13–16) The luminescence technique makes use of the linear relationship between stress and the shift of the luminescence R-lines of Al2O3. In addition, polarization characteristics of the R-lines have also been studied for their possible use for assessing the crystallographic orientation of Al2O3.17,18)
In conventional luminescence spectroscopy using lens-based optical systems, the spatial resolution is still restricted to ∼1 µm owing to the diffraction limit of light. On the other hand, a near-field technique enables spectroscopic investigation with a spatial resolution of 30–500 nm.19–23) There is thus significant interest in the application of this method to sensing stress in a narrower region, such as stress within grains of polycrystalline Al2O3. Recent technological improvements of lens-based luminescence detection system also enable the detailed analysis of each stress component inside Al2O3.24,25) Attempts using such a system, however, were made on the polycrystalline Al2O3 with an average grain size larger than 10 µm. Moreover, in many luminescence studies of stress inside grains of Al2O3, the properties of emission anisotropy have not been examined despite the fact that the local polarization characteristics relevant to the individual grain orientation are important for the effect of anisotropic thermal expansion on stress, which causes fracture.26–28) To date, the evaluation of grain-anisotropy-induced stress has been limited to numerical stress simulation using grain-orientation-limited polycrystalline ceramics as a model.26,27,29–31) Simultaneous high-resolution imaging of stress and grain orientation by near-field luminescence spectroscopy will provide important insights for further advancements of local stress simulation.
In previous studies, luminescence imaging of Cr3+-doped polycrystalline Al2O3 was performed under near-field excitation with the resolutions of 300–500 nm.22,23) We obtained typical features of grain-dependent luminescence anisotropy as well as a smooth spatial distribution of a stress-induced peak shift. Here, using the obtained luminescence images, we statistically investigate the contribution of grain misorientation to stress. The grain misorientation is evaluated from the deviation of data of the luminescence anisotropy calculated within a certain spatially limited area. We demonstrate the analysis of correlation between two images of the misorientation parameter and peak shift.
2. Luminescence properties of single-crystal and polycrystalline Al2O3
The properties of spectra of near-field excited luminescence from Al2O3 and its spatial images are depicted in Fig. 1.22) The imaging was conducted for a single-crystal α-Al2O3 with a Cr content of 0.17 mass % and polycrystalline α-Al2O3 with a Cr content of 0.7 mass % (average grain size: ∼5 µm). Figure 1(a) shows examples of luminescence spectra coming from the  plane of the single-crystal Al2O3 and polycrystalline Al2O3. The intensity ratio of R1 to R2 lines, IR2/IR1, varies with sample rotation angle. IR2/IR1 reflects the angular relationship between the polarization direction of spectrometer system sensitivity and the crystallographic orientation of Al2O3.17) R-lines have two polarization components, the electric field parallel to the [0001] direction (π polarization) and that perpendicular to the [0001] direction (σ polarization). IR2/IR1 differs between two components, which is responsible for the angular dependence of IR2/IR1 from the [0001] direction. Therefore, the present result [Fig. 1(a)] shows the existence of an angular dependence on the detection sensitivity of the near-field system.
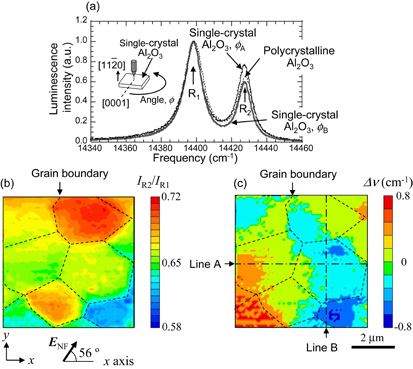
Fig. 1. Luminescence mapping of Al2O3 under near-field excitation: (a) Typical luminescence spectra of single-crystal and polycrystalline Al2O3. The intensities are normalized with maximum intensity, i.e., R1 peak intensity. ϕA and ϕB represent the different sample rotation angles with respect to surface nominal (![$[11\bar{2}0]$](https://content.cld.iop.org/journals/1347-4065/57/6S1/06HF01/revision1/MN17062if001.gif) direction) of single-crystal Al2O3. (b) Spatial distribution of luminescence peak intensity ratio, IR2/IR1, for polycrystalline Al2O3. The broken line corresponds to the grain boundary estimated by the position of subtle surface protrusion (∼60 nm in height) due to thermal etching and detected by surface topography acquired during near-field probe scanning. A higher IR2/IR1 corresponds to the [0001] orientation closer to the near-field polarization direction, ENF. (c) Spatial distribution of luminescence R2 peak frequency shift, Δν, for polycrystalline Al2O3. Δν is a shift from the average R2 peak frequency over the entire mapped area (Ref. 22).
direction) of single-crystal Al2O3. (b) Spatial distribution of luminescence peak intensity ratio, IR2/IR1, for polycrystalline Al2O3. The broken line corresponds to the grain boundary estimated by the position of subtle surface protrusion (∼60 nm in height) due to thermal etching and detected by surface topography acquired during near-field probe scanning. A higher IR2/IR1 corresponds to the [0001] orientation closer to the near-field polarization direction, ENF. (c) Spatial distribution of luminescence R2 peak frequency shift, Δν, for polycrystalline Al2O3. Δν is a shift from the average R2 peak frequency over the entire mapped area (Ref. 22).
Download figure:
Standard image High-resolution imageIndeed, in the image of polycrystalline Al2O3 [Fig. 1(b)], IR2/IR1 varies from grain to grain owing to the heterogeneity of the [0001] direction. The location where IR2/IR1 sharply changes coincides well with the grain boundary. This suggests that the rough tendency of grain anisotropy and resultant misorientation between grains can be detected on the basis of IR2/IR1 using our near-field system. IR2/IR1 is insensitive to the variation of Cr concentration, when compared with the absolute intensities of the R1 and R2 lines.22) The variation of IR2/IR1 values within a grain is ∼0.02 at maximum, which may come from the spatial variation of Cr concentration. This Cr-induced IR2/IR1 variation is smaller than the typical values of grain-anisotropy-induced variation (0.02–0.07) in the present measurement, suggesting that IR2/IR1 is an effective parameter for examining grain anisotropy. For a sample with greater Cr concentration fluctuation, however, a large error of orientation estimation occurs; hence, a systematic investigation of IR2/IR1 for different Cr concentrations is necessary to discriminate between the contributions of Cr concentration and crystal orientation. Since IR2/IR1 correlates with the angle between the near-field polarization, ENF, and the [0001] direction, it is possible to determine the [0001] direction by measuring IR2/IR1 for different ENF fields in more than two directions.
The R2 peak shift distribution is shown in Fig. 1(c). When the luminescence-detected region can be assumed to be an untextured polycrystalline Al2O3, under the plane stress condition, the relationship between the peak shift of R-lines and the stress on the surface is expressed as

where Δν is a shift of R2 peak frequency from its stress free value, which is assumed to be the average peak frequency over the entire mapped area, Πii is the piezospectroscopic constant of polycrystalline Al2O3, and  is the average stress of two in-plane stress components, σ11 and σ22, in the orthogonal coordinate systems on the surface [i.e.,
  ]. The coefficient Πii for the R2 line is Πii = 7.61 cm−1 GPa−1.7)
The luminescence-detected region for the near-field illumination is 300 nm, which is smaller than the average grain size of polycrystalline Al2O3. As a result, the detected luminescence strongly reflects the anisotropy of a single or few grains of Al2O3; therefore, the effect of anisotropy of piezospectroscopic constant should be taken into account when estimating the stress from Δν. However, for convenience, by assuming that the anisotropy of the piezospectroscopic constant is negligible, the variation of  is roughly estimated to be ∼320 MPa using Eq. (1), which is comparable to those derived by stress simulations.27,29,30)
3. Correlation between stress and grain misorientation
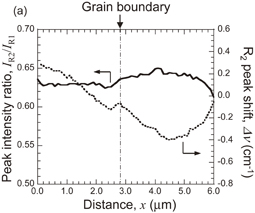
It can be seen that Δν changes sharply at some grain boundaries. Detailed profiles of IR2/IR1 and Δν for lines A and B in Fig. 1(c) are shown in Figs. 2(a) and 2(b), respectively. In the line A, a small difference in IR2/IR1, Δ(IR2/IR1) ∼ 0.01, is found between grains, where the change in Δν is slight, ∼0.05 cm−1. On the other hand, at the grain boundary in line B, IR2/IR1 shows a marked variation of more than Δ(IR2/IR1) = 0.04 and the change in Δν is also large, ∼0.2 cm−1. These results imply that the degree of difference in IR2/IR1 at the grain boundary is related to the magnitude of Δν change, although some exceptional places showing the poor relationship of IR2/IR1 and Δν exist.
Download figure:
Standard image High-resolution image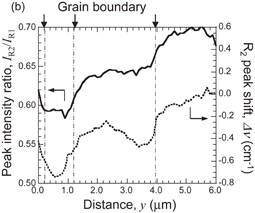
Fig. 2. Profiles of IR2/IR1 and Δν in line A (a) and line B (b) in Fig. 1(c).
Download figure:
Standard image High-resolution imageFrom the viewpoint of the effect of grain anisotropy on stress, we carried out correlation analysis between Δν and IR2/IR1. The stresses concentrated at the boundary between two grains are related to the difference in the thermal expansion coefficient mismatch due to the difference in crystallographic orientation, i.e., misorientation. Near the triple junction of a grain boundary, the magnitude of variation in orientations for three grains has a relevant effect on stress. As a parameter indicating such nature of misorientation, we employ the standard deviation, s, of IR2/IR1 within a certain area of a circle with the radius r given by
where i is the calculation area of s and μ is the average IR2/IR1 inside the area i.
Figure 3 shows a schematic representation of s at different positions. In the area inside the grain (area I), s remains low because of the constant IR2/IR1, whereas s increases when the calculation area includes a grain boundary with a different IR2/IR1 (area II). We evaluate the correlation between s determined in the circle area centered at the position  and Δν at the same position
  . Figure 4 shows Δν–s plots for all elements in the luminescence-detected area in the case of r = 0.5 µm. The normalized s values, 〈s〉, are distributed in the range of ∼0.8. This 〈s〉 varying range is extended, when increasing r, because the IR2/IR1 variation affects s only under the condition that the characteristic length of the spatial fluctuation of IR2/IR1 is equal to or less than r. Therefore, for a smoothly varied IR2/IR1, s is higher for a large r than for a small r. Many of the elements are highly concentrated in the lower 〈s〉 region (〈s〉 ≦ 0.4), because the s circles are more likely to be taken within a grain than in the area including the grain boundary. In the higher 〈s〉 region, the data are concentrated in the higher range of |Δν| (|Δν| ∼ 0.4 cm−1). We classify the Δν groups according to the magnitude of 〈s〉 to assess the Δν histograms, as shown in Fig. 5. In lower 〈s〉 regions, Δν of ∼0 cm−1 accounts for a large fraction of data, indicating that the stress is reduced at the area with less misorientation away from the grain boundary. On the other hand, the area corresponding to Δν of ∼0 cm−1 is explicitly reduced with increase in 〈s〉 and the dispersion of Δν is pronounced. At highest 〈s〉 region [Fig. 5(e)], Δν distribution is eventually split into two peaks corresponding to high tensile and compressive stresses. This tendency is qualitatively consistent with the stress generation in the region at greater misorientation, demonstrating that the stress can be discriminated by 〈s〉.
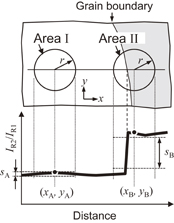
Fig. 3. Schematic representation of difference in grain misorientation. s corresponds to the standard deviation of IR2/IR1 within the area with a radius of r inside the grain (area I) and near the grain boundary (area II).
Download figure:
Standard image High-resolution image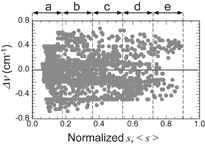
Fig. 4. Δν–s plots for r = 0.5 µm. s is normalized with the maximum s among all data calculated for r = 0.15–1.0 µm.
Download figure:
Standard image High-resolution image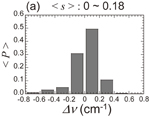
Download figure:
Standard image High-resolution image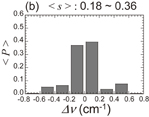
Download figure:
Standard image High-resolution image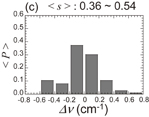
Download figure:
Standard image High-resolution image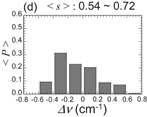
Download figure:
Standard image High-resolution image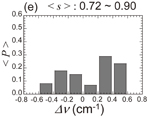
Fig. 5. Histograms of Δν in 5 different sections (a–e) of 〈s〉 for r = 0.5 µm depicted in Fig. 4. The longitudinal axis is the probability density normalized with the number of elements, 〈P〉.
Download figure:
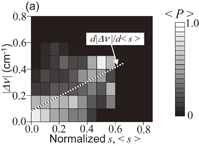
Standard image High-resolution imageThe correlation of |Δν|–〈s〉 is also highlighted clearly in the two-dimensional (2D) histogram of |Δν| and 〈s〉 (Fig. 6). By deducing the modal center by linear least-square regression analysis of the 2D histogram, we determined coefficients as indexes for the magnitude of the correlation: the slope (d|Δν|/d〈s〉), the determination coefficient (R), and the variable range of modal center (δ|Δν|max). Table I shows the 3 coefficients at different r values. All the coefficients increase with the decrease in r and they are maximum at r = 0.15 µm. This parameter r provides the spatial distance from the grain boundary where the effect of grain misorientation on stress is prominent. r is crucially affected by the average grain size of Al2O3 and the spatial resolution of luminescence measurement.
Download figure:
Standard image High-resolution image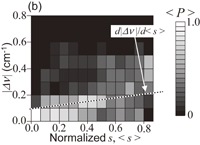
Fig. 6. 2D histogram with respect to |Δν| and 〈s〉 for (a) r = 0.15 µm and (b) r = 0.5 µm. The dotted line is the modal center in |Δν|–〈s〉 space estimated by linear least-square regression.
Download figure:
Standard image High-resolution image
Table I. Slope of the |Δν| and s relationships (d|Δν|/d〈s〉) and coefficients of determination (R) obtained by least-square regression analysis, and the maximum variable range of the modal center (δ|Δν|max).
| r (µm) | d|Δν|/d〈s〉 (cm−1) | R | δ|Δν|max (cm−1) |
|---|---|---|---|
| 0.15 | 0.46 | 0.46 | 0.27 |
| 0.25 | 0.28 | 0.33 | 0.20 |
| 0.50 | 0.23 | 0.35 | 0.19 |
| 1.00 | 0.15 | 0.30 | 0.13 |
In this study, the s calculation is based on the IR2/IR1 variation reflecting the angle difference between the near-field polarization direction ENF and the [0001] orientation of Al2O3. It is expected that the s calculation based on the direct difference in crystallographic orientation between neighboring grains would considerably improve the correlation properties, i.e., increases in d|Δν|max and R. Future works including a more accurate grain orientation analysis by measuring IR2/IR1 at different ENF fields are required for advanced correlation analysis.
4. Conclusions
Despite the wide use of optical spectroscopy as a sensing tool for stress, the crystallographic orientation and crystallinity in ceramics, and their relationships, which are particularly important in a local area, have rarely been examined by this method, owing to its poor spatial resolution or detection sensitivity. In this study, on the basis of the highly resolved images obtained by near-field spectroscopy, we have investigated the relationship between stress and crystallographic orientation by focusing on two characteristics of the luminescence spectra of polycrystalline Al2O3. At the grain boundaries where the mismatch of R-line intensity ratio is large, a large R2 peak shift corresponding to the stress localization is found. By incorporating the concept of the crystal misorientation parameter using the data for intensity ratio, the stressed and unstressed regions are successfully discriminated. The apparent correlation between the magnitude of stress and the misorientation parameter indicates that the grain-anisotropy-induced stresses are successfully detected by our image analysis method combined with near-field luminescence measurement. Our methodology has the further potential applications in local stress analysis of fractured surfaces in ceramics where the crystal structure is damaged.