

Abstract
In thin-film solar cells such as inverted metamorphic multijunction solar cells, a local shunt spot can cause thermal runaway because of low thermal conductivity along the in-plane direction of the junction. Since electrical performance can be greatly reduced by thermal runaway, an appropriate design of the solar cells is necessary to prevent this mechanism. However, quantitative analysis of the thermal runaway is difficult because its threshold is usually strongly affected by the testing conditions and the characteristics of the shunt spots. In this study, we proposed a method of analyzing the thermal runaway characteristics quantitatively. We intentionally induced a thermal runaway under a simulated space environment with an arbitrary artificial shunt spot by a laser beam. The thermal resistance of the shunt spots and the threshold temperature for the thermal runaway were estimated using electrical and thermal models. This method enables an optimized design of thin-film solar cells.
Export citation and abstract BibTeX RIS
1. Introduction
Carrier injection into a solar cell by optical excitation or external bias may lead to the concentration of carriers at a local shunt spot,1) i.e., a local voltage-drop region due to relatively low resistance. Since the electrical resistance of a semiconductor decreases as temperature increases, the number of injected carriers at this spot continues to increase as long as the thermal energy generated by the current and the resistance exceeds the thermal energy that dissipates. Eventually, all photogenerated or injected carriers flow into the spot when the temperature difference between the spot and a peripheral region exceeds a threshold temperature difference (ΔTth). This positive feedback process is called thermal runaway.2–5) The thermal runaway potentially causes the failure of a solar cell if the temperature of a hot spot6–8) exceeds the threshold value for fatal breakdown.9–12) The thermal runaway is especially problematic in vacuum environments such as space, because heat dissipation is significantly lower than that in the atmosphere.13) This has to be considered for the design of solar cell modules for spacecraft.
Thermal runaway caused by carrier injection from an external current source such as other solar cell arrays can be prevented by installing a blocking diode.14) On the other hand, under the open-circuit condition, the photogenerated carriers can transfer to a local shunt spot in the same cell via grid and bar electrodes, and this may also cause thermal runaway. Since thermal runaway due to light absorption in the device cannot be prevented by an external circuit element, it can be suppressed only by a sufficiently high thermal runaway tolerance of the solar cell. In order to improve the thermal runaway tolerance, an appropriate current and heat flow designs of solar cells are important to suppress current concentration and efficiently dissipate the thermal energy to the peripheral region from the spot.
Thermal runaway is usually no issue for conventional InGaP/GaAs/Ge triple-junction space solar cells15–18) under the orbital environment around Earth (solar intensity: 1 sun ∼137 mW/cm2) because the thermal conduction of the Ge substrate, whose thickness is ∼150 µm, is large enough to suppress the thermal runaway. As an exception, it has been reported that thermal runaway caused by light absorption in the device can occur in conventional triple-junction solar cells at high solar intensity.3,4) It has to be emphasized that thin-film solar cells such as inverted metamorphic (IMM) multijunction solar cells19–22) with low thermal conductivity along the in-plane direction (due to the absence of a thick substrate) may have a poor thermal runaway tolerance compared with conventional "thick" multijunction solar cells. Therefore, the quantitative evaluation of the thermal runaway tolerance of solar cells with a thin-film structure is important for space use. However, since the thermal runaway tolerance is strongly affected by not only the testing conditions but also the size, number, resistance, and location of shunt spots, the quantification is generally considered to be difficult.
In this paper, we introduce the ΔTth for thermal runaway as an index of thermal runaway tolerance for quantitative evaluation. ΔTth can quantitatively evaluate the thermal runaway tolerance at specific characteristics of a shunt spot under a certain testing environment since ΔTth includes the effects of these conditions on the thermal runaway tolerance. In addition, we propose a method of analyzing ΔTth for thermal runaway by creating an arbitrary artificial shunt spot under an arbitrary environment. To evaluate the thermal runaway tolerance in a space environment, the experiment was performed under vacuum and low temperature. Furthermore, the size, resistance (or temperature), and location of the artificial shunt spot were controlled using a laser beam. For the quantitative analysis, we employed an electrical equivalent circuit and a thermal network to clarify the ΔTth for thermal runaway. The quantitative analysis helps to improve the current and heat flow designs of thin-film solar cells for space use.
2. Experimental methods
2.1. Solar light irradiation under vacuum and at low temperature
To evaluate the critical solar light intensity for the thermal runaway of thin-film multi-junction solar cells on a solar panel of a spacecraft, a coupon panel was irradiated with simulated solar light under vacuum and at low temperature. We prepared a coupon panel that was equipped with InGaP/GaAs/InGaAs IMM tripe-junction (IMM3J) solar cells in cell-interconnect-coverglass (CIC) assemblies mounted on an aluminum honeycomb panel. The thickness of the IMM3J cell is ∼30 µm. The solar cell array was formed by three IMM3J solar cells connected in series. The test configuration is shown in Fig. 1. The coupon panel was placed in a vacuum chamber with a shroud cooled down to −170 °C and illuminated through a lens by an air mass zero (AM0)23) solar simulator (11 suns at maximum) located outside the chamber.24) The chamber can simulate the dawn environment, which is likely to cause a strong temperature gradient in the cell plane.25) In order to simulate the environment in Earth's orbit, the coupon panel was thermally insulated from the chamber, and was cooled only by radiation. The temperature distribution was observed using a thermo-camera through an infrared-transmitting window, and the absolute temperature of the cell was measured using a thermocouple attached to the coupon panel. The array was kept under open-circuit condition, and the open-circuit voltage (Voc) was monitored. The light intensity of the solar simulator was adjusted with a power meter in the chamber. The panel temperature before light irradiation was −80 °C, and the irradiation duration was 10 min. The results of this experiment are explained in Sect. 3.1.

Download figure:
Standard image High-resolution image
Fig. 1. Experimental setup for the light irradiation test under vacuum and at low temperature. (a) Schematic top view. (b) Photo of inside of the chamber.
Download figure:
Standard image High-resolution image2.2. Solar light and laser beam irradiation under arbitrary condition
The thin-film multijunction solar cells on a solar panel were irradiated with solar light and a laser beam with variable intensity at room temperature under atmosphere and vacuum. Furthermore, to obtain the quantitative ΔTth for the thermal runaway of the solar cells under space environment, the coupon panel was irradiated with solar light and the laser beam under vacuum and low temperature. Because the laser is located outside the chamber, a window with transparency for the laser light was installed in the chamber as indicated in Fig. 1. The solar cell in the center of the array was excited with a laser beam of 532 nm wavelength to create an artificial shunt spot by heat generation. Prior to the laser beam experiment, the location of the laser spot was confirmed by observing the photoluminescence (PL) emission of an InGaP subcell due to the laser excitation. The array was irradiated simultaneously with both the simulated solar light and the laser beam after the panel temperature reached room temperature or −80 °C. The AM0 solar light intensity was fixed at 1 sun and the other conditions were the same as those outlined in Sect. 2.1. The results of this experiment are explained in Sect. 3.2.
3. Results and discussion
3.1. Solar light irradiation under vacuum and at low temperature
Figure 2 indicates the time evolution of the array's Voc when it was exposed to the solar light under vacuum and at low temperature. In general, the Voc decreases as time proceeds, which is assigned to the temperature increase of the solar cells and the panels. The Voc and panel temperature saturated within about 10 min, and we consider that these values represent the steady-state condition. It is interesting to note that under illumination with 1.6 suns, a sharp voltage drop occurred after continuous illumination for about 30 s. Such a characteristic drop indicates a thermal runaway. The Voc dropped by about 1.5 V within a time interval of about 10 s. The start and end of the interval are indicated in Fig. 2 with t1 and t3, respectively. The time t2 indicates a point during the fast drop of the voltage. The corresponding temperature distributions on the cells' surface are shown with the thermo-images in the inset of Fig. 2. The dashed lines indicate the position of the solar cell array. The thermal runaway occurred in the vicinity of the n-side electrode pad, and the temperature reached more than 100 °C. After t3, the shunt current reached its steady-state condition, and it was maintained as long as the intense illumination proceeded. After the cooling of the coupon panel in the dark, the sample recovered and the Voc of the array returned to its normal value (initial values shown with the curves for 0.7 to 1.3 suns) upon irradiation with the solar simulator. Thus, the cell suffered no significant damage caused by the thermal runaway under this condition. In the case of conventional "thick" triple-junction solar cells (∼160 µm), thermal runaway was reported to occur at a light intensity of 6 suns under ambient environment (standard atmosphere and room temperature).3,4) In contrast, our experiment verified that the IMM3J solar cells without a substrate have poor thermal runaway tolerance because thermal runaway occurred already at 1.6 suns under vacuum and at low temperature. However, the observed critical excitation intensity depends on the characteristics of the shunt spot. The thermal runaway may occur in other samples from the same batch even if the light intensity is 1 sun.

Fig. 2. Experimental results for the time evolution of the Voc obtained from the solar cell array upon irradiation with the AM0 solar spectrum. The insets show the thermo-camera images at (a) t1 = 30 s, (b) t2 = 32 s, and (c) t3 = 40 s.
Download figure:
Standard image High-resolution imageThe usual approach for a quantitative evaluation of ΔTth for the thermal runaway of a cell (under a certain solar intensity) requires clarification of the size, number, resistance, and position of shunt spots. However, it is difficult to investigate these characteristics of shunt spots in advance. Actually, we recorded an electroluminescence (EL) image26–28) of the coupon panel under ambient environment prior to the test to locate areas that potentially become shunt spots, but no implications such as bright spots were confirmed at the position where thermal runaway occurred. Since EL is observed under external bias, the electric-field distribution is different from that under solar irradiation.
Therefore, in order to quantitatively evaluate ΔTth for the thermal runaway of a cell, a more sophisticated approach is required. We propose an evaluation method using an arbitrary artificial shunt spot induced by a laser beam, which is discussed in the following section.
3.2. Solar light and laser beam irradiation under arbitrary condition
Figure 3 presents an EL image (injection current of 400 mA) of the solar cell array in the chamber. A filter was chosen to select the EL emitted from the IMM3J solar cells' InGaP layers. The bright spot surrounded by the red broken line indicates PL emission from the InGaP layer due to the laser excitation. The area of the laser spot was about 6 mm2, which is equivalent to the area of the n-side electrode pad where the thermal runaway occurred under solar irradiation with 1.6 suns (shown in Fig. 2). The laser beam was focused at the corner of Cell 2 near the bus bar electrode (see Fig. 3), where heat dissipation should be lesser than in the inside of the cell and current easily concentrates compared with in the region near the finger electrode.
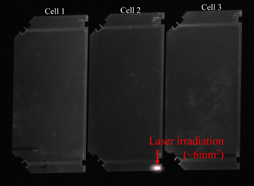
Fig. 3. Top-subcell EL image of the solar cell array in the chamber (standard atmosphere and room temperature, I = 400 mA). The area of the laser-irradiated region is indicated with the red broken line.
Download figure:
Standard image High-resolution imageFigures 4(a)–4(c) provide the transient Voc during the simultaneous excitation with simulated AM0 solar light and the laser beam irradiation under atmosphere at room temperature, under vacuum at room temperature, and under vacuum at low temperature, respectively. The laser intensity absorbed by the cell was calculated from the reflectance of the IMM3J CIC and the measured laser power with a power meter in the chamber. Since the external luminescence efficiency of the EL from the InGaP subcell is about 1%, it can be considered that almost all absorbed laser power is converted to thermal energy. In order to investigate the threshold laser power for thermal runaway, the laser intensity was gradually increased. Considering the smooth changes in Voc obtained for excitations less than 1413 mW under atmosphere at room temperature, 1304 mW under vacuum at room temperature, and 977 mW under vacuum at low temperature, ΔTth was not reached. However, at the laser intensity of 1849 mW under atmosphere at room temperature, 1413 mW under vacuum at room temperature, and 1195 mW under vacuum at low temperature, thermal runaway was observed after continuous laser excitation at about 4, 10, and 12 s, respectively. The final temperature distributions after 600 s of illumination for the laser intensity of 1195 mW under vacuum at low temperature is shown with a thermo-camera image in the inset of Fig. 4(c). The image shows evidence that thermal runaway occurred at the laser irradiation spot. We confirmed that the solar cell suffered no damage by the thermal runaway under this condition. The laser intensity required to induce thermal runaway under vacuum or at low temperature was lower than that under atmosphere or at room temperature. The reasons for the difference of the laser intensity inducing thermal runaway are considered to be as follows heat dissipation in vacuum is significantly lower than that in the atmosphere, and the thermal resistance of solar cells is higher at low temperature than at room temperature. In the following, analysis using the experimental results under vacuum and low temperature, which is the condition in a simulated space environment, is explained.

Fig. 4. Experimental results for the time evolution of the Voc obtained from the array upon simultaneous AM0 light and laser irradiations (a) under atmosphere at room temperature, (b) under vacuum at room temperature, and (c) under vacuum at low temperature. The inset shows the thermo-camera images at t = 600 s for the laser intensity of 1195 mW under vacuum and at low temperature.
Download figure:
Standard image High-resolution image3.3. Electrical equivalent circuit for analysis
The temperatures of the cell and the shunt spot are essential for thermal analysis, but it is difficult to measure the temperature directly. If a thermocouple is attached to the laser spot, the thermocouple itself becomes a thermal path and therefore the thermal characteristics of the shunt spot cannot be evaluated correctly. Also, since the thermo-camera cannot detect temperatures below −20 °C, the temperature of the spot cannot to be evaluated for low excitation powers or short light exposure duration at low temperature. Therefore, in the present work, the temperatures of the cell and the laser irradiated area were calculated from the SPICE29) simulation using the measured Voc, which changes with increasing laser beam irradiation duration.
Figure 5 depicts the equivalent circuit of the array. Cell 2, which was irradiated with the laser beam, is defined with a local shunt spot with an area of 6 mm2. The total area of the IMM3J cell is 27.4 cm2. In addition, a series resistance (Rs) is introduced in Cell 2, to define the current flow from the entire cell to the shunt spot. We choose Rs = 0.5 Ω, which is a typical value of our IMM3J solar cells. The temperature of the cells [Tcell(t)] is assumed to be independent of the laser power. The temperature dependence of the reverse saturation current of the diode in the area excluding the laser spot was obtained from the Voc data recorded for a laser intensity of 170 mW under vacuum and low temperature, which was sufficiently small not to affect Voc. Since the temperature dependence of the optical absorption is known to be negligibly small, the optical generation current was set to be constant at 450 mA. The generation current for the shunt spot was calculated from the area ratio, which results in 1 mA. This current corresponds to that determined by the current-limiting subcell under solar excitation with AM0 1 sun. Using the equivalent circuit, we obtained the temperature [Tspot(t)], inflow current [Ispot(t)] and voltage [Vspot(t)] of the shunt spot by fitting the measured Voc with the reverse saturation current of the shunt spot.

Fig. 5. Electrical equivalent circuit of the array. Cell 2 was irradiated with the laser beam and includes the local shunt spot.
Download figure:
Standard image High-resolution image3.4. Thermal network model for analysis
A thermal network model was constructed by using an analogy between transient heat-flow and electrical networks.30) Figure 6 schematically shows three thermal resistances (Rt_rad, Rt_panel_1, and Rt_cell) around the artificial shunt spot. Rt_rad is the thermal resistance for the heat dissipation via radiation, Rt_panel_1 couples the spot to the aluminum honeycomb panel via the adhesive, and Rt_cell is the thermal resistance along the cell's in-plane direction. Since the heat dissipation under vacuum was negligibly small compared with the heat generation by the laser beam, we assumed Rt_rad to be infinite. The panel temperature under the shunt was unknown, and therefore we defined the thermal network in terms of Tcell. Figure 7 illustrates the thermal network and includes a thermal resistance between the panel and the cell (Rt_panel_2), a thermal capacity (Ct) between the shunt spot and the cell, a voltage source representing temperature, and a current source representing thermal flow. The heat can be dissipated to the panel and to the cell itself by the thermal resistances indicated. The thermal resistance between the shunt spot and the cell is unaffected by the laser beam and can be expressed with a combined thermal resistance,
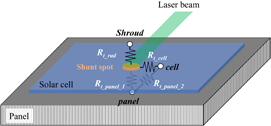
Fig. 6. Schematic thermal network at the shunt spot. The three thermal paths of the shunt spot are those to the cold shroud, to the panel, and along the cell in-plane direction.
Download figure:
Standard image High-resolution image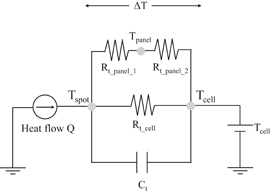
Fig. 7. Thermal network around the shunt spot using the analogy between transient heat-flow and electrical circuits.
Download figure:
Standard image High-resolution imageIn our model, the time dependence of the temperature difference between the shunt spot and the cell area that was not affected by the laser beam [ΔT(t)] can be expressed as

Here, Qlaser and Qcell represent the heat generated by the laser and that generated by the inflow photocurrent from the surrounding cell into the shunt spot, respectively. Qcell is the product of the inflow photocurrent and the voltage of Cell 2 as expressed in Eq. (3). The limit of Eq. (2) can be expressed as

which means that ΔT(t) is determined by the product of the thermal resistance and thermal flow.
3.5. Results of thermal analysis for a shunt spot
Figure 8 shows the calculated Ispot and Vspot (= VCell2) of Cell 2 under vacuum and low temperature obtained from the experimental results and the equivalent circuit shown in Figs. 4(c) and 5, respectively. For the laser irradiation with 759 and 977 mW, the voltage decrease due to laser irradiation is relatively low, and the inflow current into the beam spot is also low. On the other hand, for a strong laser excitation of 1195 mW, the voltage starts to decrease significantly around t = 7 s, and accordingly, the inflow current increases exponentially. At t = 13 s, the total photogeneration current in Cell 2 is concentrated at the shunt spot, and the inflow current saturated.

Fig. 8. Analytical results of inflow current and voltage of Cell 2 under vacuum and at low temperature. The total optical generation current in Cell 2 was concentrated at the shunt spot after continuous laser irradiation for about 13 s.
Download figure:
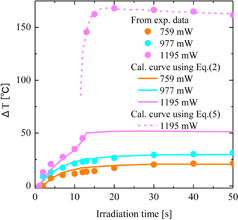
Standard image High-resolution imageFigure 9 plots the temperature difference between the shunt spot and the cell area that was not irradiated under vacuum and low temperature. The closed circles are the calculated data obtained from the measured Voc using the equivalent circuit shown in Fig. 5 and the curves are calculation results based on the thermal network shown in Fig. 7. The solid lines were the calculated results using Eq. (2). From the fitting, we obtained Rt = 22 °C/W and Ct = 0.2 J/°C. Qcell(t) was calculated from Fig. 7 and Eq. (3). ΔT could be fitted well by the thermal model for laser intensities of 759 and 977 mW. However, although ΔT(t) was also fitted well until t = 12 s under laser excitation with 1195 mW, the observed peculiar phenomenon of the rapid temperature increase between t = 13 and 20 s could not be reproduced. The calculated curve shows saturation at around 50 °C because the inflow current into the shunt spot saturates at t = 13 s as shown in Fig. 8, i.e., 50 °C seems to be the upper limit of ΔT(t) for Rt = 22 °C/W. Since Qlaser and Qcell (t > 13 s) were constant, we consider that the rapid temperature increase reflects the change in Rt due to thermal runaway. To include the upper and lower limits of Rt, Eq. (2) is rewritten as
Fig. 9. Analytical results of temperature difference between the shunt spot and the cell area, which is not irradiated by the laser beam under vacuum and at low temperature, are shown with the curves. The closed circles are the calculated temperature data obtained from measured Voc using an equivalent circuit. The solid lines were obtained from Eq. (2) with Rt = 22 °C/W and Ct = 0.2 J/°C. The dashed line was obtained from Eq. (5) with Rt_TR = 120 °C/W and Ct_TR = 0.01 J/°C.
Download figure:
Standard image High-resolution image
Here, Rt_TR and Ct_TR indicate the thermal resistance and capacity after the thermal runaway saturated, respectively. tTR is the continuous illumination duration that is required to initiate thermal runaway. The dashed line in Fig. 9 represents ΔT(t) for Rt_TR and Ct_TR being equal to 120 °C/W and 0.01 J/°C, respectively. The calculated curve agrees well with ΔT(t) obtained from the experiment, and thus we determine the ΔTth of about 50 °C under this experimental condition.
The above analysis clarified that before thermal runaway occurs, the temperature of the shunt spot can be modeled by the steady state analysis using Eq. (2), but after transition into the state with strong current inflow and heating, Eq. (5) is required for accurate description. In other words, thermal runaway is a phenomenon in which the thermal resistance of the shunt spot increases when the spot temperature difference reaches the threshold value. The reason why thermal resistance change is considered that the diameter of the spot where photocurrent flows decreases. It is possible to prevent the thermal runaway when the thermal resistance is designed to be less than the ratio between ΔTth for the shunt spot and the maximum heat generation. Our proposed method helps to identify the ΔTth quantitatively at the arbitrary shunt spot under the simulated space environment, which is applicable to the design of reliable satellite power supply systems.
4. Conclusions
We successfully induced thermal runaway with an arbitrary artificial shunt spot created by laser irradiation under simulated space environment. The temperature of the shunt spot was analyzed by employing electrical and thermal equivalent circuit models. We find that the temperature change of the shunt spot can be explained well by combining two thermal models that consider the upper and lower limits of the thermal resistance of the shunt spot. This means that thermal runaway is a phenomenon in which the thermal resistance of the spot changes, and ΔTth of thermal runaway is the temperature when the thermal models switch. It is possible to completely prevent thermal runaway by designing the thermal resistance to be less than the ratio between ΔTth and the maximum heat generation. By the accurate determination of ΔTth at arbitrary shunt spots under simulated space environment, devices with improved reliability can be designed, which is very important for the space application of thin-film solar cells.
Acknowledgments
We would like to express our sincere thanks to Mr. H. Yamaguchi and Dr. T. Takamoto (SHARP Corporation) for their support in preparing the solar cells, Dr. H. Ogawa (ISAS/JAXA) for his assistance during the irradiation tests, and Messrs. J. Harada and M. Sugai (AES Corporation) for their kind assistance in solar cell characterization.