

Abstract
An atmospheric-pressure line plasma was produced by microwave discharge using a slot antenna with travelling microwave power. Two different types of plasma mode, i.e., "pseudo" and "real" line plasma were investigated using a high-speed camera under different discharge conditions, such as slot gap width and power. Using wide slot gaps (0.5 mm) and low powers (<1.0 kW), the pseudo line plasma mode, i.e., the time-averaged line plasma mode with the fast movement of small plasmas along the slot, was observed. By reducing the slot gap width to 0.1 mm and by increasing the peak microwave power, the plasma mode changed from the pseudo to real line plasma mode, i.e., the spatiotemporally uniform plasma mode along the slot. A gas temperature was obtained from N2 second positive band spectra as low as 400 K. The movement of the plasma in the pseudo line plasma mode was well explained by a one-dimensional diffusion model including the spatial distribution of the ionization rate in a moving plasma.
Export citation and abstract BibTeX RIS
1. Introduction
Recently, much attention has been given to a nonthermal atmospheric-pressure (AP) plasma for the next-generation plasma processing owing to its potential use for inexpensive and simple system configurations without vacuum systems.1) Thus far, various AP plasma sources have been developed using corona discharge,2) dielectric barrier discharge,3,4) or plasma jet,5) aiming at their industrial applications, e.g., surface cleaning or modification. Furthermore, two-dimensional enlargement of these AP plasma sources, with the aim to enhance the process throughput of large-area materials, has been studied by enlarging the plasma source itself or arraying small plasma sources. However, these plasma sources have rather low plasma densities (lower than 1013 cm−3) and tend to be spatially a nonuniform plasma. To apply AP plasma sources to high-throughput processes, for example, high-speed reduction treatment of oxidized substrates6–8) or high-speed plasma-enhanced chemical vapor deposition (PECVD),9–12) not only uniform but also high-density plasma is required.
As an alternative to the above AP plasma sources, the AP microwave plasma produced inside slotted waveguide antennas is attractive because this plasma source can realize nonthermal, stable, and high-density plasmas with densities higher than 1014 cm−3.13–15) However, one issue left to this plasma source is spatial nonuniformity because of the standing wave inside the waveguide.
To solve this, we have recently proposed a newly developed AP microwave plasma source that utilizes not standing waves but travelling waves. By using this plasma source, it has been demonstrated that a spatially uniform one-dimensional AP line plasma of 40 cm length can be realized. In our previous study, we have also found that two types of plasmas appear in a travelling-wave AP microwave plasma depending on the microwave power conditions. At high microwave powers with high-duty cycle pulsed power or cw power conditions, a spatiotemporally uniform "real" line plasma has been realized along the long slot. However, under low duty-cycle pulse conditions, a different type of plasma, i.e., a "pseudo" uniform plasma, has been observed where the fast movement of small plasmas along the slot realizes a time-averaged line plasma.16)
To operate a plasma source under stable conditions, investigation of the plasma behavior and mechanism to understand the plasma movement under the pseudo line plasma condition is indispensable. Moreover, the gas temperature of the plasma is one of the essential parameters from the viewpoint of non-heat-resistant material processing. In this study, we determine the characteristics of the AP microwave line plasma excited by a 2.45 GHz microwave travelling wave. The behavior of the moving plasma, as well as the plasma movement mechanism in the pseudo mode, is investigated under various conditions. Furthermore, the gas temperature of the AP microwave plasma is evaluated by optical emission spectroscopy (OES) measurement of N2 (C–B) rotational temperature.
2. Experimental methods
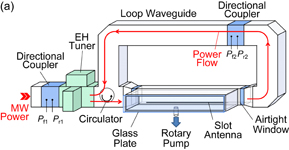
The experimental setup of this study, which has been described elsewhere,16) is shown in Fig. 1 with additional information on the optical measurement setup. As is shown in Fig. 1(a), a loop-waveguide antenna consists of a loop-structured waveguide and a microwave circulator. A pulse-modulated 2.45 GHz microwave source (Nissin MPS-30, pulse frequency, 20 kHz; duty cycle, 20–100%; peak power, 1.0 or 2.0 kW) is connected to the circulator through an EH tuner. A section of the loop waveguide with a long slot (60 cm in length, 0.1–0.7 mm in width, and 1.0 mm in thickness) is vacuum-sealed by two airtight windows and connected to a vacuum chamber evacuated by a rotary pump to ensure gas purity during the experiment. The direction of the microwave power flow through the loop waveguide is determined by the circulator. After passing through the loop waveguide, the microwave power comes back again to the EH tuner through the circulator. The EH tuner reflects the returned power again back to the loop by impedance matching. Thus, the microwave power flow of only the travelling wave is superimposed inside the loop waveguide to suppress energy loss and induce a high electric field in the slot. Figure 1(b) shows a cross-sectional view of the vacuum-sealed part and OES arrangement. After the evacuation, pure helium gas at a flow rate of 5.0 slm is introduced to the gap of the slot antenna through small holes on the waveguide wall facing the slot, filling the chamber and waveguide with helium gas at a pressure of 100 kPa (atmospheric pressure). The pressure inside the chamber and waveguide is monitored by a pressure sensor (Keyence AP-43). An AP microwave line plasma is produced inside the slot gap by applying the microwave power. The enlarged view of the slot in Fig. 1(b) provides a coordinate system: the positive x- and y-axes pointing in the vertical and normal directions to the slot, respectively. The positive z-axis is in a direction from the slot center to the power flow direction along the slot. The plasma behavior around the slot center is monitored by a high-speed camera (Keyence VW-9000) and a high-speed gated ICCD camera (Hamamatsu Photonics C2925-01 and C4347). To determine the gas temperature of the plasma from N2 second positive band spectra, time-averaged emission spectra from the discharge are measured using a spectrometer (Acton Research SpectraPro-500i) with a 1800 line mm−1 grating and an ICCD camera (Princeton Instruments ICCD-576) through a quartz lens of 60 mm focusing length and an optical fiber.
Download figure:
Standard image High-resolution image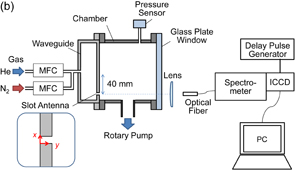
Fig. 1. Schematic of (a) experimental setup and (b) its cross-sectional view and OES arrangement.
Download figure:
Standard image High-resolution image3. Results and discussion
3.1. Gas temperature measurement
As is mentioned, gas temperature is one of the essential parameters of an AP plasma because a high gas temperature sometimes makes the application of the AP plasma to non-heat-resistant materials difficult. To investigate the gas temperature of the plasma source in the present study, N2 (C–B) rotational gas temperature is evaluated by OES17–19) and the gas temperature is obtained supposing that the rotational temperature of the N2 C-state is in equilibrium with the translational gas temperature. In the experiment, a trace of N2 gas (0.5%) is admixed with He gas and the negligibly small influence of the N2 addition on the plasma is confirmed, as shown by the absence of the variation in He emission intensity after the N2 admixture. The solid curve in Fig. 2 shows the measured N2 second positive band spectrum at a slot gap width of 0.5 mm and a duty cycle of 100% (cw mode) with a microwave power of 1.0 kW. The spectral resolution of the spectrometer is obtained to be 1.68 Å by mercury line width measurement using a mercury lamp. Rotational temperature is obtained by simulating the emission spectrum with the measured spectral resolution and fitting the simulated spectrum with the measured N2 spectrum.
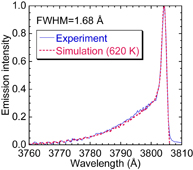
Fig. 2. Example of curve fitting of the N2 second positive band between experimental (solid curve) and simulation (broken curve) spectra.
Download figure:
Standard image High-resolution imageFigure 3 shows the measured gas temperature as a function of the slot gap width in cw microwave power. As is mentioned, the AP microwave plasma utilizing the travelling wave indicates two types of plasma mode depending on the microwave power conditions, i.e., the pseudo line plasma mode with the fast movement of small plasmas along the slot and the real line plasma mode with a spatiotemporally uniform plasma along the slot. In this experiment, the plasma is the pseudo line plasma mode except at a slot gap of 0.1 mm; detailed results will be shown in Sect. 3.2. The gas temperature increases from 400 to 620 K with increasing gap width from 0.1 to 0.7 mm. It should also be noted that the gas temperature is lower than 620 K, which is much lower than those of other microwave plasmas (∼1,000 K),13–15) and that a very low gas temperature of 400 K is realized at a gap of 0.1 mm. This result strongly suggests that this plasma source can be easily applied to non-heat-resistant materials such as polymer thin films or plastic materials. The reason for such a low gas temperature is probably because the present line plasma is realized using power deposition densities ranging from 1.0 to 10 kW/cm−3, which are much lower than those of typical microwave plasmas (∼1 MW/cm−3).13–15) The lower gas temperature at the smaller gap width is presumably partly due to the shorter time for thermal diffusion to the slot metal and also partly due to the increased gas flow speed and shorter gas residence time at a fixed gas flow rate.
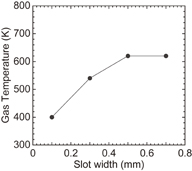
Fig. 3. Gas temperature as a function of the slot gap width in cw microwave power.
Download figure:
Standard image High-resolution image3.2. Plasma behavior
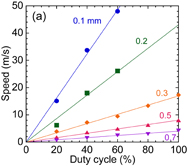
To obtain an insight into the plasma movement mechanism, the movement of the plasmas is observed using the high-speed camera at a frame rate of 6.0 kHz and an exposure time of 50 µs. The average speed of the moving plasma is obtained from the transit time of small plasmas at a distance of 20 cm around the center of a 60-cm-long slot. Figure 4(a) shows average movement speed as a function of duty cycle at various slot gap widths from 0.1 to 0.7 mm. The movement speed increases almost linearly with the duty cycle of the pulsed microwave power with the fixed pulse frequency of 20 kHz. We previously reported that the movement speed always increases linearly with the duty cycle under the fixed pulse on- or off-time condition.20) Considering that the plasma is pulse-operated and the measured speed is the "time-averaged" speed including both the on- and off-time (the 6 kHz frame rate of the high-speed camera is lower than that at 20 kHz pulse frequency), the above results suggest that the plasma moves only during the pulse on-time, because plasma density drastically decreases in a few microseconds during the pulse off-time and it is expected that the subsequent discharge will occur in the same place. From this consideration, the real movement speed during the plasma-on condition can be estimated by extrapolating the duty cycle dependence of the speed to a duty cycle of 100% (cw mode), as shown in the fitted lines in Fig. 4(a). The result shows that the real movement speed drastically increases with decreasing slot gap width. The mechanism of the increase in movement speed with decreasing gap width will be discussed in Sect. 3.4.
Download figure:
Standard image High-resolution image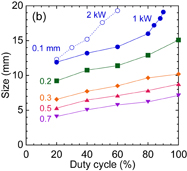
Fig. 4. (a) Plasma movement speed and (b) length of a small plasma as a function of duty cycle under various slot gap width conditions.
Download figure:
Standard image High-resolution imagePlasma size is defined as the length along the slot of the emission region having 10% or more of the maximum emission intensity in high-speed camera photographs. Figure 4(b) shows the plasma size as a function of duty cycle at a peak input power of 1.0 kW with gap widths from 0.1 to 0.7 mm (filled plots with solid curves) and that of 2.0 kW with a gap width of 0.1 mm (open circles with a dotted curve). The plasma size increases with decreasing gap width and also with increasing microwave power or duty cycle. Plasma size increase at a smaller gap width is presumably due to the decrease in the volume of the gap space with decreasing gap width and microwave power can be used to increase the plasma size along the slot. The increase in plasma size with the peak power and duty cycle is qualitatively understood from the increase in average input power. It is notable that, at 0.1 mm gap width, the plasma size increases drastically at high duty cycles (>80% at 1.0 kW power and >60% at 2.0 kW power) and plasma becomes spatially continuous inside the slot, i.e., the plasma mode changes from pseudo line to real line. This result suggests that plasma size and the mode change strongly depend on power area density.
3.3. Measurement of emission intensity profile and electromagnetic simulation
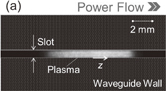
As reported previously, one of the important features of the plasma movement in the pseudo line plasma mode is that the direction of the plasma movement is determined by the direction of the travelling wave.16) The plasma movement direction is reversed when the power flow direction is reversed. To obtain more insights into the movement mechanism of the plasma, plasma emission is observed using a high-speed gated ICCD camera at a gate time of 100 ns so that the influence of plasma movement can be ignored. Figures 5(a) and 5(b) show an image of one small plasma at a duty cycle of 100% (cw mode) with a gap width of 0.5 mm and its emission intensity distribution along the slot, respectively. The emission intensity increases toward the travelling direction of the plasma, which means the downstream region of the microwave power flow along the slot. The spatial variation in emission intensity qualitatively suggests that the plasma parameters such as excitation and ionization rates vary with the position inside the plasma along the slot direction and also suggests that the electromagnetic field varies inside the plasma along the slot direction.
Download figure:
Standard image High-resolution image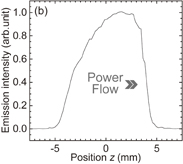
Fig. 5. (a) Photograph of one small plasma and (b) its emission intensity distribution along the slot.
Download figure:
Standard image High-resolution imageTo investigate the electromagnetic field intensity in the slot, three-dimensional microwave simulation is carried out using CST MICROWAVE STUDIO®, which is commercial software based on the finite integration technique for the analysis of high-frequency devices. As a simulation model, a 60 cm slot of 0.5 mm width and 1.0 mm thickness is cut in a waveguide. The input power is fixed at 1.0 W in the simulation software, which is one thousandth of the experimental value. To model the plasma inside the slot, a resistive conductor of 8 mm length is located at the center of the slot. The plasma conductivity σp is described by
where e, n0, and me are the elementary charge, plasma density, and electron mass, respectively. The electron–neutral collision frequency νm is
where
is the mean free path for electron–neutral collision and kB is the Boltzmann constant.21) Assuming that the plasma density, electron temperature, gas temperature, pressure, and collision cross section are n0 ∼ 1014 cm−3, Te ∼ 2 eV, Tg ∼ 620 K, p ∼ 105 Pa (atmospheric pressure), and A ∼ 5 × 10⁻²⁰ m2, respectively, a plasma conductivity of σp ∼ 5 S/m is obtained and used for the simulation. Figure 6 shows the microwave electric field intensity along the slot in the cases of (a) without and (b) with plasma. In the case of without plasma (a), the electric field is almost constant along the slot. In the case of with plasma (b), however, the electric field shows spatial variation inside the plasma, i.e., a higher electric field in the downstream region of the plasma than in the upstream region. Wave reflection occurs at an interface of different permittivity or conductivity materials, and the simulation result can be qualitatively analyzed by perturbation of the electromagnetic field by small reflection waves at the interface as follows. At the interface in the upstream region, a microwave from the left side of Fig. 6 encounters the air-plasma interface as if the slot is short-ended by the plasma conductor, resulting in the slight decrease in the microwave electric field intensity due to a small reflection wave. On the other hand, the plasma-air interface in the downstream region behaves as if it is an open-end, resulting in the slight increase in field intensity. Thus, it is supposed that the reflectivity difference between both plasma edges forms nonuniform fields inside the plasma, and that the resulting spatial variation in the electric field intensity inside the plasma causes the increase in emission intensity at the downstream side of the plasma.
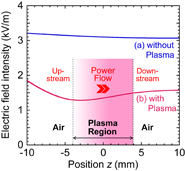
Fig. 6. Simulated intensity profiles of electric field in cases of (a) without and (b) with plasma.
Download figure:
Standard image High-resolution image3.4. Diffusion simulation and discussion
As described previously, the plasma movement direction is determined by the microwave power flow direction, and the speed increases with decreasing slot gap width. Although the plasma movement is determined by the microwave power flow direction, this cannot be explained simply by the one-way travelling microwave because the microwave propagation speed inside the waveguide (108 m/s) is much higher than the plasma movement speed (∼10 m/s). To understand the mechanism of the plasma movement in the pseudo line plasma mode, a plasma diffusion model including the spatially asymmetric ionization property in a moving plasma is numerically simulated and compared with the experimental observation.
Figure 7 shows a schematic of the simulation model geometry, which provides a coordinate system: the positive x- and y-axes pointing in the vertical and normal directions to the slot, respectively. The positive z-axis extends along the slot from the plasma center at t = 0 s. In the model, the microwave power propagation inside the waveguide is parallel to the positive z-axis. Plasma movement is analyzed on the basis of the diffusion equation of the plasma:
where n, Da, and S are the plasma density, ambipolar diffusion coefficient, and reaction rate in the gas phase, respectively.22) To simplify the model, the following assumptions are made:
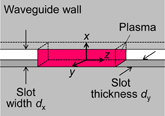
Fig. 7. Schematic of the model geometry for diffusion simulation.
Download figure:
Standard image High-resolution image- 1)
- 2)
- 3)Regarding the gas phase reaction, the following two reactions are considered: the ionization of electron neutral (He+e → He+ → He2+) and recombination of electron ion (He2++e+He → 2He).
- 4)The gas temperature Tg is constant along the slot and varies with slot width as is obtained from Fig. 4. Gas number density is obtained by the ideal gas law ng = p/kBTg, assuming a pressure p of 100 kPa.

On the basis of the above assumptions, Eq. (4) is converted to a one-dimensional form of the z-axis (along the slot direction)
where g0, kre, dx, and dy are the ionization rate, recombination rate, slot width, and thickness (1.0 mm), respectively. The ionization rate is approximately determined to be g0 = 1.23ng cm−3 s−1 from the cross-sectional data27) and electron energy distribution function. The normalized spatial distribution of the ionization rate  is estimated from the spatial profile of the emission intensity shown in Fig. 5(b). The recombination rate kre = 2.16 × 10⁻³¹Tg is estimated from Ref. 27. The model equation is solved numerically by the finite-difference method28) (time step, δt = 10−8 s; mesh size, δz = 0.02 mm).
Figure 8 shows the simulation result of the temporal variation in plasma movement in the case of a 0.3 mm gap. It is observed that the plasma moves toward the +z-axis at a constant velocity. Figure 9 shows the simulated and experimental results of movement speed as a function of gap width indicated by circle and square plots, respectively. A similar tendency of decreasing movement speed with decreasing gap width is observed both in the experiment and simulation. A slight difference in the slope of the curves between the simulation and the experiment is probably due to the simulation being oversimplified compared with real experimental conditions such as electron temperature, spatial distribution of ionization rate, and gas temperature. Nevertheless, the simulation roughly reproduces the experimental result and suggests that the mechanism of the moving plasma is a balance between the generation and diffusion of the plasma under asymmetric ionization in a moving plasma.
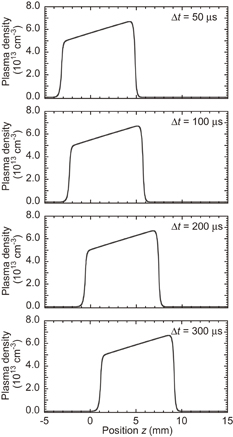
Fig. 8. Simulation result of temporal variation in plasma movement in the case of 0.3 mm gap.
Download figure:
Standard image High-resolution image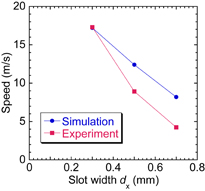
Fig. 9. Simulated and experimental results of the movement speed as a function of the gap width.
Download figure:
Standard image High-resolution image
4. Conclusions
An AP line plasma was produced by pulsed microwave discharge in helium gas using the slot antenna of a loop-waveguide plasma source at various gap widths. The low gas temperatures from 400 to 620 K were measured by N2 second positive band OES in the slot gap width range from 0.1 to 0.7 mm, suggesting that this plasma source can be easily applied to non-heat-resistant materials. The plasma looked spatially continuous along the slot in time average, but was discrete in a wide gap (>0.2 mm) at a low duty cycle (pseudo line plasma mode). In a 0.1 mm gap width, plasma speed and size increased at a high duty cycle (>80%) and the plasma became spatially continuous inside the slot (real line plasma mode). In the pseudo line plasma mode, a spatial variation in emission intensity inside a small plasma was observed. Assuming that ionization rate increased toward the travelling direction, the results of a one-dimensional diffusion simulation well explained the experimental observations of a moving plasma.
Acknowledgment
This work was supported by a JSPS Grant-in-Aid for Scientific Research (B) 25286079.