

Abstract
The aging effect near the critical endpoint in 70.5%Pb(Mg1/3Nb2/3)O3–29.5%PbTiO3 (PMN–29.5%PT) has been investigated, through the measurement of DC field dependence of the permittivity. A delay of the permittivity peak due to the aging effect when changing the DC biasing field has been found, depending on the sweep speed of the DC biasing field. We have also found that the delay almost disappears in the sweep time longer than 100 h. The aging effect found in our experiment for PMN–29.5%PT has been discussed on the basis of the phenomenological theory taking account the delay of the polarization.
Export citation and abstract BibTeX RIS
1. Introduction
(1–x)Pb(Mg1/3Nb2/3)O3–xPbTiO3 (PMN–xPT) being the perovskite-type ferroelectric solid solution is an actual material used in the industry as piezoelectric devices because of their giant dielectric and piezoelectric responses near the morphotropic phase boundary (MPB) located at x = 30%.1–3) Regarding MPB, it was proposed that the origin of such giant responses is essentially due to the transversal instability on the basis of the Landau–Devonshire free energy density, where the transversal instability is defined as an instability in the polarization perpendicular to the spontaneous polarization. Due to the transversal instability, the dielectric permittivity perpendicular to the spontaneous polarization becomes extremely large because the anisotropic energy in the polarization decreases near MPB.4,5) This indicates that such giant responses in PMN–PT evidently originate from the bulk property near MPB.
Kutnjak et al. found the critical endpoint (CEP) on the temperature-field phase diagram in PMN–xPT.6) CEPs in PMN–xPT and the isomorphous compound (1–x)Pb(Zn1/3Nb2/3)O3–xPbTiO3 (PZN–xPT) were investigated in details,7–12) and the understanding of CEP in such materials was established. Furthermore, we observed the double hysteresis loop indicating the field induced transition between the paraelectric and induced ferroelectric phases above the ferroelectric transition temperature in PZN—9%PT.13) From these results, we claimed that, applying a DC electric field and reducing the heterogeneous structure of the polarization, relaxors can be understood as one of the normal ferroelectric materials on the basis of the Landau theory.11)
On the other hand, solid solutions in relaxors and classical ferroelectrics, typified by PMN–xPT and PZN–xPT, so called the relaxor ferroelectrics, attracted much attention because of their unique physical properties such as a diffuse phase transition.14–18) Such diffuse phase transition in relaxor ferroelectrics was proposed to come from the heterogeneous structure, where a lot of small ferroelectric domains, so called polar nanoregions (PNRs), were assumed to exist in the paraelectric matrix.19,20) In fact, PNRs in PMN and PMN–xPT were observed by means of the transmission electron microscopy21) and the piezoelectric force microscopy.22,23) To explain such diffuse phase transitions in relaxors, many theoretical models were proposed. The superparaelectric model, which is analogous to the superparamagnetic model, was suggested by assuming a thermal fluctuation of the flipping motion of the spontaneous polarization in PNRs.20) A random field model wherein a random field is assumed to induce PNRs was proposed by Westphal et al.24) The spherical random-bond-random field (SRBRF) model was discussed by considering both random interactions and random fields.25) Note that the appearance of the dipolar-glass phase in relaxors is theoretically predicted in the superparaelectric26) and SRBRF models.25)
To examine the appearance of the dipolar-glass transition in relaxors, the measurement of the third-order nonlinear dielectric susceptibility ε3 can be applicable, because ε3 is theoretically predicted to show a negative divergence at the dipolar-glass transition temperature.25) Here, ε3 is defined as a coefficient of the polarization induced in proportion to the cube of the electric field. In some relaxor ferroelectrics, however, ε3 was reported to be positive without any indication of divergence near the temperature Tm at which the linear permittivity is maximum,27–30) indicating that there is a contradiction between the theoretical models and the experimental results. It seems that existing theories based on the dipolar-glass transition cannot explain experimental results reported in relaxors. Therefore, we point out that alternative theory to interpret the relaxor behavior is required.
Fujishiro et al. found a slow dynamic process in relaxor PMN, where the formation process of long range order of the polarization in PMN takes a very long time more than 1 d.31,32) It can be conjectured that the diffuse phase transition in relaxors is strongly correlated to such slow dynamics. From this viewpoint, clarifying the slow dynamics or the aging effect may give important clues for interpreting the mechanism of the diffuse phase transition in relaxors. Furthermore, in BaTiO3 but not a relaxor, an aging effect in polarizations pinned by crowds of oxygen defects was found.33) The problem of the aging effect seems to be important not only for relaxors but also for common oxide ferroelectrics. Under this circumstance, we have investigated the aging effect near CEP in PMN–29.5%PT, and have discussed the aging effect on the basis of the phenomenological theory taking account of the delay of the polarization.
2. Experimental method
Single crystals of PMN—29.5%PT solid solution were grown by the Bridgman technique.34) Sample plates perpendicular to the [001] direction in the cubic coordinate were prepared. Capacitance sample plates with Au electrodes deposited on their faces were prepared for measuring the permittivity.
Measurements of the dielectric permittivity with the DC biasing field were carried out using an impedance/gain phase analyzer (NF ZGA5900), where an AC electric field to measure the dielectric permittivity is about 0.5 V, and the maximum value of the DC biasing voltage to the sample during the measurement is 800 V.35) Complex dielectric permittivities were obtained at 41 frequencies in the range from 100 Hz to 1 MHz.
In our previous paper,10) we reported the temperature-field phase diagram under the DC electric field along the [001] direction in PMN–29.5%PT (see Fig. 1), where CEP exists at 141 °C and 1.2 kV cm−1. In this study, the aging effect near CEP in PMN—29.5%PT was investigated through our measurement of DC field dependence of the permittivity.

Fig. 1 Temperature-field phase diagram in PMN-29.5%PT, where the electric field is applied along the [001] direction in the cubic coordinate.10) Open and filled circles indicate transition temperatures measured on heating and cooling, respectively. The letters C, T, R, MA, and CEP indicate the cubic, tetragonal, rhombohedral, monoclinic, and critical endpoint, respectively, and the letters in the bracket means the rigorous symmetry including the induced polarization in the electric field. The critical endpoint is found at 1.2 kV cm−1 and 141 °C.
Download figure:
Standard image High-resolution image3. Experimental result
In the present study, we investigated the delay effect of the permittivity in a slowly varying the DC electric field above the critical temperature. Note that non-essential delay, such as the polarization reversal and the phase transition, can be avoided above the critical temperature. The electric field with the triangular wave function was applied to the (001) plate sample in PMN–29.5%PT, where the amplitude of the field is 2 kV cm−1, and the cycle T is from 0.6 to 91.2 h. Figures 2(a)–2(c) show field dependence of the permittivity at 143 °C above the critical temperature, where frequency of the probe field is 1 kHz. The interval time t1 (=T/2) of one way process from −2 to 2 kV cm−1 or vice versa is (a) 0.3, (b) 2.9, and (c) 45.6 h. The broad peaks of the permittivity indicate the vestiges of the critical anomaly in the supercritical region. It is found that a delay of the peaks between the field increasing and decreasing processes appears in Fig. 2(a), and such a delay decreases with increasing the interval time t1 as shown in Figs. 2(b) and 2(c).
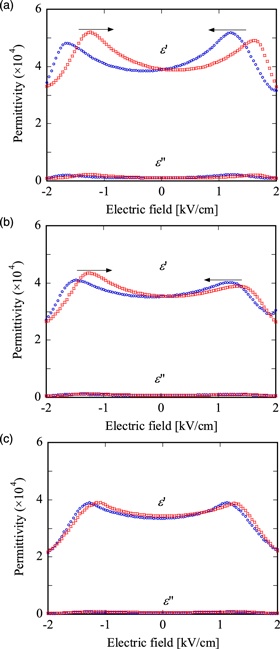
Fig. 2. (Color online) Field dependence of the permittivity at 143 °C above the critical temperature, where frequency of the probe field is 1 kHz. Open circles and squares indicate the permittivity measured on the field increasing and decreasing processes, respectively. The interval time of one way process form −2 to 2 kV cm−1 or vice versa is (a) 0.3, (b) 2.9, and (c) 45.6 h.
Download figure:
Standard image High-resolution imageThe DC field showing the maximum value of the permittivity as a function of the interval time t1 is shown in Fig. 3, where the dotted lines indicate the eye guide. It is seen that the delay at 143 °C in PMN—29.5%PT decreases as the speed of the field change becomes slow, and the delay almost disappears in the interval time t1 more than 100 h.
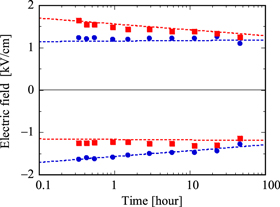
Fig. 3. (Color online) Time dependence of the field showing the maximum value in permittivity, where the interval time is defined as a time of one way process. The dotted lines indicate eye guide.
Download figure:
Standard image High-resolution image4. Discussion
In our study, we have found the aging effect in PMN—29.5% PT experimentally, through the measurement of DC field dependence of the permittivity. In this section, we discuss the aging effect obtained in our experiment for relaxor ferroelectrics. In the field of metallurgy, it is known that the aging effect in metals exhibiting the martensitic phase transition often appears. Ohta proposed the phenomenological model for the aging effect with respect to the martensitic phase transition in metals,36) where the order-parameter of the martensitic phase transition is coupled with a variable which follows the change of the order-parameter remarkably late.
We consider the Ohta-type free energy36) for relaxor ferroelectrics with the delay of the polarization, assuming the homogeneous system without any domain wall structures for simplicity. The free energy can be written as

where p and q are the usual and the delayed responsive polarizations, respectively, E is the external electric field, α is a function of temperature T as α = a(T − T0), a > 0, T0 > 0, β < 0, γ > 0 and g > 0. Note that β < 0 means the first-order phase transition. When a sufficiently long time to reach the thermal equilibrium is passed, gq becomes equal to p, and then the contribution of the term of h disappears in the free energy of Eq. (1). The equations of motion for p and q, known as the Khalatnikov equation, can be written as

where t is the time, ηp and ηq are the viscosity coefficients for p and q, respectively. Note that ηq ≫ ηp is assumed, since the delay effect due to the slow dynamics for q is discussed.
Because the permittivity at 1 kHz was measured in out experiment, which is almost regard as a static one, we consider the static dielectric permittivity ε in the slowly changing DC field. Therefore, we take ∂p/∂t = 0, and the upper equation of Eq. (2) is rewritten as

The lower one of Eq. (2) is reduced as

where τq = ηq/(hg2) is the relaxation time of q. Equation (4) known as an inhomogeneous differential equation can be analytically solved for q(t), if the explicit function p(t) is obtained. The general solution of Eq. (4) is obtained to be
where q0 is determined by the initial condition, i.e. q0 = q(t = 0). Note that the general solution obtained in Eq. (5), in the present case, cannot be used as it is, because the explicit function p(t) cannot be obtained from Eq. (3).
Since a triangular shaped electric field is applied to the sample in our experiment, we take the periodic function of the electric field E(t) with the cycle T (=2t1) as
Assuming the periodic condition with the cycle 2t1, q0 can be determined as
The static permittivity as a function of time t is also written as
Let us solve p(t) and q(t) with the simultaneous equation of Eqs. (3) and (4). We must consider the numerical solution of them, since this simultaneous equation cannot be solved analytically. Therefore, we tried to obtain the numerical solution with a successive iteration method between Eqs. (3) and (5). Figures 4(a) to 4(c) show the calculations of field dependences of the permittivity, where the parameters scaled are adopted as α = 1, β = –1, γ = 1, h = 0.2, g = 1, ηq = 0.02 (τq = 0.1), and the scaled interval time t1 is (a) 3, (b) 5, and (c) 10. Note that the dimensionless quantities scaled are shown on the vertical and horizontal axes.37) It is seen that the delay of the peak in the permittivity depending on the scan speed can be qualitatively well reproduced within the phenomenological theory taking account of the delay of the polarization q. The numerical result of the peak field as a function of t1 is shown in Fig. 5. The t1 dependence of the peak field is also found to be reproduced qualitatively.

Fig. 4. (Color online) Calculations of field dependence of the permittivity. The dimensionless quantities scaled are shown on the vertical and horizontal axes.37) The scaled parameters are adopted as α = 1, β = –1, γ = 1, h = 0.2, g = 1, and ηq = 0.02 (τq = 0.1). The scaled interval time of one way process is (a) 3, (b) 5, and (c) 10.
Download figure:
Standard image High-resolution image
Fig. 5. (Color online) Calculation of time dependence of the field showing the maximum value in permittivity, where the interval time t1 is defined as a time of one way process. The dimensionless quantities scaled are shown on the vertical and horizontal axes.37)
Download figure:
Standard image High-resolution image
From the quantitative viewpoint, however, it seems that there is a discrepancy in the delay time between our experimental result (Fig. 3) and the calculation (Fig. 5), where our experimental result shows an attenuation process over three digits, whereas our calculation displays the relaxation within a digit. This implies that the experimental result shows a relaxation process with a distribution of the relaxation time over many orders of magnitude, unlike the calculation assuming a single relaxation time. Furthermore, if such a polarization q is induced by crowds of defects as proposed by Ren et al.,33) q is reminded of the polarization of PNRs in relaxors, and existence of a spatial distribution of the relaxation time in PNRs is expected. If the distribution of τq is clarified, the present model taking account of the aging effect may be able to reproduce the diffuse phase transition in relaxor ferroelectrics, as a new model to replace existing models of relaxors.
5. Conclusion
In the present study, it has been experimentally found that PMN—29.5%PT near the CEP shows a slow dynamic process, and we have investigated time dependence of the permittivity under the slowly changing DC biasing field. A delay of the permittivity peak due to the delay effect when changing the DC biasing field has been found, depending on the sweep speed of the DC biasing field. The delay has been found to disappear in the sweep time longer than 100 h.
To explain the aging effect found in our experiment, the phenomenological theory has been discussed, where the polarization is coupled with a variable which follows the change of the order-parameter remarkably late. Our experimental results showing the aging effect can be well reproduced qualitatively. The experimental investigation of the distribution of relaxation time in PMN—29.5%PT is now in progress.
Acknowledgments
The authors would like to thank NF Corporation for fabricating the DC bias probe for ZGA5900 to measure the dielectric permittivity. This work was supported in part by JSPS KAKENHI Grant No. JP16K13820 to MI.