

Abstract
We suggest a novel technique for the evaluation of the recombination coefficients corresponding to Shockley–Read–Hall, radiative, and Auger recombination that occur in InGaN/GaN-based light-emitting diodes (LEDs). This technique combines the measurement of the LED efficiency as a function of LED drive current with a small-signal time-resolved photoluminescence measurement of the differential carrier life time (DLT). Using the relationships between the efficiency and DLT following from the empirical ABC-model, one can evaluate all three recombination coefficients. The suggested technique is applied to a number of single- and multiple-quantum well LEDs to gain a deeper insight into the mechanisms ultimately limiting their efficiency.
Export citation and abstract BibTeX RIS
1. Introduction
While InGaN-based quantum well (QW) light emitting diodes (LEDs) can be considered a mature technology in the blue spectral region, they suffer from the "Droop", i.e., the reduction of efficiency with increasing drive current,1,2) which has been discussed widely in literature and has been attributed to Auger recombination3–5) experimentally. In addition, an extension of the emission wavelength into the "Green Gap"1,6) has proven to be challenging. The origins of both phenomena are continuously debated and their detailed understanding requires deeper insight into the dominating loss mechanisms. For this purpose, the determination of the recombination coefficients corresponding to the principal channels, i.e., Shockley–Read–Hall (SRH), radiative, and Auger recombination is of utmost importance. Naturally, also a detailed analysis of their dependences on the LED structure design, InGaN composition, and temperature is quite desirable. First studies carried out in this direction7–10) have reported on the recombination coefficients considered in terms of the commonly used ABC-model2,11) and obtained by measuring the differential carrier lifetime (DLT) of non-equilibrium carriers by modulation of the LED operating current. Unfortunately, the recombination coefficients reported in the above studies poorly correlate with each other, which can be partly attributed to different experimental setups and to difficulties in the data interpretation for time-resolved current-modulation experiments (see Sect. 3.3).
In this paper, we suggest a novel technique for the determination of the recombination coefficients combining both, electrical and optical excitation of the LED active region. Our technique has certain advantages if compared to previously applied experimental approaches, since it avoids transient modifications of the LED band diagram, which interfere with the DLT measurements.
2. Theory
The so-called ABC-model is commonly used for interpreting the LED efficiency dependence upon variation of the operating current.2,11) In this model, assuming an injection efficiency of 100% (i.e., in the absence of electron and hole leakage from the active region), the external quantum efficiency (EQE) of an LED is given by

where n is the non-equilibrium carrier density assumed to be equal for electrons and holes, η is the light extraction efficiency, and A, B, and C are the SRH, radiative, and Auger recombination coefficients, respectively. Since EQE is usually derived from electroluminescence (EL) as a function of injection current, the number of degrees of freedom in Eq. (2.1) is too large for a meaningful determination of the recombination coefficients from the EL data.
The number of variables can be substantially reduced, if the equation is rewritten in terms of the normalized optical output power p, being the ratio between the LED output power Pout and the power Pm corresponding to EQEmax, the maximum of the measured EQE. In this case,

Here, Q = B/(AC)1/2 is the so-called quality factor11) which is a dimensionless combination of the recombination coefficients relevant to the maximum value of internal quantum efficiency IQEmax = EQEmax/η = Q/(Q + 2). It is important that both values, EQEmax and Pm, can be derived directly from the measured EQE dependence on the LED operating current.
In order to evaluate Q, the EQE does not need to be measured in absolute units (e.g., in an Ulbricht sphere), which simplifies the measurements considerably. One can consider the ratio EQEmax/EQE depending on the normalized optical power p:

which allows finding the Q-factor and, hence, the IQEmax value.12) Additionally, the light extraction efficiency η could be obtained from EQEmax/IQEmax, if the EQE measurement was performed in absolute units instead.
In addition to the quality factor Q, the parameter Pm can also be expressed in terms of the recombination parameters: Pm = EphηVrAB/C, where Eph is the energy of photons averaged over the LED emission spectrum and Vr is the recombination volume, which is the product of the active region area S and the effective active region width d. As Pm and Eph are known from the EL measurements, η is evaluated by the procedure discussed above, and Vr is estimated from structural parameters. Therefore, the combination of the recombination coefficients AB/C = Pm/(EphηVr) can also be found from the EL data.
The above two combinations are insufficient for the unambiguous determination of the recombination coefficients. However, their determination becomes possible, if the measured DLT of non-equilibrium carriers is additionally involved. Starting from the rate equation for the unsteady carrier density N = n + δn(t)
and considering δn(t) to be a small perturbation of the steady-state carrier density n, one can show that the perturbation decays mono-exponentially with the DLT τ = (A + 2Bn + 3Cn2)−1. In terms of the normalized optical power p the DLT can be expressed by
Equation (2.5) shows that the measurement of the DLT corresponding to a certain steady-state non-equilibrium carrier density n (equivalent to a certain p) enables the direct evaluation of the SRH recombination coefficient A.
With Q and A known, the coefficients B and C could be calculated, assuming that the active volume Vr is known. Generally this is not the case, because of the uncertainty in the estimation of the effective active region width d for multiple quantum wells11) (MQW). Hence, we will use the corresponding sheet parameters: B2D = B/d and C2D = C/d2 instead. For the sheet recombination coefficients, the quality factor has the same form: Q = B2D/(AC2D)1/2. Another combination of the recombination coefficients, AB2D/C2D = Pm/(EphηS) is now dependent on the active region area S which can be estimated unambiguously and is nearly equal to the LED chip area. Using both expressions, one can express the coefficients B2D and C2D via coefficient A and other experimentally determined parameters as follows:
Here, q is the elementary charge and Imax the LED operating current corresponding to EQEmax, which is also found from the EL data without requiring any measurement in absolute units.
3. Experimental procedure
As described above, only two spectroscopic measurements are necessary in order to obtain the recombination coefficients. Firstly, an EL measurement as a function of drive current in arbitrary units and secondly, one, preferably more, differential lifetime measurement(s) within this current range.
3.1. Samples
A number of state-of-the-art LED structures was grown by metalorganic vapor phase epitaxy on c-plane sapphire substrates in order to test the presented method. The active regions of the structures consist of one, three, or five InGaN QWs with a nominal thickness of 3 nm sandwiched between GaN barriers. Standard Mg-doped p-GaN, AlGaN electron blocking layers, and Si-doped n-GaN ensure commonality with production devices. The emission wavelength of the samples is around 440 nm. Several LEDs in the commercial Golden Dragon+ package were produced from each wafer without epoxy casting, providing easy access for optical pumping.
3.2. Electroluminescence
In order to measure the EQE of the LEDs as a function of operating current and to obtain the respective Q-factors, the samples were mounted on a temperature-controlled heating element. The temperature of 350 K, resembling common operating conditions of LEDs, was confirmed to be large enough to avoid additional internal heating under variation of the LED operating current up to 500 mA. The LEDs were driven by a DC source over several orders of magnitude of injection currents and the EL was dispersed onto a Princeton Instruments charge-coupled device by a 30 cm SpectraPro monochromator. The resulting spectra were integrated in order to obtain the total EL intensity as a function of drive current. As a result the EQE as a function of optical output power can be derived.
3.3. Differential carrier lifetime
In literature, several methods exist to measure the DLT in electrically driven semiconductor heterostructures. For vertical cavity surface emitting lasers13) and edge emitting laser diodes14) a common method is to apply an AC-modulated DC bias to the device under test and to measure the impedance as a function of modulation frequency. Using a simplified model replacing the device region by an equivalent circuit consisting of series and p–n junction resistances, a capacitor, and a coil, one can then extract the differential carrier lifetimes from the measured capacitance of the device. While this method works well in some cases of semiconductor laser diodes made of conventional III–V compounds, its application to III–nitride LEDs is questionable. Indeed, AC modulation of the LED bias produces an electric current that is consumed not only for increasing carrier concentration in the active region but also for modulation of space-charge region widths. The DLT of non-equilibrium carriers can only be reliably extracted from the device capacitance, if the contribution of the space-charge regions to the capacitance is much less than that of the active region. The latter condition is satisfied in some laser diodes made of conventional III–V compounds. However, that is not the case for III–nitride LEDs for the following reasons. First, the conduction and valence band offsets in InGaN/GaN structures are much larger compared to other semiconductors, which produces extended space-charge regions beyond the active region. Second, polarization charges accumulated at the LED structure's interfaces provide a considerable contribution to the device capacitance via formation of two-dimensional electron and hole gases. Simulations of the capacitances of typical LED structures carried out with the modified simulator SiLENSe 5.215) have shown that the capacitance originating from the space-charge regions dominates at low currents and becomes comparable with that of the LED active region at high currents. Therefore, the use of such AC-bias modulation techniques for the DLT evaluation in III–nitride LEDs may introduce considerable inaccuracies to the measurement results.
3.4. Small-signal time-resolved photoluminescence
To avoid the above mentioned uncertainty in DLT measurements, we optically injected the additional carriers into the QWs. To achieve a resonant excitation of the InGaN QWs exclusively, a frequency doubled Ti:sapphire laser tuned to 400 nm was used. The small-signal time-resolved photoluminescence (SSTRPL) experiment consisted of a variable DC bias (tuned within the current range of the previous EL measurement) and a pulsed optical excitation (80 MHz repetition rate with a pulse length of around 2 ps). The samples were mounted and heated as described in Sect. 3.2. The combined PL and EL signal was dispersed by the same monochromator and detected with a Hamamatsu multi-channel plate photo-multiplier (S20 cathode). The recorded photon counts were evaluated with a Becker&Hickl time-correlated single photon counting (TCSPC) card. The time-resolution of this setup (50 ps) is well below all obtained lifetimes.
In order to ensure that all requirements for a differential lifetime measurement (δn ≪ n) are fulfilled, the excitation power density of the laser was varied such that the contribution of the laser-induced PL is much smaller than the current-induced EL (<5%). It was verified that the variation of this ratio does not change the measured lifetimes. Because the vast majority of recorded photon counts are due to electrical injection and therefore not time-correlated with the laser pulses, long integration times of several hours are necessary to acquire enough signal. In addition great care is necessary to extract the underlying mono-exponential decay. For this purpose we have recorded the system response to uncorrelated EL signals, giving a reference response which is used to filter out artefacts that naturally occur in TCSPC electronics towards the edges of the time window, as the collection process is not time-symmetric.
The corrected transient decay traces finally consist of three components: The constant EL background, the dynamic PL decay, and additional contributions to the PL decay of previous pulses, if the injected carriers do not completely decay within the time window given by the laser repetition rate. Please note that in conventional TRPL experiments such residual carrier densities at the end of the time window should be avoided, because generally the decay times will vary as a function of excitation power density and hence will also vary as a function of residual carrier density. In the present specific case, however, such non-equilibrium effects can be neglected, as the optical excitation is always low enough that the carrier density is not altered significantly. A second reason to avoid carrier build-up in conventional TRPL is that it results in a rising baseline, which reduces the dynamic of the signal and can ultimately hinder its evaluation. For the case of SSTRPL measurements, the dynamic range is very limited in any recorded transient, due to the constant EL background. In addition the nature of the decay is known to be mono-exponential [Eq. (2.5)]. It would suffice to treat the residual carrier population as a small part of the constant, current-induced carrier density, but in order to assure that this carrier build-up does not endanger the conditions for a differential measurement we will include its effect in the fitting procedure as a small correction to the optical output power associated with the drive current.
3.5. Evaluation
The EL measurement is used in two ways. First, it proves that the sample under investigation can be treated by the ABC-model and that the currents applied in the DLT measurement do not cause significant internal heating, which would otherwise result in a reduction of the efficiency observed at high currents. Second, as described in Sect. 2, the measurement allows to determine the dimensionless quality factor Q. Figure 1 shows the result of this evaluation for a single quantum well LED at a temperature of 350 K. Applying Eq. (2.3) yields a quality factor of 4 corresponding to a peak IQE of 67%. With this Q-factor, the ABC-model reproduces the LED efficiency behaviour over the entire current range.
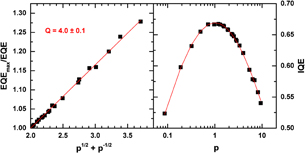
Fig. 1. Left: EQEmax/EQE ratio as a function of p1/2 + p−1/2 for a single quantum well LED at a temperature 350 K. Squared symbols are obtained by EL, while the solid line (red) is the linear approximation demonstrating, in particular, that the obtained data conform to the ABC-model.12) Right: the implied IQE as a function of normalized optical output power for the same device. Squared symbols depict the data extracted from the EL measurements, while the solid line (red) illustrated the fitting with Eq. (2.3). The dimensionless quality factor Q = 4.0 ± 0.1 corresponds to a peak IQE of 67% at a current of 34 mA.
Download figure:
Standard image High-resolution imageIn order to determine the entire set of recombination coefficients of the ABC-model, SSTRPL measurements at various drive currents above the current of peak efficiency were performed. This choice has been made on the basis of signal-to-noise ratio requirements, but generally the measurement can be performed at any current, which is approved by previous EL measurements to be within the ABC-model envelope. Once the raw SSTRPL transient decays have been treated in the manner described in Sect. 3.4, they can be fitted by a mono-exponential decay as detailed in Sect. 2. Generally, if I0 is the peak intensity of a mono-exponential decay, the transient decay should have the form  , where τ is the decay constant. In order to account for the remaining carriers from the previous excitation pulses, which are separated by the repetition time T from each other, this equation becomes
Adding the constant EL background originating from the current injection leads to the final expression for the SSTRPL fitting function:
which is used to determine the DLT (τ). Figure 2 (right) shows an exemplary transient decay recorded for a SQW at a temperature of 350 K with an injection current of 148 mA, fitted with Eq. (3.1). While in principle such a measurement allows the extraction of the recombination coefficient A, the accuracy of the estimate can be improved significantly by varying the drive current and repeating this measurement. This leads to the dependence depicted by data points in Fig. 2 (left). The solid line is a fit of these data points according to Eq. (2.5) and yields a SRH recombination coefficient of A = (4.46 ± 0.04) × 106 s−1.
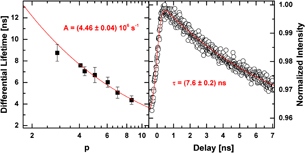
Fig. 2. Left: Differential carrier lifetime as a function of normalized optical output power. The solid line represents a fit according to Eq. (2.5), yielding the SRH recombination coefficient A = (4.46 ± 0.04) × 106 s−1. Right: Acquired small-signal time-resolved photoluminescence transient decay for one of the single quantum well samples. The measurement was performed at 350 K with a drive current of 148 mA. The data points are corrected for the system response to a cw-signal and normalized. The dynamic in the PL signal is around 3% of the total signal, showing that the measurement was performed well within the differential regime. In this example, the extracted differential carrier lifetime is τ = (7.6 ± 0.2) ns.
Download figure:
Standard image High-resolution imageIf, as it is the case here, the current at which the device efficiency is maximal (Imax) and the active area S is known, the sheet recombination coefficients B2D and C2D can now be evaluated using Eq. (2.6). This yields the values B2D = (2.31 ± 0.04) × 10−5 cm−2 s−1 and C2D = (7.3 ± 0.2) × 10−18 cm−4 s−1, which are well comparable to values found in literature.10)
4. Results
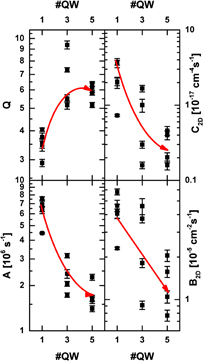
We have performed the measurements lined out in the previous section for various samples with one, three and five QWs in the active region, respectively. The results are summarized in Fig. 3, where multiple data points with the same number of QWs correspond to different chips manufactured from the same wafer. In particular, the quality factor (top left) increases drastically if the active region consists of multiple QWs. This is mirrored by a significant decrease in the A coefficient (bottom left). Both, Q-factor and A coefficient do not vary strongly if structures with three and five QWs are compared. In contrast, both the B and C sheet coefficients decrease continuously. We note that for a single QW with a nominal thickness of 3 nm the corresponding bulk coefficients B and C are of the order 10−11 cm−3 s−1 and 10−30 cm−6 s−1, respectively. While the sheet coefficients decrease with increased number of QWs, the corresponding bulk coefficients (assuming a nominally linearly increasing active volume) increase.
Fig. 3. From top left counter-clockwise: quality factor (Q), SRH-recombination coefficient (A), sheet radiative recombination coefficient (B2D) and Auger recombination coefficient (C2D) for various LED devices as a function of the number of QWs. The determination of the parameters is described in Sect. 3.5. Multiple points at the same number of QWs correspond to different LED chips fabricated from the same wafer. Red arrows are guides to the eye.
Download figure:
Standard image High-resolution image
5. Discussion
We note that the scatter of the obtained values for nominally identical chips is rather large. This is especially notable, because individual chips were not only taken from the same wafer, but also from adjacent positions. Such large scatter is not uncommon10) and suggests a relatively large inhomogeneity in the material. The emission spectrum however, is basically identical. Therefore the large difference in recombination properties arises from local differences in microscopic properties (e.g., point defect density, threading dislocation density) from chip to chip, rather than from more global properties such as QW composition and thickness, which may vary across the wafer and would cause varying EL spectra. This material inhomogeneity may originate from non-optimal growth-conditions of the LED structures studied here, which is also suggested by the relatively low quality factors compared to commercial blue LEDs, which show up to Q = 8 at 350 K.12)
The reduction of the SRH recombination parameter with QW number (M) is consistent with the assumption that all devices contain one highly defective QW16) and M − 1 less defective QWs with a defect density ratio of approximately  . The QW with a higher defect density is most likely the top-most QW, which suffers from an increased point defect incorporation due to Mg back diffusion during p-GaN growth.16)
The fact that the radiative and Auger sheet recombination coefficients do not scale with M−1 and M−2 respectively, strongly suggests that the effective active region width does not increase linearly with the number of QWs. Therefore not all of the QWs are efficiently pumped by the applied bias.17–19) As a result, any further addition of QWs does neither increase the quality factor (Fig. 3) nor shift the maximum of efficiency to higher currents. In this particular case, increasing the number of QWs beyond three has no positive effects on the overall efficiency of the LED.
6. Conclusion
We have demonstrated a novel technique that allows to directly measure the recombination coefficients corresponding to SRH, radiative, and Auger recombination in InGaN/GaN (multi) QW LEDs. This is achieved without requiring EQE measurements in absolute units and relies on the novel small-signal time-resolved photoluminescence (SSTRPL) approach. We have tested this method on a large quantity of SQW and MQW devices, where the determination of the recombination coefficients allows to pin the reduction in efficiency in SQW devices on an increased point defect density. In addition the lack of efficiency improvement from three to five QWs is shown to be caused by inhomogeneous pumping of the QWs. The suggested technique can be used for all devices (and in all operating regimes), which conform to the standard ABC-model. Therefore, SSTRPL will enable a deeper understanding of the underlying physical processes that limit device efficiency, providing a promising tool to analyse device shortcomings in the green spectral region.
Acknowledgment
We gratefully acknowledge the financial support of the European Union FP7-ICT Project NEWLED, No. FP7-318388, and the German Science Foundation within the Collaborative Research Center 787 (CRC 787).