

Abstract
An atom-based sensor is used to retrieve baseband signals modulated onto a microwave carrier. The 60S1/2 level of cesium atoms in a vapor cell is optically probed via electromagnetically induced transparency. A 16.98-GHz carrier is resonant with the 60S1/2 → 60P1/2 transition, resulting in an Autler–Townes (AT) splitting. Amplitude modulation (AM) results in a variation of the AT splitting, which is processed to retrieve the AM baseband signals. The optically retrieved signal has a fidelity of >95%. We demonstrate a baseband bandwidth of the receiver of about 60 kHz and a dynamic range of about 30 dB.
Export citation and abstract BibTeX RIS
Communication technologies play an ever increasing role in social life, science and defense, and are continuously being developed further. Typically, communication is based on modulation/demodulation of a baseband signal onto an electromagnetic carrier wave via amplitude (AM) or frequency modulation (FM) for analog communication and phase or frequency shift keying modulation for digital communication. For instance, in AM and FM radio broadcasting the carrier frequency ranges from hundreds of kHz to several hundred MHz. The radio-wave receiving unit typically includes an antenna and a demodulation circuit. A recent surge in the development of quantum technologies for atom-based field detection will naturally lead to novel atom-based receiver components that are specialized for communications tasks. Atom-based sensors for electromagnetic fields have been explored for classical communication.1)
Rydberg atoms, highly excited atoms with principal quantum numbers n ≫ 1, can be used to create sensitive electric-field sensors, due to their large polarizabilities (∼n7) and microwave (MW)-transition dipole moments (∼n2).2) Rydberg-atom-based field metrology can achieve SI traceability and potentially calibration-free operation3,4) because of the invariant nature of atomic properties. Rydberg electromagnetically-induced transparency (Rydberg-EIT)5) in vapor cells has been employed to measure the properties of electric fields over a wide frequency range from 100 MHz6–8) to over 1 THz,9) including measurements of MW fields,10,11) polarizations12) and their phase,13) millimeter waves14,15) and subwavelength imaging of MW electric-field distributions.16,17) Small Rydberg-atom field sensors that employ μm-length vapor cells and hollow-core fibers18) offer significant potential for miniaturization. Recently, Rydberg atoms have also been explored as sensitive, high bandwidth, atomic receivers for digital communication.19,20) Rydberg-atom-based field detectors can have a higher sensitivity than detectors with traditional dipole antennas,21) making them suitable for long-distance communication with potential for high-speed parallel operation.22)
In this work, we study a sensor for MW communication based on Rydberg atoms in a room temperature (RT) cell, which can enable real-time and direct readout of information encoded onto a high-frequency carrier. In our experimental demonstration, we encode a baseband signal with a bandwidth up into the 60 kHz range on a 16.98 GHz MW carrier via amplitude. The high-frequency carrier resonantly interacts with the cesium 60S1/2 → 60P1/2 Rydberg transition, and the encoded information is recovered by employing the Rydberg electromagnetically-induced transparency and the Autler–Townes effect (Rydberg-EIT-AT). This constitutes a sensor and receiver element for MW communication with a carrier frequency in the tens of GHz range. Extension to carrier frequencies in the hundreds of MHz to 1 THz range is straightforward.
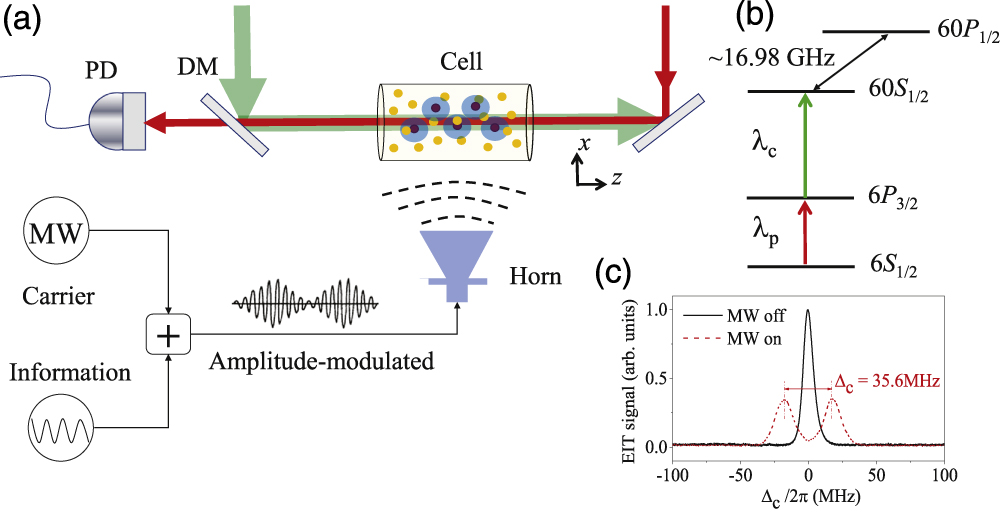
In Figs. 1(a) and 1(b) we show a schematic of the experimental setup and the relevant four-level system. The experiments are performed in an RT cesium vapor cell. A 852 nm (λp) probe laser, aligned along the centerline of the cesium cell, interacts resonantly with the lower transition,  . The probe beam has a waist w0 = 105 μm, and the probe transition a Rabi frequency Ωp = 2π × 12.3 MHz. A 510 nm (λc) coupling beam is overlapped and counter-propagated with the probe beam, and is scanned through the Rydberg transition
  . The coupling beam has a waist w0 = 150 μm, and the coupling transition Rabi frequency Ωc = 2π × 2.45 MHz. The power of the probe beam passing through the cell is detected with a photodiode (PD) and recorded with an oscilloscope as a function of coupling detuning Δc.
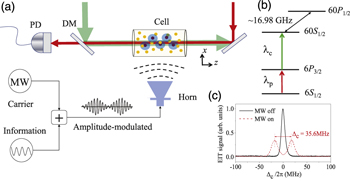
Fig. 1. (Color online) (a) Schematic of the experimental setup. Coupling and probe beams, with respective wavelengths λc and λp, counter-propagate through and overlap within a cesium vapor cell. Probe beam is passed through the cell and a dichroic mirror (DM), and is detected with a PD. MW field has a carrier frequency of 16.98 GHz and is amplitude-modulated with a low-frequency baseband signal. Modulated MW signal is fed into a horn antenna and radiated onto the atoms in the cell, which receives the signal. Laser and MW electric fields have the same polarization, transverse to the drawing plane. (b) Four-level Rydberg-EIT scheme. MW field is (near-)resonant with the 60S1/2 → 60P1/2 Rydberg transition. Resultant AT splitting is measured and used as a real-time, optical readout for the modulation signal. (c) Samples of measured EIT spectra with MW off (black solid line) and on (red dashed line) versus coupling-laser detuning, Δc. In the displayed on-resonant case, the AT splitting observed with the MW on, fAT, approximately equals the Rabi frequency of the MW transition, ΩMW.
Download figure:
Standard image High-resolution imageThe MW field, generated with a signal generator (Keysight N5183) and emitted from a horn antenna, is applied transversely to the laser beams propagating through the vapor cell, where it interacts with cesium receiver Rydberg atoms. The MW has a frequency near 16.98 GHz and drives the 60S1/2-60P1/2 Rydberg transition with an on-resonance Rabi frequency ΩMW. The MW causes an AT splitting in the Rydberg-EIT spectra, as illustrated in Fig. 1(c) for one case. Analysis of the Rydberg-EIT-AT spectra reveals the value of  , which is proportional to the MW electric field. Hence, this spectroscopic method affords an all-optical readout of the time-dependent field strength. In the present work, analysis of Rydberg-EIT-AT spectra is employed as a real-time optical readout of baseband signals that are amplitude-modulated onto MW carriers.
In our initial demonstration, the signal to be transmitted is a signal function  with a signal frequency ωs and modulation amplitude kAM. Denoting the carrier frequency ωc and the fixed (unmodulated) field amplitude Ec, the modulated MW field impinging onto the atoms in the vapor cell is
  .
.
The modulated field amplitude,  , is proportional to the signal function mAM(t) to be transmitted. On the receiver end, the Ecm(t) is measured by rapid acquisition and analysis of Rydberg-EIT-AT spectra. Denoting the measured slowly-varying AT splitting by fAT, we retrieve Ecm(t) using the relation
  , where ℏ is Planck's constant and ℘ is the atomic dipole moment of the MW transition. For Ecm(t) to approximately hold, the carrier frequency must be resonant with the desired Rydberg transition (here 60S1/2-60P1/2), and other conditions apply. Also, to recover the signal function mAM(t) in real time, the spectrum acquisition time must be much shorter than 2π/ωs.
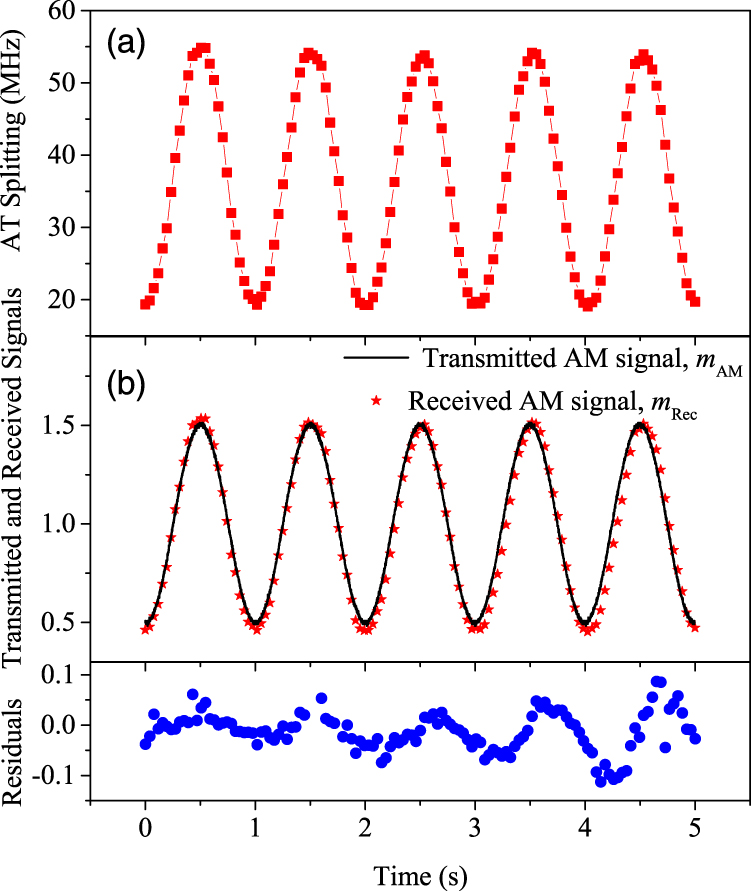
In Fig. 2(a), we show the measured AT splitting, fAT(t), which yields the MW field amplitude Ecm(t). For a modulation-free carrier, the splitting fAT is fixed, and it yields the modulation-free carrier field, Ec, according to the equation given in the previous paragraph. For the case in Fig. 2(a), we have Ec = 2.25 V m−1 (The transmission with carrier fields can be as low as 0.4 V m–1, not shown here, and it can be lower if we couple two Rydberg states with larger MW-transition dipole moments). When the modulation is applied, the sinusoidal oscillation of the detected MW field normalized by the carrier field,  , directly reproduces the applied modulation function mAM(t), as shown in Fig. 2(b). We determine the residuals between the transmitted and received signals,
  , to be ≲5% of the average transmitted signal, see the bottom panel of Fig. 2, corresponding to a fidelity of the recovered signal of ≳95%.

Fig. 2. (Color online) AM results for sinusoidal modulation. (a) Measurement of the AT splitting, fAT(t). (b) Comparison between the AM function applied to the MW generator, mAM(t) (transmitted baseband signal; black line), and the corresponding received signal, mRec = Ecm(t)/Ec (stars), which is derived from the spectroscopically acquired AT splitting shown in (a). For the case shown, ωs = 2π × 1 Hz, Ec = 2.25 V m−1 and  . Bottom panel shows the residuals (RMS value 0.04) between the measurements and the expected (transmitted) signal.
Download figure:
Standard image High-resolution imageFor the case of sinusoidal modulations, data as shown in Fig. 2 allow rapid retrieval of the modulation frequency, ωs, and the modulation amplitude. For instance, in Fig. 2, the minima and maxima of the retrieved Ecm(t) are  and
and  , yielding a reading for the modulation amplitude of the transmitted and received signals, mAM(t) and mRec(t), of
  , which is kAM = 0.50 in Fig. 2.
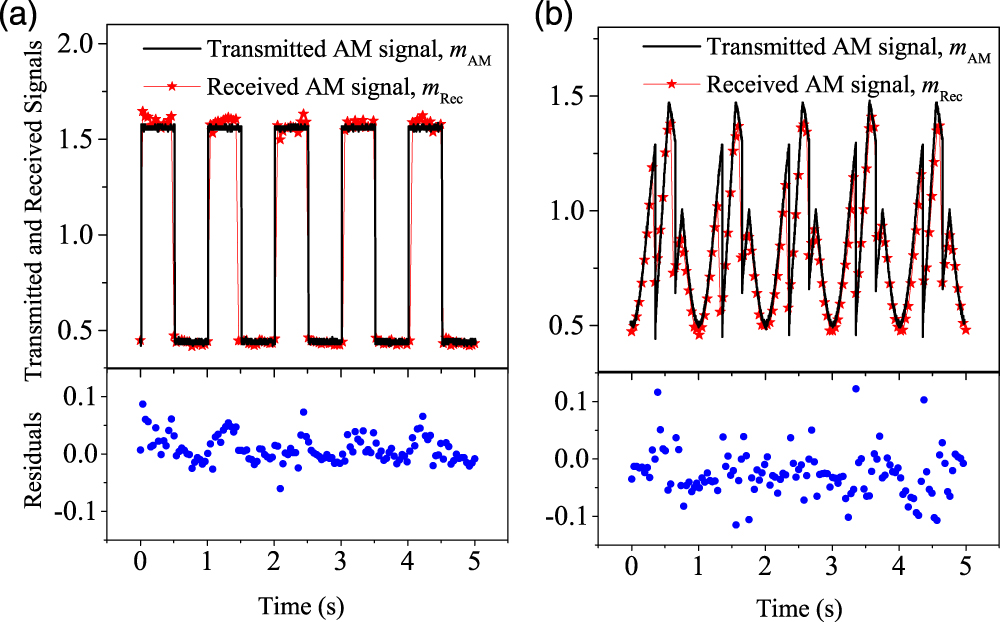
To determine the time resolution and transmission bandwidth of the method, we have tested the reception of square and structure-rich random AM functions mAM(t) with the same repetition rate of 1 Hz, but with a much higher signal bandwidth (because of the sharp features in the functions). Figure 3 shows that the transmitted and received modulation functions are still in good agreement in both cases. From the lag and the deviations seen at the steps, we estimate a transmission bandwidth in the baseband of ∼20 Hz, for the cases shown.

Fig. 3. (Color online) Measurements similar to Fig. 2, for square (a) and complex (b) baseband modulations, with respective residuals in the bottom panels. RMS deviations are 0.03 and 0.05, respectively.
Download figure:
Standard image High-resolution imageThe data presented above were acquired using a built-in function of an oscilloscope that allowed us to plot the AT splitting as a function of time. While this method is convenient, it is limited in acquisition and processing rate to about 30 Hz. In the following, we explore the bandwidth and dynamic range of the atom-based receiver that could be achieved using sufficiently fast data readout electronics and processing algorithms.
To retrieve the baseband signal at a high sampling rate, several critical time scales must be taken into account. The most basic one is given by the time scale at which EIT readout signal approaches steady-state upon change of a parameter (which could be the RF or amplitude, the coupling laser frequency, etc). This time scale, which can be about 1 μs, is based on the atomic-physics and quantum-optics principles of the EIT readout.23) There are also technical limitations, the most obvious ones being the PD and transimpedance amplifier bandwidths. Here, we use a Thorlabs PDA36A-EC detector at about 1 MHz bandwidth, which is compatible with the achievable EIT bandwidth. The most limiting time scale is the rate at which an EIT-AT spectrum can be acquired, and how fast the splitting between the AT peaks in this spectrum can be determined. The first is related to the data sampling rate of the data acquisition (DAQ) equipment used, and the second to the computer hardware and algorithms employed. For a reasonable estimate one may assume a DAQ sampling rate of ∼10MSs−1, and a record length of the spectra of 500 points, i.e. the acquisition time for one spectrum is 50 μs. This is sufficiently long so that an efficient peak finder algorithm can determine the AT peak spitting and the RF electric field amplitude Ecm(ti), at the sampling time ti, while the next EIT-AT spectrum for the field  , at the sampling time
  , is being acquired. Hence, the baseband waveform Ecm(t) can be sampled at a rate of 20 kSs−1, corresponding to a baseband bandwidth (demodulation bandwidth) of 10 kHz. The actually achieved 3 dB suppression bandwidth will be somewhat higher. Also, the bandwidth can be increased further by reducing the record length from 500 to a smaller number that may suffice to determine the AT peak splitting. Finally, the fundamental EIT response time can be improved by varying the optical EIT parameters, including the coupling Rabi frequency. The DAQ sampling rate, assumed to be ∼10 MSs−1 above, can be easily increased. Therefore, we anticipate demodulation bandwidths in the 10 kHz–100 kHz regime. In the following, we demonstrate that this can, indeed, be achieved.
To measure the potential baseband bandwidth, with the equipment at hand, we current-modulate the coupling laser frequency at a rate of fc, over a range that is wide enough to capture both AT-split peaks in the EIT spectrum at the highest Ecm(t) used. The RF signal is amplitude-modulated sinusoidally with a modulation frequency ωs/(2π) = fc + 1 Hz. The EIT-AT spectra acquired with the oscilloscope then exhibit AT peaks whose splittings sinusoidally vary at a rate given by the beat (difference) frequency, which is 1 Hz in our case. This is slow enough for the oscilloscope's built-in math function to generate a record of Ecm versus time. This experimental procedure allows us to measure  and
and  for modulation frequencies up to 100 kHz, and to quantify the frequency response of the receiver unit up to 100 kHz.
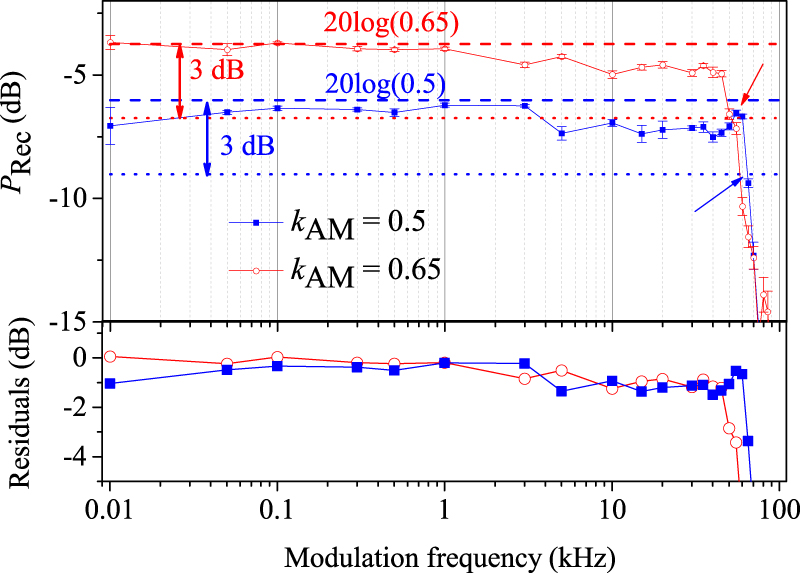
In the upper panel of Fig. 4, we present measurements of the retrieved baseband-signal power PRec, defined as PRec = 20 log(kRec), with AM amplitude kRec derived from the measured  and
and  , as a function of the modulation frequency. We perform measurements for two values of the modulation amplitude of the transmitted signal, kAM = 0.65 and 0.5. The horizontal dashed lines in Fig. 4 at −3.7 and −6.0 dB show the ideal received signals, 20 log(kAM), for modulation amplitudes kAM = 0.65 and 0.5, respectively. The thin dashed lines are 3 dB below and are used to determine the frequencies at which the received signal is suppressed by 3 dB. The 3 dB compression frequencies are found to be about 60 kHz for kAM = 0.65 and 65 kHz for kAM = 0.5, and are indicated by arrows in the figure. For further comparison, we also display the residuals between the ideally expected values of PRec and the measurements in the lower panel of Fig. 4.

Fig. 4. (Color online) Top: Retrieved baseband power, PRec, as a function of the modulation frequencies for AM amplitude kAM = 0.5 (blue squares) and 0.65 (red hollow circles). Thick horizontal dashed lines at −3.7 and −6.0 dB display the ideal readout of the baseband signal, corresponding to PRec = 20 log(0.65) and PRec = 20 log(0.5), respectively. Error bar denotes the fitting error. Thin-dashed lines indicate the 3 dB compression values. Bottom: residuals between measurements and ideal PRec.
Download figure:
Standard image High-resolution imageIn Fig. 5, we show the received baseband power, PRec = 20 log(kRec), as a function of the transmitted baseband power PAM = 20 log(kAM), for three modulation frequencies in the audio band, 440 Hz (corresponding to the tone a'), 880 Hz and 1.76 kHz. It can be seen that the reception becomes noisy at power levels below about −32 dB, and it saturates above −2 dB. Between these limits the received power tracks the transmitted power very well; the dynamic range of the receiver therefore is about 30 dB. Comparing our work with Ref. 19, where a digital data rate near 10 Mbit s–1 is reached, the objective of our present work is to transmit an analog signal in the audio range, where the merit relies in a combination of baseband bandwidth and dynamic range. In our work, we have presented an RF receiver with a large dynamic range (30 dB), suitable to demodulate analog audio signals with a bandwidth of 60 kHz. Our work has commonalities with the work in Ref. 24, where analog communication is studied as well. Our demodulation method is different to the work in24) in that the entire EIT-AT spectrum is acquired. This may, in the future, enable a greater dynamic range. Also, the baseband bandwidth may approach the fundamental EIT limit (about 1 MHz) using faster signal acquisition hardware.

Fig. 5. (Color online) Top: Received baseband power, PRec, versus the input power, PAM, for modulation frequencies 440 Hz (black squares), 880 Hz (red circles) and 1.76 kHz (green triangles). Blue dashed line displays the ideal curve for PRec versus PAM. Error bars denote the fitting errors. Two vertical lines delineate the 30 dB dynamic range of the receiver. Bottom: residuals between measurements and ideal PRec.
Download figure:
Standard image High-resolution image
In conclusion, we have successfully demonstrated an all-optical direct readout of a baseband signal that is AM-modulated onto a 16.98 GHz carrier. The reception bandwidth for the baseband signal is ∼60 kHz and the linear dynamic range is ∼30 dB. The method may complement traditional communications techniques with features unique to atom-based field detection. The signal recovery from the atom-based spectroscopic data does not require an electronic demodulation process. The range of carrier frequencies that can, in principle, be employed is quite vast. This is because strong electric-dipole transitions between conveniently accessible Rydberg levels span a frequency range from ≲1 GHz up to ∼1 THz. Our work is expected to lead to further research towards the development of atom-based sensors and receivers in broadband atom-based MW communications.
Acknowledgments
The work was supported by the National Key R&D Program of China (Grant No. 2017YFA0304203), the National Natural Science Foundation of China (Grant Nos. 61475090, 61675123, 61775124, 11804202), the Changjiang Scholars and Innovative Research Team in University of Ministry of Education of China (Grant No. IRT13076), the Key Program of the National Natural Science Foundation of China (Grant Nos. 61835007, 11434007) and the Shanxi 1331 Project Key Subjects Construction. GR acknowledges support of the NSF (PHY-1506093).