
Abstract
With the increase in the brilliance of synchrotron radiation sources, diffraction techniques have grown and expanded the scientific field of application. Surface X-ray diffraction (SXRD) is one of the state-of-the-art techniques to determine the constellations of atoms on crystal surfaces including adsorbates, thin films, and relaxed layers. We briefly overview SXRD and review the recent advances over decades from both experimental and theoretical viewpoints, including fast observations and imaging surface atoms.
Export citation and abstract BibTeX RIS
1. Introduction
The research on low-dimensional physics has been accelerated by the recent rapid progress in the manipulation of nanometer-scale structures on crystal surfaces, where two-dimensional well-ordered structures can be obtained. A surface forms various structures; experimentally, more than 300 phases are known to have formed, even in the ordered structures of a crystal silicon surface including an adsorbed system with low Miller indices.1) Approximately 1400 experimentally determined surface structures can be referred from the NIST database.2) An atomic constellation is strongly related to its electronic structures, and surfaces exhibit intrinsic physical and chemical properties that are different from those of crystals owing to their low dimensionality. Therefore, understanding the atomic structure of a surface is a starting point for tailoring novel surface materials that meet our requirements and for understanding surface functions such as catalytic reactions.3)
For more than half a century since X-rays were first extracted from accelerator-based sources, i.e. synchrotron radiation (SR) sources, we have observed an enhancement of nearly 20 orders of magnitude in X-ray peak brilliance,4) and further 10 orders higher in X-ray free electron laser (XFEL). Figure 1 shows the brilliance trend of accelerator-based X-ray sources for decades.5) With the increase in brilliance, surface X-ray diffraction (SXRD)6–10) has grown and expanded the scientific field of application. X-ray diffraction, as well as electron diffraction, has been utilized for decades to analyze the structures of surfaces and interfaces after brilliant synchrotron sources became available, overcoming the drawback of weak interactions of X-rays with matter and making X-ray diffraction surface sensitive.
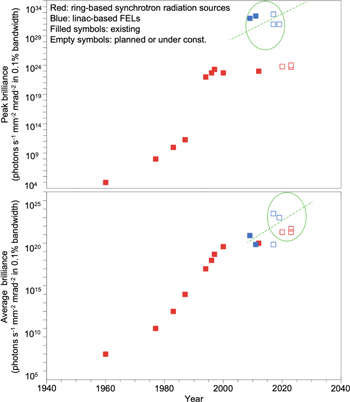
Fig. 1. (Color online) Evolution of peak and average brilliances of synchrotron radiation sources and XFEL sources in the hard X-ray region (photon energy 10 keV). Red filled squares, synchrotron radiation sources in operation or those that have closed down; red open squares, synchrotron radiation sources under construction or that are planned; blue filled squares, XFEL sources in operation; blue open squares, XFEL sources under construction or that are planned. The green dashed lines are guides to the eye. The green ovals are relevant to light sources that are featured in the literature.5)
Download figure:
Standard image High-resolution imageSXRD has several advantages such as the ability to perform non-destructive measurements in various environments, which include not only vacuum–solid interfaces but also solid–solid, gas–solid, and liquid–solid interfaces, by making use of the property that X-ray interactions with matter is small. In addition, SXRD can be simply interpreted using the kinematical diffraction theory, whereas electron diffraction data should be analyzed using the dynamical diffraction theory, which is more complicated. Accordingly, SXRD provides roughly 10 times more precise information on an atomic arrangement than electron diffraction. Reliability is another great advantage of using SXRD. However, the conventional method measuring a rocking curve by using a diffractometer and point detector is time consuming. This situation resembles that of low-energy electron diffraction (LEED) in the 1960s; the development of SXRD based on a completely different technical scheme has been eagerly awaited. Recently, some unique, time-effective, and high-precision diffraction techniques for ordered surfaces and interface structures were developed.
The electron density in a crystal is related to the Fourier transform of the complex amplitudes of diffracted X-rays. However, we cannot observe this wave field directly because of the high frequency of X-rays of approximately 1018 Hz or more and can observe only the diffraction intensities without phases. This fact has given rise to the fundamental issue in X-ray crystallography, namely the well-known "phase problem". Therefore, we cannot obtain the charge density distribution in a straightforward manner from the inverse Fourier transform of the observed data. In a three-dimensionally periodic structure, i.e. a crystal, direct methods11,12) are most commonly used to overcome the phase problem. These methods derive phase information of observed reflections from the correlation properties between the complex amplitudes of diffracted X-rays.
There exist difficulties in analyzing a complex surface structure, which will reveal novel physical properties, although SXRD has the advantage that an analysis can be performed using the kinematical diffraction scheme. Recently, studies on direct imaging of surface atoms from X-ray diffraction intensity alone and crystallographic direct methods, which do not need any initial structure model, are becoming increasingly available.
In this review, we explain structure determination using SXRD through various conventional measurement techniques and analytical methods as well as the current development trend of methodologies in realizing precise and time-effective measurements. In addition, we introduce recent activities related to the phase problem in surface X-ray crystallography. The main contents are based on those described in the Japanese review in 2009.13) We provide detailed descriptions to reflect the methodological advances that have taken place over a decade.
2. X-ray diffraction for surface structures
2.1. Historical overview
There exist various kinds of techniques to investigate surface structures. Electron diffraction, SXRD, and X-ray standing wave are mainly used to obtain the averaged structure in a long-range order. On the other hand, photoelectron diffraction, ion scattering, surface sensitive X-ray absorption fine structures, scanning probe microscopy, and electron microscopy are used to obtain the local structures.
Among these methods, diffraction is the most reliable method to determine the atomic structure as proven by crystal structure analysis. Indeed, LEED, which was observed in the first experiment by Davisson and Germer14) on the wave property of electrons in 1927, is still a leading method for structure determination. An astounding increase in the amount of experimental LEED work since the 1960s was sparked in particular by the renewed efforts of Germer et al.15) and the contributions of Lander et al.16) on technical advances, i.e. the post-acceleration display LEED system, which allows the entire spot diffraction pattern to be viewed on a fluorescent screen.17)
SXRD became a major tool in the 1980s when brilliant SR sources appeared because of the very small number of atoms that contribute to the scattering compared to that in bulk, in addition to the intrinsic feature of X-rays that the interaction with matter is weak. In 1979, Marra et al.18) performed X-ray diffraction experiments on an Al/GaAs interface in the so-called grazing incidence geometry, in which the grazing angles of incident and exit X-rays are kept small, and demonstrated that this geometry is sufficiently surface sensitive. This is because the penetration depth becomes a few nanometers, resulting in suppression of the scatterings from the inner crystal if the incident angles become close to the critical angle of X-ray total reflection. Eisenberger and Marra19) performed SXRD experiments in 1981 by using ultra-high vacuum (UHV) instruments and an SR source on Ge(001)-2 × 1. Robinson20) reported in 1986 on the crystal truncation rod (CTR) scatterings emanating from the truncation of crystal periodicity, which has a continuous X-ray diffraction intensity distribution perpendicular to the surface. These two diffraction and scattering experiments are the basics of SXRD.
2.2. Diffraction from surface
If we cut a crystal parallel to a net plane, the ideal surface that keeps the atomic arrangements the same as that in the crystal is generally unstable. Surface reconstructions or lattice relaxations occur and the total energy decreases. Surface reconstruction also occurs by the adsorption of additional atoms. As a result, in many cases, the surface atoms form a large in-plane periodic structure with a lower in-plane symmetry than that in the crystal. The periodicity along the inward direction of the crystal is lost in several atomic layers.
For the crystal with the surface and the surface superstructure, the diffraction conditions are described as similar to those of a two-dimensional lattice. Let us introduce scattering vector  and reciprocal lattice vector
  using 1 × 1 fundamental lattice vectors
  , and
, and  , such that

Here, h and k take integer or fractional values, l is continuous, and  and
and  denote the incident and exit wave-number vectors, respectively.
In Ewald construction, diffraction conditions are satisfied where reciprocal lattice rods perpendicular to the surface intersect the Ewald sphere in the reciprocal space. Figure 2 shows several diffraction geometries in Ewald construction. When both h and k take integer values, this reciprocal lattice rod is called the CTR, the scattering intensity of which contains contributions from the bulk crystal and surface layers. In contrast, the rod with either h or k as a fractional value is called fractional order rod (FOR).

Fig. 2. (Color online) Reflection geometry for (a) out-of-plane and (b) in-plane surface X-ray diffraction. (c) Transmission geometry for more time-effective and precise data acquisition. Gray and red circles denote Ewald spheres. Diffraction conditions are satisfied where either crystal truncation rods (CTRs) or fractional-order rods (FORs) intersect the Ewald sphere.13)
Download figure:
Standard image High-resolution image2.3. Kinematical expression
The crystal structure factor,  , is given by the Fourier transform of charge density
  in a unit cell.

where,  represents a position vector in the unit cell.
CTR scattering obtains contributions from both surface layers and inner crystal, whose periodicity perpendicular to a surface is truncated. By using the structure factors of a bulk crystal and surface layers, FB and FS, respectively, the absolute reflectivity along CTR is expressed in kinematical approximation in the general form as

Summation index n shows the depth from the surface as measured in a unit cell of the bulk. P, re, λ, Au, and ηgeo, respectively represent the polarization factor, classical electron radius, wavelength, area of a unit-cell, and a geometrical factor. The geometrical factor includes the Lorentz factor, area correction, beam correction in a stationary mode, and the intersection correction of the rod in the integration mode.21)
The contribution from the crystal is explained by the semi-infinite summation of scatterings from the unit cells toward the inside of the crystal. The Bragg conditions are satisfied when l is an integer and the right side of Eq. (3) diverges in the kinematical approximation. The CTR scattering profiles become sensitive to the surface structure, as shown in Fig. 3, as the contributions to CTR scatterings from the crystal and surface become comparable when moving away from the Bragg point. The relative positions of the surface atoms to the crystal atoms, especially the z positions of surface atoms perpendicular to the surface, can be obtained using these characteristics of CTR scatterings.

Fig. 3. (Color online) Calculated intensity of crystal truncation rod (CTR) scattering from a simple cubic crystal with a surface. The blue curve is CTR intensity from an ideal crystal that surface atoms are in the same positions as they would be in the bulk. The solid curve shows CTR intensity from a crystal in which the top layer is relaxed inward by 7%. The results demonstrate that CTR scattering is sensitive to a surface structure.13)
Download figure:
Standard image High-resolution imageFOR originates from a surface superlattice with a large unit cell having a different symmetry from that of the crystal due to surface reconstruction. For FOR scatterings, which contain only contributions from the reconstructed surface layers, the diffraction intensities become

Intensity profile IFOR along the FORs is only affected by the surface layers. Since IFOR(l) weakens along the rod owing to the thermal vibration effect, the diffraction intensities at the bottom of the rod (around l = 0.1) are mainly collected.
Therefore, as a scattering vector is directed almost parallel to the surface, the scattering intensity provides information on the in-plane surface structure. To realize this measurement, the so-called grazing incidence X-ray diffraction (GIXD) is employed, in which the grazing angles of both incident and exit X-rays are small, as shown in Fig. 2(b). Many surface and interface studies have reportedly used GIXD, for example, we can find extensive studies on oxide surface.22) Here, we show the in-plane diffraction intensities from Si(111)-7 × 7 in GIXD geometry in Fig. 4. In-plane diffraction is sensitive to the projected surface structure because of the small l component in the scattering vector. Furthermore, GIXD cannot determine the positional relation between surface and bulk atoms. This requires an analysis of CTR scatterings, reflecting interference of diffraction from the surface and bulk atoms.

Fig. 4. (Color online) Intensity map of in-plane diffraction from a Si(111)-7 × 7. Fractional-order reflections are indicated by solid circles of which area are proportional to the related structure factors. Green circles denote integer-order reflections. An irreducible area in symmetry is represented by blue lines. The inset shows a typical rocking curve of the (6/7 0) in-plane reflection obtained in grazing incidence geometry.13)
Download figure:
Standard image High-resolution image2.4. Darwin's dynamical theory of X-rays
In the kinematical approximation, CTR scattering intensities have no physical meaning at the Bragg points, including the total external reflection region, they diverge. Instead, we must consider the dynamical diffraction theory treating multiple scattering between atomic layers. Reflection coefficient RB of an ideally terminated single crystal surface derived from Darwin's dynamical theory is given as follows:23)
where b and d represent the asymmetry factor and d spacing between atomic layers, respectively. Polarization factor C in the dynamical theory is defined as the unity for σ polarization and the cosine of the scattering angle for π polarization,  , where θ0 is the angle of incidence on a surface,
  , where V represents volume of the unit cell, and η is called the deviation parameter.
Figure 5 shows reflectivities along the CTR (00 rod) near the total reflection and the Bragg point calculated by both dynamical and kinematical theories. In the kinematical approach, the diffraction intensity diverges, whereas the dynamical approach correctly reproduces the finite reflectivity profile, showing the so called silk-hat Darwin curve. At a far tail of the Bragg point, RB is reduced to the bulk term,  in Eq. (3), which is the same as the result obtained from the kinematical scattering approach shown in Fig. 5. Therefore, except for the diffraction conditions very close to the Bragg points, the kinematical theory is valid for interpretation and analysis of CTR scatterings. For simplicity, although we show here the ideal case in which only the bulk part contributes, the same approach can be applied to situations assumed in deriving Eq. (3) where the surface layers have different structures than that of the bulk crystal by surface reconstructions and/or surface roughness.

Fig. 5. (Color online) Reflectivities along the CTR (00 rod) near (a) the total external reflection and (b) the Bragg point calculated using the kinematical theory (blue dashed line), as shown in Eq. (3) and dynamical theory (solid line), as shown in Eq. (6). At the Bragg point, the CTR scattering shows the so-called silk-hat Darwin curve.
Download figure:
Standard image High-resolution imageBy considering the general formula of the scattering amplitude from an atomic plane24) and multiple scattering within the same atomic plane,25) Eqs. (6) and (7) can be applied to the entire reciprocal space. Based on the dynamical theory, we can execute absolute X-ray reflectivity measurement,26) which is a powerful tool to decide coverages on surfaces.
3. Structure analysis
We briefly describe the method of determining the atomic constellations of surfaces through X-ray diffraction. The techniques using X-ray diffraction are the most reliable methods for extracting information about a crystal surface.
By using an atomic scattering factor  in Eq. (2) is reduced as follows:
  , where T represents the temperature factor, and f including the anomalous scattering terms can be referred from Sasaki's table.27)
  , where B, the so-called B-factor, is
  in the isotropic case and
  is the mean square displacement of each atom. Moreover, θ and λ represent half of the scattering angle and wavelength of X-rays, respectively.
A structure analysis using optimization methods, such as the least squares method, is to find the best structure parameter set  of all atoms that reproduce experimental results. Program ROD28) is widely used as a well-considered package for structure analysis using SXRD. Program SISReX29) has also been utilized in recent surface structure analyses.30–33)
3.1. Patterson analysis
In SXRD, one can infer an adequate structural model, which reproduces the observed CTR scattering and in-plane diffraction intensities, by using the Patterson map6,34) or trial and error methods with information obtained from such as scanning tunneling microscopy. Next, the atomic arrangement is refined by the least squares method.
Patterson function  is defined as the Fourier transform of the square of structure factor
  and is equal to the auto-correlation function of charge density
  in the crystal.35) The peaks of the Patterson function give the interatomic vectors in the crystal atoms. The Patterson function can be calculated from the observed data in a straightforward manner.

Here, ∗ represents convolution, and integration is performed over a unit cell. In GIXD, there is a lack of integer rod intensities and calculated Patterson map has both positive and negative regions, contrary to the ideal Patterson map. However, it is possible to interpret that the positive peaks represent the interatomic vectors.6,7)
The Patterson function for surfaces is a partial Patterson function calculated using only fractional-order reflections. As is obvious in partial Patterson analysis36–38) performed in the early surface X-ray structure analyses, the direct interpretation that relates peak positions to interatomic vectors becomes invalid when the structure is complex. For n atoms in a unit cell, n(n − 1) peaks should be found in the partial Patterson map. However, an increase in n results in the superpositions of peaks, peak shifts, and even loss of peaks because of the existence of a negative region. Therefore, its interpretation becomes rather trial-and-error and depends on a structural model. Finally, finding a plausible structural model is the most important issue in structure analysis.
There are two methodologies for overcoming aforementioned difficulties, namely the crystallographic direct methods11,12) and holographic methods using contribution to CTR scatterings from the crystal as the known structure. Crystallographic direct methods introduce a plausible structure model by combining the nonnegativity and atomicity of the charge density in a crystal with information contained in the observed diffraction intensities. We describe these methods for surfaces in detail later.
4. Instruments
Figure 6 shows the experimental layout for surface diffraction on beamline BL13XU39) at SPring-8. The optics consist of the undulator source, shaping slit, crystal monochromator, and double-bend mirrors for eliminating higher harmonics and focusing the beam. X-rays in the range from 5.5 to ∼50 keV can be utilized using the fundamental or higher harmonics beam. To supply the growing demand for high photon flux in SXRD, currently the middle-energy-bandwidth crystal monochromator using an asymmetric geometry was installed.40) X-ray flux reaches ca. 1014 photons s−1 in a wide energy range (8–25 keV). For photon-hungry experiments, the concept of value-chain optimization from the source through the optical elements to the detector, without relying only on improvements to the source, is becoming almost essential to conduct an experiment with sufficient efficiency.

Fig. 6. (Color online) Layout of BL13XU. The inside of experimental hutch 3 is additionally illustrated. ϕ represents an incident angle.39)
Download figure:
Standard image High-resolution imageFigure 7 shows the UHV system for surface diffraction.39) The UHV system is equipped with a sample growth apparatus by molecular beam epitaxy, LEED/Auger electron spectroscopy optics, or reflection high-energy electron diffraction (RHEED) as well as a sample manipulator for annealing and cooling. A sample is kept in an UHV environment of 10−8 Pa order or less to avoid contaminations during measurements. The six-circle diffractometer41–44) and S4+D2-type diffractometer,39,45,46) i.e. four-axes for the sample and two-axes for the detector, were employed as the standard surface diffractometers.

Fig. 7. (Color online) UHV chamber for studying a metal surface mounted on the S2 + D2 diffractometer in experimental hutch 3.39)
Download figure:
Standard image High-resolution image4.1. Correction factor in SXRD
In conventional SXRD, each diffraction intensity is collected by rocking a sample as shown in Fig. 4 because the number of atoms that contribute to the X-ray scatterings on the surface is predominantly smaller than that in the bulk crystal (by an order of 10−4 to 10−5), and it is necessary to discriminate between a weak signal from the surface atoms and the background scattering from the bulk crystal. The quantitativeness of the rocking measurement has been well investigated.21) Thus, the reliability of surface-structure determination by SXRD has been established.
In contrast to the bulk reflection, the diffraction conditions are always satisfied in SXRD, as shown in Fig. 2. In the rocking mode, the slits are located in front of the detector, and the integrated intensity from a certain part of the reciprocal lattice rod is obtained by rocking a sample. The amplitudes of the structure factors are derived from the diffraction intensities in the rocking mode by applying the following correction factors considering an instrumental resolution.
Integrated intensity  at
at  in the reciprocal space obtained by rocking ω circle is related to structure factors
  as follows:21)

with

where, Φ0, A, Δγ, ω0, and Ctot represent the incident photon flux per second per unit area, sample area determined by the incident and exit slits, acceptance of a detector in the γ direction, rotational speed of the ω axis, and total correction factor, respectively. Correction factors  , and
, and  represent the Lorentz factor, rod interception, active sample area, detector acceptance, and beam footprint factors, respectively. Rocking curve measurements ensure quantitativeness in both in-plane diffraction and CTR scattering analyses.
4.2. Systematic error
The systematic error is estimated by measuring the equivalent reflections in a crystallographic symmetry. Especially, the grazing incidence geometry limits the accuracy of the in-plane diffraction measurement compared to out-of-plane geometry. This is because there exist systematic errors that cannot be corrected by Eq. (9).
X-rays show the total external reflection with an incident angle lower than the critical angle, e.g. 0.1° with 0.1 nm X-rays. In GIXD, where an incident and outgoing angles are near the critical angle, the diffraction intensities are proportional to transmissivity  owing to a dynamical effect. Here, αi and αf represent the incident and exit angles, respectively, and
  , where
  and αc is the critical angle. Around the critical angle, the surface diffraction is enhanced, and the scattering from a bulk crystal is suppressed because of the small penetration depth. This surface-sensitive feature was actively applied in the early experiments.18,19) However, this sensitivity strongly depends on the alignment of a surface normal and may result in inevitable systematic errors. To avoid this problem, in-plane diffraction was measured by keeping the incident angle 3–5 times larger than the critical angle.
In addition, the scattering vector in GIXD intrinsically has small but non-negligible l component, which also results in systematic errors, as the projected structure normal to the surface is discussed in GIXD.
5. Progress in experimental methods
The conventional SXRD, which employs rocking curve measurements with a point detector, requires a longer measurement time compared to electron-source based techniques such as electron diffraction and electron microscopy. This time-consuming measurement restricts investigation to a stable or inert surface. In addition, the measurement accuracy of SXRD is not satisfactory if we wish to consider surface charge density, especially in in-plane diffraction in the grazing incidence geometry. Nevertheless, the anharmonic analysis of surface thermal vibrations47) and the trial analysis of surface charge density48) have been conducted. Therefore, further development is required to achieve time-effective and highly-precise measurements to enhance the availability of SXRD.
5.1. Stationary mode in reflection geometry
The so-called stationary mode, without rocking the sample, realizes higher accuracy than the rocking mode while observing reciprocal rods with large l components in the geometry of a large incident and/or exit angle.21,49,50) The stationary mode can reduce measurement time because the diffraction conditions are always satisfied as similar to those of LEED and RHEED.
Since Takahashi et al.51) applied the stationary mode in the analysis of Si(111)- -Ag by using a position-sensitive proportional counter, this measurement mode was applied in various sample environments and detector setups. For example, time-effective measurements of SrTiO3 surface in a stationary geometry by using a novel two-dimensional detector, i.e. pixel array detector realizing single photon counting,52) were performed at the Swiss Light Source. The observations along a total of 27 CTRs including over 1800 measurement points took only approximately 10 h.53)
Simultaneous observations of many diffraction spots from surfaces and interfaces by using a two-dimensional detector were also reported.54–57) Recently, Gustafson et al.58) showed time-effective rod data collection in reflection geometry by using high-energy X-rays, clearly showing CTR and FOR intensity distributions originating from the surface in a reciprocal space, as shown in Fig. 8, unlike the conventional technique that shows spot-like reflections from CTR and FOR.

Fig. 8. (Color online) In situ high-energy SXRD data from the surface oxide on Pd(100) measured during CO oxidation in a flow of 6 Torr CO and 3 Torr O2 at a sample temperature of 600 K. All images collected during the rotational scan combined into a single image, in which CTRs and superlattice rods are indicated. The way these images are combined enhances background noise, such as the powder diffraction rings originating from polycrystalline defects in the crystal.58)
Download figure:
Standard image High-resolution imageRegarding the data accuracy, the minimum measurement error reported in the rocking mode was approximately 6% for in-plane diffraction with grazing incident geometry.59) In the stationary mode, the minimum error reported is approximately 5% by careful correction of the incident beam flux and effective illuminated sample area.53)
5.2. Transmission X-ray diffraction (TXD) for surfaces
To overcome the intrinsic limitations of acquiring precise data and high time consumption in conventional SXRD, we proposed TXD for surfaces60) by revisiting the pioneering work of surface TXD in energy dispersive type by Takahashi et al.61) Recently, TXD was applied to electrochemical liquid–solid interfaces by Reikowski et al.62) In surface TXD, the diffraction conditions are always satisfied, as shown in Fig. 2(c).
As long as we use thick substrate crystals, thermal diffuse scattering (TDS) from a bulk crystal is dominant, as shown in Fig. 9(a). The TDS is the X-ray scattering originating from thermally populated phonons,63,64) which distributes over the entire reciprocal space; bright spots close to the reciprocal lattice points and a lattice-like distribution are mainly visible. The former appear where the acoustic phonon population is high. By using a thinner substrate (∼5 μm thick), as shown in Fig. 9(b), clear TXD patterns are observed, as shown in Fig. 9(c) for the Si(111)- -Ag. The TDS is suppressed and the fractional order reflections originating from Si(111)-
 -Ag around the CTR spots can be seen in a hexagonal manner. For another example, approximately 40 fractional order spots from Si(111)-7 × 7 were collected simultaneously by an image plate. This simultaneous data collection using an area detector accelerates the time-effective measurement.

Fig. 9. (Color online) (a) Thermal diffuse scattering (TDS) from a thick Si substrate. (b) Photograph of a thin Si sample of 10 × 10 mm in size, and ca. 5 μm thick in the center. The SPring-8 logo can be seen through the sample. (c) Transmission X-ray diffraction pattern from a Si(111)-( )R30°-Ag with a thin Si substrate. Fractional order rod (FOR) scatterings originating from the
  surface reconstruction are clearly observed in addition to crystal truncation rod (CTR) scatterings by suppression of TDS. X-ray energy used was 30 keV.13)
Download figure:
Standard image High-resolution imageIn addition, the entire X-ray beam illuminates a selected area on a sample surface, unlike the grazing incidence geometry with the inevitable systematic errors as already mentioned, in which only a part of the incident beam illuminates the sample. Therefore, a focused beam can be easily applied without loosing data accuracy. Besides, in surface TXD, the specific points of just l = 0 in the reciprocal space can be accessed by adjusting the incident angle, as shown in Fig. 2(c), e.g. the red Ewald sphere and vectors meet this condition, resulting in pure in-plane diffraction without the l component. These features reduce systematic errors.
6. Progress in analytical methods
In SXRD, the standard process to decide the atomic structure on the surface is to use the trial-and-error method assuming a plausible model as an initial model based on a technique such as Patterson analysis.34) Therefore, it is difficult or impossible to straightforwardly obtain an atomic geometry with a large number of atoms contributing to surface reconstruction.
For 20 years, steady progress in surface X-ray crystallography has been made including in not only the crystallographic direct methods but also holographic methods. Several of these methods include iterative approaches resembling phase retrieval algorithm in optics.65,66) We describe the current status of solving the phase problem in surface X-ray crystallography by mainly focusing on an iterative approach.
6.1. Phase problem in X-ray crystallography
Charge density of crystal  is expanded by the Fourier series of complex structure factors
The phase problem, which is the loss of phases of diffracted X-rays in measurement (loss of  ), has been the most attractive subject in X-ray crystallography for over 50 years. Traditional direct methods for solving crystal structures, which have been successful in bulk crystals, do not work well in SXRD because of matters inherent in SXRD.
In three-dimensional (3D) crystals, powerful solutions known as traditional direct methods have been introduced to solve the phase problem.11,12) One of the most famous relationship between structure factors of periodic objects utilized in the methods is Sayre's equation.67) This equation is derived from the atomicity of crystalline objects, i.e. positivity and localization of charge density distribution. However, in protein crystallography, this atomicity property weakens because the non-zero charge density region widens, and the low-resolution diffraction data makes this preferable property less workable. These features limit the applicable area of the traditional direct methods even in 3D crystals. This situation is similar in SXRD, and there are more inherit limitations in intensity-data acquisition in SXRD.
6.2. Iterative approach
Several direct methods and holographic approaches for surface include an iterative approach. Here, we introduce the iterative approach briefly. In the traditional direct methods, the phases of observed reflections are inferred from the relations between structure factors in reciprocal lattice space. In contrast, an iterative approach obtains the charge density with the estimation of  in Eq. (11) by executing operations to the charge density iteratively. For example, we can introduce the following relation to charge densities ρk and
  after k and k + 1 iterations, respectively.

Here,  ,
,  , and
, and  represent operators such as Fourier transform.
Let us show an example of applying the iterative approach to SXRD analysis. Here, we define  , and
, and  to the Fourier transform, an operator to substitute a set of amplitudes of structure factors to the observed set, and an inverse-Fourier transform, respectively.
  sets the pixel that has negative value to zero gradually, as follows.

Here,  , and β is the so-called relaxation parameter (typically between 0.5 and 1.0). In the analysis, as only in-plane data was employed, as shown in Fig. 10(a), the projected structure on the surface was obtained. The objective surface is Si(111)-(
 )R30°-Ag, and the surface forms the "honeycomb-chained triangle" structure,69) as shown in Fig. 10(b).

Fig. 10. (Color online) (a) Experimental in-plane intensity map of a Si(111)-( )R30°-Ag at room temperature.68) The blue lines indicate an irreducible unit. (b) Top view of the corresponding, so called, "honeycomb chained triangle" model.69) A fundamental lattice is denoted by green lines. (c) Reconstructed image by an iterative approach from calculated complete in-plane data including both integer-order and fractional-order reflections. (d) Reconstructed image from the experimental data shown in (a). The Ag and Si atoms of the second layer are clearly recognized. On the other hand, the third-layer Si atoms with only slight deviations from bulk in-plane positions disappear because integer-order reflections are not considered in the algorithm.13)
Download figure:
Standard image High-resolution imageAt first, we show an iterative solution by using ideal complete diffraction data. The results are shown in Fig. 10(c), and each pixel represents the final ρk. Silver and silicon atoms are clearly visible in the unit cell. Next, we applied this approach to the observed data. Integer-order reflections are excluded as they have contributions from the silicon bulk crystal. As shown in Fig. 10(d), both the topmost silver and first-layer silicon atoms are visible even with the observed data. The second-layer silicon atoms on positions with almost 1 × 1 periodicity disappear. This is because the information on 1 × 1 periodicity lacks in case integer-order reflections are lacking.
6.3. Crystallographic direct methods
Crystallographic direct methods introduce a plausible structure model by combining the non-negativity and atomicity of the charge density in a crystal with information contained in the observed diffraction intensities. The phase problem in surface X-ray crystallography was thought to be untraceable until Marks et al.70) showed that the traditional direct methods in X-ray crystallography can be applied to surface-structure analysis to some extent, as SXRD data always have a systematic loss of diffraction intensity data. However, the early results remained unsatisfactory with complex structures, i.e. Si(111)-7 × 7.71)
Then, Marks et al. proceeded to apply multisolution approaches, e.g. combination of a global optimization approach such as genetic algorithm with the Sayre's equation,72) and projection methods with entropy minimization algorithm.73,74) These methods find a plausible structure among diverse candidate structures by starting from random initial variables and/or charge density distributions. Dozens of surface structures, for example, Ni(111)-( )-S, as shown in Fig. 11, and Si(111)-(6 × 6)-Au, were solved by this approach.75) A 3D structure analysis of surface structure in combination with the above algorithm and oversampling condition along the reciprocal lattice rod was also discussed.76)
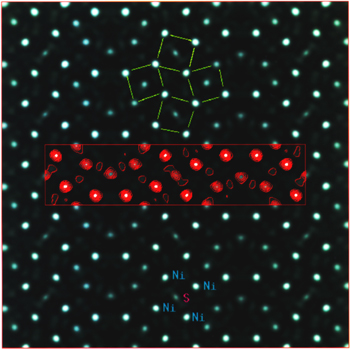
Fig. 11. (Color online) Charge density map determined for the S on Ni(111)-(5  ) "clock structure", with contours for a single unit cell overlaid. The fourfold arrangement of the Ni atoms around the S atoms is indicated.74)
Download figure:
Standard image High-resolution imageRius et al.77) introduced differential charge density δ, including negative charge density region, to establish fundamental equations for solving a superstructure in general, and then derived a tangent formula by using the similarity between δ and δ3. Torrelles et al.78–80) extended the Rius's direct method by interpreting differential charge density δ as surface charge density so that the method is applicable to surface in-plane diffraction data. For example, C60/Au(110)-p(6 × 5) was solved using Rius's direct methods.80,81) The direct method analysis with 130 independent in-plane reflections revealed not only the wavy structure of the outermost C60 layer but also large displacement of Au atoms in the interface between C60 layer and Au crystal, as shown in Figs. 12 and 13. This approach is mainly applied to the analysis of in-plane diffraction data.

Fig. 12. (a) Two-dimensional data Patterson map computed from the measured in-plane dataset. The arrows indicate the position of the fullerene molecules in the unit cell. (b) Contour difference map (positive regions) of C60/Au(100)-p(6 × 5) obtained by applying the "direct methods" difference sum function to the partial set of in-plane reflections given in the literature.80) The dashed lines indicate the locations of the C60 molecules. The rectangle outlines the 6 × 5 unit cell (17.3 × 20.4 Å2).80)
Download figure:
Standard image High-resolution image
Fig. 13. (Color online) (a) Top-view projection of the C60/Au(110)-p(6×5) surface reconstruction model obtained from scanning tunneling microscopy measurements.82) The relative heights of the Au atoms are indicated by different colors (darker shades represent deeper atoms). The fullerenes are indicated by the dashed circles. (b) Top-view projection of the C60/Au(110)-p(6×5) surface reconstruction model obtained from the direct interpretation of the difference map in the literature.80) Lines m and g indicate a mirror and a glide line, respectively.80)
Download figure:
Standard image High-resolution image6.4. Holographic approach
Takahashi et al.83,84) demonstrated that direct imaging of surface atoms is possible with simple interpretation of CTR scatterings based on Gabor's in-line holography,85) i.e. CTR scatterings were considered as a hologram of surface atoms by interpreting the contributions of the substrate crystal and surface layers to CTR scatterings as a reference wave and an objective wave, respectively. The reconstructed image of Ge atom on Si(001) are shown in Fig. 14. This method has the advantage of quick characterization of the surface and interface with simple atomic arrangements because it is enough to collect only relatively intense CTR scatterings in a simple arrangement.

Fig. 14. (Color online) Contour maps at planes that section the peak corresponding to the Ge atom reconstructed from the intensity data: (a) a section parallel to the surface at Z = 0.32, and (b) a section perpendicular to the surface at Y = 0. X, Y, and Z are the axes of the unit cell defined in the literature,84) which are normalized by the length of each side. In both images, negative values are suppressed.84)
Download figure:
Standard image High-resolution imageSaldin et al.86) established an ab-initio structure analysis based on the holographic interpretation of CTR scatterings with maximum entropy inference. In the direct visualization of surface atoms, the treatment of diffraction contribution from various domains becomes crucial. Saldin et al. also tried ab-initio surface structure analysis with domains by employing Ge(001)-2 × 1 as a test surface87) (see Fig. 15).

Fig. 15. (Color online) (a) A perspective view of green electron-density isosurfaces of the distribution  of the electron density from one of the two mutually rotated surface domains after a single circuit of the flow chart in the literature.87) Note the near impossibility of distinguishing the true atom positions (marked by the red spheres) from the large number of artifacts. (b) As (a), except that the green electron-density isosurfaces are those after the modification of the density distribution of (a) following the execution of 300 iterations of the RECURSION algorithm with data from just the CTRs, which contain scattering contributions from both the surface and bulk. The isosurfaces now indicate the positions of a spatially averaged surface structure from a single domain which has the (incorrect) lateral periodicity of the bulk structure. (c) As (b), except that the green electron-density isosurfaces now represent the electron distribution recovered after the inclusion of both the CTRs and the superstructure rods in the RECURSION algorithm. The true (2 × 1) periodicity of a single one of the surface domains is now recovered, pinpointing the locations of the surface dimer atoms from that domain in a nominal (2 × 2) surface unit cell.87)
Download figure:
Standard image High-resolution imageYacoby et al.88,89) developed the direct determination method of epitaxial structures named coherent Bragg rod analysis (COBRA), which uses an interference between the scatterings from bulk crystal and epitaxial layers, and extracts their phases from the relation of structure factors at two reciprocal points with a small separation along the CTR. Recently, COBRA was utilized in direct imaging of organic layers.90) Figure 16 shows several one-dimensional imagings of organic layers. Tiny tilting of oxide tetrahedron in oxide thin films was also directly imaged in three dimension by COBRA, as shown Fig. 17.92)

Fig. 16. (Color online) Electron density profile as a function of depth for [n] phenacenes together with that of tetracene.91) The origin of the horizontal axis is chosen as the surface. The oscillation of the electron density above the surface (negative-z region) is caused by the termination error of the Fourier transformation.90)
Download figure:
Standard image High-resolution image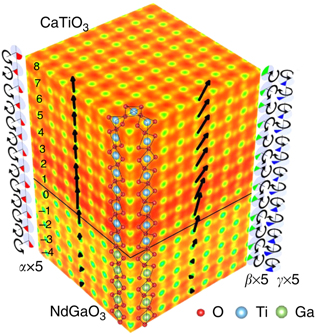
Fig. 17. (Color online) Three-dimensional electron density for CaTiO3/NdGaO3 at 30 K reconstructed by coherent Bragg rods analysis (COBRA). Polarizations projections on ac and bc planes are displayed on corresponding faces. Oxygen octahedra tilts evolution, α, β, and γ, are magnified by 5 times and displayed by red, green, and blue pie charts, respectively, along each edge of electron densities.92)
Download figure:
Standard image High-resolution image
7. Discussion
Although crystallographic direct methods for surface analysis are now being developed, the analysis of complex surface structures is still difficult. In general, the application of traditional direct methods to surface X-ray structure analysis is difficult, could be because of the difficulty in deciding the coverage of adsorbed atoms, number of atoms contributing to the surface reconstruction, and depth of the layers. The acquiring of this information is challenging even by using other surface sensitive techniques such as scanning probe microscopy. Although absolute X-ray reflectivity measurement93,94) has been proposed as a solution, it not utilized generally.
Revisiting the direct methods in X-ray crystallography from the viewpoint of signal and image processing should provide us some insight into solving the phase problem based not merely on technique but on mathematical or physical meaning. Indeed, we can find similar methods in protein crystallography, such as solvent-flattering,12) modification of low density elimination,95) and Shake and Bake.96) A more general algorithm proposed by Elser97) is included in well-known structure analysis program, SIR.98) The phases of structure factors have essential structural information rather than amplitudes obtainable by direct observation as re-emphasized by Lattman and DeRosier.99)
From the viewpoint of a global search for structure parameters, several works using genetic algorithm100) and Bayesian inference101) can be found, although it should be noted that the number of structure parameters and the related parameter space grow rapidly with increase in the number of atoms. In addition, experimental approaches to the phase problem of SXRD have been reported. Pauli et al.102) demonstrated atomic imaging and direct phase retrieval of SrTiO3 grown on NdGaO3(110) by using anomalous X-ray diffraction.
From the viewpoint of development of experimental methodology, for time-resolved experiments, energy-dispersive CTR scattering measurements proposed by Matsushita et al.103,104) were successfully utilized.105,106) SXRD has also been applied to in situ studies on crystal growth dynamics of III–V semiconductors grown by molecular beam epitaxy that detected not only surface structures of the growing films but also buried interfacial structures because of the large penetration depth of X-rays.107) Regarding accelerator-based sources, average brilliances are to be saturated as an electron-beam emittance approaches the limitations set by the wavelength of light (diffraction limit),5) as shown in Fig. 1. However, other characteristics of the following sources provide novel opportunities of observations. With the introduction of XFEL and the double-bend achromat lattice for a synchrotron storage ring,4) coherence and pulse features are becoming ready to actively be applied to surfaces in addition to the brilliance feature. These features will allow us to observe multiscale phenomena and dynamics on surface in the pm to μm scales and in ns or faster time range, respectively, that are currently not practical.
The combination of the aforementioned time-effective measurements and direct methods for surfaces will provide a new opportunity to study surface phenomena from the firm basis of its atomic constellation. In both experimental and theoretical studies, it has been stressed that the establishment of a methodology and making the methodology state-of-the-art are key solutions to overcome the difficulties in understanding and unraveling surface phenomena.3)
8. Summary
We overviewed the highly sophisticated SXRD based on diffractometry and the current status of solving the phase problem in surface X-ray crystallography by mainly focusing on an iterative approach. We also noticed that there is room for seeking how to image surface atoms through SXRD, stimulated by the recent experimental and theoretical progress.
In summary, it is important to develop many state-of-the-art techniques to reveal surface functions. We expect that SXRD would play such a role among structure determination techniques.
Acknowledgments
This work was partly supported by JSPS KAKENHI (Grant Nos. 26105001, 18H03479 and 19H05451). The synchrotron radiation experiments were performed on beamline BL13XU at SPring-8 with the approval of the JASRI (Proposal Nos. 2015A1226, 2015A2055, 2015B1106, 2016A1298, 2016A1860, 2016B1199, 2016B1952, 2017A1345).
Biographies

Hiroo Tajiri was born in Fukuoka, Japan in 1974. He obtained his B.Eng. (1997), M.Eng. (1999), and Ph.D. (2002) in applied physics from the University of Tokyo. He has been a research scientist at Japan Synchrotron Radiation Research Institute since 2002 and has also been a visiting scientist at RIKEN SPring-8 Center since 2011. He has worked on surface X-ray crystallography and synchrotron beamline science. His recent research focuses on the development of new techniques using synchrotron X-rays to reveal the structural properties of surfaces.