Expression of a CO2-permeable aquaporin enhances mesophyll conductance in the C4 species Setaria viridis
- Australian Research Council Centre of Excellence for Translational Photosynthesis, Division of Plant Science, Research School of Biology, Australia
- ARC Centre of Excellence in Plant Energy Biology, School of Agriculture Food and Wine, University of Adelaide, Australia
- Hawkesbury Institute for the Environment, Western Sydney University, Australia
Abstract
A fundamental limitation of photosynthetic carbon fixation is the availability of CO2. In C4 plants, primary carboxylation occurs in mesophyll cytosol, and little is known about the role of CO2 diffusion in facilitating C4 photosynthesis. We have examined the expression, localization, and functional role of selected plasma membrane intrinsic aquaporins (PIPs) from Setaria italica (foxtail millet) and discovered that SiPIP2;7 is CO2-permeable. When ectopically expressed in mesophyll cells of Setaria viridis (green foxtail), SiPIP2;7 was localized to the plasma membrane and caused no marked changes in leaf biochemistry. Gas exchange and C18O16O discrimination measurements revealed that targeted expression of SiPIP2;7 enhanced the conductance to CO2 diffusion from the intercellular airspace to the mesophyll cytosol. Our results demonstrate that mesophyll conductance limits C4 photosynthesis at low pCO2 and that SiPIP2;7 is a functional CO2 permeable aquaporin that can improve CO2 diffusion at the airspace/mesophyll interface and enhance C4 photosynthesis.
Editor's evaluation
The work generated and analysed transformants of Setaria with a putative CO2-permeable aquaporin and found evidence of improved photosynthesis and makes an contribution to understanding if aquaporins can be used to overcome limitations by mesophyll conductance. The new version is improved, making it clear that the variations are robust, but there are still some intriguing open biological questions.
https://doi.org/10.7554/eLife.70095.sa0Introduction
Diffusion of CO2 across biological membranes is a fundamental aspect to photosynthesis. The significant contribution of aquaporins to increased CO2 diffusion has been demonstrated in C3 plants (Flexas et al., 2006; Hanba et al., 2004; Sade et al., 2010). Aquaporins have key roles in regulating the movement of water and solutes into roots and between tissues, cells and organelles (Tyerman et al., 2021). These pore-forming integral membrane proteins can be divided into multiple sub-families depending on their amino acid sequence and subcellular localization. The PIPs (plasma membrane intrinsic proteins) are the only sub family, to date, known to permeate CO2 (Uehlein et al., 2017). The PIPs are subdivided into paralog groups PIP1s and PIP2s, based on sequence homology (Azad et al., 2016; Chaumont et al., 2001; Groszmann et al., 2016). Typically, PIP2s show higher water permeability when expressed in heterologous systems (Chaumont et al., 2000) and PIP1s seemingly require interaction with a PIP2 to correctly traffic to the plasma membrane (Berny et al., 2016; Zelazny et al., 2007). In plants, a number of CO2 permeable PIPs have been identified including Arabidopsis thaliana AtPIP1;2 (Heckwolf et al., 2011) and AtPIP2;1 (Wang et al., 2016); Hordeum vulgare HvPIP2;1, HvPIP2;2, HvPIP2;3, and HvPIP2;5 (Mori et al., 2014); Nicotiana tabacum NtPIP1;5 (NtAQP1) (De Rosa et al., 2020; Uehlein et al., 2003) and Zea mays ZmPIP1;5 and ZmPIP1;6 (Heinen et al., 2014).
The roles of the CO2 permeable aquaporins have been largely characterized in C3 photosynthetic plants where aquaporins localized in both the plasma membrane and the chloroplast envelope have been shown to facilitate CO2 diffusion from the intercellular airspace to the site of Rubisco in chloroplasts (Kaldenhoff, 2012; Uehlein et al., 2008). The capacity for CO2 diffusion to the initial sites of carboxylation influences the amount of water loss through transpiration (Cousins et al., 2020). Therefore, by providing a more efficient pathway for CO2 diffusion, these membrane pores may contribute to increasing the water-use-efficiency (Groszmann et al., 2016). However, little is known about the role of CO2 permeable aquaporins and their influence on CO2 diffusion from substomatal cavities to the first site of carboxylation in C4 photosynthesis. The C4 photosynthetic pathway is a biochemical CO2 pump where the initial conversion of CO2 to bicarbonate (HCO3−) by carbonic anhydrase (CA) and subsequent fixation of phosphoenolpyruvate (PEP) by PEP carboxylase (PEPC) takes place in the cytosol of mesophyll cells. The pathway requires a close collaboration between mesophyll and bundle sheath cells and this constrains leaf anatomy limiting mesophyll surface area that forms a diffusive interface for CO2 (Evans and Von Caemmerer, 1996). Mesophyll conductance is defined as the conductance to CO2 diffusion from the intercellular airspace to the mesophyll cytosol (Evans and Von Caemmerer, 1996; Osborn et al., 2017; Ubierna et al., 2017). Although the rate of C4 photosynthesis is almost saturated at ambient pCO2, current modelling suggests that higher mesophyll conductance can increase assimilation rate and water-use-efficiency at low intercellular CO2 partial pressures which occur when stomatal conductance is low (von Caemmerer and Furbank, 2016).
Setaria italica (foxtail millet) and Setaria viridis (green foxtail) are C4 grasses of the Paniceae tribe and Poaceae family, related to important agronomical crops such as Z. mays (maize) and Sorghum bicolor (sorghum). S. viridis is frequently used as a model species for C4 photosynthesis research as it is diploid with a relatively small genome that is sequenced and can be easily transformed (Brutnell et al., 2010; Ermakova et al., 2019; Osborn et al., 2017). Here, we used a yeast heterologous expression system to examine the permeability to CO2 of selected PIPs from S. italica. We identified SiPIP2;7 as encoding a CO2-permeable aquaporin that, when expressed in the plasma membrane of S. viridis mesophyll cells, increased mesophyll conductance. Our results demonstrate that CO2-permeable aquaporins can be used to increase CO2 diffusion from the intercellular airspace to mesophyll cytosol to provide higher carboxylation efficiency in C4 leaves.
Results
S. italica PIP family
Four PIP1 and eight PIP2 genes were identified in both S. italica and S. viridis and their protein sequences were 99–100% identical between the two species (Supplementary file 1). Phylogenetic analysis based on the amino acid sequences of the S. italica PIP family showed that three distinct clades emerge: the PIP1 clade, PIP2 clade I, and PIP2 clade II (Figure 1—figure supplement 1). Isoforms within these three clades have characteristic differences including sequence signatures associated with substrate selectivity (Supplementary file 2). Three of SiPIP1s (1;1, 1;2, and 1;5) and all SiPIP2 clade I members (2;1, 2;4, 2;5, 2;6, and 2;7) matched the current consensus sequence for CO2 transport (Azad et al., 2016; Perez Di Giorgio et al., 2014).
RNA-seq data from the publicly available Phytomine database (Phytozome) was examined for tissue-specific expression patterns of the S. italica PIPs (Figure 1a). SiPIP1;1, 1;2, 1;5, and 2;1 were expressed at moderate to high levels and SiPIP2;6 at low to moderate levels, in all tissues analyzed (root, leaves, shoot, and panicle). SiPIP1;6, 2;4, 2;5, 2;7, and 2;3 were expressed predominantly in roots at low to moderate levels. SiPIP2;8 was expressed only in leaves and SiPIP2;2 transcripts were not detected.
Figure 1 with 4 supplements see all
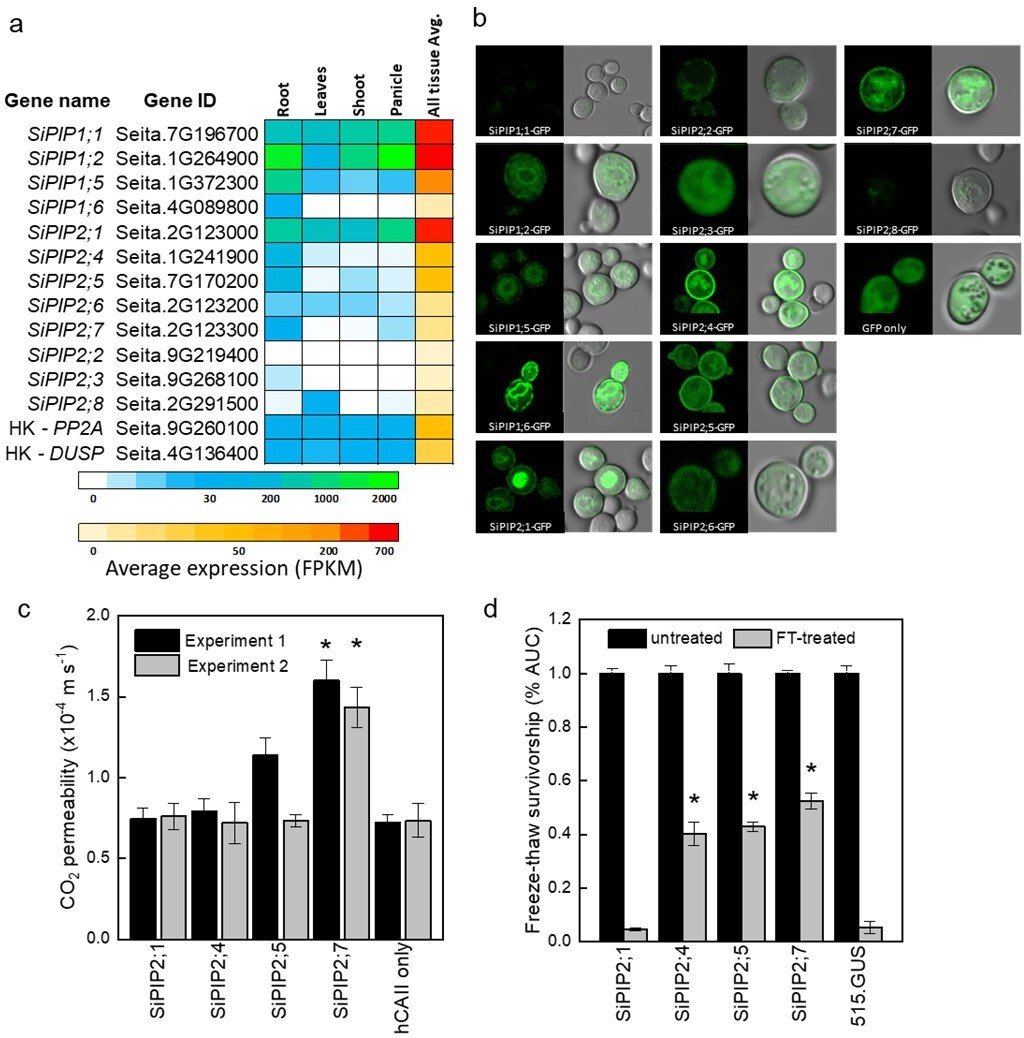
Identification of the CO2-permeable aquaporin SiPIP2;7 from Setaria italica.
(a) Expression atlas of the SiPIP genes generated from Phytomine reported as Fragments Per Kilobase of transcript per Million mapped reads (FPKM). House-keeping genes (HK) PROTEIN PHOSPHATASE 2A (PP2A) and DUAL SPECIFICITY PROTEIN (DUSP) were included for reference. (b) Localization of SiPIP-GFP fusions expressed in yeast visualised with confocal microscopy; left panels – GFP fluorescence; right panels – bright field overlaid with GFP fluorescence. Measured cell diameters are shown in Figure 1—figure supplement 2. (c) CO2 permeability assay on yeast co-expressing SiPIPs and human CARBONIC ANHYDRASE II (hCAII) analyzed by stopped-flow spectrometry (see Figure 1—figure supplement 2 for details). ‘hCAII only’ expression was used as negative control. Mean±SE, n=3 biological replicates. Two independent experiments are presented. Asterisks indicate statistically significant differences between yeast expressing SiPIPs and ‘hCAII only’ control (t-test, p<0.05). (d) Yeast water permeability was assessed in the yeast aquaporin deletion background (aqy1/2) by the cumulative growth between untreated and freeze-thawed cells and determined by the percent area under the curve (% AUC). The yeast expressing the β-glucuronidase reporter gene (515.GUS) was used as negative control. Mean±SE, n=4 biological replicates. Asterisks indicate statistically significant differences between yeast expressing SiPIPs and 515.GUS control (t-test, p<0.01).
-
Figure 1—source data 1
Gene expression and yeast assays.
- https://cdn.elifesciences.org/articles/70095/elife-70095-fig1-data1-v2.xlsx
Functional characterization of SiPIPs
GFP localization of SiPIP-GFP fusions was used to confirm expression and determine targeting to the yeast plasma membrane (Figure 1b). Overall, SiPIP1s had lower GFP signal that was patchy at the cell periphery with strong internal signal consistent with localization to the endoplasmic reticulum. GFP signal was also present diffusively throughout the cytosol suggestive of protein degradation. Overall, SiPIP1s were poorly produced in yeast and were not efficiently targeting the plasma membrane as needed for the functional assays. For the PIP2s, only SiPIP2;1, SiPIP2;4, SiPIP2;5, and SiPIP2;7 showed clear localization to the plasma membrane in addition to other internal structures, and were therefore selected for further functional analyses.
CO2 permeability was measured in yeast co-expressing a SiPIP along with human CARBONIC ANHYDRASE II (hCAII). A stopped-flow spectrophotometer was used to monitor CO2-triggered intracellular acidification via changes in fluorescence intensity of a pH-sensitive fluorescein dye (Figure 1—figure supplement 2; Ding et al., 2013; Heckwolf et al., 2011; Uehlein et al., 2008). Importantly for reliable results, all SiPIP yeast lines tested showed similar cell volumes and were not limited by CA activity (Figure 1—figure supplement 2). A screen of the lines revealed that yeast expressing SiPIP2;7 had the highest CO2 permeability of 1.5×10⁻⁴ m s–1, which was significantly larger than the negative control expressing hCAII only (Figure 1c). Other SiPIPs displayed comparable CO2 permeability to the hCAII only control. The changes in CO2 permeability detected on the stopped-flow spectrophotometer for yeast expressing SiPIP2;7 were not an artifact brought on by an increased permeability to protons causing the intracellular acidification (Figure 1—figure supplement 3).
Freeze-thaw survival assays, which quantify water permeability of aquaporins (Tanghe et al., 2002), provided further confirmation that the SiPIPs expressed in yeast were functional. Overexpression of water permeable aquaporins greatly improves freeze-thaw tolerance in yeast, especially in the highly compromised aquaporin knockout mutant aqy1/2 (Tanghe et al., 2002). Yeast expressing the β-glucuronidase reporter gene (515.GUS) was used a control to show that the single freeze-thaw treatment was effective in almost killing off the entire yeast population (Figure 1d). Consistent with the poor plasma membrane localization and abundance of SiPIP2;1-GFP (Figure 1b), yeast expressing SiPIP2;1 did not show any protection to freeze-thaw treatments (Figure 1c). On the other hand, SiPIP2;4, 2;5, and 2;7 all showed some level of protection, indicating that they permeated water and were functional within the plasma membrane of yeast cells. For detailed characterization of water permeability, SiPIP2;7 was expressed in Xenopus laevis oocytes. Swelling assay confirmed that SiPIP2;7 is a functional water channel (Figure 1—figure supplement 4).
Expression of SiPIP2;7 in mesophyll cells of S. viridis
To confirm and exploit the CO2 permeability characteristic of SiPIP2;7 in planta, we created transgenic S. viridis plants expressing SiPIP2;7 with a C-terminal FLAG-tag fusion and under the control of the mesophyll-preferential Z. mays PEPC promoter (Gupta et al., 2020; Salesse-Smith et al., 2018). Out of 52 T0 plants analyzed for SiPIP2;7-FLAG protein abundance and the hygromycin phosphotransferase (hpt) gene copy number (Figure 2—figure supplement 1), lines 27, 44, and 52 were selected for further analysis because they had the strongest FLAG signal per transgene insertion number. Immunodetection of FLAG and photosynthetic proteins was performed on leaves of homozygous transgenic plants (Figure 2a); azygous plants of line 44 were used as control hereafter. Monomeric and dimeric SiPIP2;7-FLAG was detected in all transgenic plants (Figure 2—figure supplement 1) and abundance of the prevalent dimeric form was used for relative quantification of SiPIP2;7 abundance (Figure 2a). Plants of line 44 had the highest production of SiPIP2;7-FLAG whilst plants of lines 27 and 52 accumulated about 2–4 times less of this protein. Immunodetection of FLAG on leaf cross-sections, visualized with confocal microscopy, confirmed partial localization of SiPIP2;7-FLAG to the plasma membrane of mesophyll cells (Figure 2c). Transcript analysis confirmed highly elevated expression of SiPIP2;7-FLAG in leaves but not in roots of transgenic lines and showed no changes in expression level of closely related SiPIP2;6 (Figure 2—figure supplement 2).
Figure 2 with 2 supplements see all
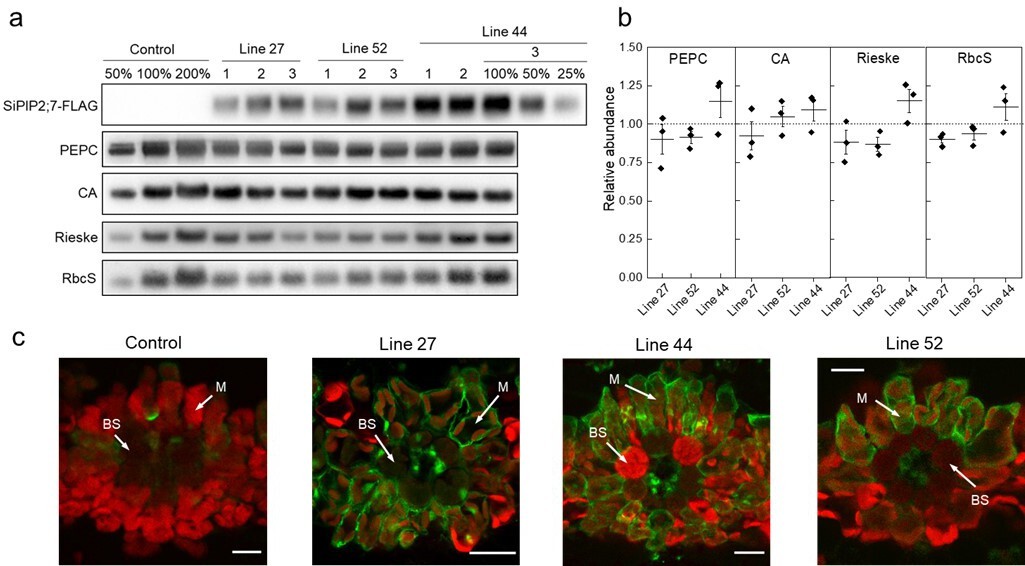
Characterization of Setaria viridis plants expressing SiPIP2;7-FLAG in mesophyll cells.
(a) Immunodetection of SiPIP2;7-FLAG and photosynthetic proteins in leaf protein samples loaded on leaf area basis. Three plants from each of the three transgenic lines were analyzed and dilution series of the control and line 44-3 samples were used for relative quantification. (b) Protein abundances calculated from the immunoblots relative to control plants. Mean±SE. No significant difference was found between the transgenic and control plants (t-test). (c) Immunolocalization of SiPIP2;7-FLAG on leaf cross-sections visualized with confocal microscopy. Fluorescence signals are pseudo-colored: green – FLAG antibodies labelled with secondary antibodies conjugated with Alexa Fluor 488; red – chlorophyll autofluorescence. BS, bundle sheath cell; M, mesophyll cell. Scale bars = 20 µm. Azygous plants of line 44 were used as control. Uncropped images of the blots are provided in Figure 2—source data 1.
-
Figure 2—source data 1
Uncropped images of western blots.
- https://cdn.elifesciences.org/articles/70095/elife-70095-fig2-data1-v2.docx
Abundances of photosynthetic proteins PEPC, CA, the Rieske subunit of the Cytochrome b6f complex, and the small subunit of Rubisco (RbcS), did not differ between transgenic and control plants (Figure 2a). In line with the immunoblotting results, measured activities of PEPC and CA, and the amount of Rubisco active sites were not altered in the transgenic plants (Table 1). Chlorophyll content, leaf dry weight per area, and biomass of roots and shoots did not differ between the genotypes either (Table 1).
Table 1
Properties of Setaria viridis plants expressing SiPIP2;7-FLAG in mesophyll cells.
PEPC, PEP carboxylase; Rubisco, ribulose bisphosphate carboxylase oxygenase; LMA, leaf mass per area. Azygous plants of line 44 were used as control. Mean±SE, n=3 except for biomass (n=8). Three-weeks old plants before flowering were used for all analyses. No significant difference was found between the transgenic and control plants (one-way ANOVA, α=0.05).
| Parameter | Control | Line 27 | Line 44 | Line 52 |
|---|---|---|---|---|
| PEPC activity, µmol CO2 m–2 s–1 | 220.1±25.8 | 197.6±12.7 | 208.7±7.9 | 218.5±3.5 |
| CA hydration rate, mol m–2 s–1 bar–1 | 6.50±0.10 | 6.32±0.22 | 5.34±0.67 | 5.35±0.56 |
| Rubisco active sites, µmol m–2 | 12.17±0.63 | 12.53±0.54 | 12.84±0.13 | 12.63±0.74 |
| Chlorophyll (a+b), mmol m–2 | 0.71±0.07 | 0.72±0.04 | 0.72±0.05 | 0.72±0.08 |
| Chlorophyll a/b | 5.01±0.16 | 5.08±0.05 | 4.97±0.09 | 5.07±0.15 |
| LMA, g (dry weight) m–2 | 23.6±1.6 | 24.0±1.5 | 25.6±1.3 | 25.4±1.3 |
| Shoot biomass, g (dry weight) plant–1 | 2.06±0.36 | 2.01±0.20 | 2.23±0.31 | 2.24±0.34 |
| Root biomass, g (dry weight) plant–1 | 0.27±0.07 | 0.28±0.03 | 0.34±0.06 | 0.35±0.05 |
To study the impact of SiPIP2;7-FLAG expression on the photosynthetic properties in transgenic plants, we conducted concurrent gas exchange and chlorophyll fluorescence analyses at different intercellular CO2 partial pressures (Ci) (Figure 3). No significant changes were detected between transgenic and control plants in CO2 assimilation rates (A), effective quantum yield of Photosystem II (φPSII) or stomatal conductance to water vapor (Figure 3—figure supplement 1). The SiPIP2;7-FLAG protein abundance was compared to the gas exchange phenotype in individual plants (Figure 3—figure supplement 2). A statistically significant polynomial relationship (R2=0.345, p<0.05) was found between the initial slopes and the relative protein content, which was significantly better than that achieved using a linear model (p<0.05). No significant relationship was observed between the SiPIP2;7-FLAG abundance and the saturating rates of assimilation (Amax; Figure 3—figure supplement 2).
Figure 3 with 2 supplements see all

CO2 response of CO2 assimilation rate (a) and quantum yield of Photosystem II (b) in Setaria viridis plants expressing SiPIP2;7-FLAG in mesophyll cells.
Measurements were performed at the irradiance of 1500 µmol m−2 s−1; azygous plants of line 44 were used as control. Mean±SE, n=4–6 biological replicates. No significant difference was found between the transgenic and control plants (one-way ANOVA, α=0.05).
-
Figure 3—source data 1
Gas exchange and fluorescence analysis.
- https://cdn.elifesciences.org/articles/70095/elife-70095-fig3-data1-v2.xlsx
Mesophyll conductance to CO2 in plants expressing SiPIP2;7
Next, we analyzed in detail the initial slopes of the ACi curves and mesophyll conductance. Fitting linear regressions indicated that mean±SE values of the initial slopes of the ACi curves for lines 27, 44, and 52 were 0.46±0.03, 0.52±0.01, and 0.53±0.05, respectively, compared to the value of 0.41±0.02 in control plants (Figure 4a). Measurements of ∆18O were used to estimate conductance of CO2 from the intercellular airspace to the sites of CO2 and H2O exchange in the mesophyll cytosol (gm) with the assumption that CO2 was in full isotopic equilibrium with leaf water in the cytosol (Barbour et al., 2016; Osborn et al., 2017). Transgenic lines showed mesophyll conductance of 0.59±0.05, 0.55±0.08, and 0.46±0.04 mol m–2 s–1 bar–1 compared to the mean±SE value of 0.42±0.03 mol m–2 s–1 bar–1 in control plants (Figure 4b). Two-way ANOVA analysis with Tukey post hoc test on the initial slopes of the ACi curves and gm showed that differences measured in plants of lines 27 and 44 were statistically significant from the control plants (p=0.04573 and 0.03724, respectively). Interestingly, for plants of line 52, only initial slopes were significantly different compared to control plants when compared by one-way ANOVA (Tukey post hoc test, α=0.05, p=0.02993).
Figure 4 with 1 supplement see all
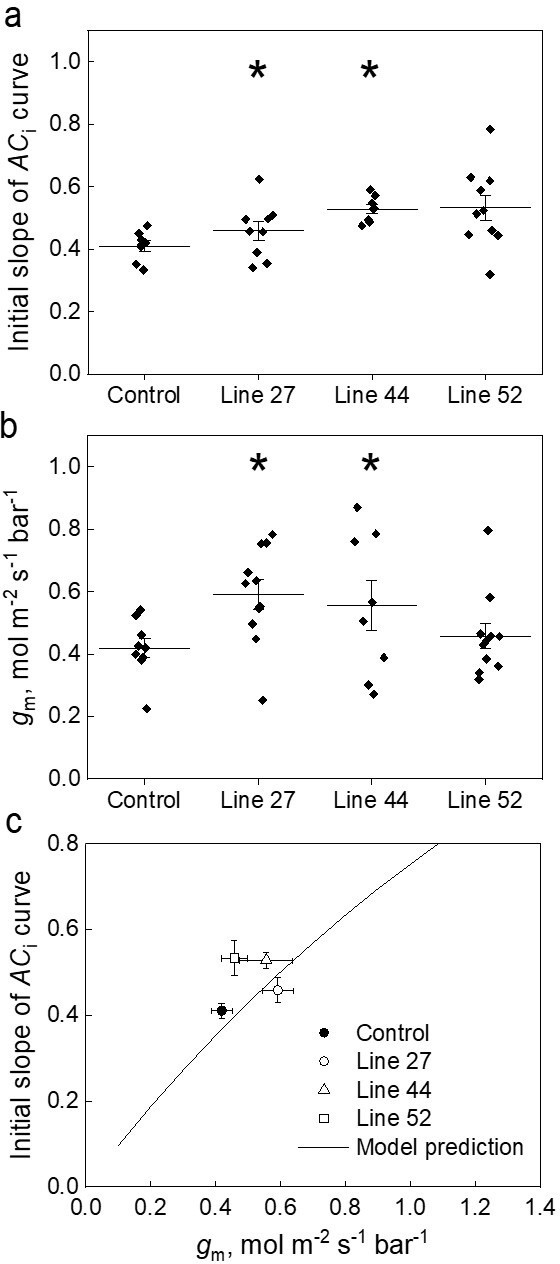
Effect of the mesophyll conductance, gm, on the initial slope of the CO2 assimilation response curve to the intercellular CO2 partial pressure (ACi curve) in leaves of Setaria viridis expressing SiPIP2;7-FLAG in mesophyll cells.
(a) Initial slope of the ACi curves estimated by linear fitting of curves (a subset of curves is presented in Figure 3a inset). (b) Mesophyll conductance, gm, estimated by oxygen isotope discrimination assuming full isotopic equilibrium (Osborn et al., 2017). Measurements were made at ambient CO2 and low O2. (c) Data from (a) and (b) compared to the C4 biochemical model predictions (von Caemmerer, 2000; von Caemmerer and Furbank, 1999). All graphs show Mean±SE; azygous plants of line 44 were used as control. The model relates the initial slope of the ACi curve (dA/Ci) to gm by: , where Vpmax and Kp denote the maximum PEPC activity and the Michaelis Menten constant for CO2 taken here as 250 µmol m–2 s–1 and 82 µbar (DiMario and Cousins, 2019; von Caemmerer, 2021). Asterisks indicate statistically significant differences between the plants of lines 27 (p=0.04573) and 44 (p=0.03724) and control plants (two-way ANOVA with Tukey post hoc test, α=0.05). Plants of line 52 were not significantly different from the control plants (p=0.27518).
We also used the gm calculations proposed by Ogée et al., 2018 which try to account for the rates of bicarbonate consumption by CA. The CA hydration constant (kCA) of 6.5 mol m–2 s–1 bar–1 was used for these calculations (Table 1). We found that the gm measured with this method gave on average 1.25 times greater values but did not change the ranking of mesophyll conductance shown in Figure 4a (Figure 4—figure supplement 1). The C4 photosynthetic model by von Caemmerer and Furbank, 1999 and von Caemmerer, 2000 relates the initial slope of the CO2 response curve (dA/Ci) to gm (see Figure 4 caption and Materials and methods). Figure 4c shows that the measured relationship between the initial slope and gm fits closely with model prediction.
Discussion
The diffusion of CO2 from the Earth’s atmosphere to the site of primary carboxylation within leaves of C3 and C4 plants often limits photosynthesis and impacts the efficient use of water. Overexpression of CO2 permeable aquaporins with the aim to enhance leaf CO2 diffusion has been extensively probed in C3 plants. Many studies have demonstrated that it was an effective strategy to improve gm, leading to increased assimilation rate or grain yield (Flexas et al., 2006; Hanba et al., 2004; Uehlein et al., 2003; Xu et al., 2019). However, some published research could not identify a functional link between the CO2 permeable aquaporins and mesophyll conductance, and possible explanations include functional redundancy between aquaporin isoforms (Kromdijk et al., 2020) and complications of expressing membrane proteins in the chloroplast envelope (Fernández-San Millán et al., 2018). In contrast to C3 plants, where CO2 needs to cross both plasma membrane and the chloroplast envelope to reach the site of carboxylation, the primary carboxylation step in C4 plants occurs in the cytosol of mesophyll cells. Due to high photosynthetic rates of C4 plants, this generates a large CO2 drawdown between the intercellular airspaces and the cytosol and thus a large mesophyll conductance (Evans and Von Caemmerer, 1996). Because only one membrane needs to be traversed by CO2, C4 plants could serve as a simpler model to demonstrate the effect of CO2 permeable aquaporins on photosynthesis.
Screening S. italica PIPs for CO2 permeability in a yeast heterologous system resulted in identification of SiPIP2;7 as a CO2 pore (Figure 1c). Expression analysis revealed that SiPIP2;7 was almost exclusively expressed in roots under ideal conditions (Figure 1a, Figure 2—figure supplement 2) which, combined with the water permeability identified in yeast and oocyte assays (Figure 1d, Figure 1—figure supplement 4), suggest that SiPIP2;7 may function in regulating root hydraulic conductivity, a role extensively documented for PIP aquaporins (Gambetta et al., 2017; McGaughey et al., 2018). The physiological relevance of SiPIP2;7’s CO2 permeating capacity is not immediately clear. Gas uptake by roots is well documented (Stemmet et al., 1962) and in C3 plants CO2 uptake by roots may contribute to the C4 photosynthesis-like metabolism detected in stems and petioles (Hibberd and Quick, 2002). It is possible that SiPIP2;7 is conditionally expressed in leaves, or even that its capacity to transport CO2 is inadvertent and related to the transportation of another yet undetermined substrate; analogous to the uptake of toxic metalloids by some NIP aquaporins due to their capacity to transport boron (Mukhopadhyay et al., 2014). Further work is needed to determine whether PIPs in general function natively as relevant CO2 pores in C4 leaves.
We employed the CO2 transport capacity of SiPIP2;7 to enhance transmembrane CO2 diffusion from the intercellular airspace into the mesophyll cytosol, where CA and PEPC reside, by overexpressing SiPIP2;7 in S. viridis. We confirmed the localization of SiPIP2;7 within the mesophyll plasma membranes (Figure 2c) and detected the increase in CO2 diffusion across the mesophyll membranes in transgenic plants by two independent methods. First, we calculated gm from the C18O16O discrimination measurements (Figure 4b) and the theory for these calculations has been outlined (Barbour et al., 2016; Ogée et al., 2018; Osborn et al., 2017). Second, we fitted linear regressions to the initial slopes of the ACi curves (Figure 4a), which depend on gm, Vpmax, and Kp where the two latter parameters denote the maximum PEPC activity and the Michaelis Menten constant of PEPC for HCO3− (von Caemmerer, 2000; von Caemmerer and Furbank, 1999). Since PEPC and CA activities were not altered in plants expressing SiPIP2;7 (Table 1), higher initial slopes of the ACi curves in transgenic lines were attributed to the increased gm. When plotted against each other, the initial slopes and gm in transgenic and control plants, fitted the model predictions confirming the hypothesized functional role of gm in C4 photosynthesis (Pfeffer and Peisker, 1995; Ubierna et al., 2017; von Caemmerer, 2000). Importantly, and in line with the model predictions, expression of SiPIP2;7 had an effect only on the initial slopes of the ACi curves but not on the saturating rates of assimilation (Figure 3—figure supplement 2).
Our findings demonstrate that CO2 permeable aquaporins can enhance CO2 diffusion at the airspace/mesophyll interface in C4 plants. However, overexpression of aquaporins is likely accompanied by confounding factors which could explain the lack of phenotype observed from the plants with the highest SiPIP2;7 expression level (Figure 3—figure supplement 2) and plants of line 52 showing significant increase of only initial slopes (Figure 4). These factors possibly include the transport of multiple substrate(s) by SiPIP2;7 and different efficiency of SiPIP2;7 targeting to the plasma membrane between the individual lines, plants, leaves, and even between different mesophyll cells. Moreover, it is still not clear whether there are other CO2-permeable aquaporins present in S. viridis leaves that account for the basal gm level of 0.42±0.03 mol m–2 s–1 bar–1 in control plants. Further research is required to unravel the aforementioned confounding factors. Nevertheless, building on our findings that increasing mesophyll conductance is possible with overexpression of SiPIP2;7, this trait will be a strong candidate to combine with complementary traits such as the overexpressing of Cytochrome b6f (Ermakova et al., 2019) and Rubisco (Salesse-Smith et al., 2018), which offer improvements to photosynthesis in C4 plants.
Materials and methods
Heterologous expression in yeast
Request a detailed protocolcDNAs encoding the 12 S. italica aquaporins (Supplementary file 1) and human CARBONIC ANHYDRASE II (hCAII, AK312978) were codon-optimized for expression in yeast with IDT DNA tool (https://sg.idtdna.com/pages/tools) and a yeast-related Kozak sequence was added at the 5′ end to help increase translation (Nakagawa et al., 2008). For CO2 permeability measurements, pSF-TPI1-URA3 with an aquaporin and pSF-TEF1-LEU2 with hCAII were co-transformed into the S. cerevisiae strain INVSc1 (Thermo Fisher Scientific, Waltham, MA). For water permeability measurements, pSF-TPI1-URA3 with an aquaporin was transformed into the aqy1/2 double mutant yeast strain deficient in aquaporins (Suga and Maeshima, 2004). The yeast vectors pSF-TPI1-URA3 and pSF-TEF1-LEU2 were obtained from Oxford Genetics (Oxford, UK). Yeast transformation was performed using the Frozen-EZ yeast transformation II kit (Zymo Research, Irvine, CA) and selection of positive transformants was based on amino acid complementation. To ensure CA was not limiting, CA activity was determined using a membrane inlet mass spectrometry as described by Endeward et al., 2006 (Figure 1—figure supplement 2). For CO2 permeability measurements, an average cell diameter of 4.63 µm was determined by measuring ~100 yeast cells expressing each aquaporin (Figure 1—figure supplement 2). To study the subcellular localizations of aquaporins in yeast, a C-terminus GFP tag was added to the sequences into the pSF-TPI1-URA3 vector (pSF-TPI1-URA3-GFP). The fluorescence signal was observed using a Zeiss 780 confocal laser scanning microscope (Zeiss, Oberkochen, Germany): excitation 488 nm and emission 530 nm. Cytosolic GFP expression was used as control.
CO2 induced intracellular acidification assay
Request a detailed protocolCO2 intracellular acidification was measured in yeast cells loaded with fluorescein diacetate (Sigma-Aldrich, St. Louis, MO) as described previously (Bertl and Kaldenhoff, 2007; Otto et al., 2010). Briefly, an overnight culture of yeast cells was collected and resuspended in an equal volume of 50 mM 4-(2-hydroxyethyl)-1-piperazineethanesulfonic acid (HEPES)-NaOH, pH 7.0, 50 µM fluorescein diacetate and incubated for 30 min in the dark at 37°C. The suspension was centrifuged and the pellet resuspended in ice-cold incubation buffer (25 mM HEPES-NaOH, pH 6.0, 75 mM NaCl). Cells loaded with fluorescein diacetate were then injected into the stopped-flow spectrophotometer (DX.17MV; Applied Photophysics, Leatherhead, UK) alongside a buffer solution (25 mM HEPES, pH 6.0, 75 mM NaHCO3, bubbled with CO2 for 2 hr). The kinetics of acidification was measured at 490 nm excitation and >515 nm emission (OG515 long pass filter, Schott, supplied by Applied Photophysics). Data were collected over a time interval of 0.2 s and analyzed using ProData SX viewer software (Applied Photophysics). CO2 permeability was determined using the method of Yang et al., 2000. An average of 75 injections over at least three separate cultures was used for each aquaporin.
Determination of water permeability
Request a detailed protocolA freeze-thaw yeast assay was used to determine water permeability of aquaporins expressed in aqy1/2 based on previous reports (Tanghe et al., 2002). Briefly, an overnight culture was diluted to ~6×10⁶ cells (final volume 1 ml) in appropriate selection liquid growth medium and incubated at 30°C for 1 hr. 250 µl of each culture were then aliquoted into two standard 1.5 ml microtubes: the first (control) tube was placed on ice and the second tube was subject to a single freeze-thaw treatment, consisting of 30 s freezing in liquid nitrogen and thawing for 20 min in a 30°C water bath. Following the treatment, the cells were placed on ice. The tubes were then vortexed briefly to ensure even suspension of cells and 200 µl of the culture was transferred to wells of a Nunc-96 400 µl flat bottom untreated plate (Thermo Fisher Scientific, Cat#243656). Yeast growth in control and treated cultures were monitored over a 24–30 hr period in an M1000 Pro plate reader (TECAN, Männedorf, Switzerland) at 30°C with double orbital shaking at 400 rpm and measuring absorbance at 650 nm every 10 min. Growth data were log-transformed and freeze-thaw survival calculated as the growth (area under the curve) of treated culture relative to its untreated control from time zero up until the untreated control culture reached stationary phase.
For swelling assays, the coding sequence of SiPIP2;7 was cloned into pGEMHE oocyte expression vector using LR clonase II (Thermo Fisher Scientific) and cRNA was synthesized with mMessage mMachine T7 Transcription Kit (Thermo Fisher Scientific). X. laevis oocytes were injected with 46 nl of RNAse-free water with either no cRNA or 23 ng cRNA with a micro-injector Nanoinject II (Drummond Scientific, Broomall, PA). Post-injection oocytes were stored at 18°C in a Low Na+ Ringer’s solution (62 mM NaCl, 36 mM KCl, 5 mM MgCl2, 0.6 mM CaCl2, 5 mM HEPES, 5% [v/v] horse serum [H-1270, Sigma-Aldrich] and antibiotics: 0.05 mg ml−1 tetracycline, 100 units ml−1 penicillin/0.1 mg ml−1 streptomycin), pH 7.6 for 24–30 hr. Photometric swelling assay was performed 24–30 hr post-injection (Qiu et al., 2020).
Construct assembly and S. viridis transformation
Request a detailed protocolThe coding sequence of S. viridis PIP2;7 (Sevir.2G128300.1, Phytozome, https://phytozome.jgi.doe.gov/) has been codon optimized for the Golden Gate cloning (Engler et al., 2014) and translationally fused with the glycine linker and the FLAG-tag coding sequence (Hopp et al., 1988). The resulting coding sequence was assembled with the Z. mays PEPC promoter and the bacterial tNos terminator into the second expression module of the pAGM4723 binary vector. The first expression module has been occupied by the hygromycin phosphotransferase (hpt) gene assembled with the Oryza sativa Actin-1 promoter and the tNos terminator. The construct was transformed into S. viridis cv. MEO V34-1 using Agrobacterium tumefaciens strain AGL1 following the procedure described in Osborn et al., 2017. T0 plants resistant to hygromycin were transferred to soil and analyzed for SiPIP2;7-FLAG protein abundance and hpt insertion number by droplet digital PCR (iDNA Genetics, Norwich, UK). Lines 27, 44, and 52 were selected for further analysis because they had the strongest FLAG signal per transgene insertion number (Figure 2—figure supplement 1). The T1 and T2 progenies of T0 plants 27, 44, and 52 were analyzed. Azygous T1 plants of line 44 and their progeny were used as control.
Plant growth conditions
Request a detailed protocolSeeds were surface-sterilized and germinated on medium (pH 5.7) containing 2.15 g L−1 Murashige and Skoog salts, 10 ml L−1 100× Murashige and Skoog vitamins stock, 30 g L−1 sucrose, 7 g L−1 Phytoblend, 20 mg L−1 hygromycin (no hygromycin for azygous plants). Seedlings that developed secondary roots were transferred to 0.6 L pots with garden soil mix layered on top with 2 cm seed raising mix (Debco, Tyabb, Australia) both containing 1 g L−1 Osmocote (Scotts, Bella Vista, Australia). Plants were grown in controlled environmental chambers with 16 hr light/8 hr dark, 28°C day, 22°C night, 60% humidity, and ambient CO2 concentrations. Light intensity of 300 µmol m−2 s−1 was supplied by 1000 W red sunrise 3200K lamps (Sunmaster Growlamps, Solon, OH). Youngest fully expanded leaves of the 3–4 weeks plants before flowering were used for all analyses.
Chlorophyll and enzyme activity
Request a detailed protocolChlorophyll content was measured on frozen leaf discs homogenized with a TissueLyser II (Qiagen, Venlo, The Netherlands) (Porra et al., 1989). PEPC activity was determined after Pengelly et al., 2010 from fresh leaf extracts from the plants adapted for 1 hr to 800 µmol photons m–2 s–1. CA activity was measured on a membrane inlet mass spectrometer as a rate of 18O exchange from labeled 13C18O2 to H216O at 25°C according to Von Caemmerer et al., 2004 by calculating the hydration rate after Jenkins et al., 1989. The amount of Rubisco active sites was determined by [14C] carboxyarabinitol bisphosphate binding as described earlier (Ruuska et al., 2000).
RNA isolation and qPCR
Request a detailed protocolLeaf and root tissue were frozen in liquid N2. Leaf samples were homogenized using a TissueLyser II and RNA was extracted using the RNeasy Plant Mini Kit (Qiagen). Roots were ground with mortar and pestle in liquid N2 and RNA was isolated according to Massey, 2012. Briefly, 150 µl of pre-heated (60°C) extraction buffer (0.1 M trisaminomethane (Tris)-HCl, pH 8.5 mM ethylenediaminetetraacetic acid [EDTA], 0.1 M NaCl, 0.5% sodium dodecyl sulfate [SDS], 1% 2-mercaptoethanol) was added to ~100 mg of fine root powder and incubated at 60°C for 5 min. 150 µl of phenol:chloroform:isoamyl alcohol (25:24:1) saturated with 10 mM Tris (pH 8.0) and 1 mM EDTA was added to the samples, vortexed vigorously for 10 min and centrifuged at 4500×g for 15 min. Aqueous phase was mixed with 120 µl of isopropanol and 15 µl of 3 M sodium acetate and incubated at –80°C for 15 min, then centrifuged at 4500×g (30 min, 4°C). The pellet was washed two times in 300 µl of ice-cold 70% ethanol, air-dried, and dissolved in 60 µl of RNase-free water. After addition of 40 µl of 8 M LiCl, samples were incubated overnight at 4°C. Nucleic acids were pelleted by centrifugation at 16,000×g (60 min, 4°C), washed two times with 200 µl of ice-cold 70% ethanol, air-dried, and dissolved in RNase-free water. DNA from the samples was removed using an Ambion TURBO DNA-free Kit (Thermo Fisher Scientific), and RNA quality was determined using a NanoDrop (Thermo Fisher Scientific). 100 ng of total RNA were reverse transcribed into cDNA using a SuperScript III Reverse Transcriptase (Thermo Fisher Scientific). qPCR and melt curve analysis were performed on a Viia7 Real-Time PCR System (Thermo Fisher Scientific) using the Power SYBR Green PCR Master Mix (Thermo Fisher Scientific) according to the manufacturer’s protocol. Primer pairs designed to distinguish between S. viridis PIP2;6 and PIP2;7 using Primer3 in Geneious Prime (https://www.geneious.com) and reference primers are listed in Supplementary file 3.
Western blotting and immunolocalization
Request a detailed protocolProtein isolation from leaves and gel electrophoresis were performed as described earlier (Ermakova et al., 2019). Proteins were probed with antibodies against FLAG (ab49763, 1:5000, Abcam, Cambridge, UK), RbcS (Martin-Avila et al., 2020) (1:10,000), Rieske (AS08 330, 1:3000, Agrisera, Vännäs, Sweden), PEPC (AS09 458, 1:10,000, Agrisera), CA (Azad et al., 2016; Ludwig et al., 1998) (1:10,000). Quantification of immunoblots was performed with Image Lab software (Bio-Rad, Hercules, CA). For immunolocalization, leaf tissue was fixed and probed with primary antibodies against FLAG (1:40) and secondary goat anti-mouse Alexa Fluor 488-conjugated antibodies (ab150113, 1:200, Abcam) as described in Ermakova et al., 2021. Images were captured with a Zeiss 780 microscope using ZEN 2012 software (Black edition, Zeiss, Oberkochen, Germany). Images for plants of lines 27, 44, and azygous plants were acquired using online fingerprinting (488 nm excitation) with three user-defined spectral profiles for Alexa Fluor 488, endogenous autofluorescence, and chlorophyll. The spectral profile for endogenous autofluorescence was derived from the azygous control. The image for line 52 was initially collected as a full spectral scan (490–660 nm), then linearly un-mixed using the same online fingerprint settings as previously described. Images were post-processed with FIJI (Schindelin et al., 2012), and histograms for all images were min-max adjusted.
Gas exchange measurements
Request a detailed protocolGas exchange and fluorescence analyses were performed at an irradiance of 1500 µmol m−2 s−1 (90% red/10% blue actinic light) and different intercellular CO2 partial pressures using a LI-6800 (LI-COR Biosciences, Lincoln, NE) equipped with a fluorometer head 6800-01A (LI-COR Biosciences). Leaves were first equilibrated at 400 ppm CO2 in the reference side, leaf temperature 25°C, 60% humidity, and flow rate of 500 µmol s−1 and then a stepwise increase of CO2 concentrations from 0 to 1600 ppm was imposed at 3-min intervals. Initial slopes of the CO2 response curves were determined by linear fitting in OriginPro 2018b (OriginLab, Northampton, MA). Quantum yield of PSII upon the application of multiphase saturating pulses (8000 µmol m−2 s−1) was calculated according to Genty et al., 1989.
C18O16O discrimination measurements
Request a detailed protocolSimultaneous measurements of exchange of CO2, H2O, C18O16O, and H218O were made by coupling two LI-6400XT gas exchange systems (LI-COR Biosciences) to a tunable diode laser (TDL; model TGA200A, Campbell Scientific Inc, Logan, UT) to measure C18O16O discrimination and a Cavity Ring-Down Spectrometer (L2130-i, Picarro Inc, Sunnyvale, CA) to measure the oxygen isotope composition of water vapor (Osborn et al., 2017). Measurements were made at 2% O2, 380 µmol mol–1 CO2, leaf temperature of 25°C, irradiance of 1500 µmol m–2 s–1, and relative humidity of 55%. Each leaf was measured at 4 min intervals and 10 readings were taken. Mesophyll conductance was calculated as described by Osborn et al., 2017 with the assumptions that there was sufficient CA in the mesophyll cytosol for isotopic equilibration between CO2 and HCO3−. We also used calculations proposed by Ogée et al., 2018 to estimate gm. These calculations try to account for the rates of bicarbonate consumption by CA. We used the rate constant of CA hydration (kCA) of 6.5 mol m–2 s–1 bar–1 for these calculations.
Statistical analysis
Request a detailed protocolOne-way and two-way ANOVAs with Tukey post hoc test were performed in OriginPro 2018b. A two-tailed, heteroscedastic Student’s t-tests were performed in Microsoft Excel. Linear modeling was performed in R (R Development Core Team, 2021); mixed-effects models to test the need to incorporate transgenic event and copy status was performed in lme4 (Bates et al., 2015).
Data availability
All data generated or analysed during this study are included in the manuscript and supporting files.
References
-
Fitting Linear Mixed-Effects Models Using lme4Journal of Statistical Software 67:1–48.https://doi.org/10.18637/jss.v067.i01
-
Setaria viridis : A Model for C4 PhotosynthesisThe Plant Cell 22:2537–2544.https://doi.org/10.1105/tpc.110.075309
-
Aquaporins constitute a large and highly divergent protein family in maizePlant Physiology 125:1206–1215.https://doi.org/10.1104/pp.125.3.1206
-
A single serine to alanine substitution decreases bicarbonate affinity of phosphoenolpyruvate carboxylase in C4Flaveria trinerviaJournal of Experimental Botany 70:995–1004.https://doi.org/10.1093/jxb/ery403
-
A golden gate modular cloning toolbox for plantsACS Synthetic Biology 3:839–843.https://doi.org/10.1021/sb4001504
-
Installation of C4 photosynthetic pathway enzymes in rice using a single constructPlant Biotechnology Journal 19:575–588.https://doi.org/10.1111/pbi.13487
-
Carbon Dioxide Diffusion inside LeavesPlant Physiology 110:339–346.https://doi.org/10.1104/pp.110.2.339
-
Physiological performance of transplastomic tobacco plants overexpressing aquaporin AQP1 in chloroplast membranesJournal of Experimental Botany 69:3661–3673.https://doi.org/10.1093/jxb/ery148
-
Aquaporins and root water uptakeIn Plant Aquaporins 1:133–153.https://doi.org/10.1007/978-3-319-49395-4_6
-
The relationship between the quantum yield of photosynthetic electron transport and quenching of chlorophyll fluorescenceBiochimica et Biophysica Acta (BBA) - General Subjects 990:87–92.https://doi.org/10.1016/S0304-4165(89)80016-9
-
Carbon dioxide and water transport through plant aquaporinsPlant, Cell & Environment 40:938–961.https://doi.org/10.1111/pce.12844
-
Expression and characterization of plasma membrane aquaporins in stomatal complexes of Zea maysPlant Molecular Biology 86:335–350.https://doi.org/10.1007/s11103-014-0232-7
-
Mechanisms underlying CO2 diffusion in leavesCurrent Opinion in Plant Biology 15:276–281.https://doi.org/10.1016/j.pbi.2012.01.011
-
Photosynthetic efficiency and mesophyll conductance are unaffected in Arabidopsis thaliana aquaporin knock-out linesJournal of Experimental Botany 71:318–329.https://doi.org/10.1093/jxb/erz442
-
MEGA X: Molecular Evolutionary Genetics Analysis across Computing PlatformsMolecular Biology and Evolution 35:1547–1549.https://doi.org/10.1093/molbev/msy096
-
ThesisUnderstanding betalain regulation in floral and vegetative tissues of Ptilotus cultivarsThe University of Queensland, School of Agriculture and Food Sciences.
-
Roles of aquaporins in Setaria viridis Stem Development and Sugar StorageFrontiers in Plant Science 7:1815.https://doi.org/10.3389/fpls.2016.01815
-
Regulating Root aquaporin Function in Response to Changes in SalinityIn Annual Plant Reviews Online 4:381–416.https://doi.org/10.1002/9781119312994
-
CO2 transport by PIP2 aquaporins of barleyPlant & Cell Physiology 55:251–257.https://doi.org/10.1093/pcp/pcu003
-
Aquaglyceroporins: generalized metalloid channelsBiochimica et Biophysica Acta 1840:1583–1591.https://doi.org/10.1016/j.bbagen.2013.11.021
-
Effects of reduced carbonic anhydrase activity on CO2 assimilation rates in Setaria viridis: a transgenic analysisJournal of Experimental Botany 68:299–310.https://doi.org/10.1093/jxb/erw357
-
Aquaporin tetramer composition modifies the function of tobacco aquaporinsThe Journal of Biological Chemistry 285:31253–31260.https://doi.org/10.1074/jbc.M110.115881
-
Growth of the C4 dicot Flaveria bidentis: photosynthetic acclimation to low light through shifts in leaf anatomy and biochemistryJournal of Experimental Botany 61:4109–4122.https://doi.org/10.1093/jxb/erq226
-
Prediction of aquaporin function by integrating evolutionary and functional analysesThe Journal of Membrane Biology 247:107–125.https://doi.org/10.1007/s00232-013-9618-8
-
BookIn vivo Km for CO2 (Kp) of phosphoenolpyruvate carboxylase (PEPC) and mesophyll CO2 transport resistance (rm) in leaves of Zea mays L.In: Mathis P, editors. Photosynthesis: From Light to Biosphere, Vol. 58. Kluwer Academic Publishers. pp. 547–550.https://doi.org/10.1007/978-94-009-0173-5
-
Determination of accurate extinction coefficients and simultaneous equations for assaying chlorophylls a and b extracted with four different solvents: verification of the concentration of chlorophyll standards by atomic absorption spectroscopyBiochimica et Biophysica Acta (BBA) - Bioenergetics 975:384–394.https://doi.org/10.1016/S0005-2728(89)80347-0
-
Phosphorylation influences water and ion channel function of AtPIP2;1Plant, Cell & Environment 43:2428–2442.https://doi.org/10.1111/pce.13851
-
SoftwareR: A language and environment for statistical computingR Foundation for Statistical Computing, Vienna, Austria.
-
Fiji: an open-source platform for biological-image analysisNature Methods 9:676–682.https://doi.org/10.1038/nmeth.2019
-
The uptake of carbon dioxide by plant rootsPlant and Soil 17:357–364.https://doi.org/10.1007/BF01377673
-
Aquaporin expression correlates with freeze tolerance in baker’s yeast, and overexpression improves freeze tolerance in industrial strainsApplied and Environmental Microbiology 68:5981–5989.https://doi.org/10.1128/AEM.68.12.5981-5989.2002
-
Adaptable and Multifunctional Ion-Conducting aquaporinsAnnual Review of Plant Biology 72:703–736.https://doi.org/10.1146/annurev-arplant-081720-013608
-
BookPlant aquaporins and CO2In: Chaumont F, Tyerman SD, editors. Plant Aquaporins: From Transport to Signaling. Cham: Springer International Publishing. pp. 255–265.
-
BookModelling C4 photosynthesisIn: Sage RF, Monson RK, editors. The Biology of C4 Photosynthesis. London: Academic Press. pp. 173–211.
-
BookBiochemical Models of Leaf PhotosynthesisCSIRO: CSIRO Publishing.https://doi.org/10.1071/9780643103405
-
Carbonic anhydrase and C4 photosynthesis: a transgenic analysisPlant, Cell and Environment 27:697–703.https://doi.org/10.1111/j.1365-3040.2003.01157.x
-
Strategies for improving C4 photosynthesisCurrent Opinion in Plant Biology 31:125–134.https://doi.org/10.1016/j.pbi.2016.04.003
-
Overexpression of rice aquaporin OsPIP1;2 improves yield by enhancing mesophyll CO2 conductance and phloem sucrose transportJournal of Experimental Botany 70:671–681.https://doi.org/10.1093/jxb/ery386
-
Carbon dioxide permeability of aquaporin-1 measured in erythrocytes and lung of aquaporin-1 null mice and in reconstituted proteoliposomesThe Journal of Biological Chemistry 275:2686–2692.https://doi.org/10.1074/jbc.275.4.2686
Article and author information
Author details
Samantha McGaughey

Hugo Alonso-cantabrana
Susanne von Caemmerer
Funding
Australian Research Council (CE140100015)
- Robert T Furbank
Australian Research Council (CE140100015)
- Susanne von Caemmerer
Western Sydney University (VC Fellowship)
- Robert E Sharwood
Australian Research Council (DE130101760)
- Robert E Sharwood
The funders had no role in study design, data collection and interpretation, or the decision to submit the work for publication.
Acknowledgements
The authors thank Xueqin Wang for Setaria viridis transformation, Zac Taylor for gas exchange measurements, Murray Badger and Dimitri Tolleter for measuring CA activity in yeast, Daryl Webb, Ayla Manwaring and the Centre for Advanced Microscopy at the Australian National University for confocal imaging, Wendy Sullivan for help with the stopped-flow spectrophotometry, and Nerea Ubierna for sharing the spreadsheet for the Ogee et al. gm calculations. This work is presented in the Australian provisional patent application # 2021900409.
Version history
- Preprint posted: April 29, 2021 (view preprint)
- Received: May 6, 2021
- Accepted: November 23, 2021
- Accepted Manuscript published: November 29, 2021 (version 1)
- Version of Record published: December 6, 2021 (version 2)
Copyright
© 2021, Ermakova et al.
This article is distributed under the terms of the Creative Commons Attribution License, which permits unrestricted use and redistribution provided that the original author and source are credited.
Metrics
-
- 1,421
- Page views
-
- 299
- Downloads
-
- 27
- Citations
Article citation count generated by polling the highest count across the following sources: Crossref, PubMed Central, Scopus.
Download links
A two-part list of links to download the article, or parts of the article, in various formats.
Downloads (link to download the article as PDF)
Open citations (links to open the citations from this article in various online reference manager services)
Cite this article (links to download the citations from this article in formats compatible with various reference manager tools)
Expression of a CO2-permeable aquaporin enhances mesophyll conductance in the C4 species Setaria viridis
eLife 10:e70095.
https://doi.org/10.7554/eLife.70095
Further reading
-
- Plant Biology
Root gravitropic bending represents a fundamental aspect of terrestrial plant physiology. Gravity is perceived by sedimentation of starch-rich plastids (statoliths) to the bottom of the central root cap cells. Following gravity perception, intercellular auxin transport is redirected downwards leading to an asymmetric auxin accumulation at the lower root side causing inhibition of cell expansion, ultimately resulting in downwards bending. How gravity-induced statoliths repositioning is translated into asymmetric auxin distribution remains unclear despite PIN auxin efflux carriers and the Negative Gravitropic Response of roots (NGR) proteins polarize along statolith sedimentation, thus providing a plausible mechanism for auxin flow redirection. In this study, using a functional NGR1-GFP construct, we visualized the NGR1 localization on the statolith surface and plasma membrane (PM) domains in close proximity to the statoliths, correlating with their movements. We determined that NGR1 binding to these PM domains is indispensable for NGR1 functionality and relies on cysteine acylation and adjacent polybasic regions as well as on lipid and sterol PM composition. Detailed timing of the early events following graviperception suggested that both NGR1 repolarization and initial auxin asymmetry precede the visible PIN3 polarization. This discrepancy motivated us to unveil a rapid, NGR-dependent translocation of PIN-activating AGCVIII kinase D6PK towards lower PMs of gravity-perceiving cells, thus providing an attractive model for rapid redirection of auxin fluxes following gravistimulation.
-
- Plant Biology
Plant pathogens secrete proteins, known as effectors, that function in the apoplast or inside plant cells to promote virulence. Effector recognition by cell-surface or cytosolic receptors results in the activation of defence pathways and plant immunity. Despite their importance, our general understanding of fungal effector function and recognition by immunity receptors remains poor. One complication often associated with effectors is their high sequence diversity and lack of identifiable sequence motifs precluding prediction of structure or function. In recent years, several studies have demonstrated that fungal effectors can be grouped into structural classes, despite significant sequence variation and existence across taxonomic groups. Using protein X-ray crystallography, we identify a new structural class of effectors hidden within the secreted in xylem (SIX) effectors from Fusarium oxysporum f. sp. lycopersici (Fol). The recognised effectors Avr1 (SIX4) and Avr3 (SIX1) represent the founding members of the Fol dual-domain (FOLD) effector class, with members containing two distinct domains. Using AlphaFold2, we predicted the full SIX effector repertoire of Fol and show that SIX6 and SIX13 are also FOLD effectors, which we validated experimentally for SIX6. Based on structural prediction and comparisons, we show that FOLD effectors are present within three divisions of fungi and are expanded in pathogens and symbionts. Further structural comparisons demonstrate that Fol secretes effectors that adopt a limited number of structural folds during infection of tomato. This analysis also revealed a structural relationship between transcriptionally co-regulated effector pairs. We make use of the Avr1 structure to understand its recognition by the I receptor, which leads to disease resistance in tomato. This study represents an important advance in our understanding of Fol-tomato, and by extension plant–fungal interactions, which will assist in the development of novel control and engineering strategies to combat plant pathogens.


