Protein polyglutamylation catalyzed by the bacterial calmodulin-dependent pseudokinase SidJ
- Weill Institute for Cell and Molecular Biology, Cornell University, United States
- Cornell University, United States
Figures
Figure 1 with 1 supplement
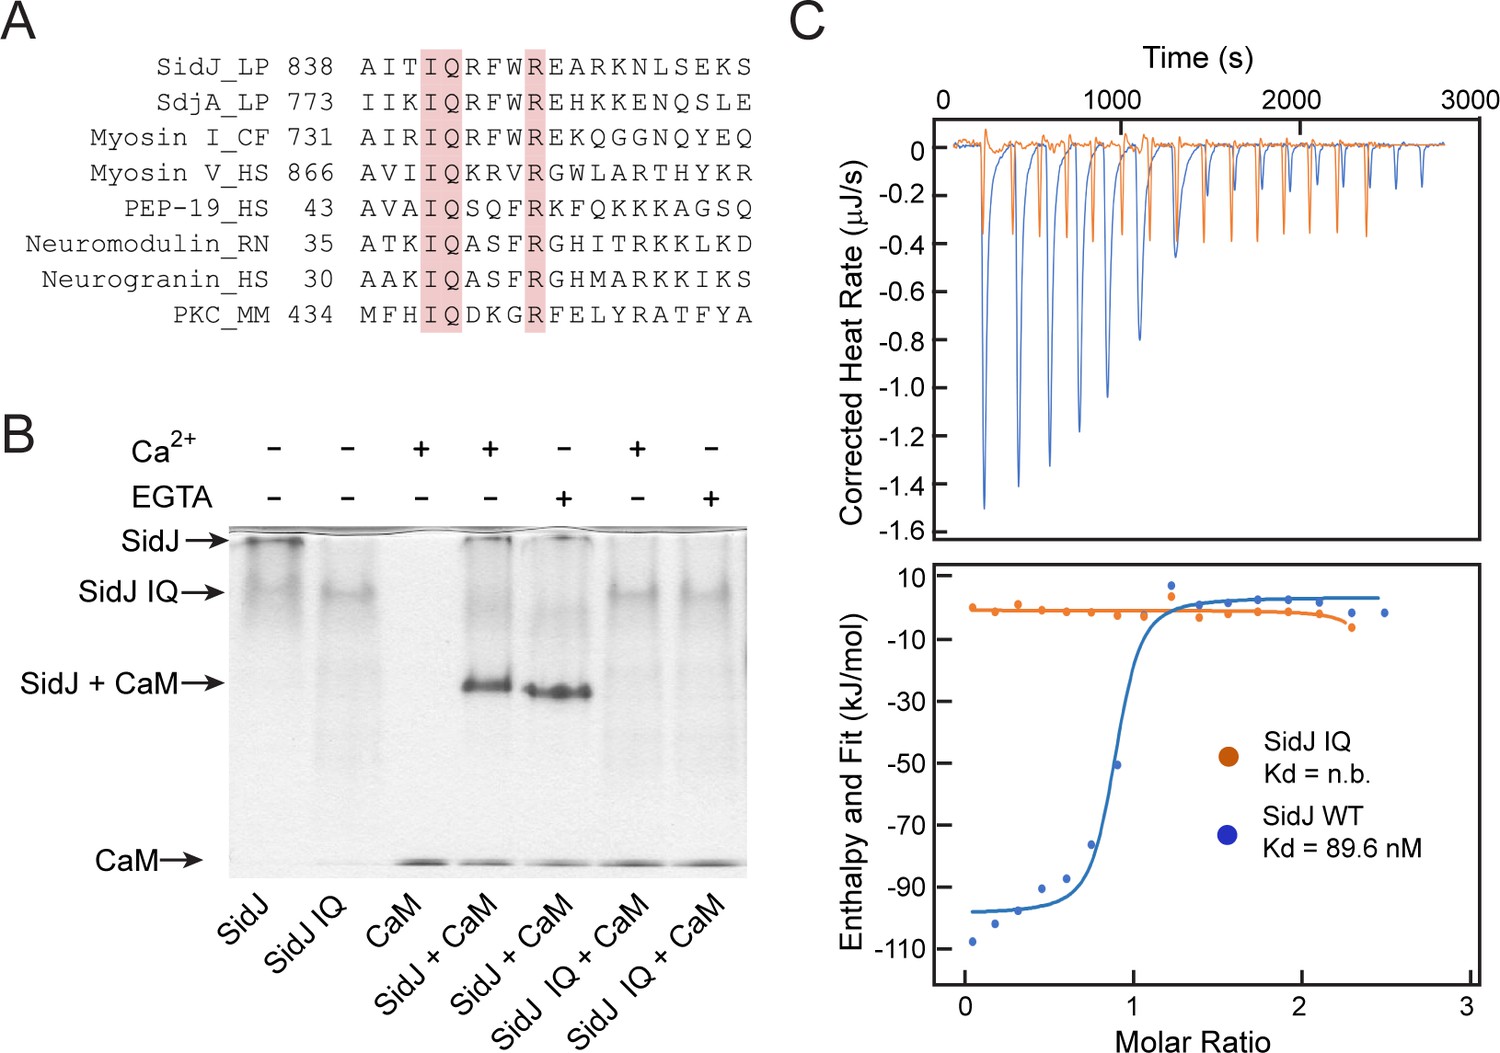
SidJ binds CaM through its C-terminal IQ motif.
(A) Multiple sequence alignment of IQ motifs (‘IQXXXR’), which mediate the binding of CaM, from the indicated proteins. Protein names are followed by a two-letter representation of the species and the residue numbers of the first amino acid in the aligned sequences. Identical residues of the motif are highlighted in pink. NCBI database accession numbers are as follows: SidJ, YP_096168.1; SdjA, YP_096515.1; Myosin-1, ONH68659.1; Myosin V, NP_000250.3; PEP-19, CAA63724.1; Neuromodulin, NP_058891.1; Neurogranin, NP_006167.1; and Protein kinase C delta isoform, NP_001297611.1. LP, Legionella pneumophila; CF, Cyberlindnera fabianii; HS, Homo sapiens; RN, Rattus norvegicus; MM, Mus musculus. (B) Native PAGE analysis of the SidJ and CaM complex. Wild-type SidJ and CaM form a complex independently of Ca2+ and the complex migrates at a different position from each individual protein. (C) Measurement of the affinity between CaM and SidJ WT (blue) or the SidJ IQ mutant (orange) by isothermal titration calorimetry. The top panel shows the reconstructed thermogram, and the bottom panel the isotherms. SidJ WT binding to CaM has a dissociation constant of approximately 89.6 nM in a 1:1 stoichiometry.
Figure 1—figure supplement 1

Size exclusion chromatography analysis of the SidJ–CaM complex.
(A–E) Size exclusion chromatogram profile of purified recombinant protein (top) and the peak fractions visualized by SDS-PAGE followed by Coomassie staining (bottom). (A) SidJ; (B) CaM; (C) SidJ IQ mutant; (D) SidJ and CaM; and (E) SidJ IQ mutant and CaM.
Figure 2 with 1 supplement
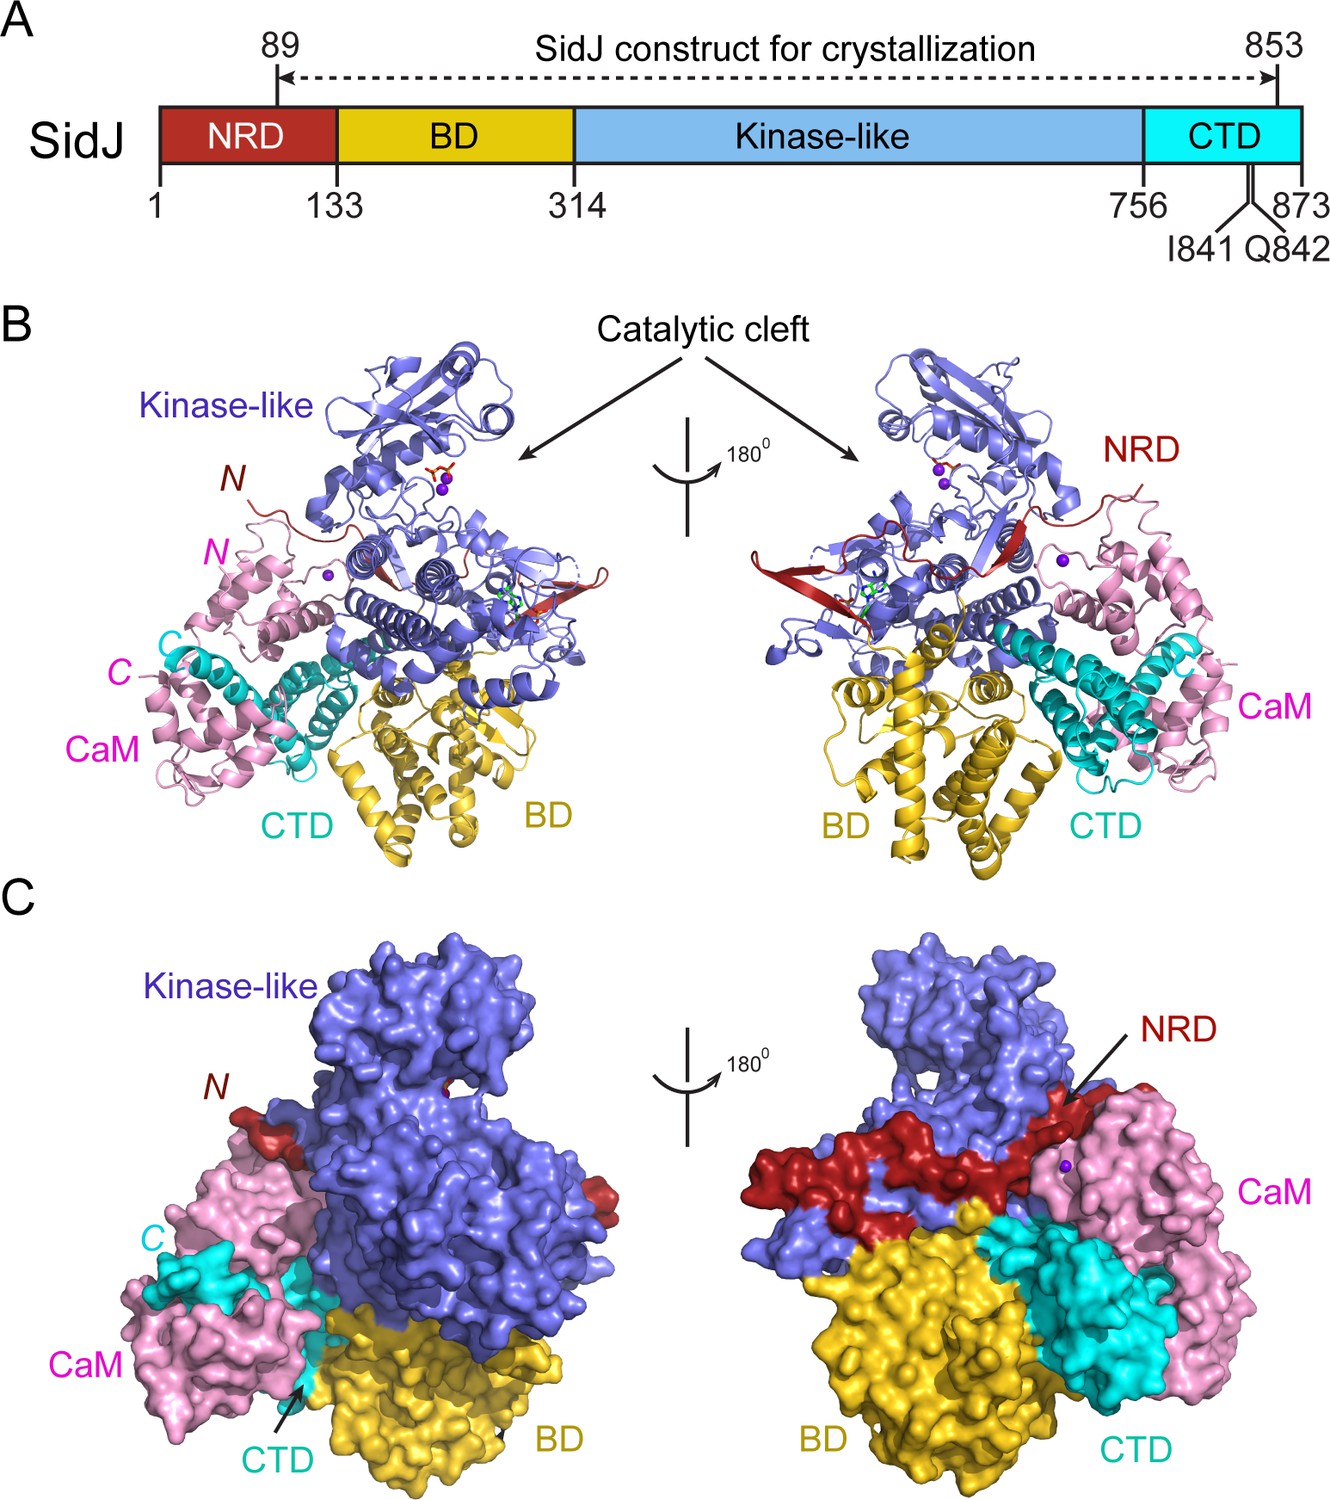
Overall structure of the SidJ–CaM complex.
(A) Schematic diagram of SidJ domain architecture. SidJ is comprised of a N-terminal regulatory domain (NRD) in red, a base domain (BD) in yellow, a kinase-like catalytic domain in blue, and a C-terminal domain (CTD) in cyan. The construct used for crystallography (89–853) is depicted above the schematic. (B) Overall structure of SidJ bound to CaM in a cartoon representation. SidJ structure is colored with the same scheme as in (A) and CaM is colored in pink. Ca2+ ions are depicted as purple spheres. The kinase-like domain of SidJ has a bilobed structure with two Ca2+ ions and a pyrophosphate molecule bound at the catalytic cleft between the two lobes. The right panel is a 180° rotation of the left panel and depicts the NRD domain contacts with CaM. (C) Molecular surface representation of SidJ bound to CaM in the same orientation and coloring as in (B). The right panel is a 180° rotation of the left panel. Note that the NRD meanders on the surface of the kinase-like domain and mediates the contact between the kinase-like domain and CaM.
Figure 2—figure supplement 1
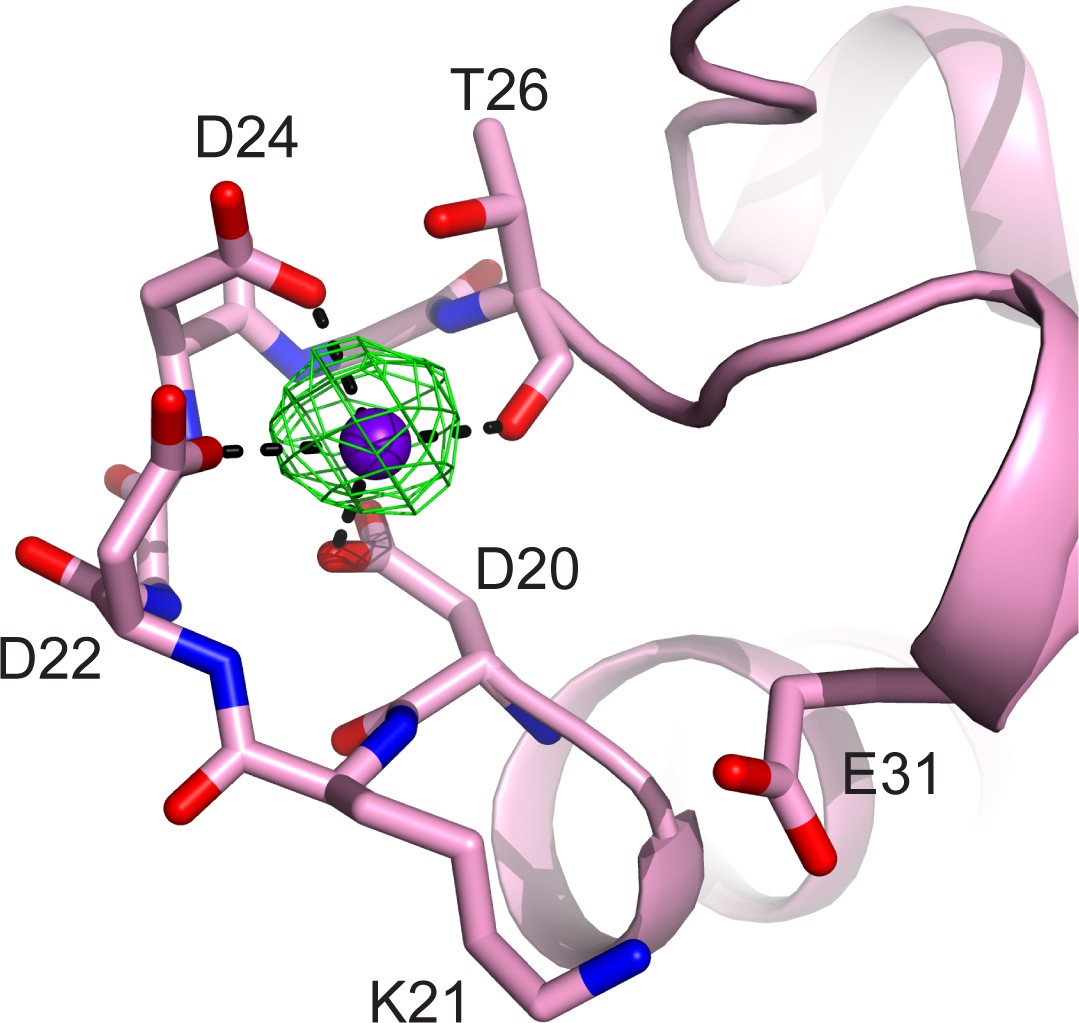
CaM EF-hand coordinated with one Ca2+.
CaM is represented as a pink cartoon with the residues that coordinate with the Ca2+ ion shown as sticks. The green mesh represents the Fo–Fc difference map contoured to 3σ. Note that the conserved residue E31, which is responsible for chelation at the –Z coordination position in Ca2+ fully chelated CaM, is shifted away from the Ca2+, indicating a weak Ca2+ binding to the CaM in the SidJ–CaM complex.
Figure 3 with 3 supplements
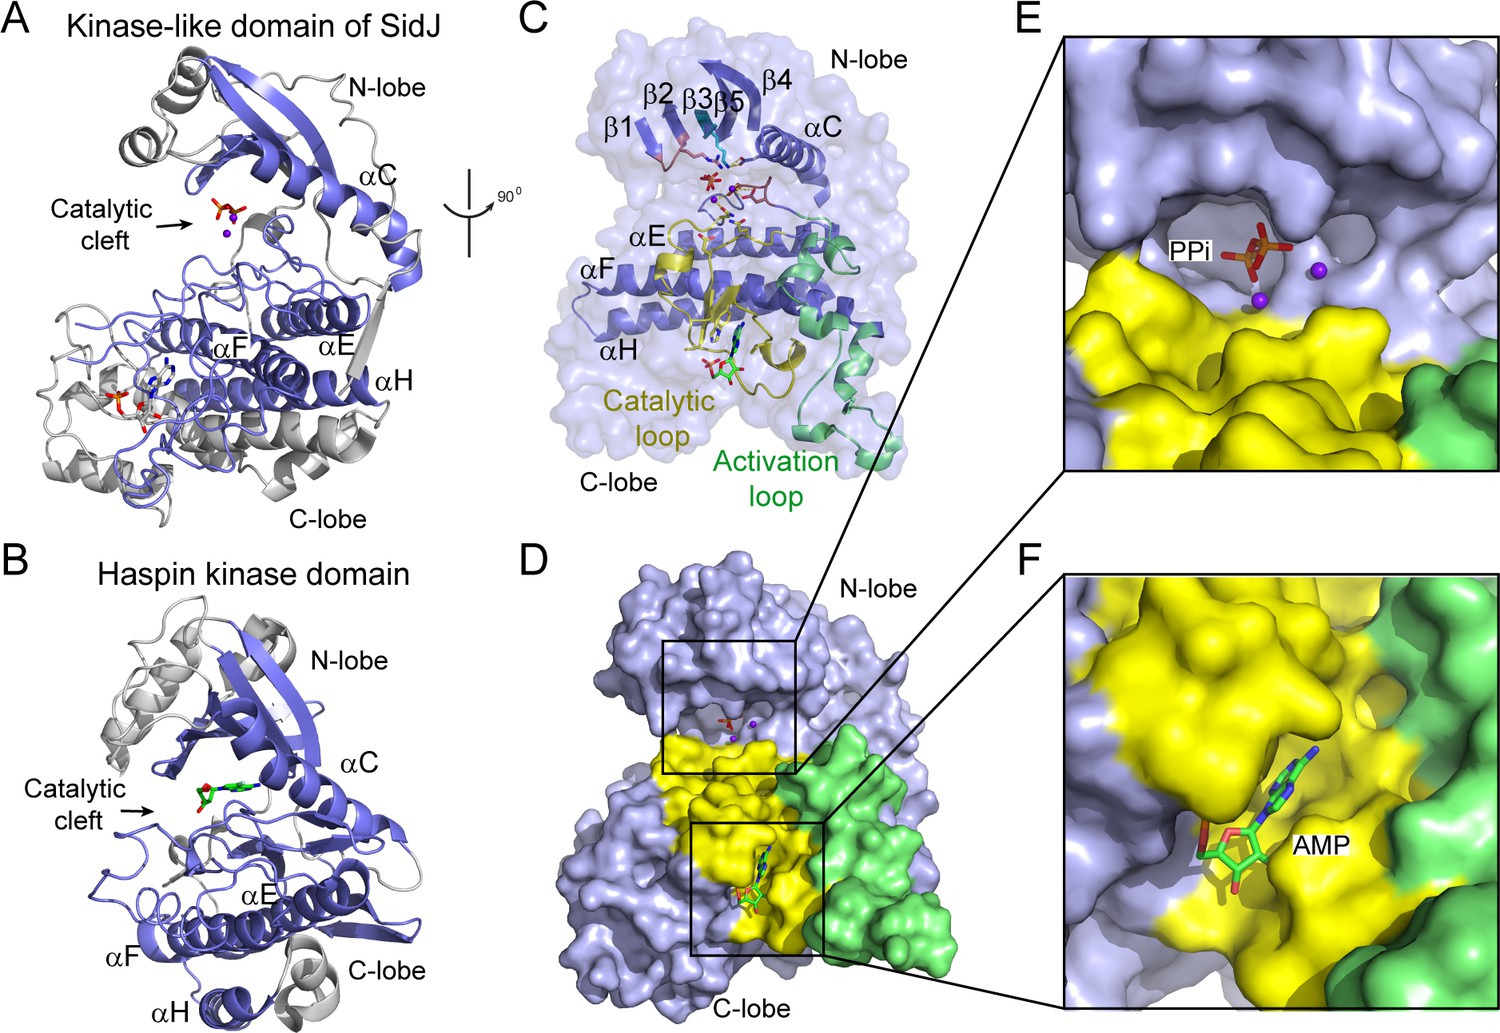
The core of SidJ adopts a protein kinase fold.
(A) Cartoon diagram of the kinase-like domain of SidJ. Secondary structure elements that are conserved in protein kinases are colored in blue. Ca2+ ions are shown as purple spheres while the pyrophosphate and AMP molecules are shown in sticks. (B) Cartoon representation of the kinase domain of Haspin kinase (PDB ID: 2WB6). The conserved structural core, colored in blue, is displayed with an orientation similar to that in panel (A). (C) An orthogonal view of the conserved secondary structural elements in the SidJ kinase-like domain. The N-lobe is comprised of five antiparallel β-strands and an αC helix. The C-lobe is primarily α helical. Secondary structural features are named according to PKA nomenclature. The activation loop is colored in green, the catalytic loop in yellow, and the glycine-rich loop in pink. Conserved residues within the kinase-like catalytic cleft are represented by sticks. (D) Surface representation of the SidJ kinase-like domain, depicting the catalytic cleft formed between the N- and C-lobes and the migrated nucleotide-binding site formed mainly by residues within the catalytic loop (yellow). The activation loop (green) makes close contact with the catalytic loop. (E) Enlarged view of the catalytic clefts outlined in (D). The kinase catalytic cleft contains two Ca2+ ions and a pyrophosphate (PPi) molecule. (F) Expanded view of the migrated nucleotide-binding pocket bound with an AMP.
Figure 3—figure supplement 1
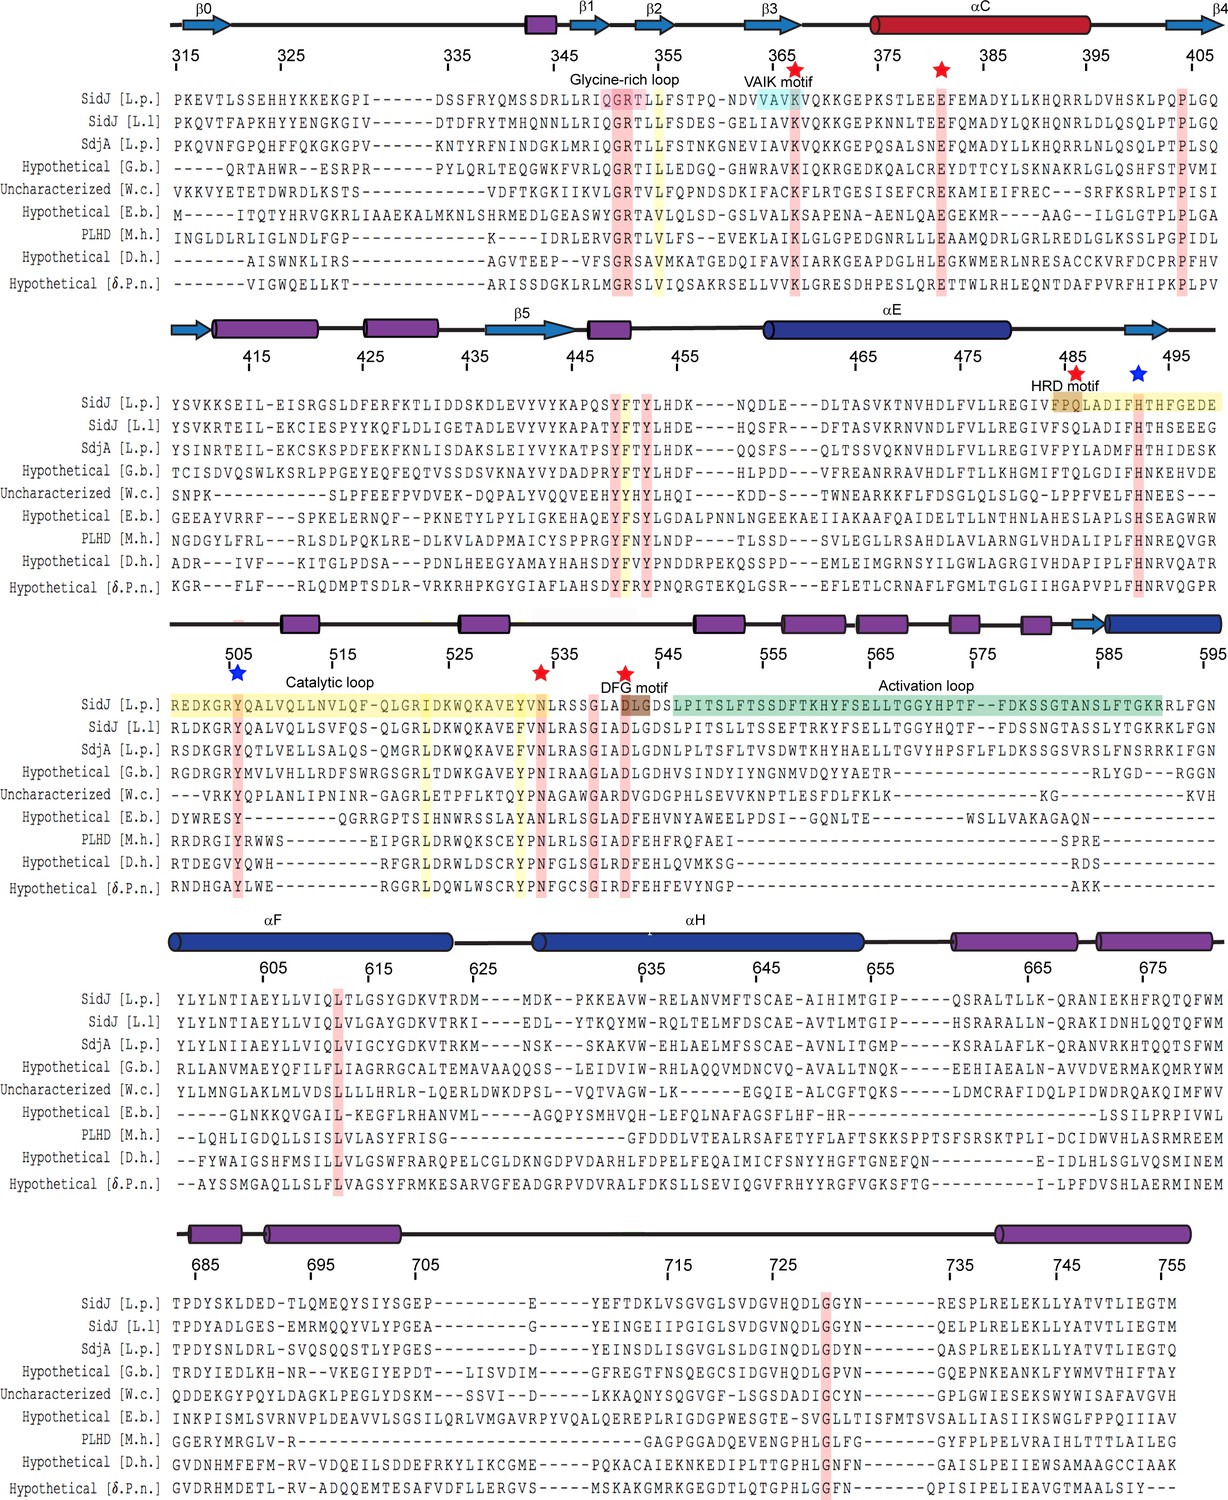
Multiple sequence alignment of SidJ kinase-like domain homologs.
The NCBI BLAST server was used to identify proteins that are homologous to SidJ. Sequences corresponding to the kinase-like domain of SidJ (315–756) were aligned by Clustal Omega and colored using Multiple Align Show (http://www.bioinformatics.org/sms/index.html). SidJ residue numbers are marked above the alignment with secondary structural elements drawn above. Identical residues are highlighted in red and similar residues in yellow. Kinase catalytic residues located in the active site are marked with red stars, while residues at the migrated nucleotide-binding pocket are marked with blue stars. Conserved kinase motifs are highlighted as follows: glycine-rich loop (red), VAIK motif (blue), HRD motif (gold), catalytic loop (yellow), DFG motif (brown) and activation loop (green). NCBI accession numbers are as follows: SidJ, Legionella pneumophila, YP_096168.1; SidJ, Legionella longbeachae, WP_003634608.1; SdjA, Legionella pneumophila, YP_096515.1; hypothetical protein A3E83_09250, Gammaproteobacteria bacterium RIFCSPHIGHO2_12_Full_41_20, OGT46295.1; putative uncharacterized protein, Waddlia chondrophila 2032/99, CCB91008.1; hypothetical protein COB53_07685, Elusimicrobia bacterium, PCI37048.1; PBS lyase HEAT domain protein repeat-containing protein (PLHD), Methanosaeta harundinacea KUK97762.1; hypothetical protein, Desulfovibrio hydrothermalis WP_015335088.1; hypothetical protein, Delta proteobacterium NaphS2, WP_006420030.1.
Figure 3—figure supplement 2
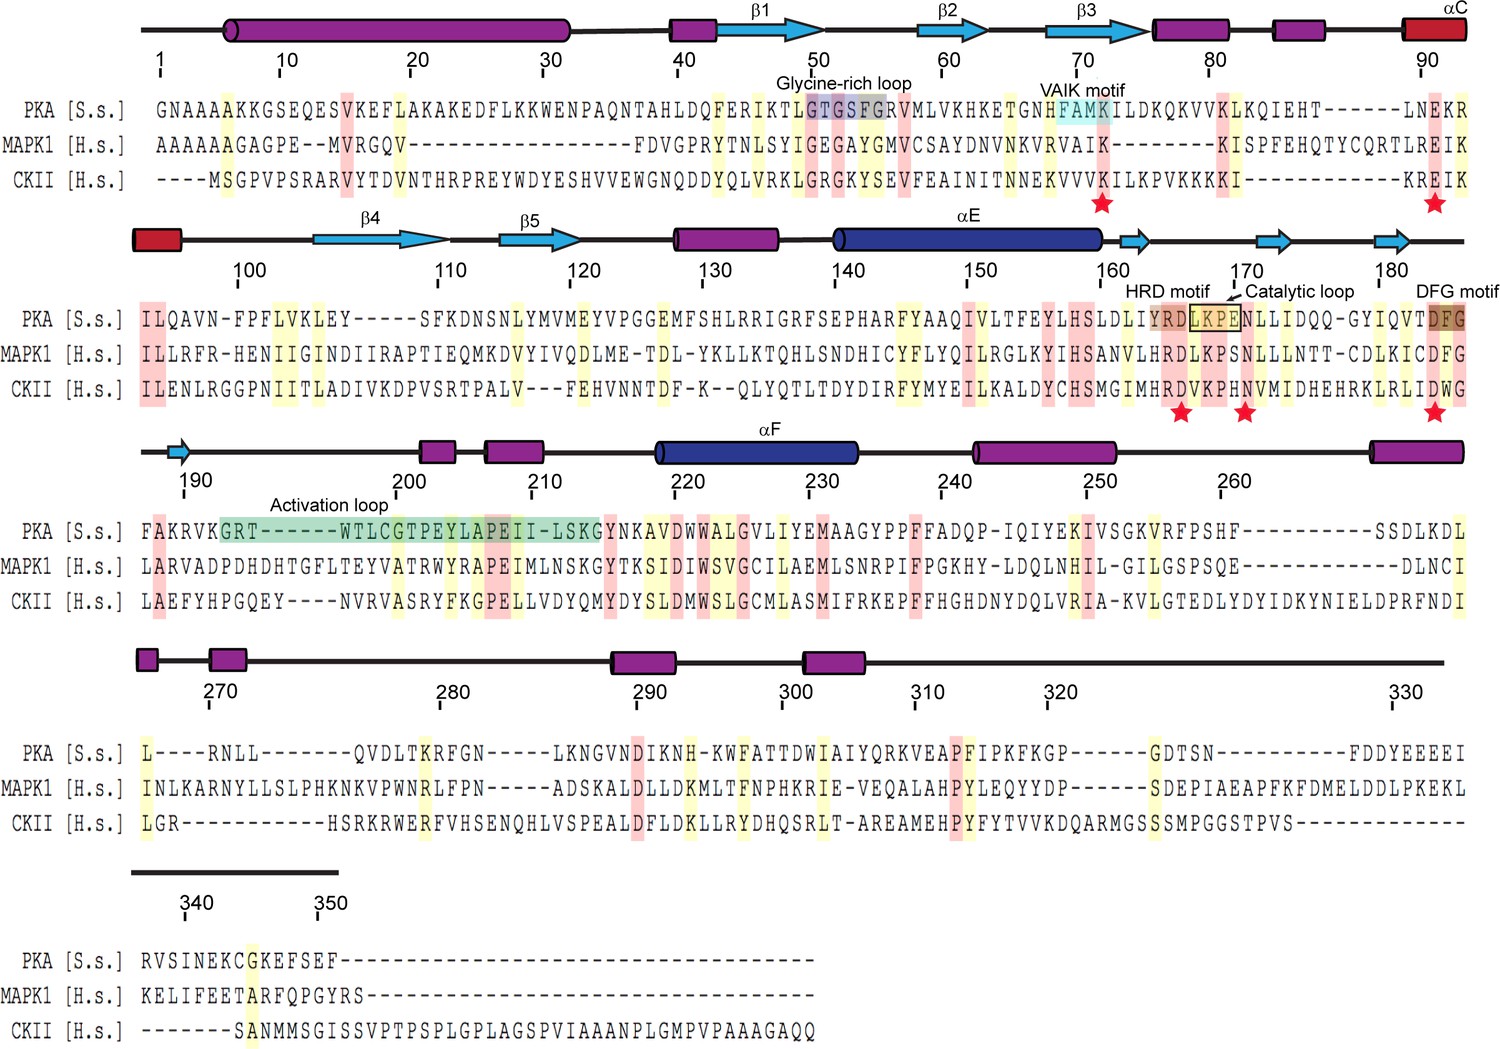
Multiple sequence alignment of representative protein kinases.
The secondary structure of PKA is labeled above the sequence, and PKA residue numbers are marked on the top of the alignment. Identical residues are highlighted in red and similar residues in yellow. Kinase catalytic residues are marked with red stars and conserved kinase signature motifs are highlighted in a color scheme similar to that used for the SidJ kinase-like domain. Note that the catalytic loop in protein kinase contains only four amino acids, while the catalytic loop of SidJ is comprised of a large insertion (>40 amino acids, Figure 3—figure supplement 1). Accession numbers are as follows: cAMP-dependent protein kinase catalytic subunit alpha (PKA), Sus scrofa, P36887.4; mitogen-activated protein kinase (MAPK1), Homo sapiens, P28482; Casein kinase II subunit alpha (CKII), Homo sapiens, P68400.
Figure 3—figure supplement 3

SidJ lacks canonical kinase activity but exhibits auto-AMPylation activity.
(A) Two concentrations of SidJ (0.1 μM and 1 μM) were incubated with CaM, MgCl2 and [γ-32P]ATP without substrate, with MBP, and with SdeA 1–910 for 30 min at 37°C. Proteins were separated by 12% SDS-PAGE and visualized with Coomassie stain. (B) Autoradiogram of the gel shown in panel (A). Exposure time: 2 hr. (C) SidJ was incubated with CaM, MgCl2 and [α-32P]ATP without substrate, with MBP, and with the indicated recombinant SdeA truncations. Proteins were separated by 8% SDS-PAGE and visualized with Coomassie stain. (D) Autoradiogram of the gel shown in panel (C). Exposure time: 1 hr. The bands corresponding to SidJ showed strong radiographic signals, indicating auto-AMPylation of SidJ.
Figure 4 with 2 supplements
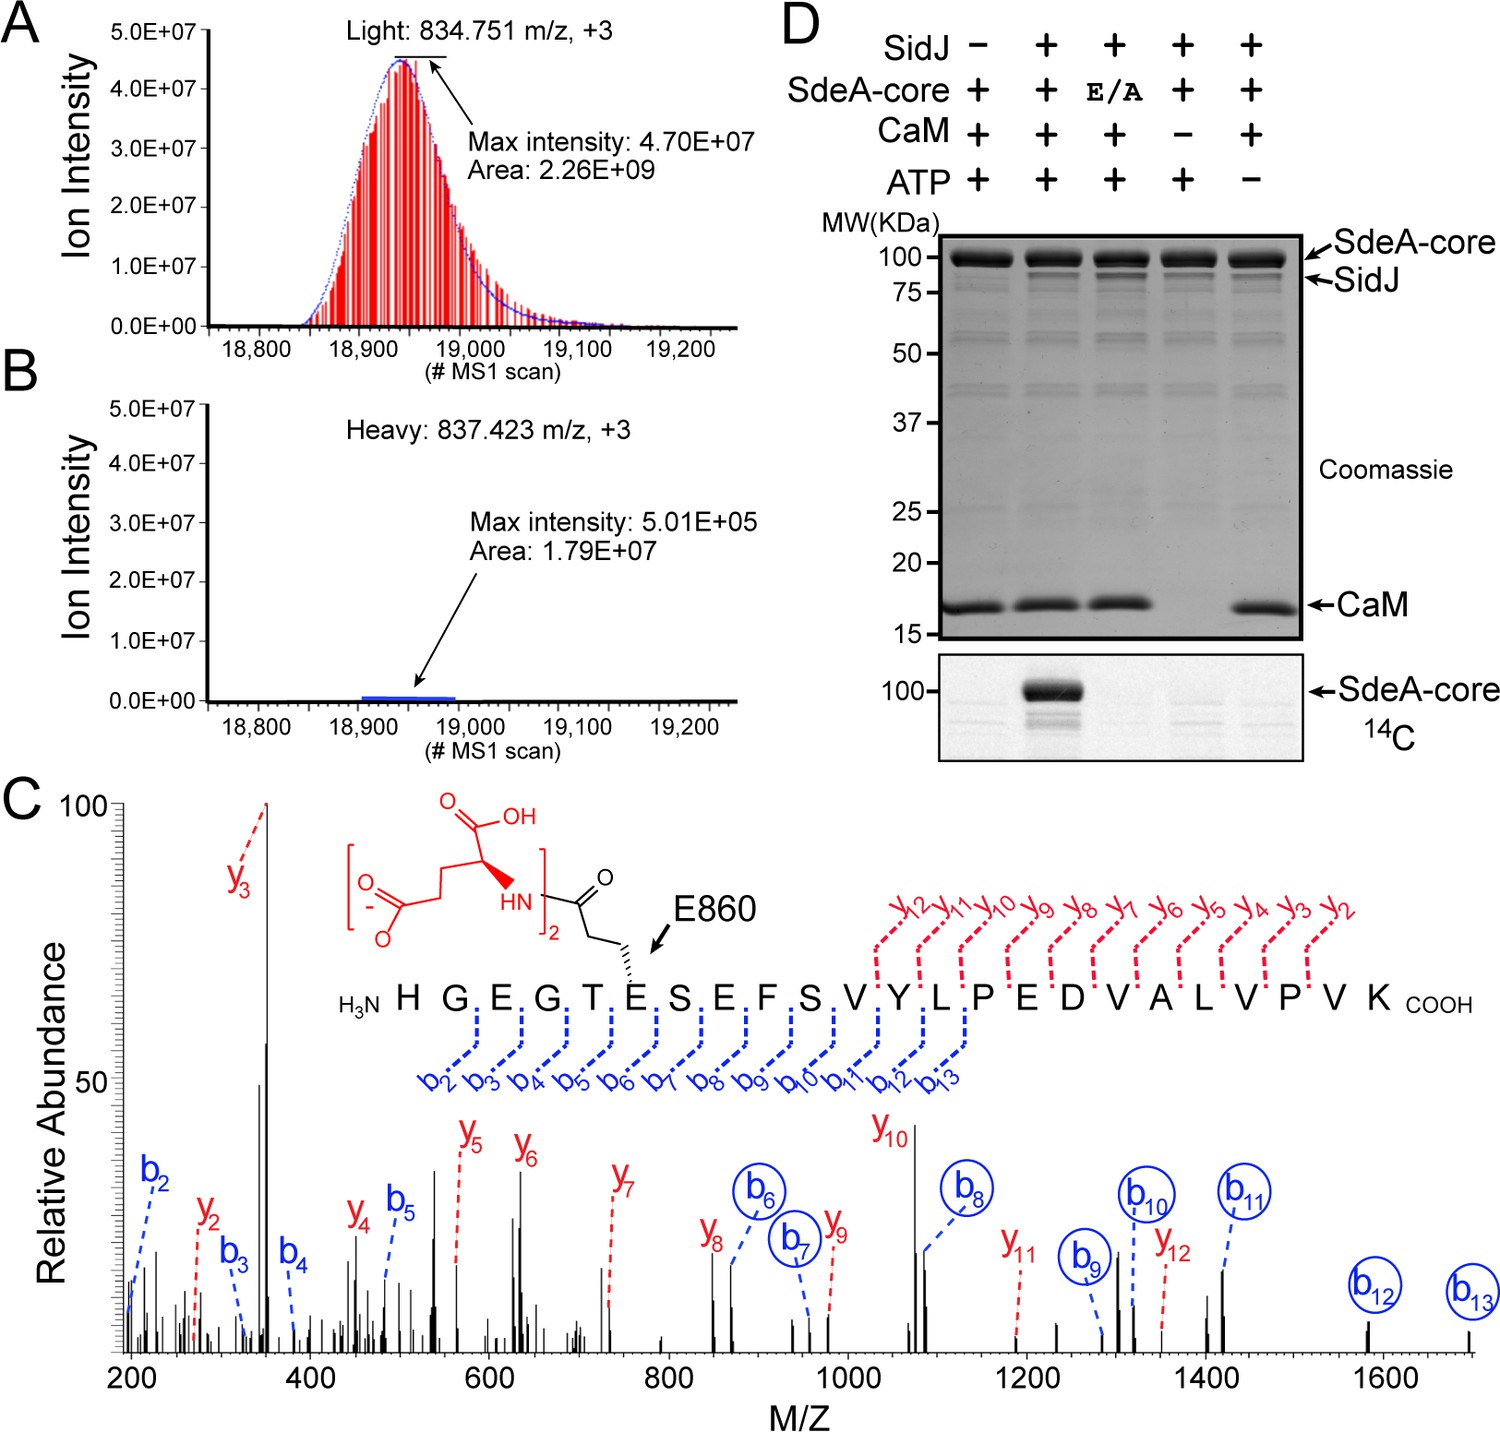
SidJ catalyzes the polyglutamylation of SdeA.
Reconstructed ion chromatograms for the SdeA peptide (residues 855–877) from (A) cells grown in light medium and co-transfected with GFP-SdeA and mCherry vector control or (B) cells grown in heavy medium and co-transfected with GFP-SdeA and mCherry-SidJ. (C) MS2 spectrum of a di-glutamylated SdeA mART peptide with b ions labeled in blue and y ions labeled in red. The peptide sequence corresponding to fragmentation is depicted above the spectrum. Circled b ions represent a mass increase corresponding to diglutamylation (258.085 Da). (D) In vitro glutamylation of SdeA with [U-14C]glutamate. E/A corresponds to the E860A point mutant of SdeA. Proteins were separated by SDS-PAGE and visualized with Coomassie stain (top panel). An autoradiogram of the gel is shown in the bottom panel.
Figure 4—figure supplement 1
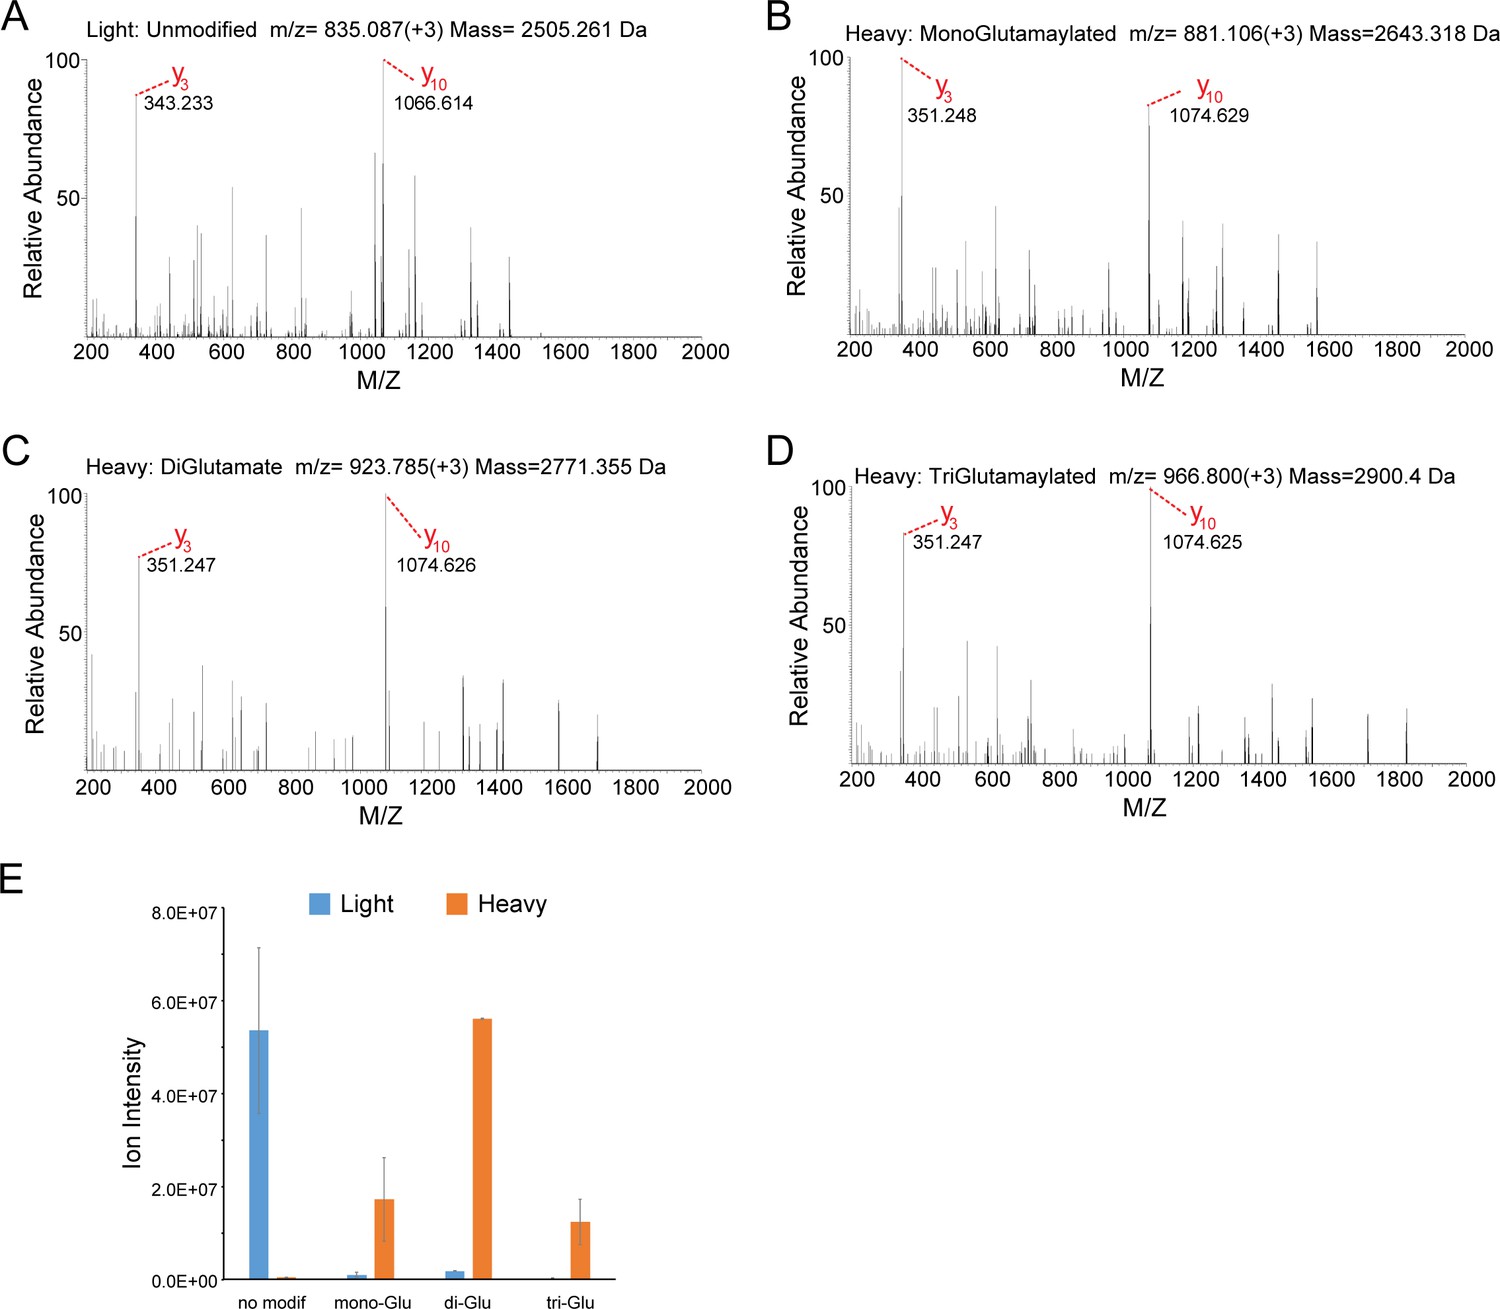
MS/MS analysis of the SdeA peptide modified by SidJ.
(A) The MS2 spectrum of the SdeA peptide (residues 855–877, prepared from light medium) displays two signature ions, y3 and y10, which correspond to the two y ions generated from two labile prolines in the peptide. (B) A SdeA peptide (prepared from heavy medium) exhibits the same two signature ions (y3 and y10) but with a mass increase of 129.043 Da after subtraction of 8. 014 Da corresponding to the heavy Lys and 1 Da corresponding to natural 13C incorporation in the peptide. The 129.043 Da corresponds to the addition of a glutamate residue. (C) A similar SdeA peptide (prepared from heavy medium) produces y3 and y10 ions, but with a mass increase of 2 × 129.043 Da after accounting for the heavy Lys. (D) A SdeA peptide (prepared from heavy medium) exhibits the same two signature ions (y3 and y10) but with a mass increase of 3 × 129.046 Da. (E) Quantification of ion intensity for heavy and light samples of unmodified, mono-glutamylated, di-glutamylated, and tri-glutamylated SdeA mART peptides. Data are shown as means ± STD of three independent mass spectrometry data collections.
Figure 4—figure supplement 2

The structural context of the SdeA peptide modified by SidJ.
Left: overall structure of SdeA in complex with Ub and NADH (PDB ID: 5YIJ). Right: enlarged view of the mART active site of SdeA. The peptide (residues 855–877) shown in cyan was polyglutamylated at residue E860 (shown in sticks) by SidJ, as detected by MS/MS analysis. The NADH is represented by sticks and colored in green.
Figure 5
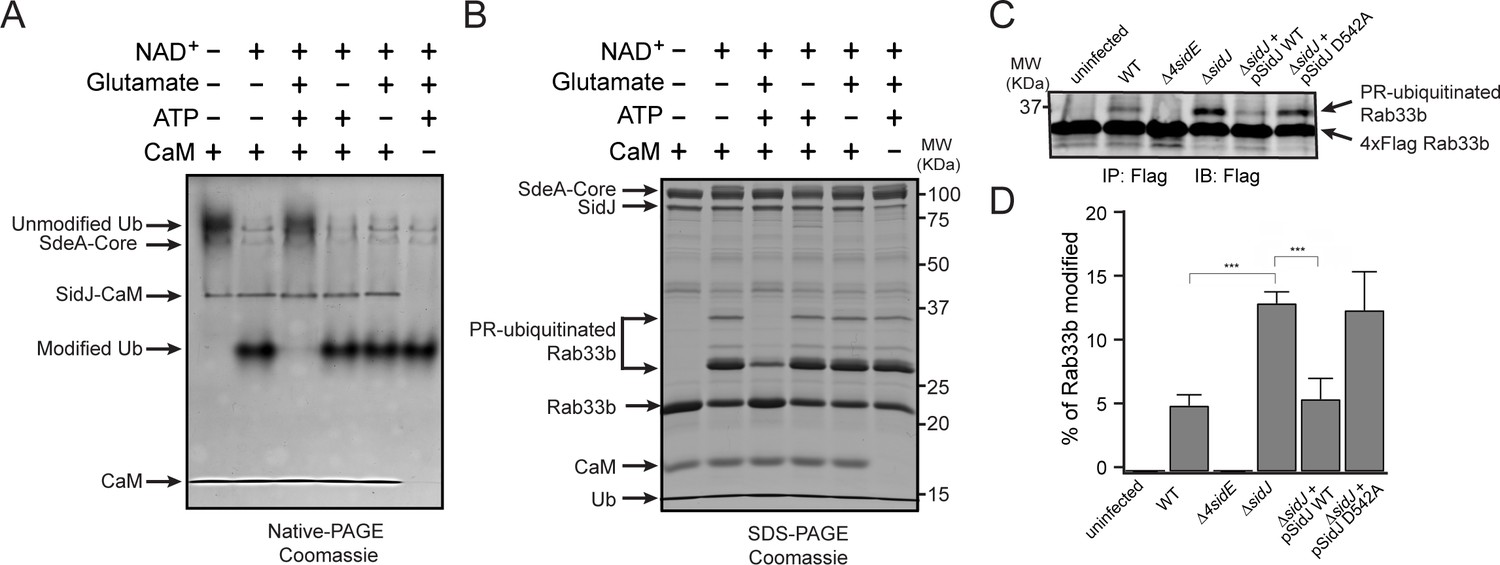
SidJ suppresses the PR-ubiquitination activity of SdeA.
(A) SdeA Core was first incubated with SidJ for 30 min at 37°C with MgCl2, ATP, and CaM, and in the presence or absence of glutamate. Then, the SdeA-mediated ADP-ribosylation of Ub was initiated by the addition of Ub and NAD+ to the reaction mixture, which was further incubated for 30 min at 37°C. Final products were analyzed by Native PAGE to monitor the modification of Ub as an indirect readout for the polyglutamylation activity of SidJ. (B) In vitro SdeA PR-ubiquitination of Rab33b after a pretreatment with SidJ similar to that described for panel (A). The final products were analyzed by SDS-PAGE to monitor the generation of PR-ubiquitinated Rab33b. (C) PR-ubiquitination of Rab33b was increased in cells that were infected with the ΔsidJ L. pneumophila strain. HEK293T cells expressing FCγRII and 4xFlag-Rab33b were infected with the indicated L. pneumophila strains for 2 hr. 4xFlag-Rab33b proteins were enriched by anti-Flag immunoprecipitation and analyzed by anti-Flag Western blot. (D) Quantification of the percentage of PR-ubiquitinated Rab33b in the blots shown in panel (C). Data are shown as means ± SEM of three independent experiments. ***, p<0.001. Specific p-values are listed in Source Data 1.
Figure 6 with 1 supplement

Molecular determinants of SidJ-mediated polyglutamylation.
(A) Overall structure of the SidJ kinase-like domain. (B) Enlarged view of the kinase catalytic site of SidJ. Key catalytic residues are displayed in sticks. Pyrophosphate is represented by sticks and two calcium ions are shown as purple spheres. (C) Enlarged view of the ‘migrated’ nucleotide-binding site with AMP displayed as sticks. (D) In vitro glutamylation of SdeA by SidJ active-site mutants with [U-14C]glutamate after 15 min reaction at 37°C. The proteins in the reactions were visualized by SDS-PAGE followed by Coomassie staining (top panel) and the modification of SdeA was detected by autoradiography (bottom panel). (E) In vitro glutamylation of SdeA by SidJ nucleotide-binding site mutants with [U-14C]glutamate. The proteins in the reactions were analyzed by SDS-PAGE (top) and the glutamylation of SdeA was detected by autoradiography (bottom). (F) Quantification of the relative autoradiographic intensity of modified SdeA. Data are shown as means ± STD of three independent experiments. ns, not significant; **, p<0.01; ***, p<0.001. Specific p-values are listed in Source Data 1. (G) SidJ and SidJ mutants were incubated with [α-32P]ATP and MgCl2 in the presence or absence of CaM. Representative SDS-PAGE gel was stained with Coomassie. (H) Autoradiogram of the gel in panel (G) showing the auto-AMPylation of SidJ.
Figure 6—figure supplement 1

Inhibition of SdeA-catalyzed Ub ADP-ribosylation by SidJ mutants.
(A) SdeA core was first treated by SidJ or its kinase active-site mutants for 30 min at 37°C. After the treatment, the SdeA mediated ADP-ribosylation of Ub was initiated by the addition of Ub and NAD+ to the reaction mixture, which was further incubated for 30 min at 37°C. Reaction products were analyzed by Native PAGE and visualized with Coomassie stain. (B) The inhibition of SdeA-catalyzed ADP-ribosylation of Ub by SidJ nucleotide-binding-pocket mutants. The experiments were performed as described for panel (A).
Figure 7 with 5 supplements
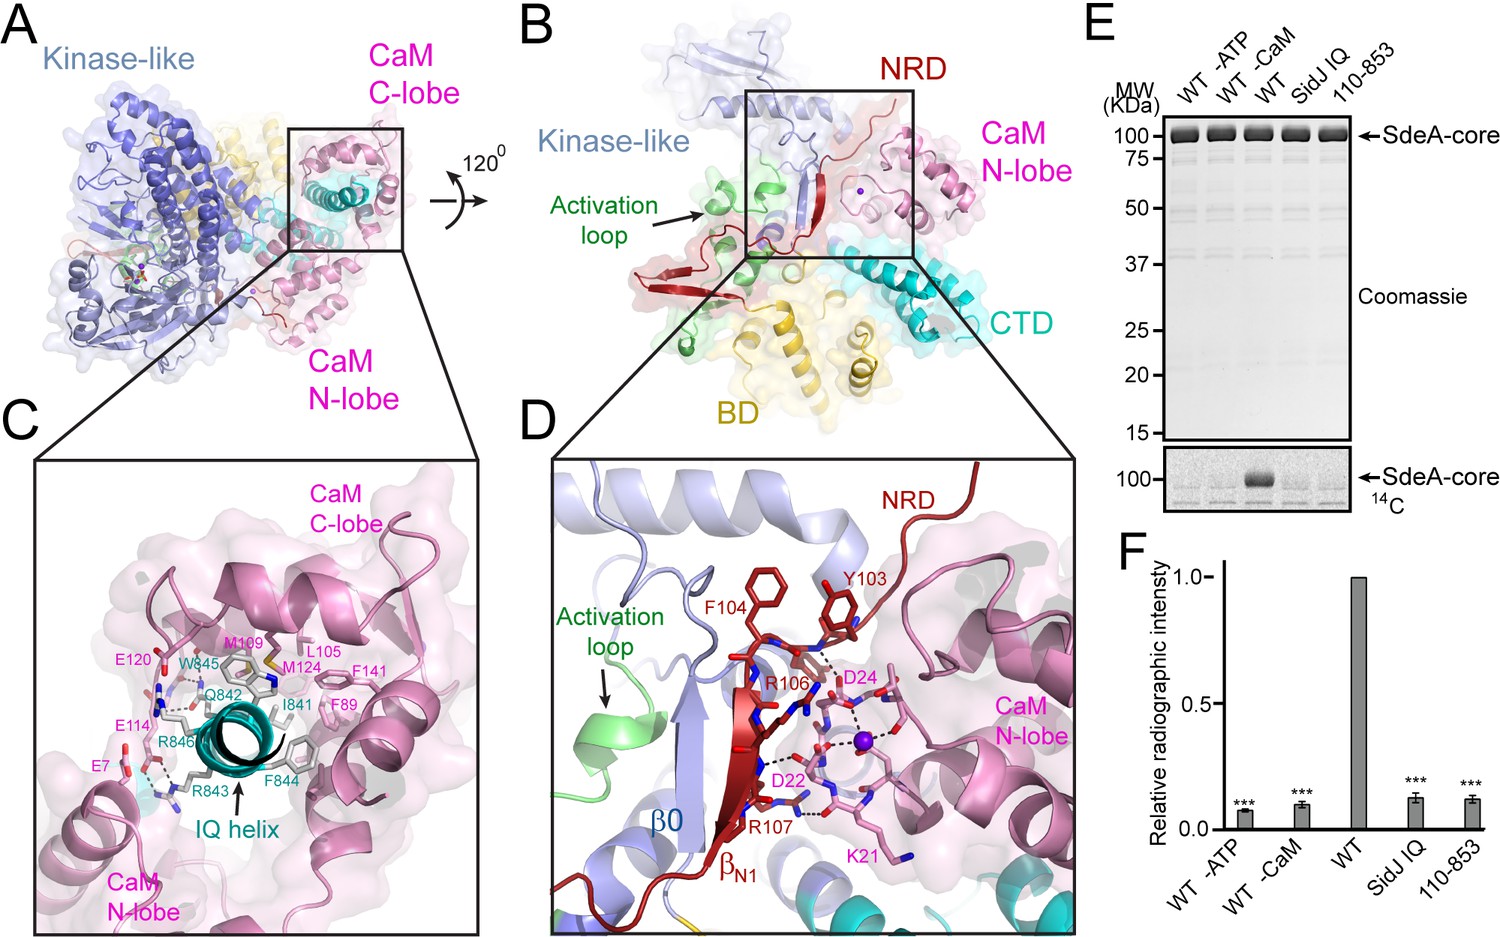
Activation of SidJ by CaM.
(A) The structure of the SidJ–CaM complex showing the C-lobe of CaM (pink) ‘gripping’ the IQ-motif helix (cyan) of SidJ. (B) A 120° rotated view of the complex in panel (A) showing that the N-lobe of CaM contacts with the NRD domain (maroon) of SidJ. (C) Enlarged view of interface between the SidJ IQ helix and the C-lobe of CaM. Residues that are involved in the interactions between the IQ helix and CaM are depicted as sticks. Hydrogen bonds and electrostatic interactions are depicted by dashed lines. (D) Enlarged view of the interface between the NRD and CaM. A purple sphere represents the Ca2+ ion bound to CaM. (E) In vitro glutamylation of SdeA by SidJ–CaM proteins at a concentration of 50 nM. The proteins in the reactions were visualized by SDS-PAGE followed by Coomassie staining (top panel) and the modification of SdeA was detected by autoradiography (bottom panel). (F) Quantification of the relative autoradiographic intensity of modified SdeA. Data are shown as means ± STD of three independent experiments. ***, p<0.001. Specific p-values are listed in Source data 1.
Figure 7—figure supplement 1

Electrostatic surface potential analysis of the interaction between SidJ and CaM.
(A) The SidJ–CaM complex with SidJ depicted in ribbon and CaM shown with a surface representation colored by electrostatic surface potential, with red being negatively charged with −5 eV and blue being positively charged with +5 eV. (B) A 120° rotated view of the structure in panel (A). CaM is highly negatively charged as shown from both views. (C) The SidJ–CaM complex with SidJ presented on the surface, which is colored according to its electrostatic surface potential (red: −5 eV; blue: +5 eV), with CaM in ribbon. (D) A 120° rotated view of the structure in panel (C). The regions of SidJ interfaced with CaM are significant positively charged as shown from both views.
Figure 7—figure supplement 2
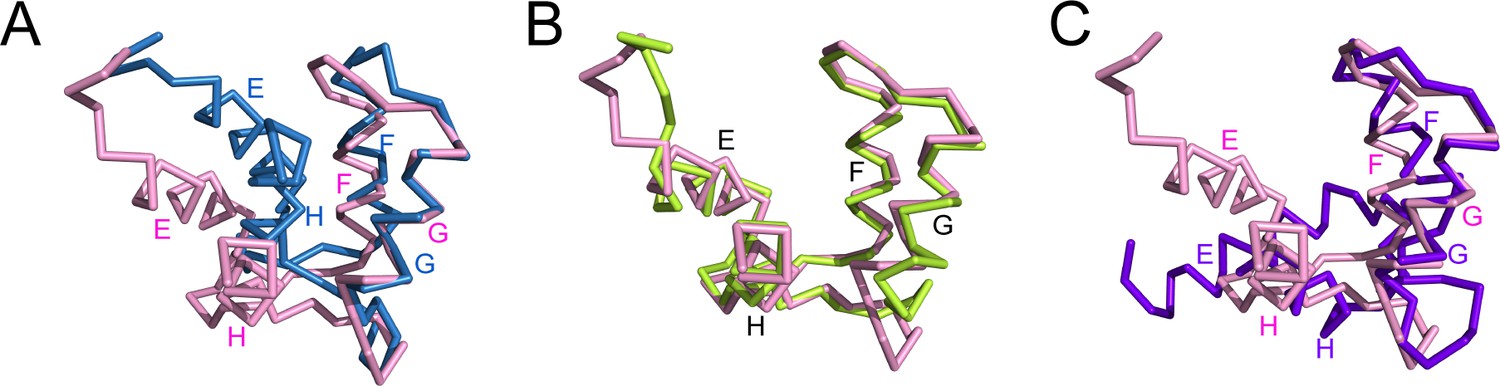
The C-lobe of CaM in the SidJ-CaM complex adopts a semi-open conformation.
(A) A structural comparison of the CaM C-lobe in the SidJ–CaM complex (pink) with apo-CaM (blue) (PDB ID: 1CFC). (B) Structural overlay of the CaM C-lobe in the SidJ-CaM complex (pink) with CaM C-lobe (green) bound to the first IQ-motif in the myosin V-CaM complex (PDB ID: 2IX7). (C) A structural comparison of the CaM C-lobe in the SidJ–CaM complex (pink) with that (purple) in Ca2+ fully chelated CaM (PDB ID: 1CDL). The structures are overlaid in reference to helices F and G.
Figure 7—figure supplement 3

The N-lobe of the CaM in the SidJ–CaM complex adopts a closed conformation.
(A) A structural comparison of the CaM N-lobe in the SidJ–CaM complex (pink) with that in apo-CaM (blue) (PDB ID: 1CFC). (B) A structural comparison of the CaM N-lobe in the SidJ–CaM complex (pink) with that in Ca2+ chelated CaM (brown) (PDB ID: 1CDL). (C) The CaM N-lobe in the SidJ–CaM complex is weakly bound by a Ca2+ ion as it is missing the –Z coordination because of the position of E31 away from the ion-binding site. Thus, the N-lobe maintains a closed conformation. (D) Ca2+ chelating at the same binding site in panel (C) for Ca2+ saturated CaM (PDB ID: 1CDL). E31 is fully engaged in coordination with the bound Ca2+ ion and is responsible for the open conformation of the N-lobe.
Figure 7—figure supplement 4
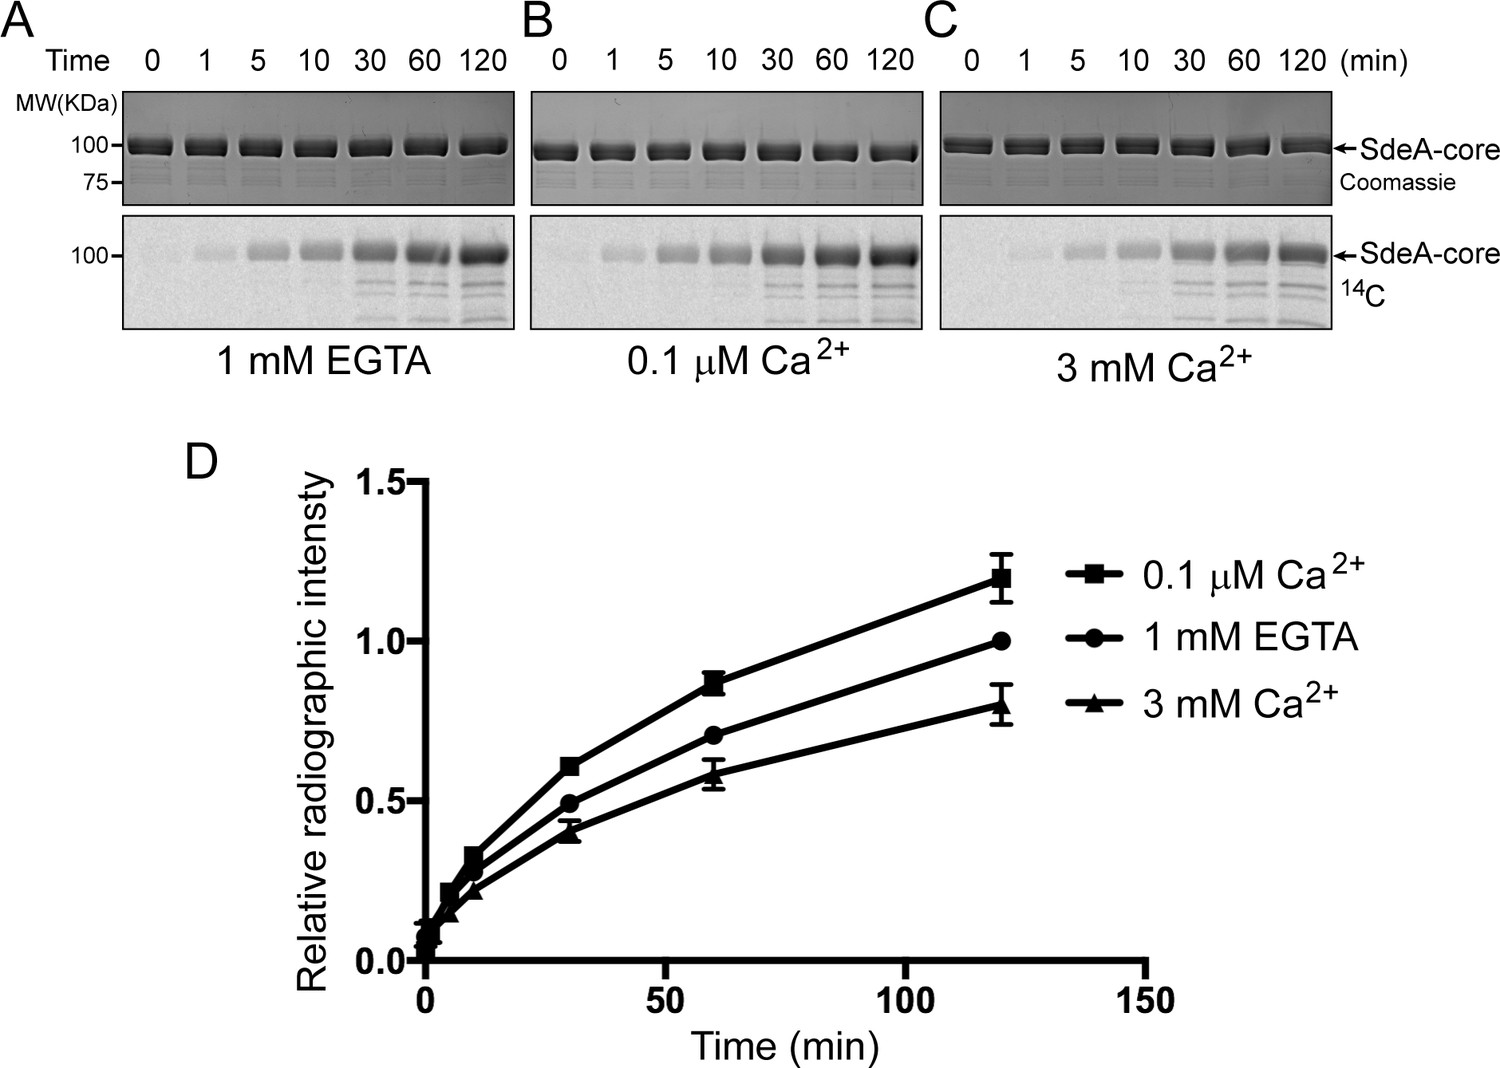
Reaction time course of SidJ in varied Ca2+ concentrations.
(A) In vitro glutamylation time course of SdeA by SidJ with a concentration of 20 nM SidJ–CaM in buffer containing 1 mM EGTA. Reaction time points were collected and time is labeled above the graph in minutes. The proteins in the reactions were visualized by SDS-PAGE followed by Coomassie staining (top panel) and the glutamylation of SdeA was detected by autoradiography (bottom panel). (B) In vitro glutamylation time course of SdeA as in panel (A), with a buffer condition containing 0.1 μM Ca2+ instead of EGTA. (C) In vitro glutamylation time course of SdeA in the presence of 3 mM Ca2+. (D) A graph of the reaction time courses at three different Ca2+ concentrations. The relative radiographic intensity of each time point was normalized to the 120 min time point of the reaction with 1 mM EGTA. Each reaction was conducted in triplicate and error bars represent SEMs.
Figure 7—figure supplement 5
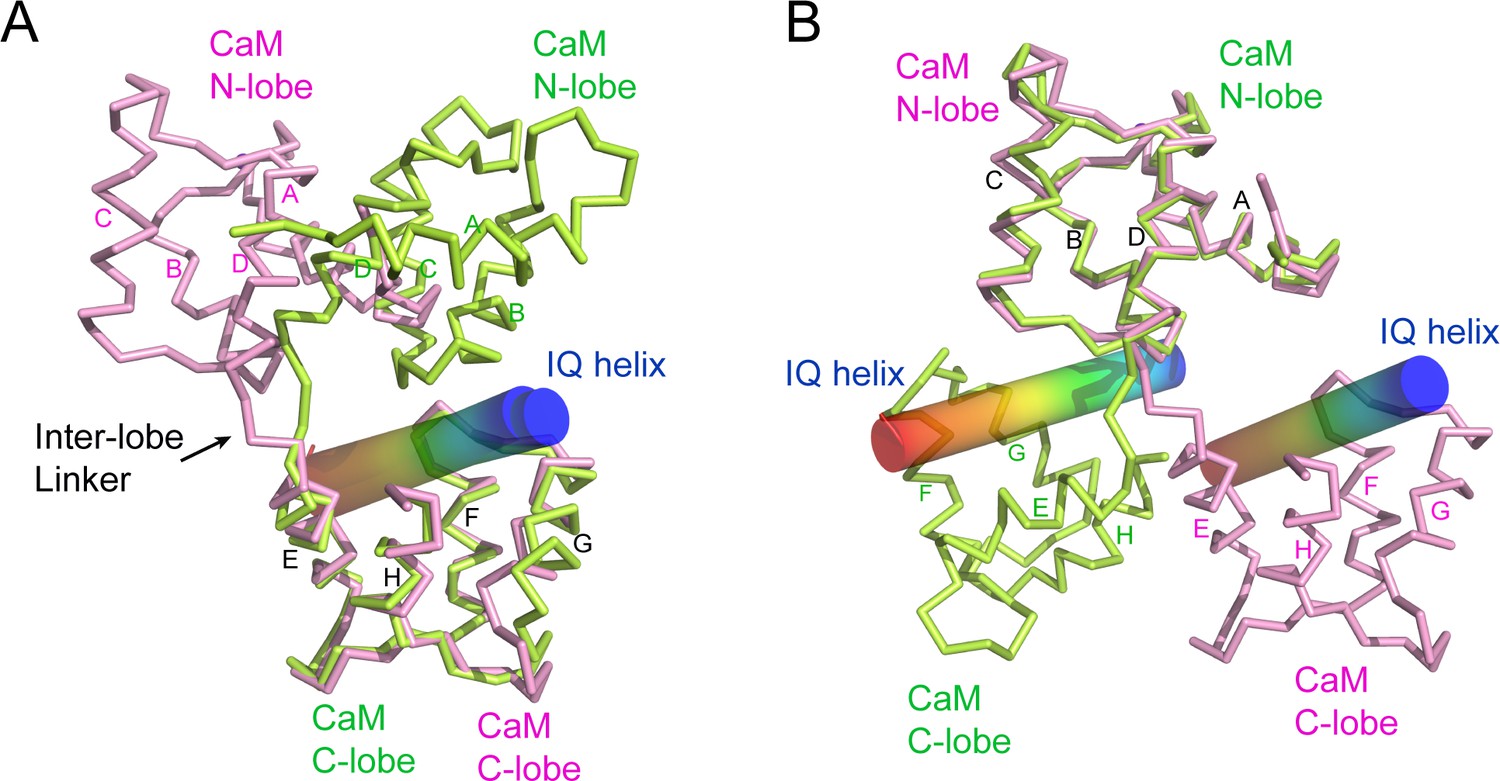
CaM adopts a unique conformation in the SidJ–CaM complex.
(A) Structural comparison of CaM (pink) bound to SidJ IQ helix with that (green) bound to myosin V IQ1 (PDB ID: 2IX7). IQ helixes are displayed as cylinders colored in a spectrum from blue to red from the N-terminal to C-terminal ends, respectively. CaM structures are aligned respective to their C-lobes. (B) Structural overlay of the same two structures shown in panel (A) with CaM structure aligned with reference to their N-lobes.
Figure 8
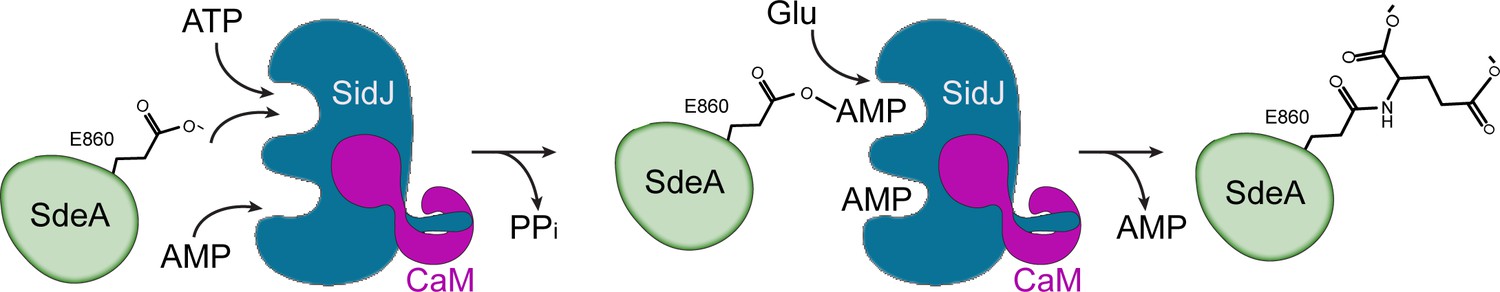
Hypothetic reaction model for SidJ-mediated polyglutamylation of SdeA.
SidJ has a kinase-like catalytic cleft, a regulatory nucleotide-binding pocket and a C-terminal CaM-binding IQ helix. Binding of a nucleotide to the allosteric regulatory site and to CaM with the IQ motif activates SidJ. SidJ-mediated SdeA polyglutamylation involves two steps. In the first step, SidJ AMPylates SdeA by transferring the AMP moiety from ATP to the γ-carbonyl group of SdeA E860 and releasing a pyrophosphate molecule. In the second step, a glutamate molecule is activated at the kinase active site and its amino group serves as a nucleophile to attack the AMPylated E860. As a result, this glutamate is conjugated to E860 through an isopeptide bond and an AMP molecule is released.
Author response image 1

A pilot enzymatic assay of SidJ with a variable concentration of CaM and Ca2+.
(A) In vitro glutamylation of SdeA with 0.5 μM SidJ and five-fold serial dilutions of CaM starting at a concentration of 10 uM. CaM concentration is labeled in nM concentrations. SidJ and CaM were preincubated separately in the presence of 1 mM EGTA and final reaction buffer also contained 1 mM EGTA. Reaction were conducted for 30 minutes and proteins were visualized by SDS-PAGE followed by Coomassie staining (top panel). The glutamylation of SdeA was detected by autoradiography (bottom panel). (B) In vitro glutamylation of SdeA as in A, with buffers containing 0.1 μM Ca2+ instead of EGTA. (C) In vitro glutamylation of SdeA as in A, with buffers containing 3 mM Ca2+ instead of EGTA.
Tables
Table 1
Data collection, phasing, and structural refinement statistics.
https://doi.org/10.7554/eLife.51162.006| SeMet SidJ–CaM | Native SidJ–CaM (PDB ID: 6PLM) | |
|---|---|---|
| Synchrotron beam lines | NSLS II 17-ID-1 (AMX) | NSLS II 17-ID-1 (AMX) |
| Wavelength (Å) | 0.97949 | 0.97949 |
| Space group | P21 | P21 |
| Cell dimensions | ||
| a, b, c (Å) | 105.08, 104.08, 109.65 | 105.35, 103.79, 110.19 |
| α, β, γ (o) | 90, 104.49, 90 | 90, 104.69, 90 |
| Maximum resolution (Å) | 2.85 | 2.59 |
| Observed reflections | 371,678 | 482,266 |
| Unique reflections | 69,809 | 69,809 |
| Completeness (%) | 99.5 | 97.7 |
| <I > /<σ>a | 43.20 (15.30) | 38.20 (13.20) |
| Rsyma,b (%) | 0.024 (0.068) | 0.043 (0.091) |
| Phasing methods | SAD | Native |
| Heavy atom type | Se | – |
| Number of heavy atoms/ASU | 12 | – |
| Resolution (Å)a | – | 29.32 (2.59) |
| Rcrys/Rfree (%)a,c | – | 17.6/24.1 |
| Rms bond length (Å) | – | 0.0142 |
| Rms bond angles (°) | – | 1.8174 |
| Most favored/allowed (%) | – | 96.65/3.35 |
| Generous/disallowed (%) | – | 0 |
-
a Values in parentheses are for the highest-resolution shell.
bRsym = ΣhΣi|II(h) −<I(h)|/ΣhΣiII(h).
-
cRcrys = Σ(|Fobs|−k|Fcal|)/Σ|Fobs|. Rfree was calculated for 5% of reflections randomly excluded from the refinement.
Additional files
-
Source data 1
Source data.
- https://doi.org/10.7554/eLife.51162.024
-
Supplementary file 1
Key Resources Table.
- https://doi.org/10.7554/eLife.51162.025
-
Transparent reporting form
- https://doi.org/10.7554/eLife.51162.026
Download links
A two-part list of links to download the article, or parts of the article, in various formats.
Downloads (link to download the article as PDF)
Open citations (links to open the citations from this article in various online reference manager services)
Cite this article (links to download the citations from this article in formats compatible with various reference manager tools)
Protein polyglutamylation catalyzed by the bacterial calmodulin-dependent pseudokinase SidJ
eLife 8:e51162.
https://doi.org/10.7554/eLife.51162


