Seasonal plasticity in GABAA signaling is necessary for restoring phase synchrony in the master circadian clock network
- Marquette University, United States
Figures
Figure 1 with 1 supplement
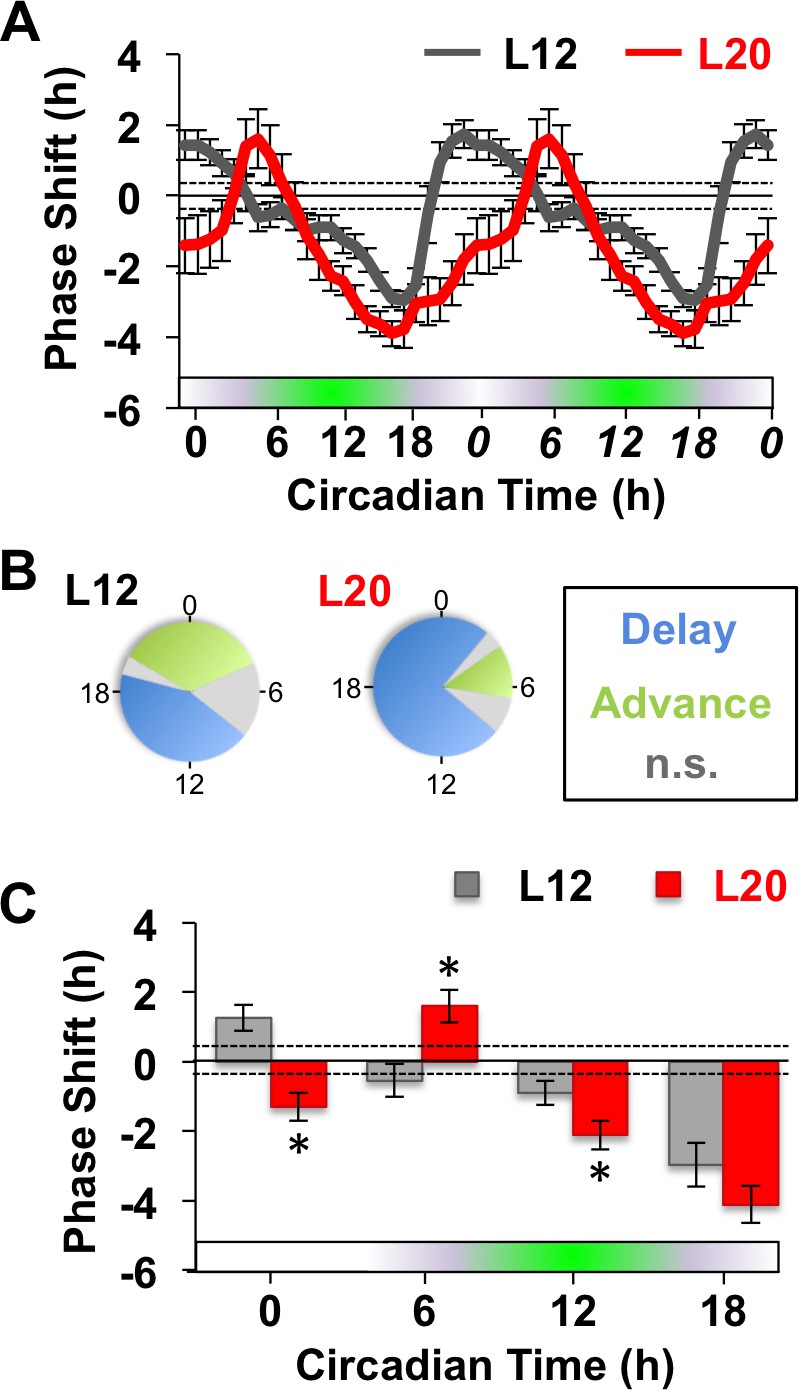
Long days alter SCN molecular responses to GABA.
(A) The phase response curve to GABA is altered by photoperiodic history. Note that data are double plotted to illustrate responses spanning the circadian cycle, with double-plotted timepoints italicized. Stippled lines surrounding zero indicate mean response to vehicle pulses (see also Figure 1—figure supplement 1). Green and white bar along abscissa indicates the circadian time of the GABA pulse relative to the peak time of the PER2::LUC rhythm (green shading). For representative traces of PER2::LUC rhythms, please see Figure 1—figure supplement 1. (B) Polar plots illustrating that photoperiod alters the waveform of the GABA-resetting response rhythm. (C) Data binned for statistical analyses. n = 15–21 (CT0), 6–8 (CT6), 13–14 (CT12), and 6–8 (CT18) SCN slices/photoperiod. * Differs from L12 control, post-hoc Least Square Means contrasts, p<0.01. n.s.: phase with non-significant resetting relative to vehicle controls. See Supplementary file 1 for full statistical results.
Figure 1—figure supplement 1

GABA- and NMDA-induced resetting of SCN PER2::LUC rhythms in vitro.
(A) Representative time series illustrating GABA-induced resetting of L12 SCN PER2::LUC rhythms and occlusion by co-culture with the GABAA receptor antagonist, bicuculline. (B) Concentration of GABA added to culture medium was stable over at least 24 hr in vitro. (C) GABA-induced resetting is blocked by the GABAA receptor antagonist bicuculline. * Tukey’s HSD, p<0.05. (D) Representative time series illustrating GABA-induced resetting of L20 SCN PER2::LUC rhythms. (E) Vehicle responses did not differ by treatment time or photoperiod (n = 8–10 slices/timepoint/photoperiod). (F) L20 decreased the magnitude of NMDA-induced resetting (n = 10 slices/timepoint/photoperiod). * Student’s t test, p<0.05.
Figure 2 with 1 supplement

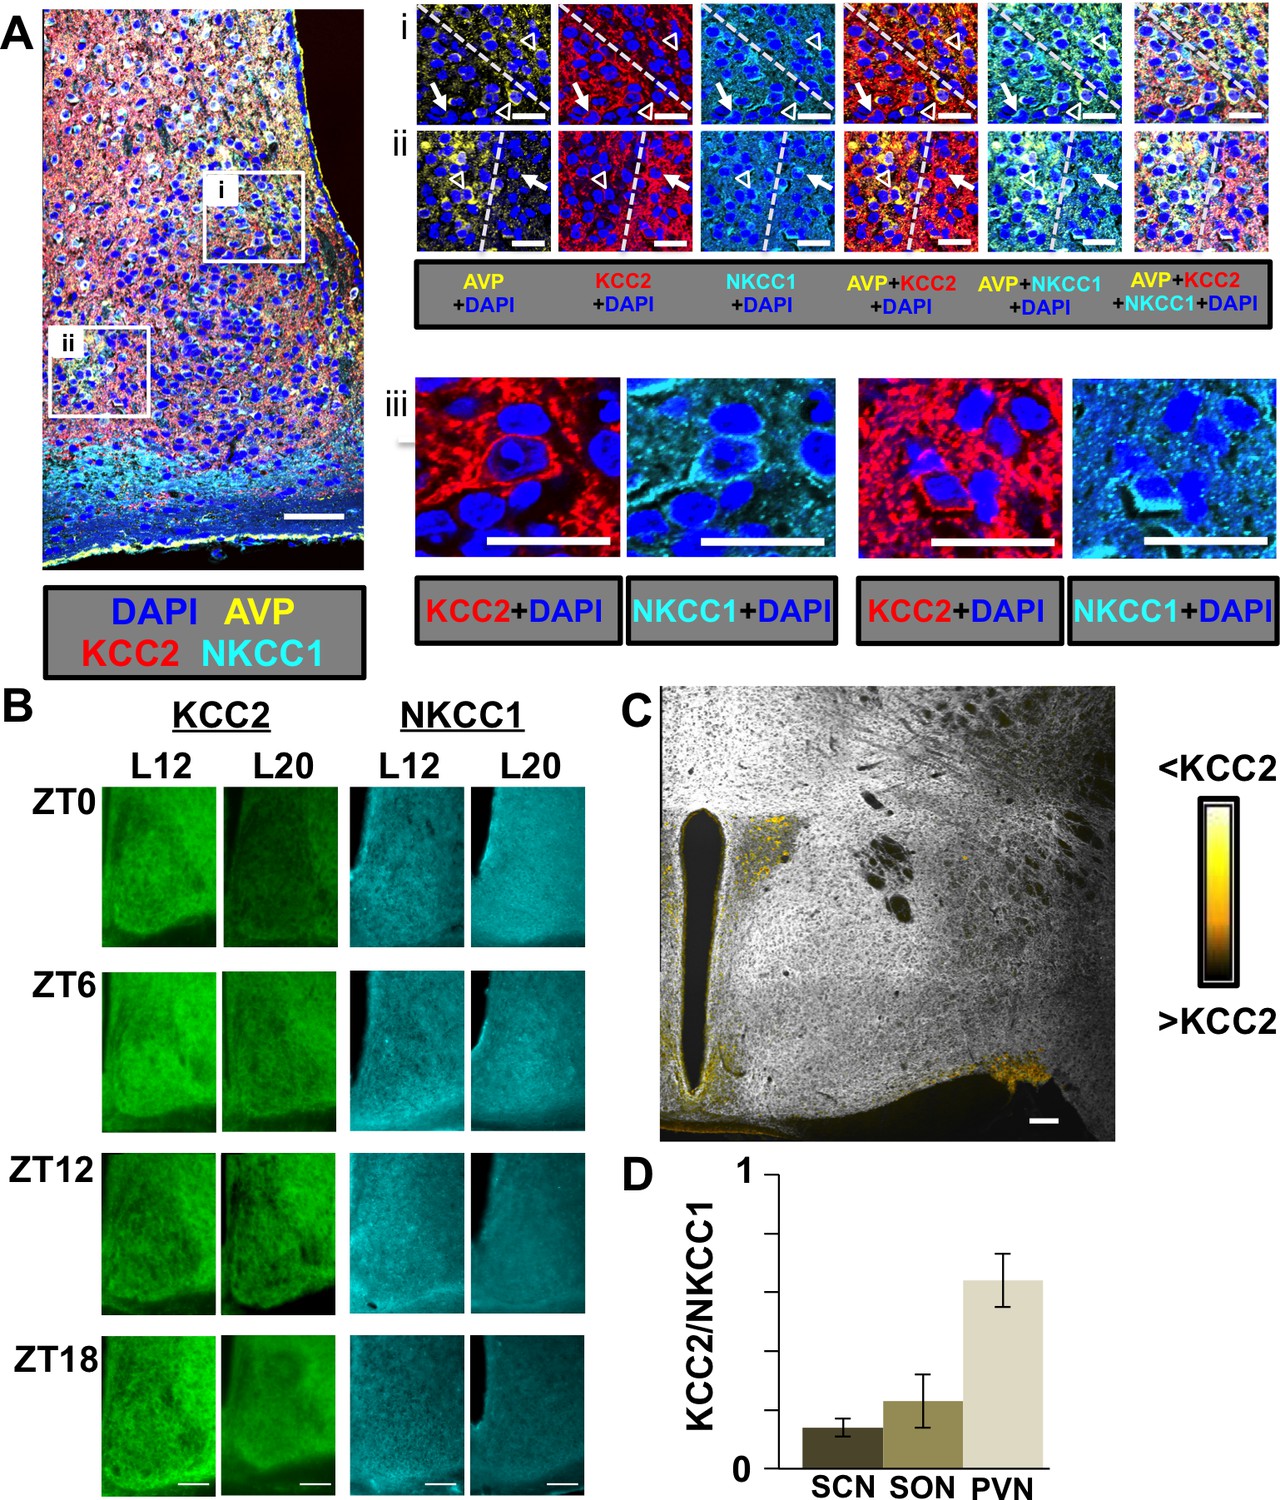
Long days eliminate region-specific rhythms in KCC2/NKCC1 expression.
(A) Representative images illustrating AVP, KCC2, NKCC1 in the L12 SCN at the time of lights-off (Zeitgeber Time 12, ZT12). Blue and orange circles on merged image represent regions used for analyses of SCN shell and core, respectively. (B) Ratiometric images illustrate variation in KCC2/NKCC1 expression in L12 mice and loss of the KCC2/NKCC1 rhythm in L20 mice. Scalebar = 50 μm. (C) The daily expression of KCC2/NKCC1 is rhythmic in the SCN core under L12, but not under L20 (n = 4–5 mice/timepoint/photoperiod). (D) Photoperiodic modulation of KCC2 and NKCC1 expression in the SCN. (E-F) L20 reduces daily mean KCC2 expression in the SCN core and increases daily mean NKCC1 expression in the SCN shell. # significant rhythm, CircWave cosinor test, p<0.05, n.s. not rhythmic. * Differs from L12 control, post-hoc Least Square Means contrasts, p<0.01 (color-coded for chloride co-transporter in 2D). See Supplementary file 1 for full statistical results.
Figure 2—figure supplement 1
Spatial, temporal, and photoperiodic changes in chloride co-transporter expression.
(A) Regional and cellular expression patterns of KCC2 and NKCC1 in the SCN. i and ii: Dashed yellow lines separate AVP+ and AVP- regions. White open triangles and white arrows indicate AVP+ and AVP- neurons, respectively. iii: Higher magnification images illustrating sub-cellular patterns of KCC2 and NKCC1 immunoreactivity. Scale bar for left image: 50 μm, Scale bar for i-iii: 20 μm. (B) Representative images of KCC2 and NKCC1 expression in L12 and L20 SCN at a subset of timepoints spanning the daily cycle. Scale bar: 50 μm. (C) KCC2 is also expressed at low levels in AVP+ neurons of the paraventricular nucleus (PVN) and supraoptic nucleus (SON). Scalebar = 50 μm. (D) Comparison of daily mean levels of KCC2/NKCC1 across AVP+ structures in the hypothalamus. Note that KCC2/NKCC1 was not rhythmic in AVP+ regions of the SCN, PVN, or SON, so values were collapsed across daily timepoints (n = 32–40 mice/structure).
Figure 3 with 1 supplement
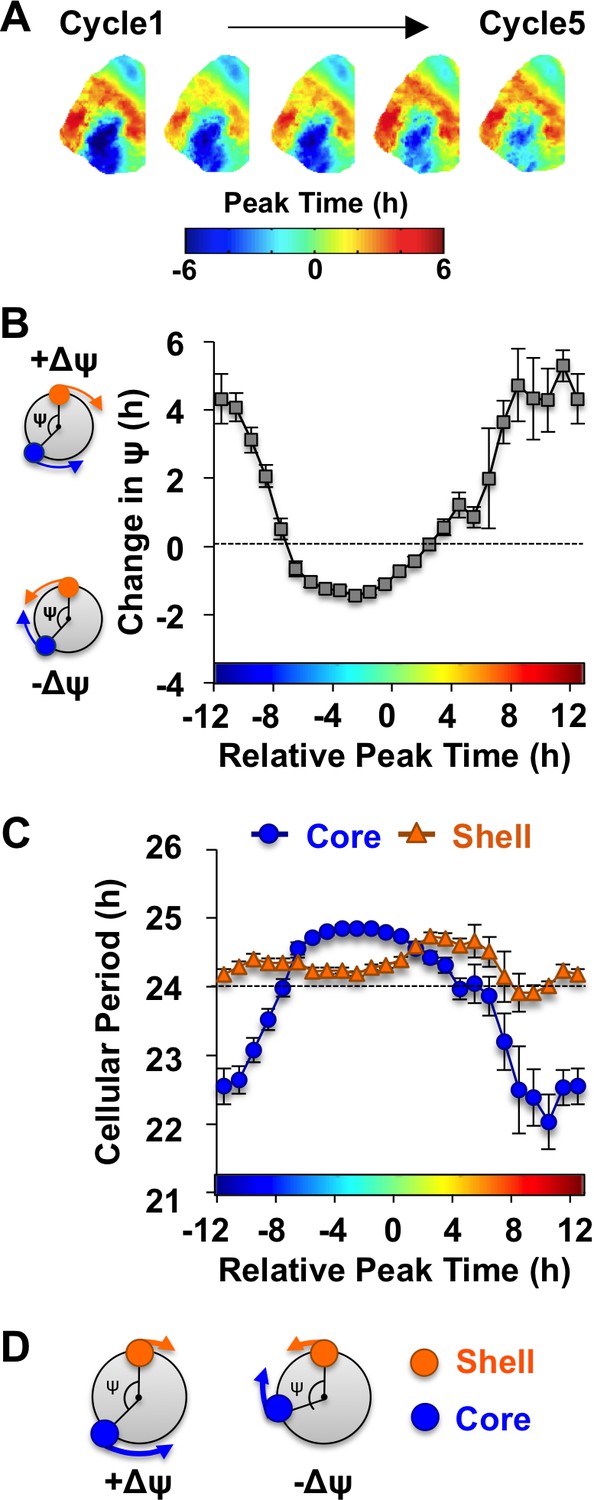
The SCN network recovers from the reorganized state induced by L20 due to intercellular signals that alter the phase and period of SCN core neurons.
(A) Composite phase maps illustrating the reduction in the shell-core phase difference over the first five cycles in vitro in vehicle-treated SCN slices collected from L20 mice. (B) Coupling response in vehicle-treated SCN slices collected from L20 mice, as quantified by the change in the shell-core phase difference (Change in ψ) over time in vitro (n = 35 L20 slices, see Figure 4—figure supplement 1 for cellular sample sizes). The color-coded bar along the abscissa represents the phase difference between shell and core neurons on Cycle 2 of recording (0 = core and shell neurons peak at same time, −8 = core neurons phase-lead by 8 hr). Polar plots along ordinate depict the direction of the coupling response for the positive and negative portion of the coupling response curve (blue and orange symbols represent core and shell neurons, respectively). (C) Cellular period responses of SCN core and shell neurons during network coupling. (D) Polar plots depicting cellular responses during network coupling in the positive and negative directions. See Supplementary file 2 for statistical results.
-
Figure 3—source data 1
Cellular data for coupling and period responses in Figure 3 (Vehicle conditions).
- https://doi.org/10.7554/eLife.49578.009
Figure 3—figure supplement 1
Modulation of chloride co-transporter function influences L12 SCN period.
(A) Inhibition of chloride transport lengthens SCN period through modulation of GABAA signaling. Label on abscissa indicates antagonist co-treatment group (n = 6–9 slices per group). (B) Modulation of chloride transport lengthens the period of both SCN core and shell neurons (Vehicle: 609 core neurons and 554 shell neurons from 19 L12 slices; VU: 158 core neurons and 138 shell neurons from 4 L12 slices; BU: 139 core neurons and 118 shell neurons from 4 L12 slices; CLP290: 399 core neurons and 226 shell neurons from 6 L12 slices). (C-D) Modulation of chloride transport does not alter spatiotemporal organization in L12 slices (C) or increase damping of cellular PER2::LUC rhythms (D). * Differs from vehicle control (color-coded for cell-type), + Differs from within-group complementary region, post-hoc Least Square Means contrasts, p<0.05.
Figure 4 with 1 supplement
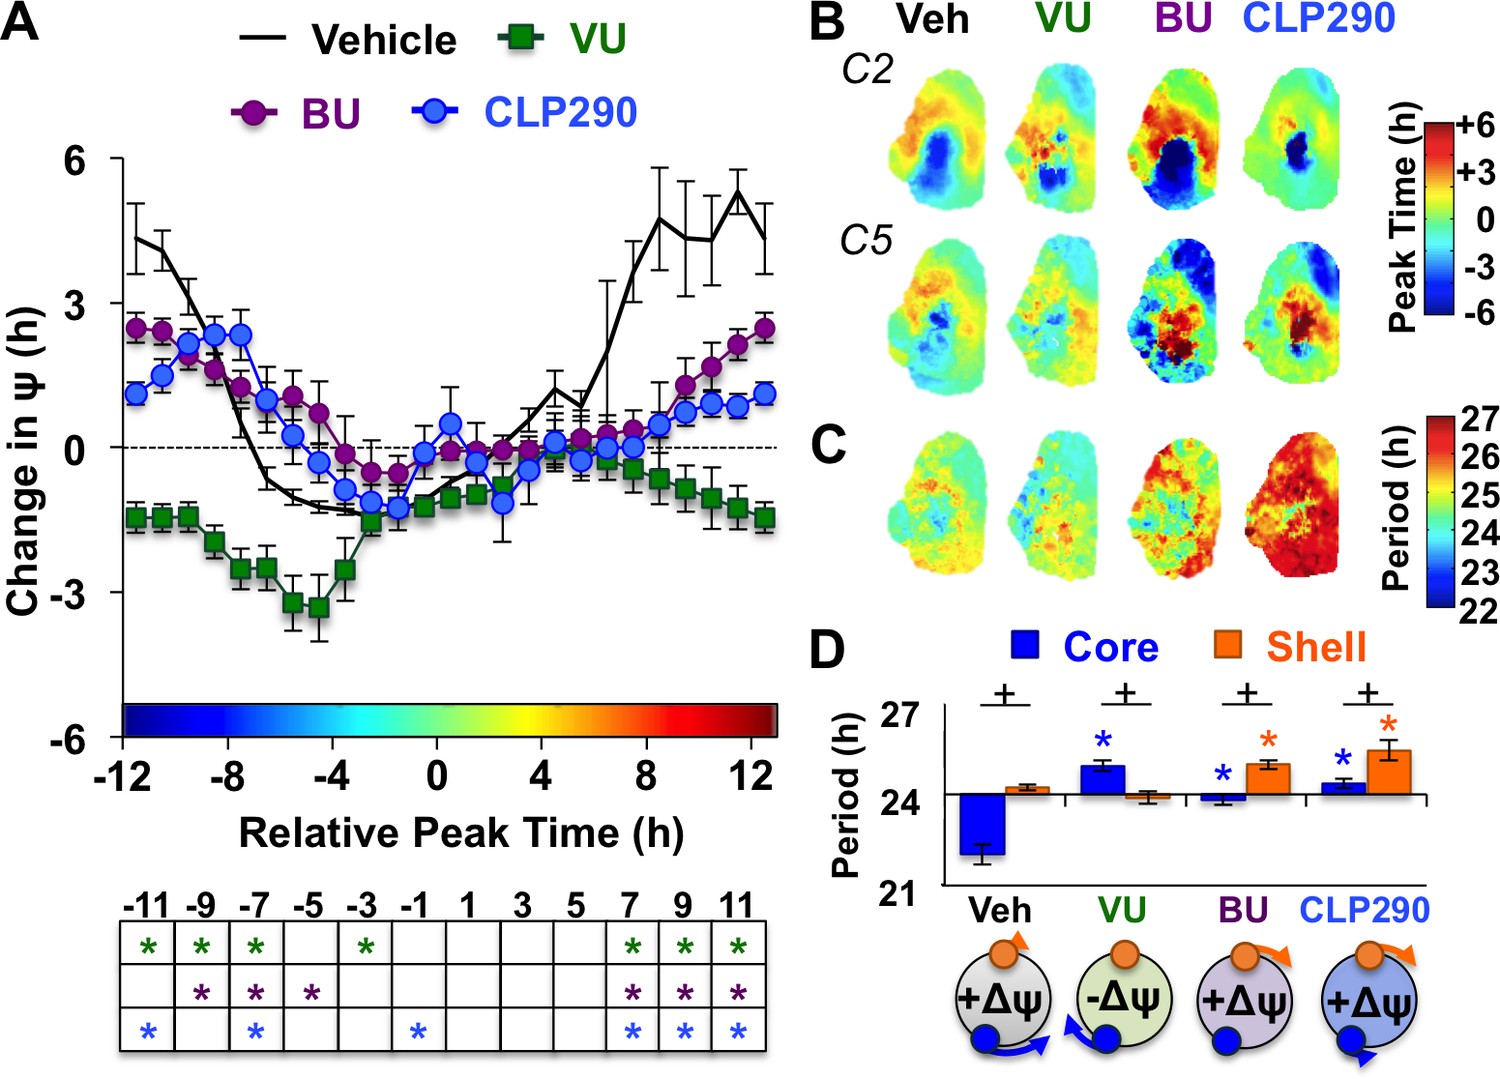
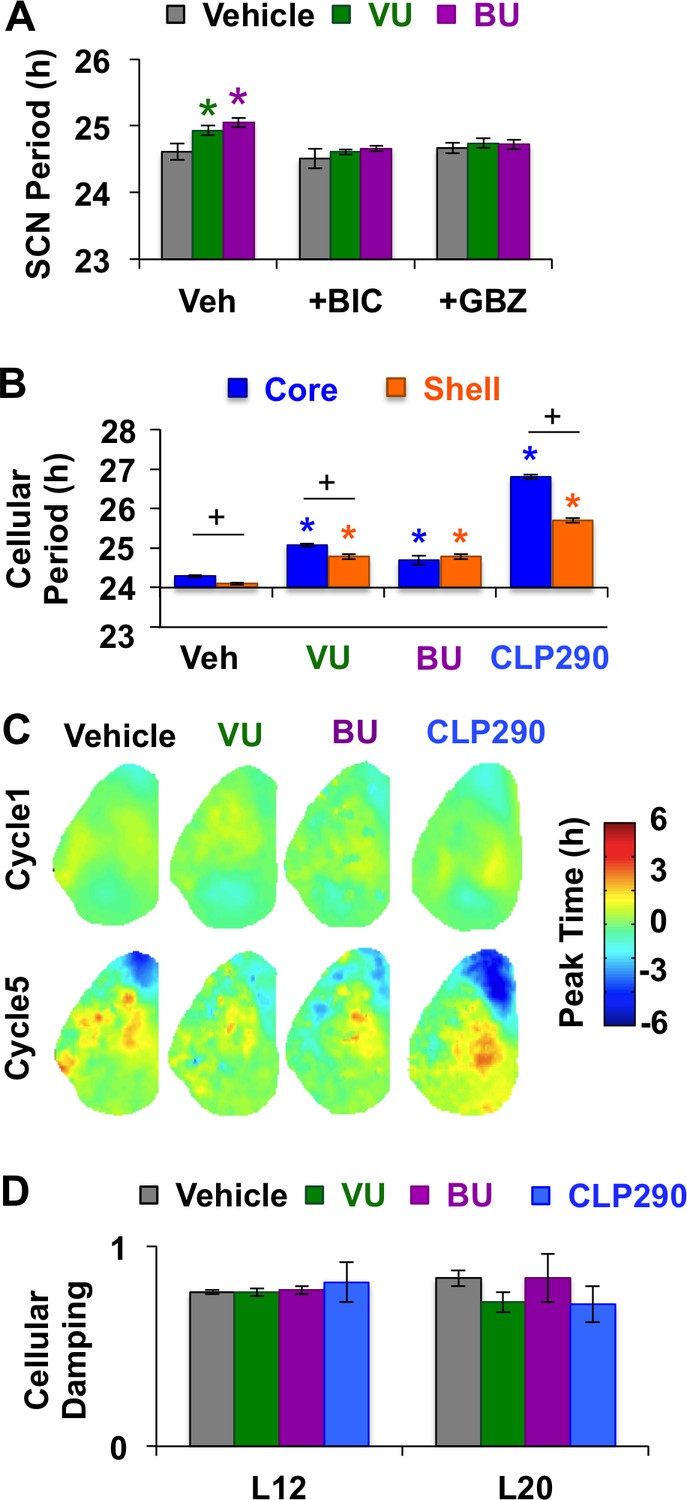
KCC2 and NKCC1 influence network dynamics during SCN coupling.
(A) Coupling response curves for Vehicle, VU, BU, and CLP290 treatment (n = 6 L20 slices/antagonist, see Figure 4—figure supplement 1 for cellular sample sizes). (B) Average phase maps depicting SCN spatiotemporal organization on Cycle 2 (C2) and Cycle 5 (C5) in vitro illustrating drug-induced effects on the magnitude and direction of network coupling. (C) Average period maps illustrating region-specific effects on cellular period. (D) Average period length (± SEM) of SCN shell and core neurons provided Vehicle, VU, BU, or CLP290 treatment while in the reorganized state induced by L20 (i.e., core-shell relationship = −11 hr ± 2 hr). See Figure 4—figure supplement 1 for full period response curves. Below X-axis: Schematic illustrating how network coupling is altered by region-specific modulation of period responses, with the net effect on the direction of network resynchronization indicated within each polar plot. * Differs from Vehicle control, post-hoc Least Square Means contrasts, p<0.01 (color-coded by antagonist in 4A), + Differs from within-group complementary region, LSM contrasts, p<0.05. See Supplementary file 2 for full statistical results. Other conventions as in Figure 3.
-
Figure 4—source data 1
Cellular data for coupling and period responses in Figure 4 (BU, VU, and CLP290 antagonist conditions).
- https://doi.org/10.7554/eLife.49578.012
Figure 4—figure supplement 1
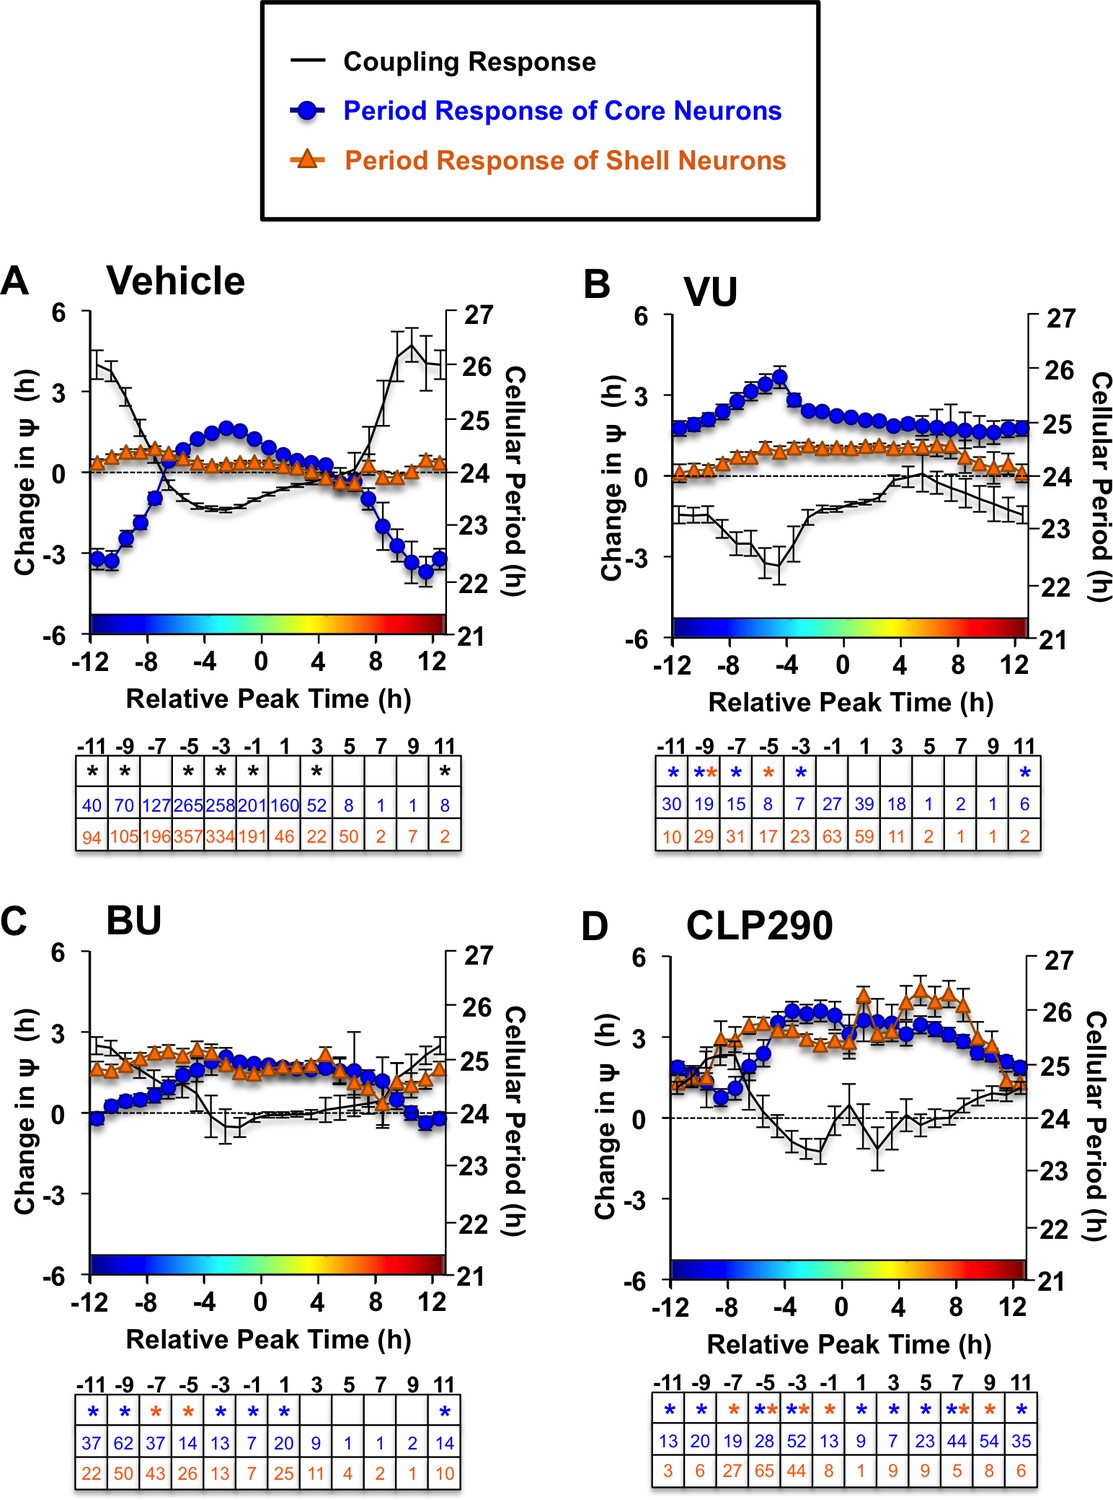
Full coupling and period response curves under Vehicle (A), VU (B) and BU (C) and CLP290 (D) conditions (L20: n = 8–35 slices/group).
Table below each abscissa indicate statistical results and cellular sample sizes. * Differs from vehicle control (color-coded for cell-type), post-hoc Least Square Means contrasts, p<0.05.
Figure 5 with 1 supplement
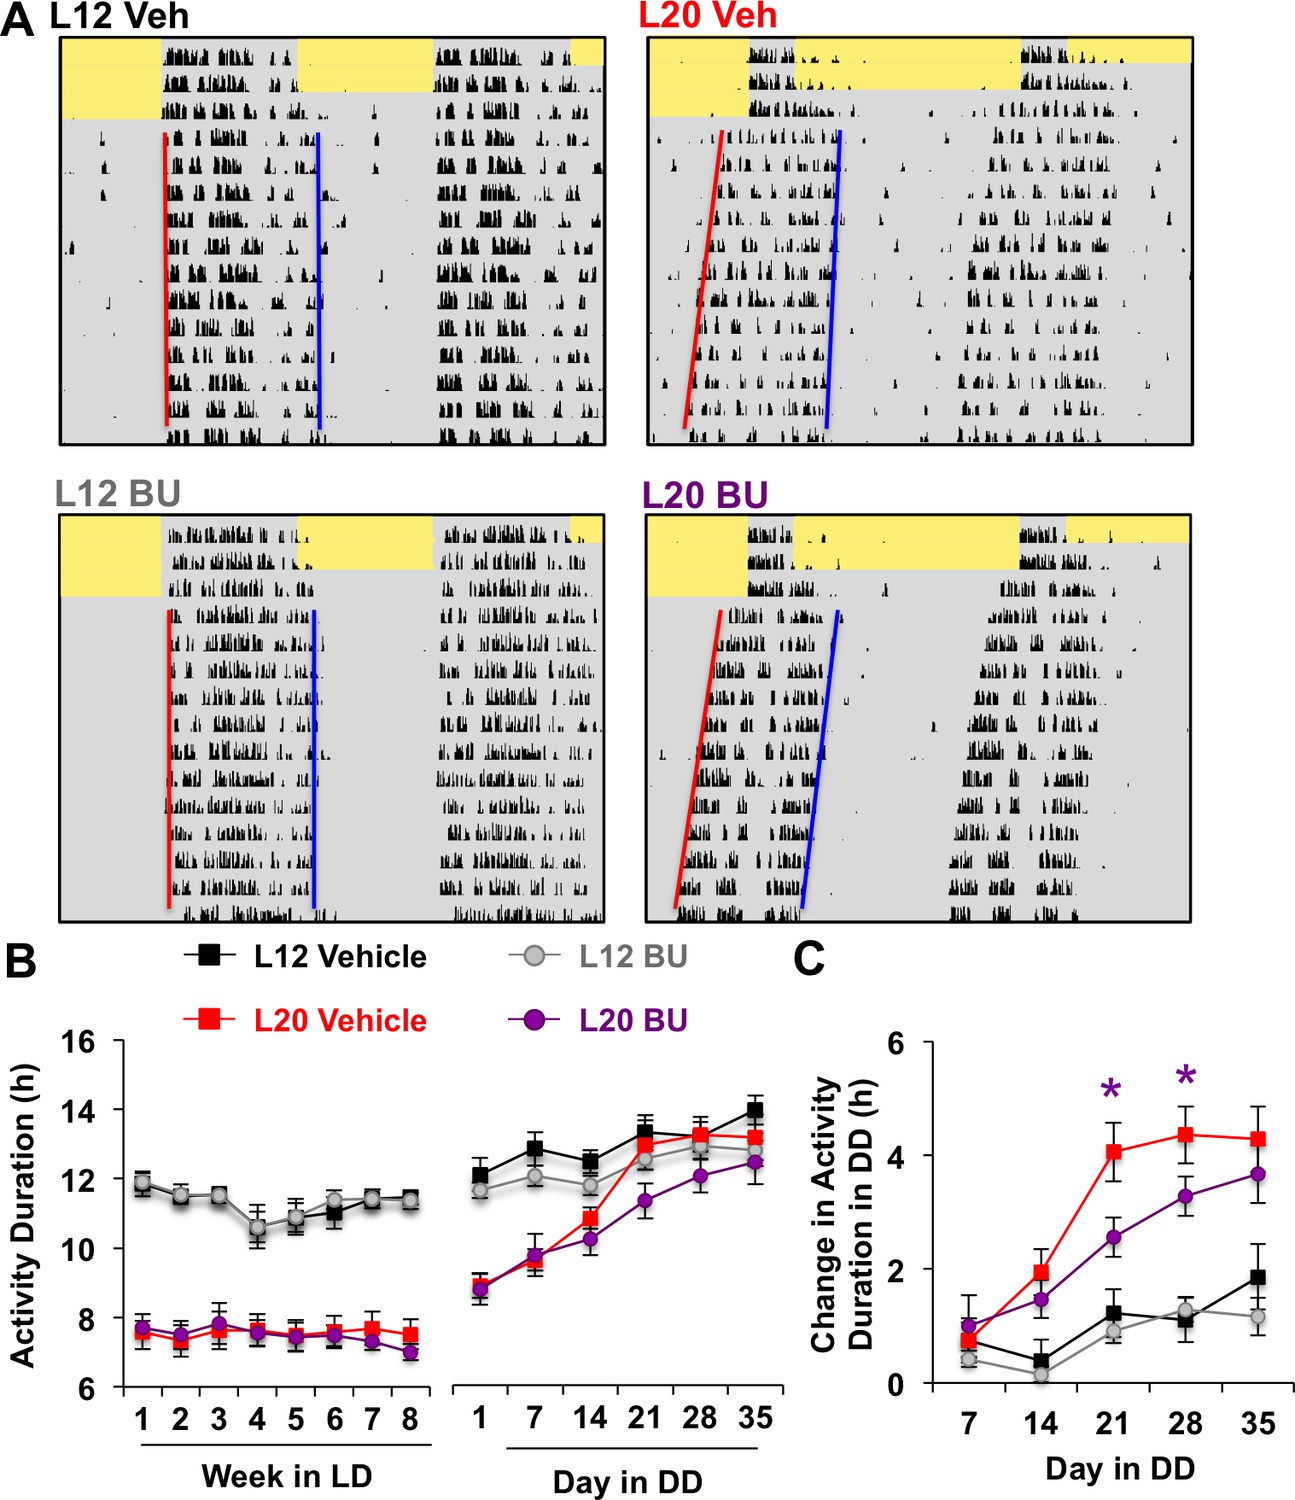
Photoperiodic changes in NKCC1 modulate circadian plasticity in vivo after release into constant darkness (DD).
(A) Double-plotted actograms representing effects of bumetanide (BU) on circadian waveform during entrained and DD conditions. Yellow and gray shading represent light and darkness, respectively. Superimposed red and blue lines illustrate free-running period of activity onset and offset, respectively. See Figure 5—figure supplement 1 for additional representative actograms. (B) Photoperiod, but not BU, influenced activity duration during photo-entrainment (n = 6 mice/photoperiod/treatment). (C) BU influenced plasticity in circadian waveform after release from L20 into DD by slowing the expansion of activity duration. * Differs from photoperiod-matched vehicle control, LSM contrasts, p<0.05. See Supplementary file 1 for full statistical results.
Figure 5—figure supplement 1
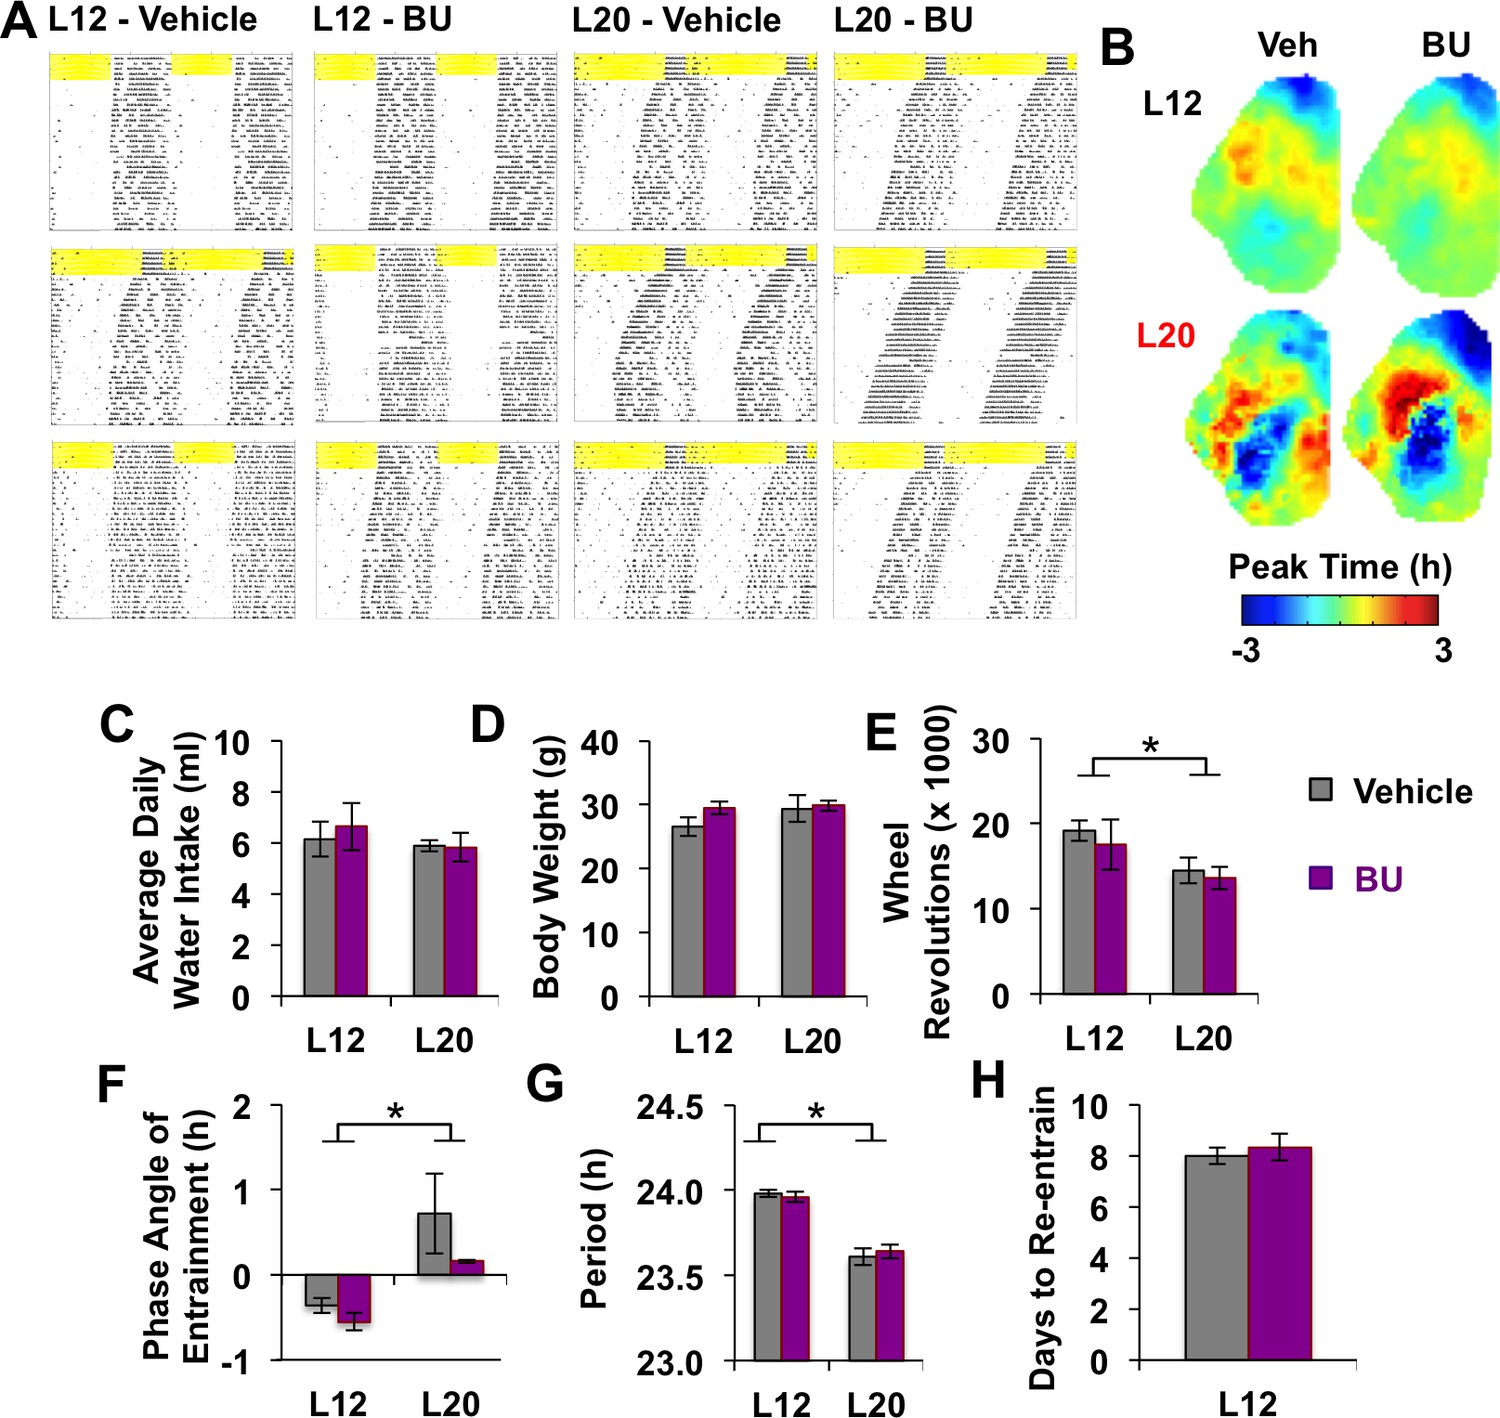
Effects of systemic BU administration in vivo.
(A) Representative double-plotted actograms of three additional mice in each photoperiod and drug group. (B) Average phase maps of PER2::LUC phase on the first cycle in vitro illustrating that BU did not influence SCN organization under L12 or L20 (n = 6 slices/group). (C-H) BU did not influence water intake (C), body weight (D), activity levels (E), phase angle of entrainment (F), free-running period after release into DD (G), or the number of days to re-entrain activity onset to a 6 hr advance of the light:dark cycle (H). * Full Factorial ANOVA: Main effect of photoperiod, p<0.05 (n = 6 mice/group).
Figure 6 with 1 supplement
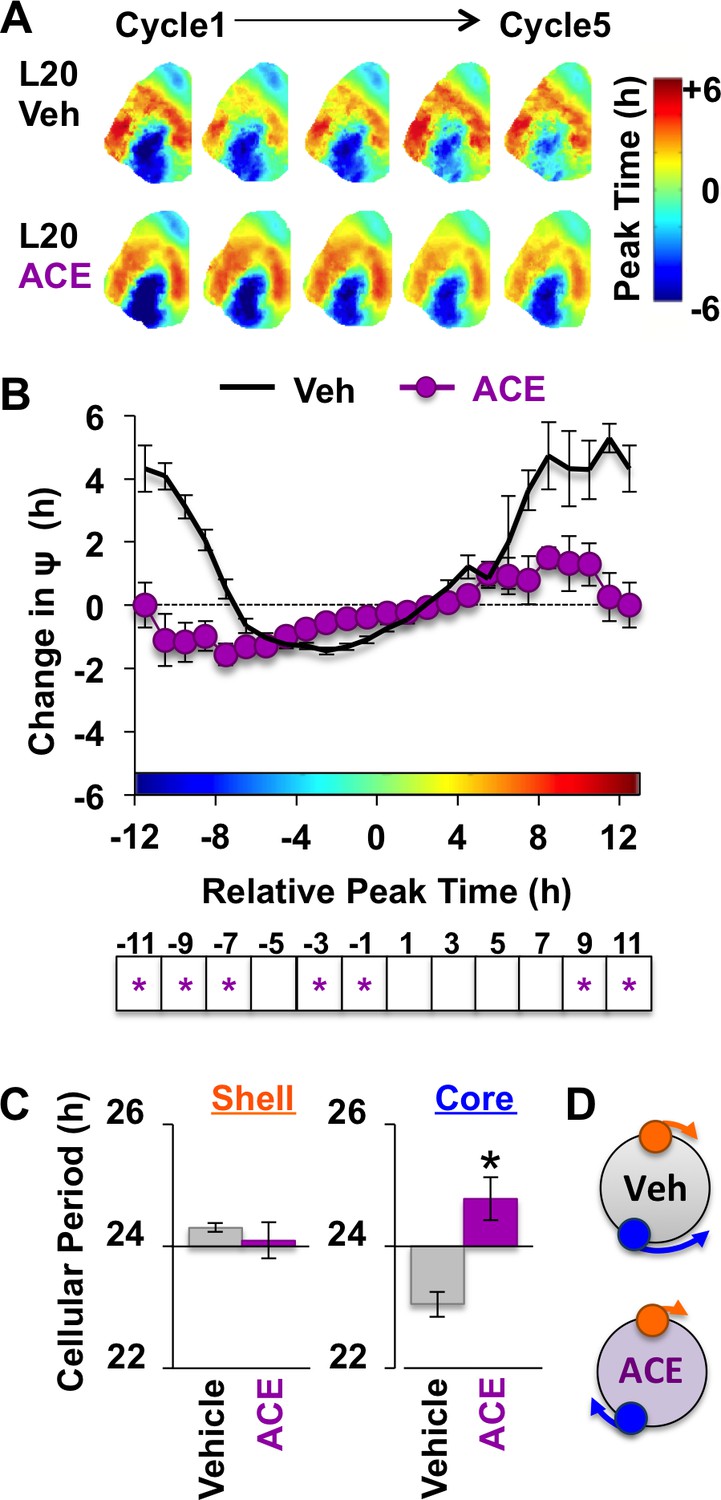
Non-canonical GABAA signaling is necessary for restoring phase synchrony in the SCN network in vitro.
(A) Average phase maps for L20 slices treated with ACE or vehicle-treated medium. (B) ACE attenuates SCN coupling responses after network reorganization by L20 (ACE n = 16 L20 slices, see Figure 6—figure supplement 1 for cellular sample sizes). (C) ACE lengthens the period response of SCN core neurons after network reorganization by L20 (i.e., core-shell relationship = −11 hr ± 2 hr, see Figure 6—figure supplement 1 for full period response curves). (D) Schematic illustrating effects of ACE on cellular period and coupling response in the polarized SCN state induced by L20. * Differs from vehicle control, LSM contrasts, p<0.05. See Supplementary file 2 for full statistical results. Other conventions as in Figure 4.
-
Figure 6—source data 1
Cellular data for coupling and period responses in Figure 6 (ACE conditions).
- https://doi.org/10.7554/eLife.49578.017
Figure 6—figure supplement 1
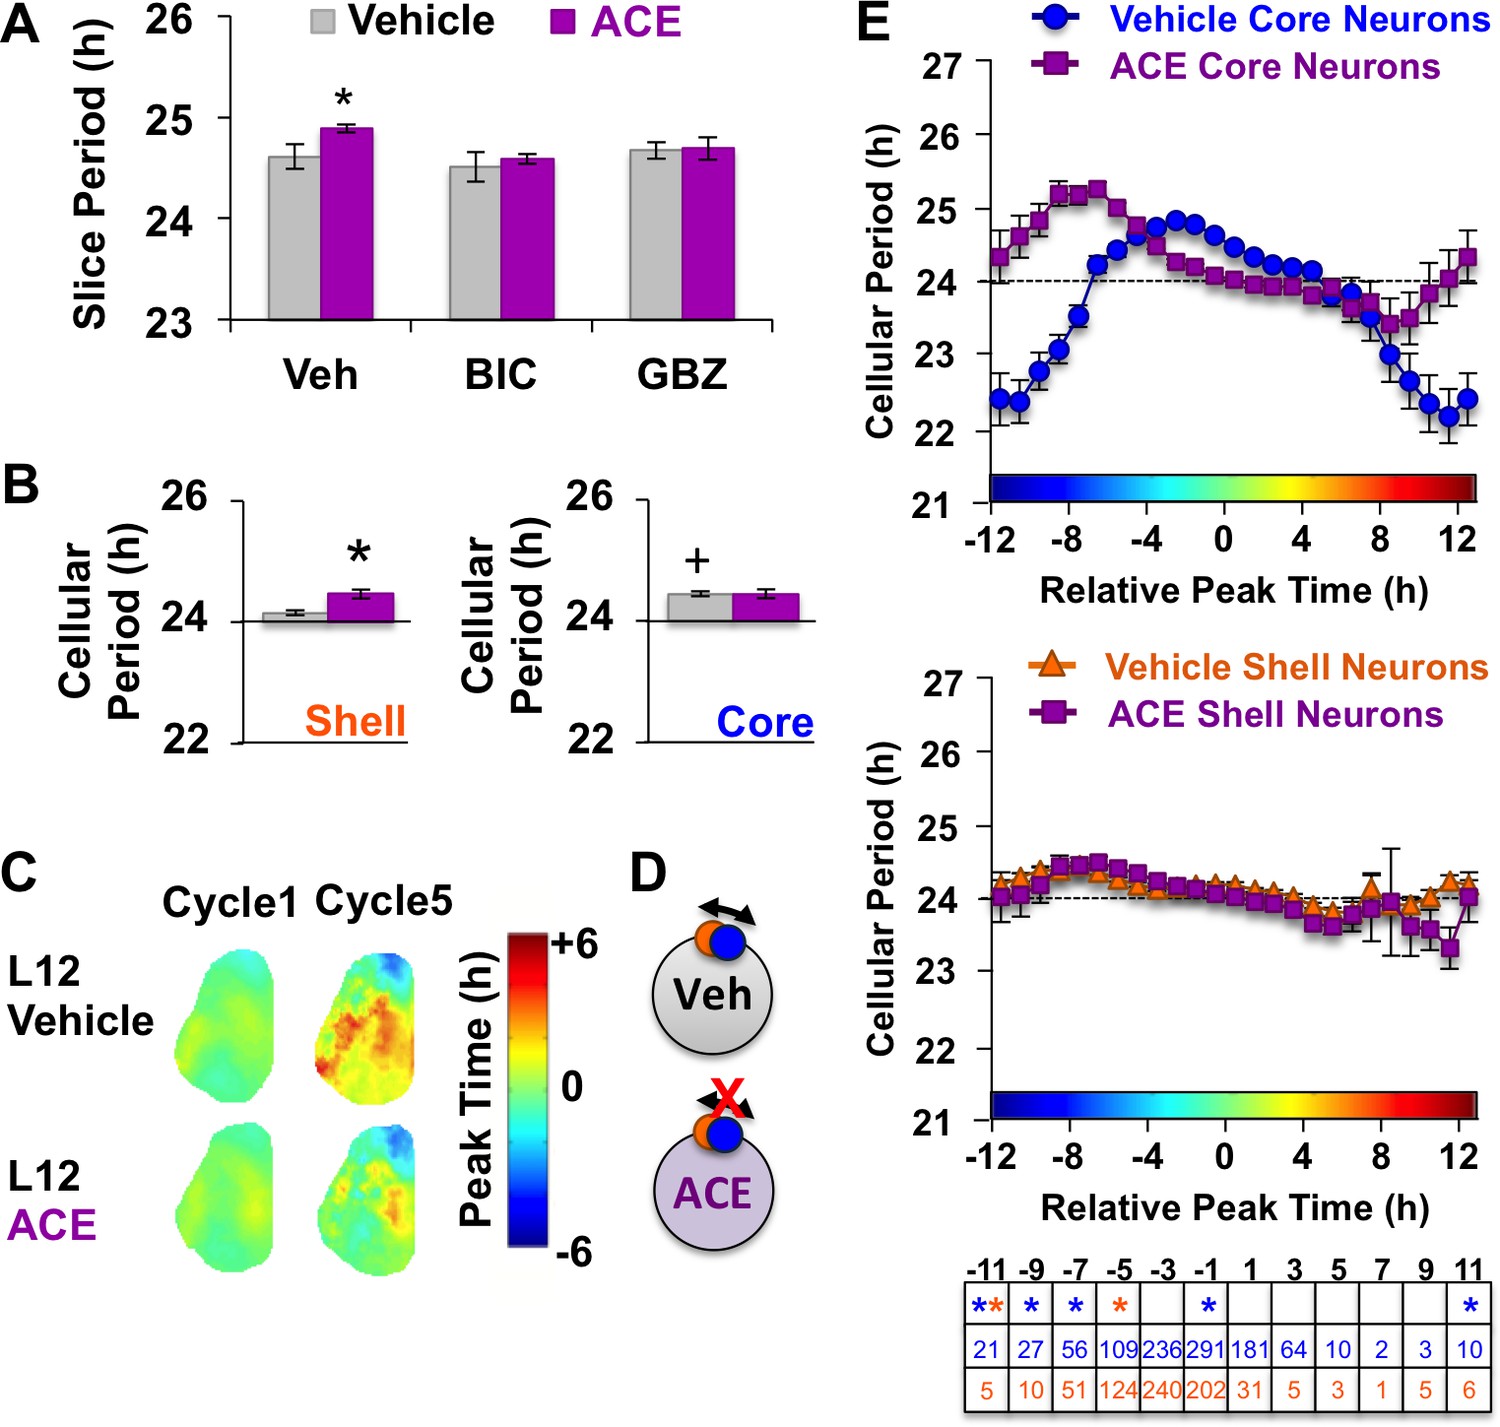
Non-canonical GABAA signaling modulates L12 SCN by affecting the period of SCN shell neurons.
(A) Acetazolamide (ACE) lengthened the whole SCN period via changes in GABAA signaling. Label on abscissa indicates antagonist co-treatment group (n = 6–9 slices/group). (B) ACE lengthens the period of SCN shell neurons, but not SCN core neurons in L12 slices (Vehicle: 609 core neurons and 554 shell neurons from 19 L12 slices, ACE: n = 455 core neurons and 296 shell neurons from 8 L12 slices). (C) Composite phase maps illustrating that ACE attenuated the shell-core phase difference that manifests in L12 slices over time in vitro. (D) Schematic illustrating effects of ACE in L12 slices. (E) Full period response curves displayed by L20 SCN neurons during exposure to vehicle- or ACE-treated medium. Table below each abscissa indicate statistical results and cellular sample sizes for ACE. * Differs from vehicle control (color-coded for cell-type), + Differs from within-group complementary region, post-hoc Least Square Means contrasts, p<0.05.
Tables
Key resources table
| Reagent type (species) or resource | Designation | Source or reference | Identifiers | Additional information |
|---|---|---|---|---|
| Genetic reagent (M. musculus) | mPer2Lucmouse | Yoo et al., 2004 | RRID: IMSR_JAX:006852 | |
| Antibody | anti-AVP (Guinea Pig polyclonal) | Peninsula Laboratories Cat# T-5048 | RRID: AB_2313978 | Primary antibody, (1:1K) |
| Antibody | anti-NKCC1 (Goat polyclonal) | Abcam Cat#ab99558 | RRID:AB_10675276 | Primary antibody, (1:500) |
| Antibody | anti-KCC2 (Rabbit polyclonal) | Millipore Cat# 07–432 | RRID:AB_310611 | Primary antibody, (1:500) |
| Antibody | Anti-Guinea Pig, Alexa Fluor 647 | Jackson Immunoresearch Cat#706-605-148 | RRID:AB_10895029 | Secondary antibody, (1:200) |
| Antibody | Donkey Anti-Goat, Alexa Fluor 555 | Abcam Cat#ab150130 | RRID:AB_10894526 | Secondary antibody, (1:200) |
| Antibody | Donkey Anti-Rabbit, Alexa Fluor 488 | Jackson Immunoresearch Cat#711-545-152 | RRID:AB_10893040 | Secondary antibody, (1:200) |
| Commercial assay or kit | Bumetanide ELISA Kit | Neogen Corporation Cat#103719–1 |
Additional files
-
Supplementary file 1
Statistical analyses for GABA resetting, chloride co-transporter expression, and behavioral results.
- https://doi.org/10.7554/eLife.49578.018
-
Supplementary file 2
Statistical analyses for coupling and cellular period responses.
- https://doi.org/10.7554/eLife.49578.019
-
Transparent reporting form
- https://doi.org/10.7554/eLife.49578.020
Download links
A two-part list of links to download the article, or parts of the article, in various formats.
Downloads (link to download the article as PDF)
Open citations (links to open the citations from this article in various online reference manager services)
Cite this article (links to download the citations from this article in formats compatible with various reference manager tools)
Seasonal plasticity in GABAA signaling is necessary for restoring phase synchrony in the master circadian clock network
eLife 8:e49578.
https://doi.org/10.7554/eLife.49578


