Electron transport chain biogenesis activated by a JNK-insulin-Myc relay primes mitochondrial inheritance in Drosophila
- National Heart, Lung, and Blood Institute, National Institutes of Health, United States
Figures
Figure 1 with 1 supplement
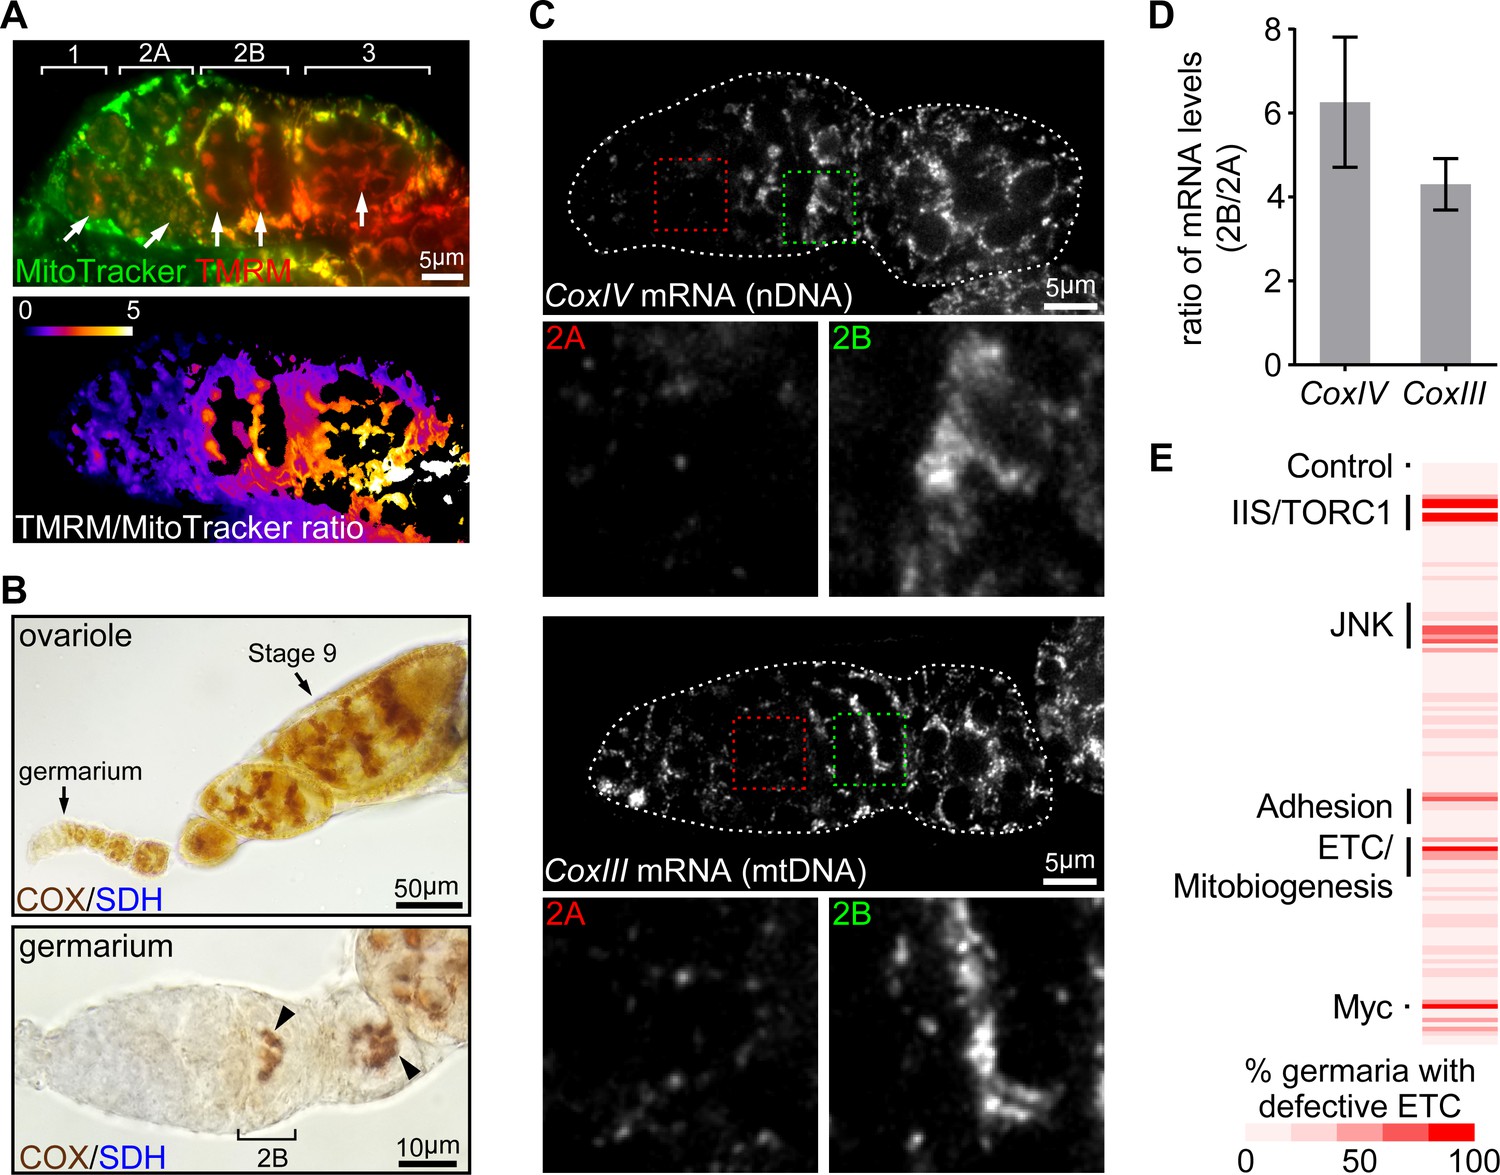
ETC activity and gene expression sharply increase at germarium stage 2B.
(A) Upper panel: a representative image of a germarium stained with TMRM (a membrane potential marker) and MitoTracker Green (a mitochondrial mass marker). Germarium regions are indicated. Arrows indicate mitochondria in germ cells (GCs). Lower panel: TMRM/MitoTracker Green ratiometric image, indicating that mitochondria membrane potential in stem cells and dividing cysts is low, but markedly increased in 16-cell cysts and budding egg chambers. Scale bar, 5 μm. (B) Upper panel: a representative image of a wt ovariole (from germarium to stage nine egg chamber) stained for the COX/SDH dual activities. Lower panel: a representative high-magnification image of a germarium stained for COX/SDH. Note the onset of COX/SDH activity in region 2B of the germarium (arrowhead). Scale bars, 50 μm for the upper panel and 10 μm for the lower panel. (C) Visualization of the CoxIV and CoxIII mRNAs in germaria from wt flies by FISH with fluorescently labeled DNA probes. Germaria are outlined with dotted lines. For each mRNA labeling, lower panels illustrate the enlarged areas of germarium region 2A (red dotted line) and 2B (green dotted line), respectively, shown in the upper panels. Scale bars, 5 μm. (D) Quantification of the relative expression level of CoxIV or CoxIII mRNA in different regions of germarium. Note that both transcripts are markedly induced in region 2B germarium. Error bars represent SEM. (E) RNAi screen for genes required to induce ETC activity in germaria. For each RNAi line, the impact on ETC activity is scored as the percentage of germaria with reduced COX/SDH staining.
-
Figure 1—source data 1
Ratio of mRNA in region 2B and region 2A of the germarium.
- https://doi.org/10.7554/eLife.49309.004
Figure 1—figure supplement 1
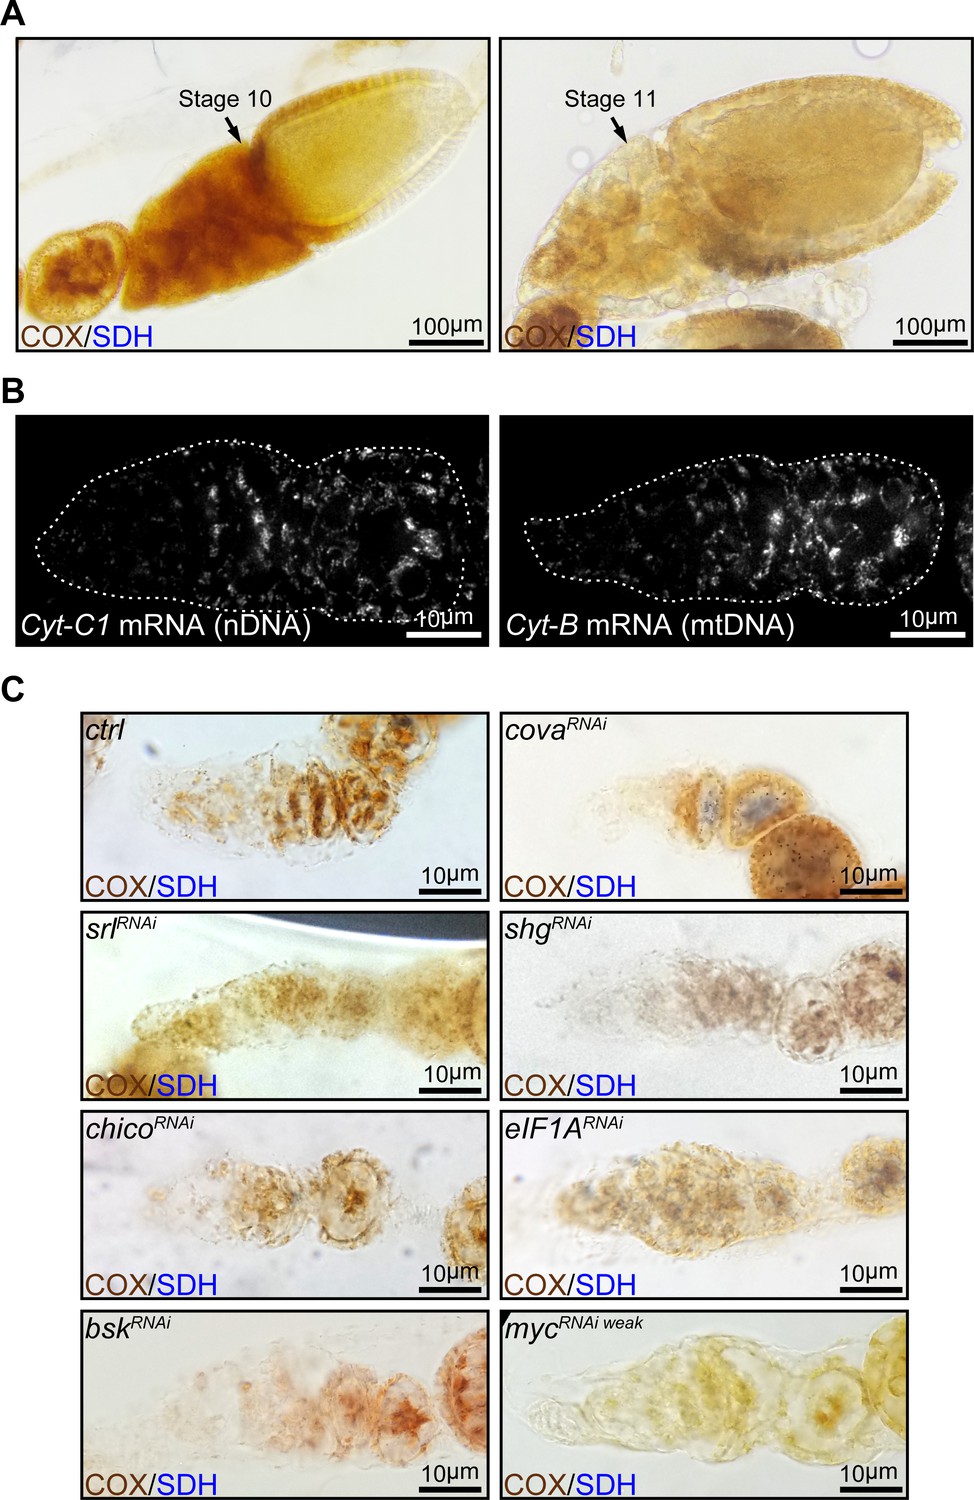
ETC activities at middle stages of oogenesis and expression of complex III genes in the germarium.
(A) Egg chambers from wt flies stained with dual enzymatic COX/SDH histochemistry. Note that ETC activities are high in the stage-10 egg chamber, but dramatically reduced in a stage-11 egg chamber. Scale bars, 100 μm. (B) Visualization of Cyt-C1 and Cyt-B mRNA in germaria from wt flies by FISH with fluorescently labeled DNA probes. Germaria are outlined with dotted lines. Scale bars, 10 μm. (C) COX/SDH staining for germaria with reduced ETC activity (positive hits) from the candidate RNAi screen. Scale bars, 10 μm.
Figure 2 with 2 supplements
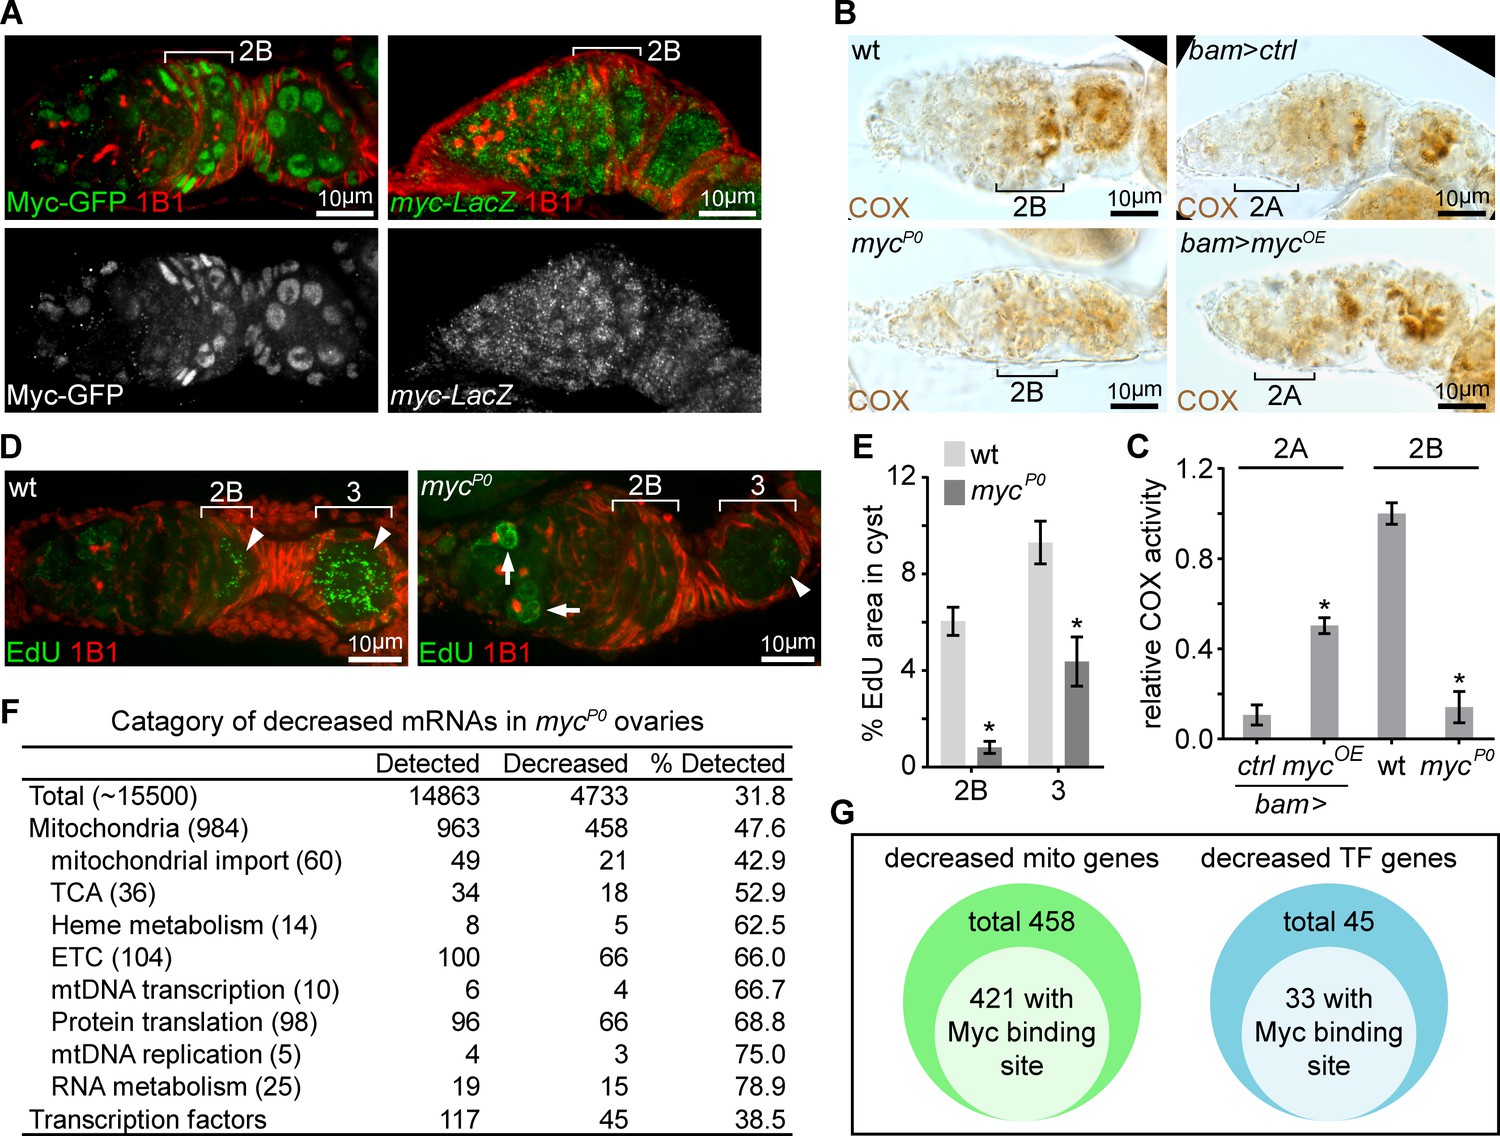
A candidate RNAi screen reveals Myc as an essential regulator of mitochondrial biogenesis.
(A) Left panel: germarium of a fly endogenously expressing Myc-GFP stained with anti-GFP (Green) and anti-1B1 (Red). Right panel: germarium of a fly expressing LacZ driven by the myc endogenous promoter stained with anti-β-galactosidase (Green) and anti-1B1 (Red). Myc protein is expressed at low level in GSCs and dividing cysts, but markedly induced from region 2B germ cells. In contrast, myc promoter activity is uniform in the germarium. Scale bars, 10 μm. (B) COX activity in germaria from wt, mycP0, bam >ctrl, and bam >mycOE ovaries visualized by COX single staining. The activities are normalized to that of region 2B cysts wt. COX activity is significantly reduced in the mycP0 mutant, but is ectopically induced when Myc is over-expressed in region 2A by bam-Gal4. Scale bars, 10 μm. (C) Quantifications of relative COX activity in germarium regions from wt, mycP0, bam >ctrl, and bam >mycOE flies. ETC activities is normalized to that in the wt 2B cysts. n = 10 germaria for each genotype. Error bars represent SEM. *p<0.05. (D) Visualization of mtDNA replication in germaria from wt and mycP0 ovaries with EdU incorporation (Green) and co-staining with anti-1B1 (Red). Arrowheads point to EdU incorporation into mtDNA, while arrows point to EdU incorporation into the nuclear genome. Scale bars, 10 μm. (E) Area of EdU puncta (pixels) normalized to total pixels at indicated germarium stages in the germline cysts from wt and mycP0 ovaries. n = 11 cysts for each column. Error bars represent SEM. *p<0.005. (F) Table of genes functioning in mitochondrial processes with at least 3-fold decreased expression in mycP0 ovaries compared with wt ovaries. (G) Diagrams of decreased genes encoding mitochondrial processes and transcription factors (TFs) in the mycP0 ovaries. A number of genes in either category has a Myc binding site in their regulatory region.
-
Figure 2—source data 1
Relative ETC activity and mtDNA area in the germarium regions.
- https://doi.org/10.7554/eLife.49309.008
Figure 2—figure supplement 1
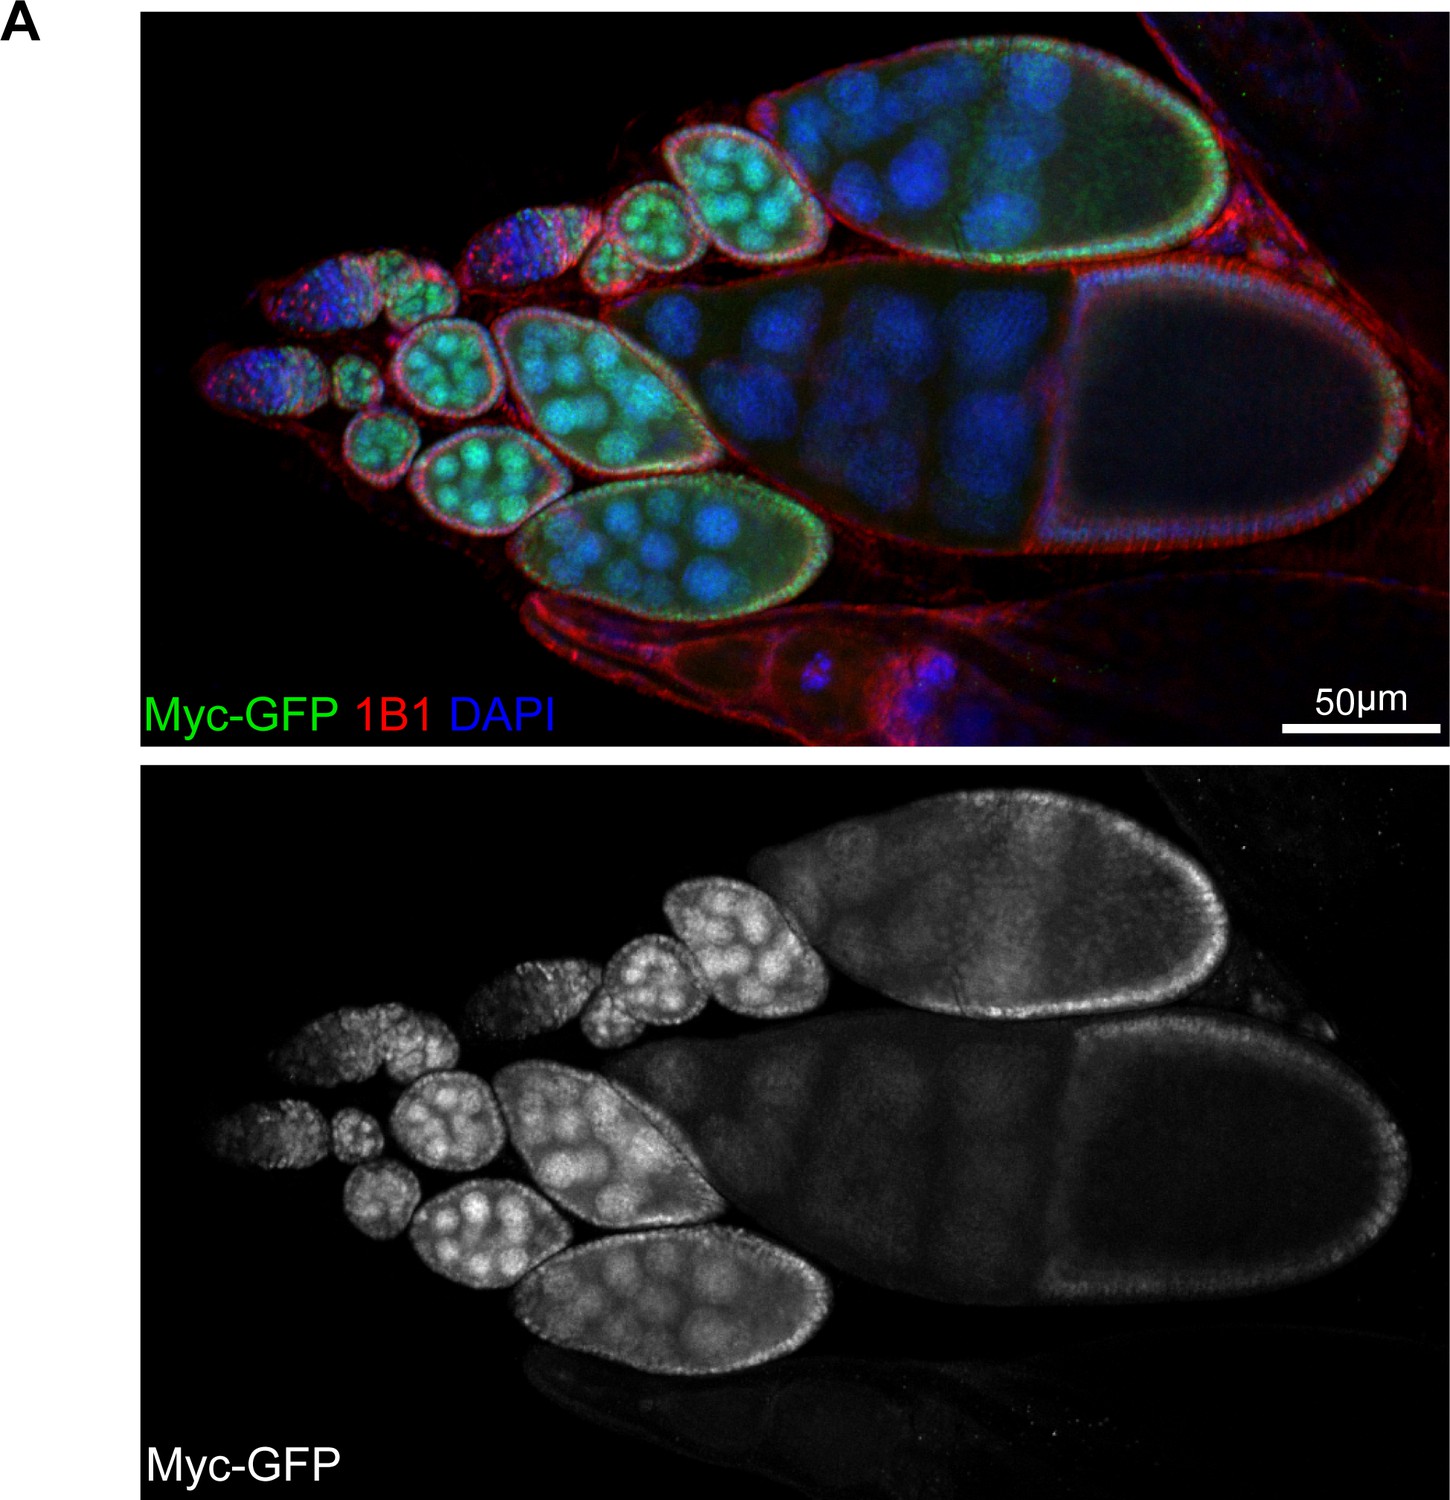
Myc protein pattern in the ovary.
(A) A representative low-magnification image of ovarioles from flies endogenously expressing Myc-GFP stained with anti-GFP, anti-1B1, and DAPI. Note that Myc level is low in early germarium stages, becomes high from germarium region 2B, and reduces from the stage-10 egg chamber. Scale bar, 50 μm.
Figure 2—figure supplement 2
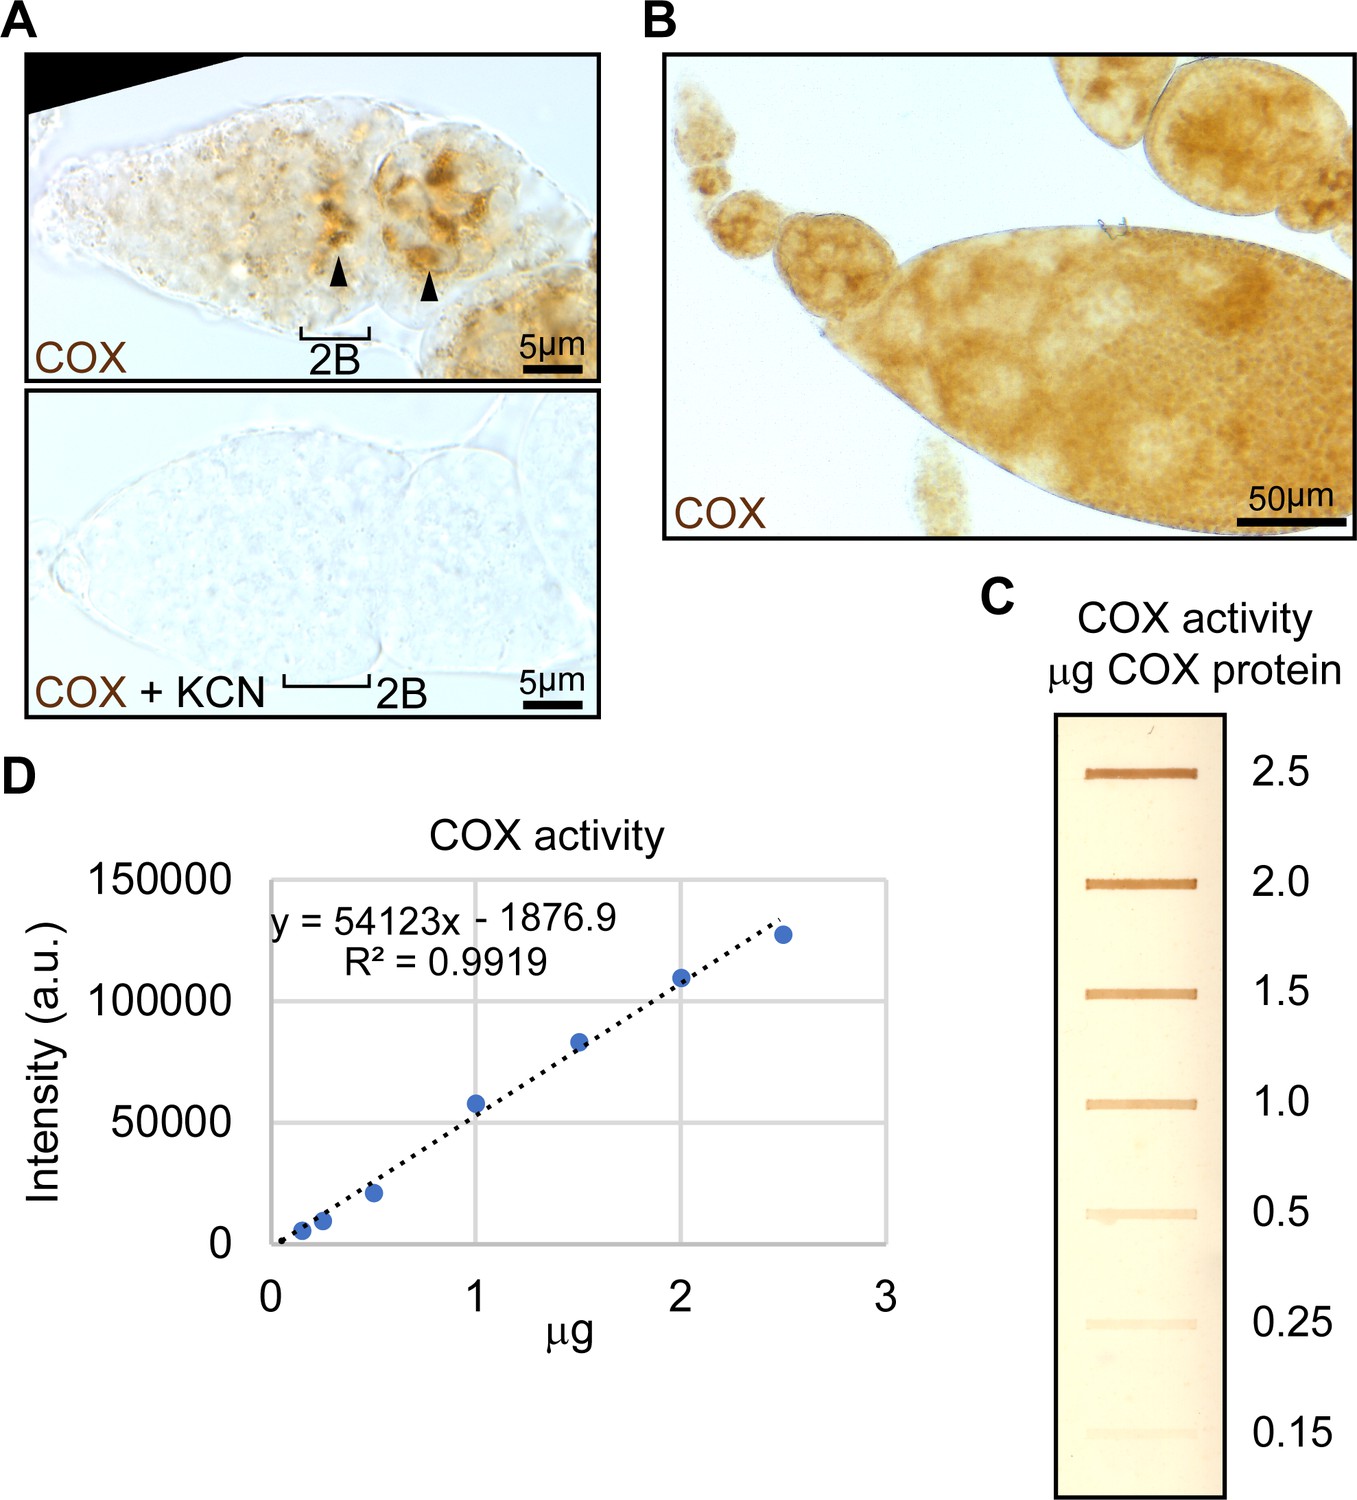
Standards for COX activity staining reveal that staining intensity is linearly correlated with the amount of complexes.
(A) Upper panel: representative images of wt germaria stained for COX activity, respectively. Lower panel: germaria from wt ovaries incubated in COX activity solution supplied with complex IV inhibitor KCN. Note the onset of COX activity from the germarium region 2B (arrowhead). Scale bars, 5 μm. (B) COX activity was visualized in an ovariole from germarium to the stage-10 egg chamber. Scale bar, 50 μm. (C) Standards for COX activity visualized on a nitrocellulose membrane. COX proteins from bovine heart were used for generating COX standards. The amounts of COX proteins for each band were indicated. (D) Intensities of bands from (C) were calculated by the ‘Gels’ function in ImageJ and plotted against corresponding COX protein amounts. COX protein amounts and their corresponding band intensity values fit well a linear relation (R2 = 0.9923).
Figure 3 with 1 supplement
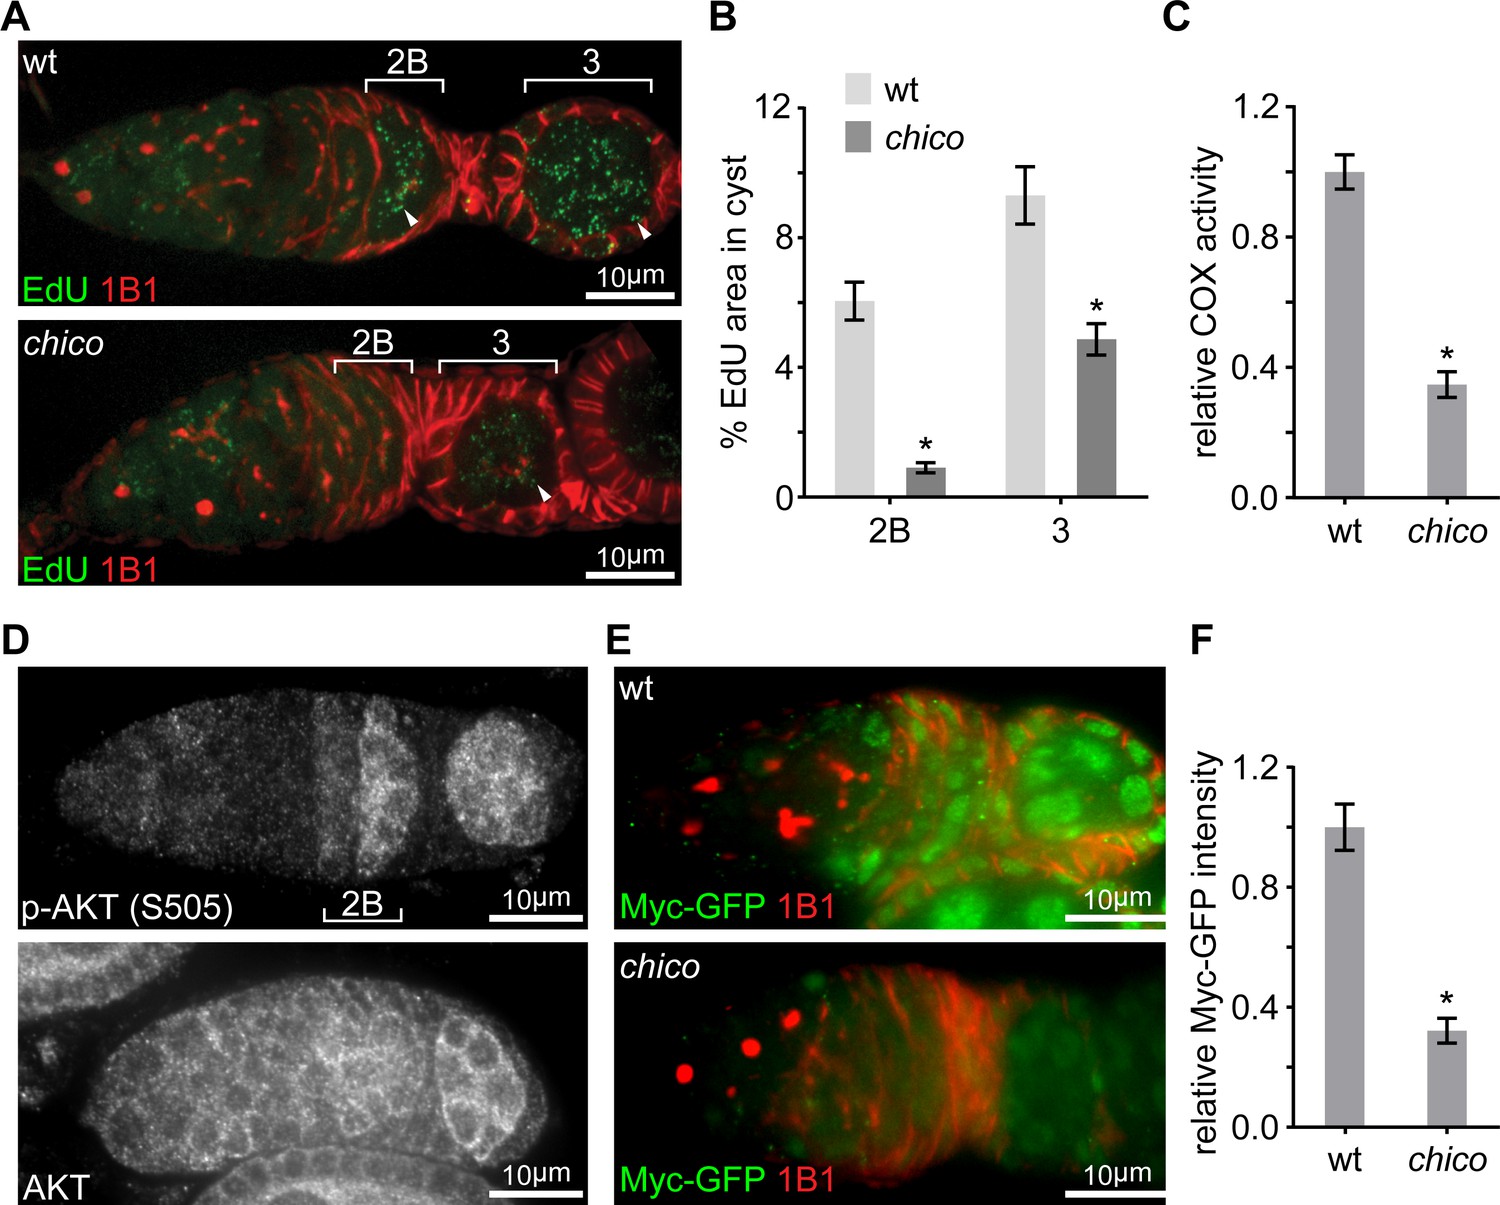
Elevated IIS in late germarium induces Myc protein to prime mtDNA replication and mitochondrial respiration.
(A) Representative germaria from wt or chico1/KG mutant flies incorporating EdU and stained with anti-1B1. Arrowheads indicate EdU incorporation into the mtDNA of germ cells. Scale bars, 10 μm. (B) Quantification of the mitochondrial EdU puncta areas relative to the areas of germline cysts from wt or chico1/KG mutant flies. n = 11 cysts each column (left to right). Error bars represent SEM. *p<0.005. (C) Quantifications of COX activity in region 2B cysts from wt or chico1/KG mutant flies. The activities are normalized to that of region 2B cysts from wt. n = 10 germaria for each genotype. Error bars represent SEM. *p<0.005. (D) Germaria from wt ovaries stained with anti-AKT and anti-p-AKT (S505). p-AKT staining is low in both GSCs and dividing cysts, while increased from region 2B germ cells. In contrast, AKT staining is uniform in the germarium. Scale bars, 10 μm. (E) Germaria from wt or chico1/KG mutant ovaries endogenously expressing Myc-GFP stained with anti-GFP, anti-1B1, and DAPI. Scale bars, 10 μm. (F) Quantification of relative Myc-GFP intensity in germarium region 2B from wt or chico1/KG mutant ovaries. n = 10 germaria for each genotype. Error bars represent SEM. *p<0.005.
-
Figure 3—source data 1
Relative mtDNA area, COX activity and Myc-GFP intensity in the germarium.
- https://doi.org/10.7554/eLife.49309.011
Figure 3—figure supplement 1
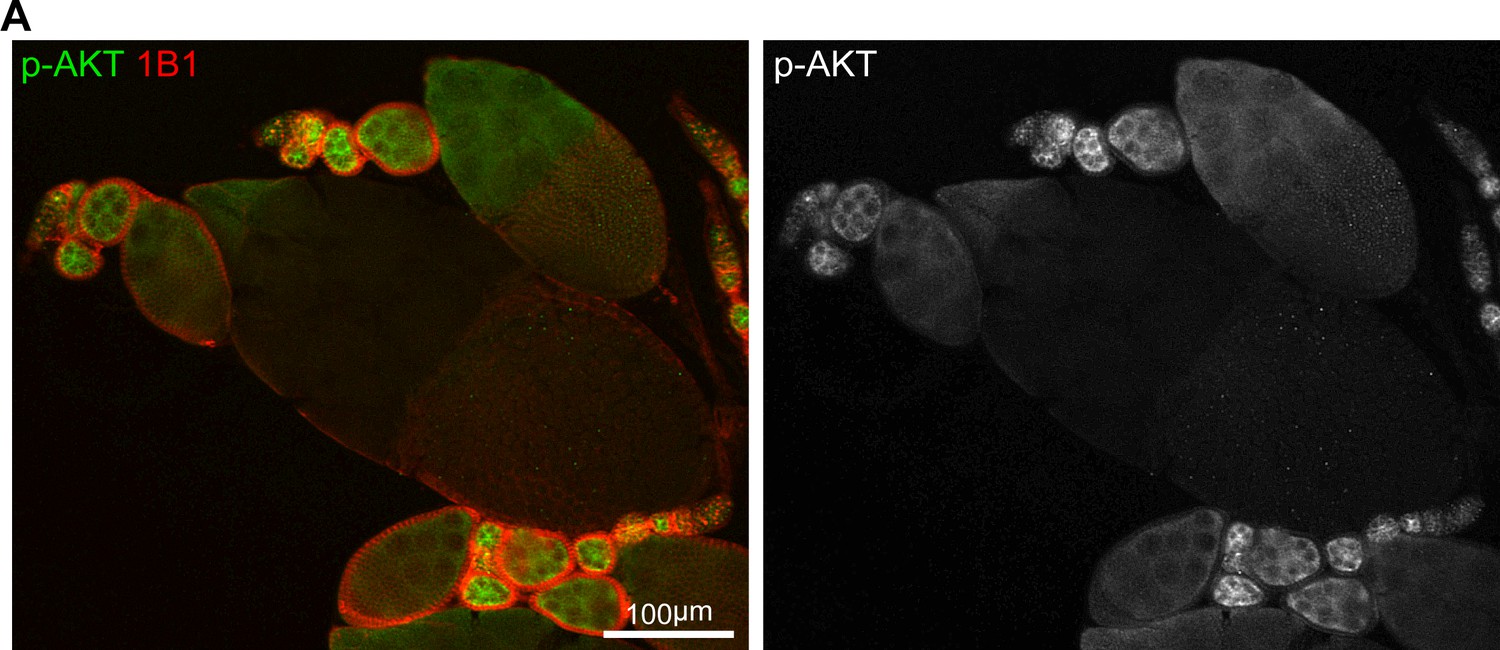
IIS activity in the ovary.
(A) A low-magnification image of ovarioles stained with anti-p-AKT and anti-1B1. Note that IIS activity is low in early germarium stages, becomes high from late germarium, and decreases from the stage-10 egg chamber, the same pattern as Myc protein. Scale bar, 100 μm.
Figure 4 with 1 supplement
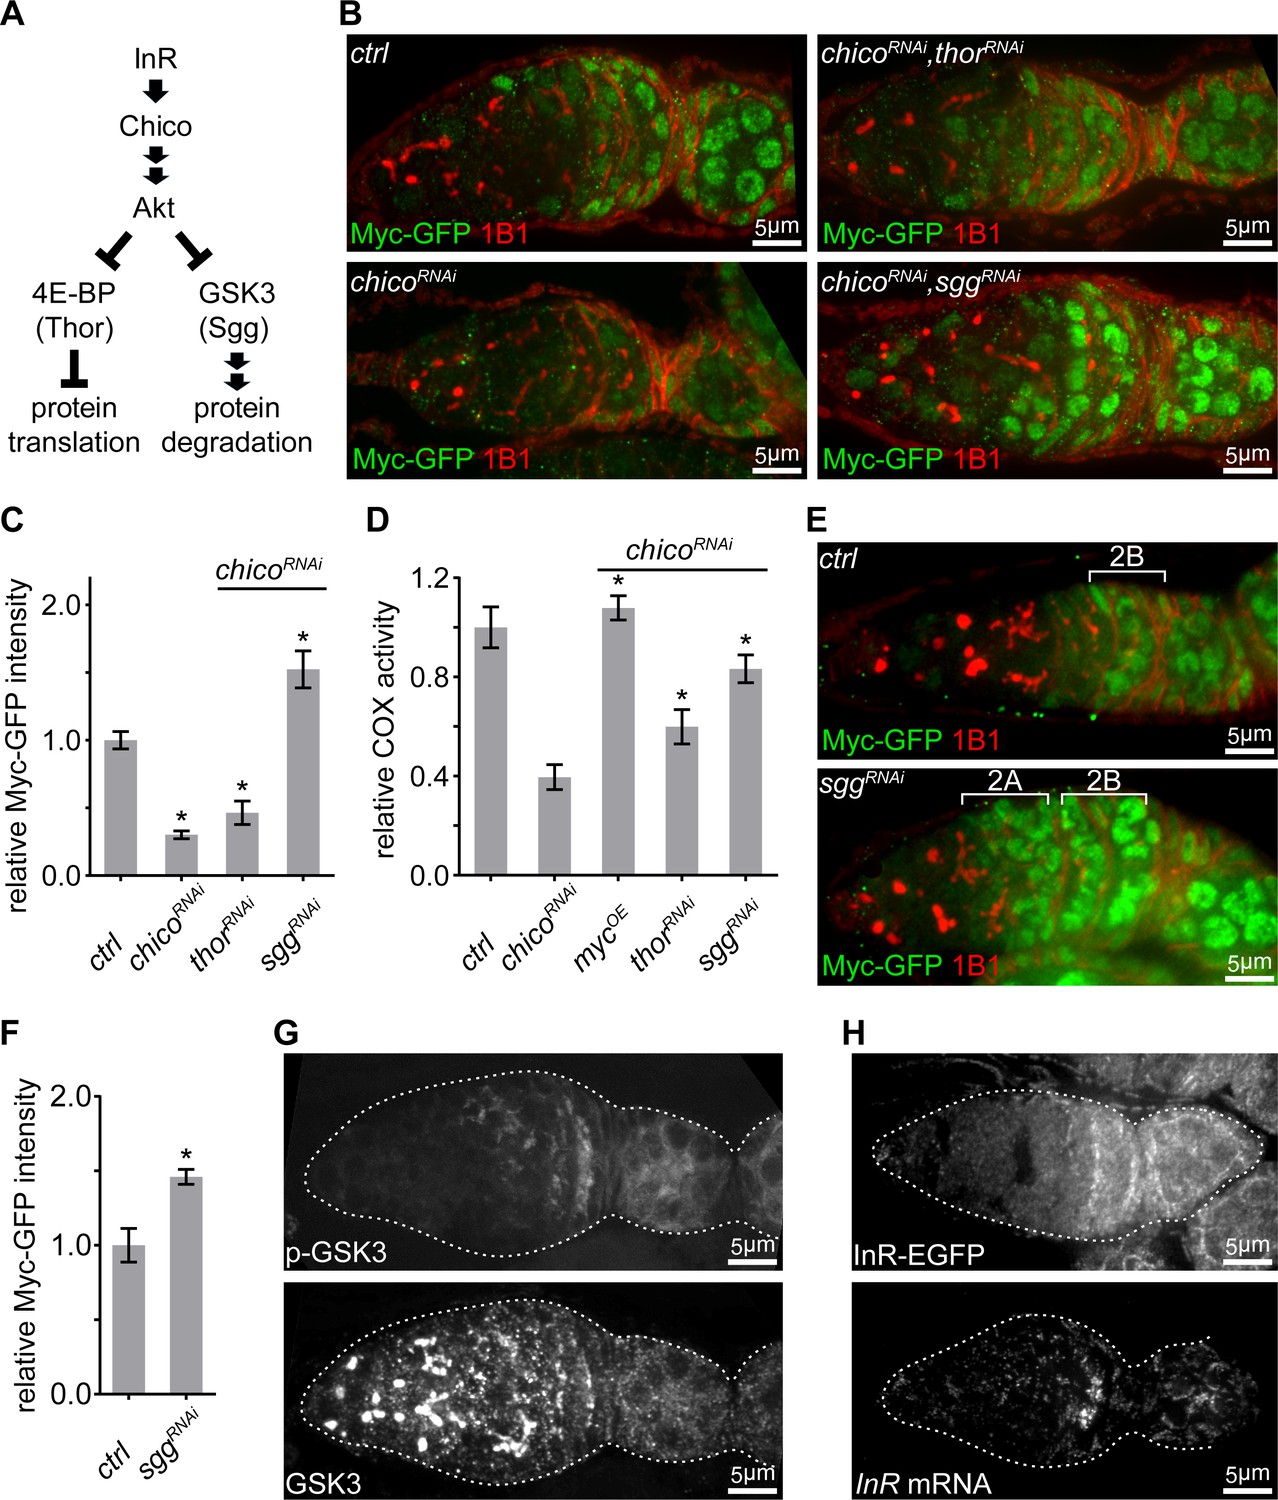
IIS promotes ETC activity via inhibition of GSK3 to stabilize Myc.
(A) Schematic of the conserved IIS pathway that inhibits 4E-BP/Thor and GSK3/Sgg to promote protein translation and suppress protein degradation, respectively. (B) Germaria from ovaries of ctrl; chicoRNAi; chicoRNAi, thorRNAi; and chicoRNAi, sggRNAi driven by nos-Gal4 endogenously expressing Myc-GFP and stained with anti-GFP (green) and anti-1B1 (red). Scale bars, 5 μm. (C, D) Quantification of Myc-GFP intensity (C) and COX activity (D) in germarium region 2B from ovaries with indicated genotypes, normalized to the intensity or activity values in germaria with ctrl over-expression. (C) n = 10 germaria for each genotype. (D) n = 10 germaria for each genotype. Error bars represent SEM. *p<0.05. (E) Germaria from ovaries of ctrl and sggRNAi driven by nos-Gal4 endogenously expressing Myc-GFP and stained with anti-GFP and anti-1B1. Myc protein is up-regulated in both region 2A and region 2B germ cells in the sgg RNAi ovary. Scale bars, 10 μm. (F) Quantification of relative Myc-GFP intensity in germarium region 2B from ovaries of ctrl and sggRNAi driven by nos-Gal4. Myc-GFP intensity is normalized to that of region 2B cysts with ctrl expression. n = 7 germaria for each genotype. Error bars represent SEM. *p<0.01. (G) A germarium from wt flies stained with anti-GSK3 and anti-p-GSK3. Germaria are outlined with dotted lines. Scale bars, 5 μm. (H) Upper panel: a representative image of a germarium from ovaries expressing endogenous InR-EGFP. Lower panel: visualization of the InR mRNA in germarium by FISH with fluorescently labeled DNA probes. Germaria are outlined with dotted lines. Scale bars, 5 μm.
-
Figure 4—source data 1
Relative COX activity and Myc-GFP intensity in the germarium.
- https://doi.org/10.7554/eLife.49309.014
Figure 4—figure supplement 1
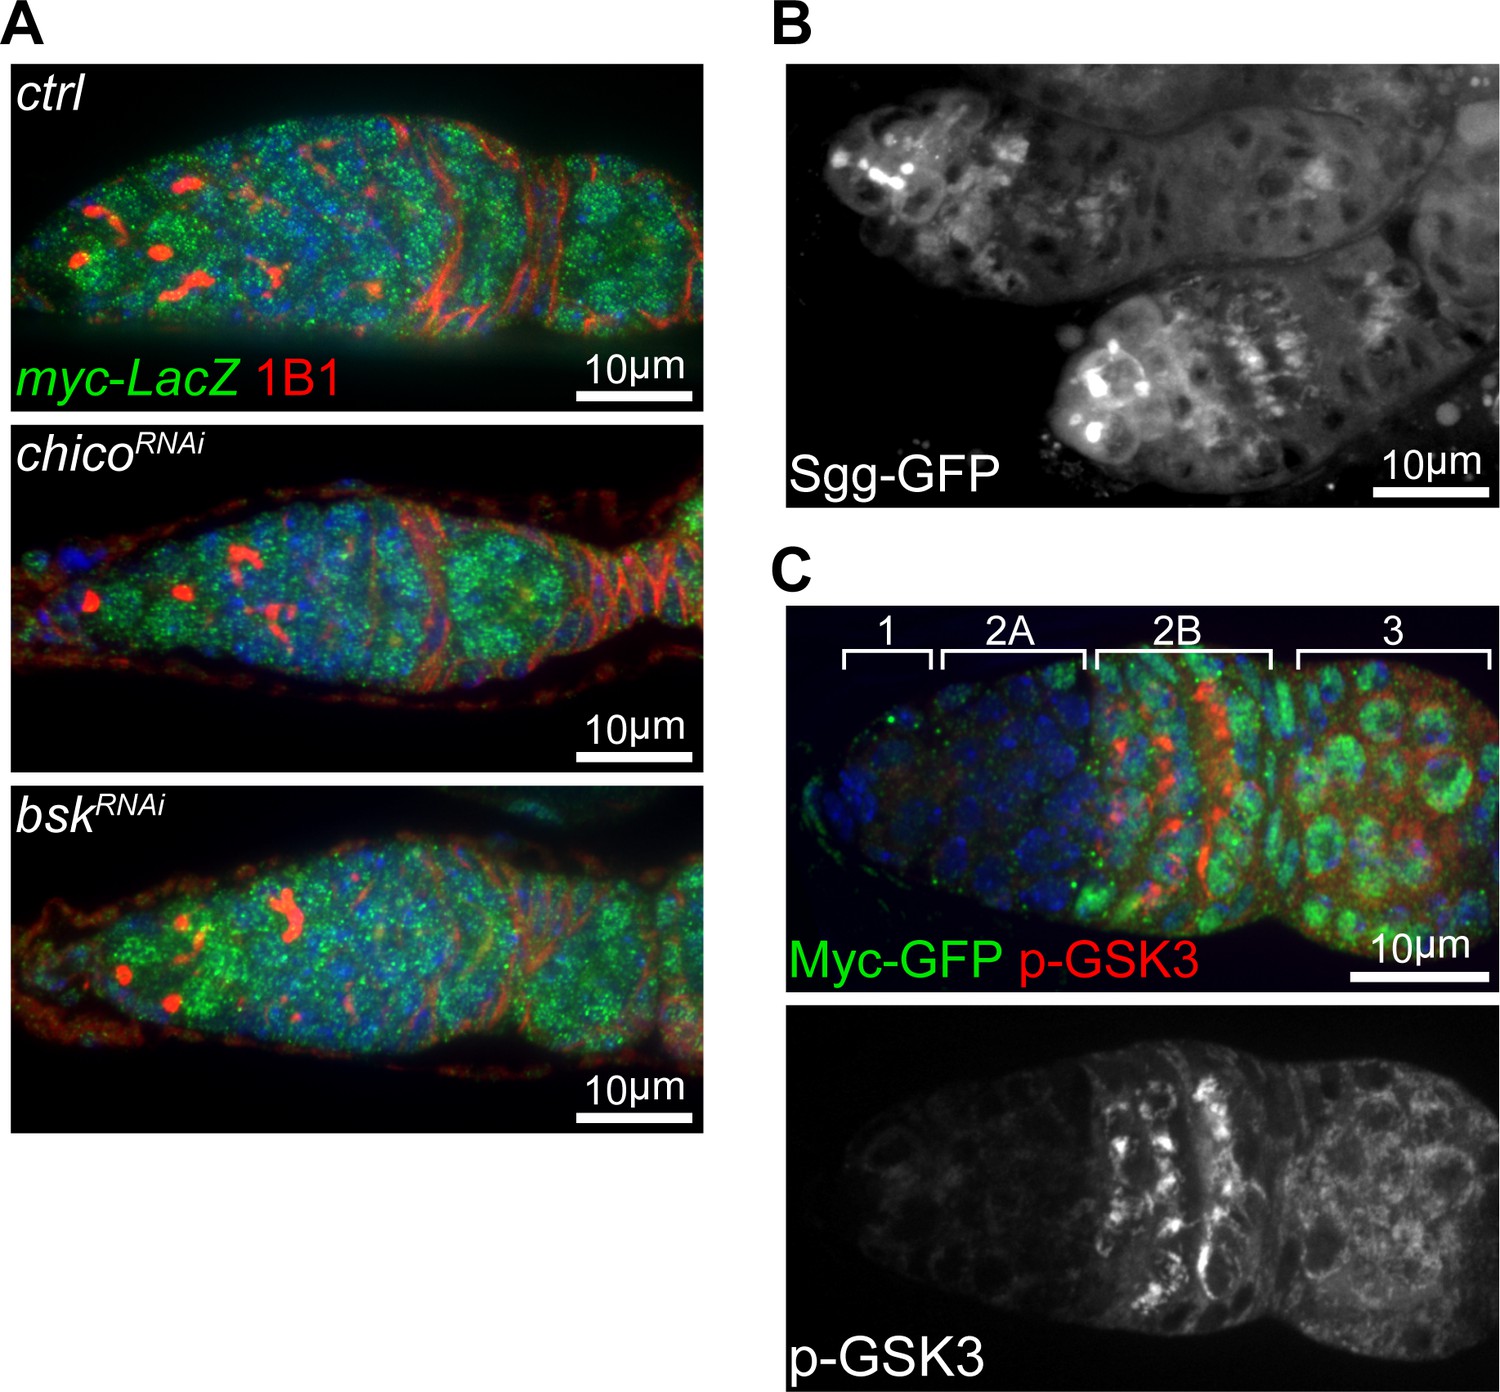
Myc is post-transcriptionally regulated by the IIS-GSK3 cascade.
(A) Germaria from ovaries of ctrl, chicoRNAi, and bskRNAi driven by nos-Gal4 expressing LacZ under the control of myc endogenous promoter stained with anti-β-galactosidase and anti-1B1. Scale bars, 10 μm. (B) A representative live imaging of germaria from flies expressing GFP-tagged Sgg under its endogenous promoter. Scale bar, 10 μm. (C) A germarium from wt flies endogenously expressing Myc-GFP stained with anti-GFP (green) and anti-p-GSK3 (red). Germarium regions are indicated. Myc protein highly corresponds to inhibited form of GSK3. Scale bar, 10 μm.
Figure 5 with 1 supplement
Transient JNK activation in the germarium boosts the IIS-Myc signaling.
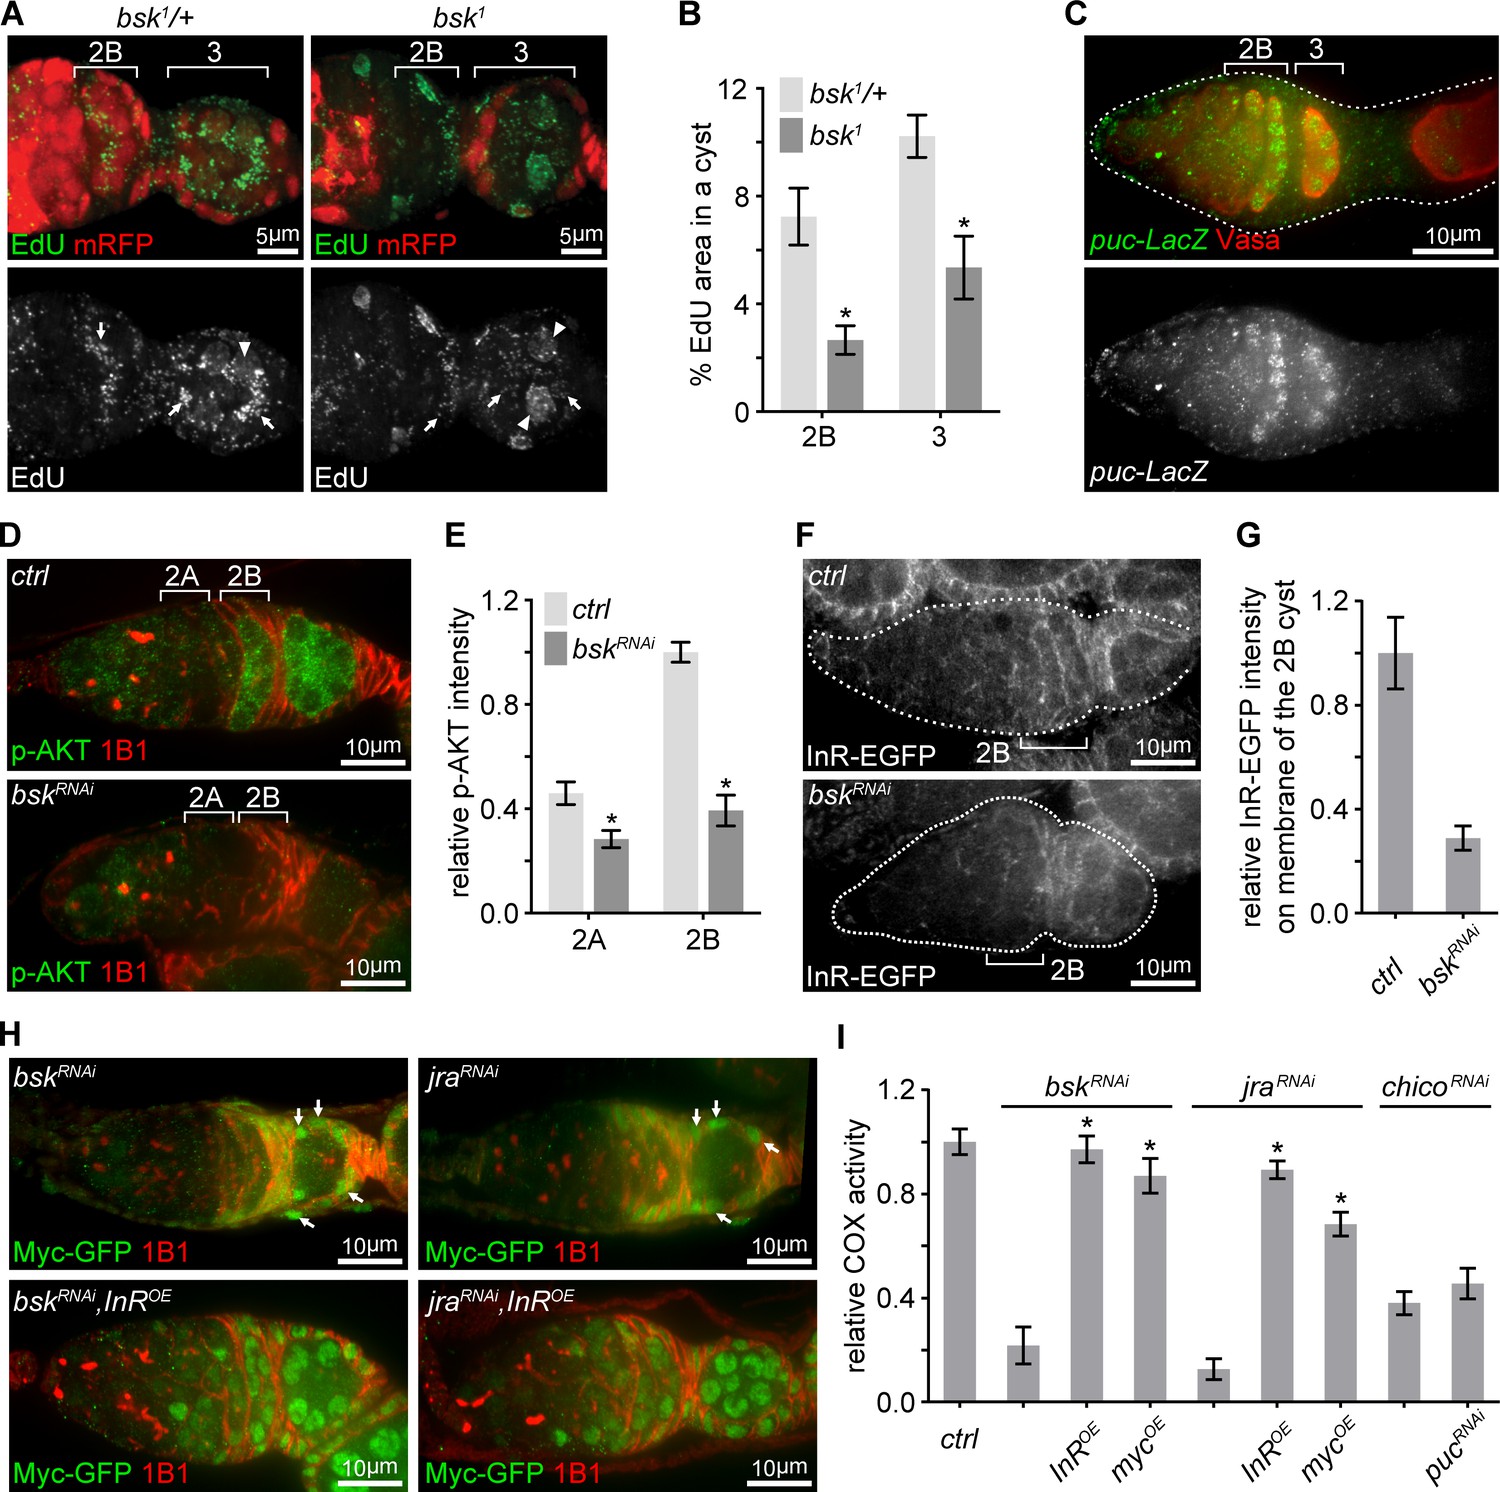
(A) Representative germaria with bsk1 FRT clones showing EdU incorporation (green) to visualize mtDNA replication. bsk1/+ cells are positive for mRFP (red), while bsk1 mutant cells are negative for mRFP. Arrows indicate EdU incorporated into mtDNA, arrowheads point out EdU incorporated into the nuclear genome. Scale bars, 5 μm. (B) Percentage areas of EdU incorporated into mtDNA relative to total areas of the germline cysts at indicated germarium stages from bsk1/+ and bsk1 clones. n = 11, 14, 15, and 10 cysts each column (left to right). Error bars represent SEM. *p<0.005. (C) Germarium from ovaries expressing LacZ driven by the puc promoter stained with anti-β-galactosidase (green) and anti-Vasa (red). Germarium is outlined with dotted lines. Scale bar, 10 μm. (D) Germaria from ovaries of ctrl and bskRNAi driven by nos-Gal4 stained with anti-p-AKT (green) and anti-1B1 (red). Note that IIS activity is markedly reduced when JNK signaling is decreased by bsk RNAi. Scale bars, 10 μm. (E) Quantification of p-AKT intensity from cysts in germarium region 2A and 2B of ovaries with indicated genotypes. p-AKT intensity is normalized to that of region 2B cysts from the ctrl line. n = 11 germaria for each genotype. Error bars represent SEM. *p<0.005. (F) Visualization of InR-EGFP in germaria from ovaries of ctrl and bskRNAi driven by nos-Gal4. Note that InR-EGFP level on the region 2B cyst membrane is decreased by bsk RNAi. Germaria are outlined with dotted lines. Scale bars, 10 μm. (G) Quantification of background subtracted InR-EGFP intensity on cell membrane of the region 2B cyst. n = 7 germaria for each genotype. Error bars represent SEM. *p<0.005. (H) Germaria from ovaries of bskRNAi; bskRNAi, InROE; jraRNAi; jraRNAi, InROE driven by nos-Gal4 endogenously expressing Myc-GFP co-stained with anti-GFP and anti-1B1. Note that Myc-GFP level in germ cells is markedly lower than that in follicle cells pointed out by arrows. Scale bars, 10 μm. (I) COX activity in region 2B cysts from ovaries with indicated genotypes. The activities are normalized to that of region 2B cysts from the ctrl line. n = 10 germaria for each genotype. Error bars represent SEM. *p<0.005.
-
Figure 5—source data 1
Relative mtDNA area, p-AKT intensity, InR-EGFP intensity, and COX activity in the germarium.
- https://doi.org/10.7554/eLife.49309.018
Figure 5—figure supplement 1
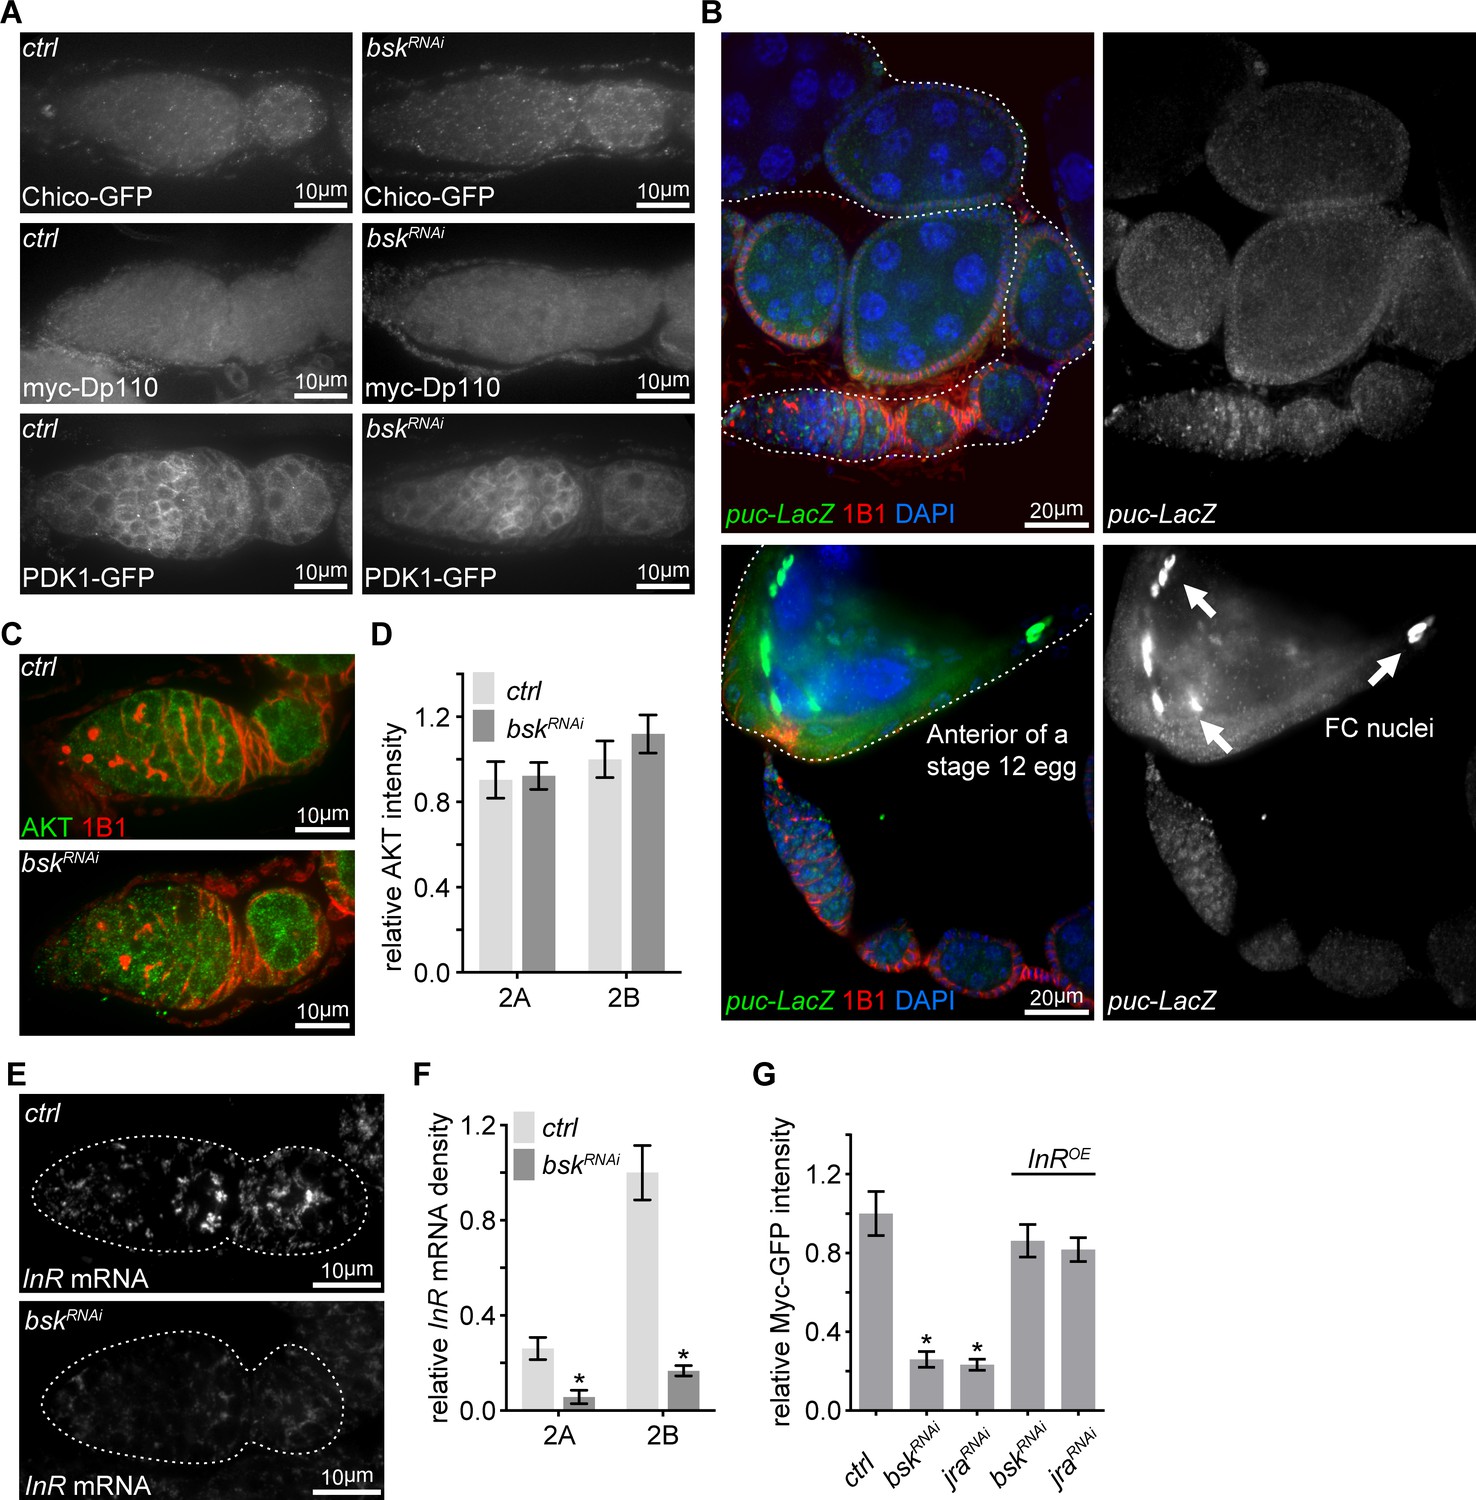
Other IIS components are not altered by bsk RNAi.
(A) Confocal images for germaria expressing Chico-GFP, myc-Dp110 or PDK1-GFP in the background of ctrl or bskRNAi from ovaries stained with anti-GFP or anti-myc. Scale bars, 10 μm. (B) Ovaries expressing LacZ driven by the puc promoter stained with anti-β-galactosidase, anti-1B1, and DAPI. Note that JNK activity is moderately induced in late germarium and decreased in the following stages, while JNK activity is much stronger in follicle cells of a maturing egg. Scale bars, 20 μm. (C) Germaria from ovaries of ctrl and bskRNAi driven by nos-Gal4 stained with anti-AKT and anti-1B1. Scale bars, 10 μm. (D) Quantification of AKT intensity from cysts in germarium region 2A and 2B of ovaries with ctrl and bskRNAi driven by nos-Gal4. Intensities are normalized to the value of ctrl at region 2B. n = 7 and 8 germaria for ctrl and bskRNAi, respectively. Error bars represent SEM. *p<0.005. (E) Visualization of the InR mRNA by FISH in germaria from ovaries of ctrl and bskRNAi driven by nos-Gal4. Note that InR mRNA level is decreased by bsk RNAi. Germaria are outlined with dotted lines. Scale bars, 10 μm. (F) Quantification of InR mRNA density in region 2A and 2B germ cells from ovaries with indicated genotypes. n = 9 germaria for each genotype. Error bars represent SEM. *p<0.005. (G) Quantification of relative Myc-GFP intensity in region 2B cysts of ovaries illustrated in Figure 5H. n = 10 germaria for each genotype. Error bars represent SEM. *p<0.005.
-
Figure 5—figure supplement 1—source data 1
Relative AKT intensity, InR mRNA density, and Myc-GFP intensity in the germarium.
- https://doi.org/10.7554/eLife.49309.017
Figure 6 with 1 supplement
A positive feedback regulatory loop between IIS and Myc.
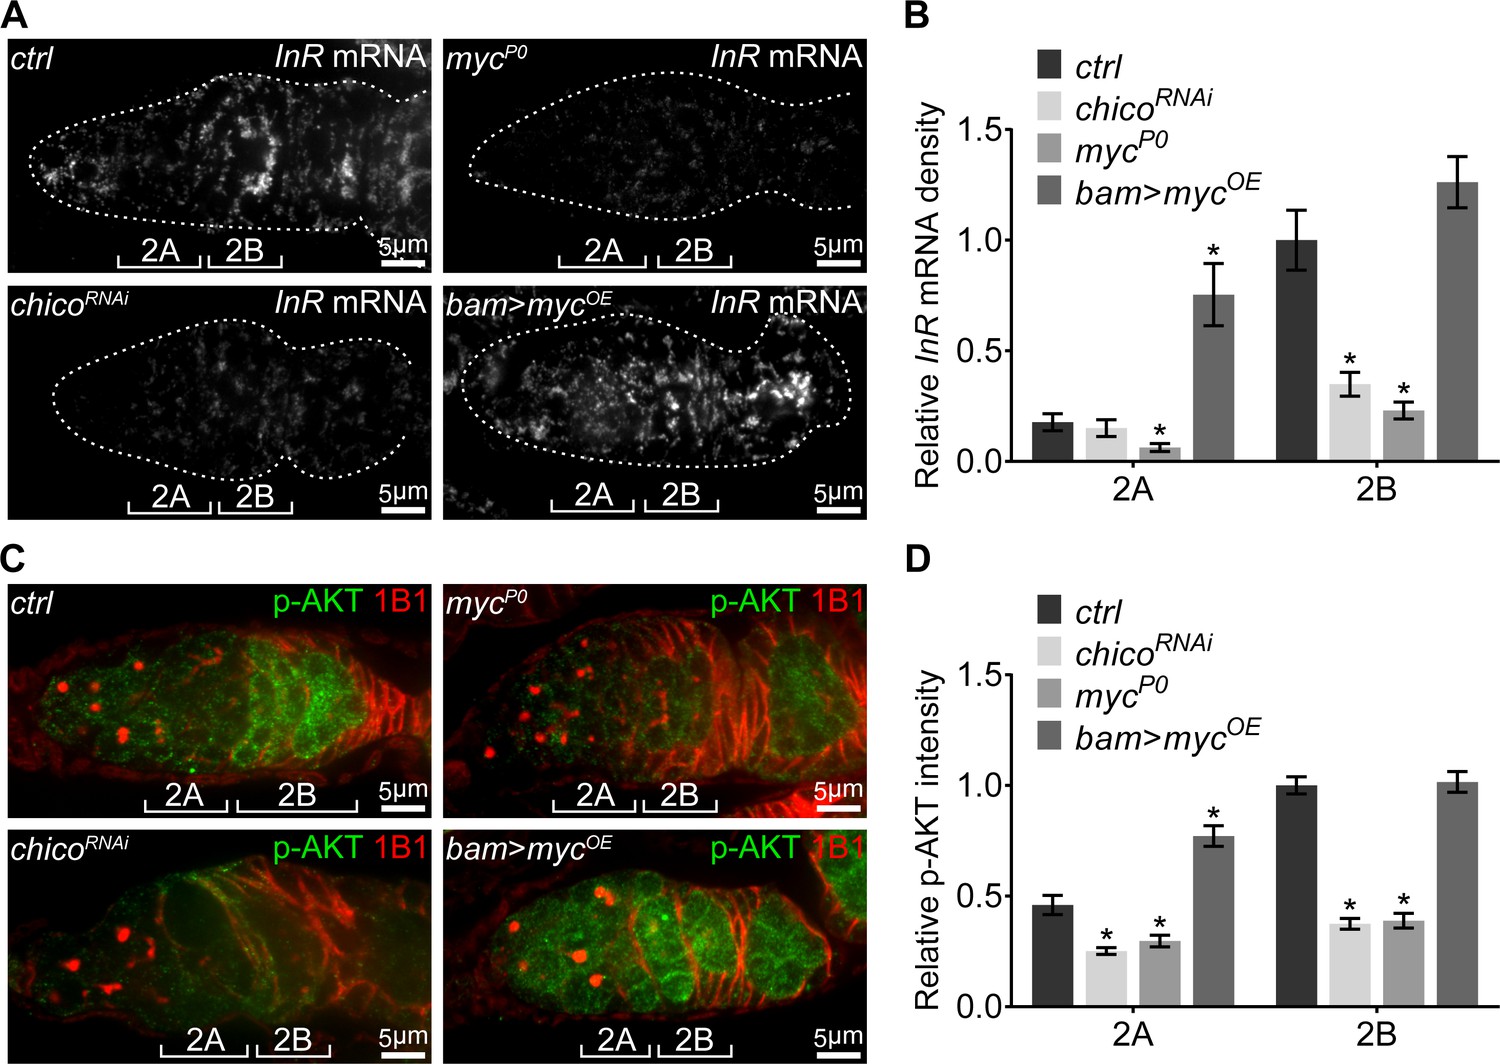
(A) Visualization of the InR mRNA by FISH with fluorescently labeled DNA probes in germaria from ctrl, chicoRNAi, mycP0, and bam >mycOE ovaries. Germaria are outlined with dotted lines. Reduction in either IIS or Myc depletes InR mRNA in the germarium, while myc over-expression in region 2A ectopically induces InR mRNA. Scale bars, 5 μm. (B) Quantification of InR mRNA intensity from cysts in germarium region 2A and 2B of ovaries with indicated genotypes. Intensities are normalized to the value of ctrl at region 2B. n = 8, 8, 8, and 9 germaria for ctrl, chicoRNAi, mycP0, and bam >mycOE, respectively. Error bars represent SEM. *p<0.05. (C) Germaria from ctrl, chicoRNAi, mycP0, and bam >mycOE ovaries stained with anti-p-AKT and anti-1B1. Decrease in either IIS or Myc reduces IIS activity in the germarium, while myc over-expression in region 2A ectopically induces IIS activity. Scale bars, 5 μm. (D) Quantification of p-AKT intensity in region 2A and 2B cysts of ovaries with indicated genotypes. Intensities are normalized to the value of ctrl at region 2B. n = 11 germaria for each genotype. Error bars represent SEM. *p<0.005.
-
Figure 6—source data 1
Relative InR mRNA density and p-AKT intensity in the germarium.
- https://doi.org/10.7554/eLife.49309.022
Figure 6—figure supplement 1
AKT level is normal when IIS is decreased, but slightly reduced in the mycP0 mutant.
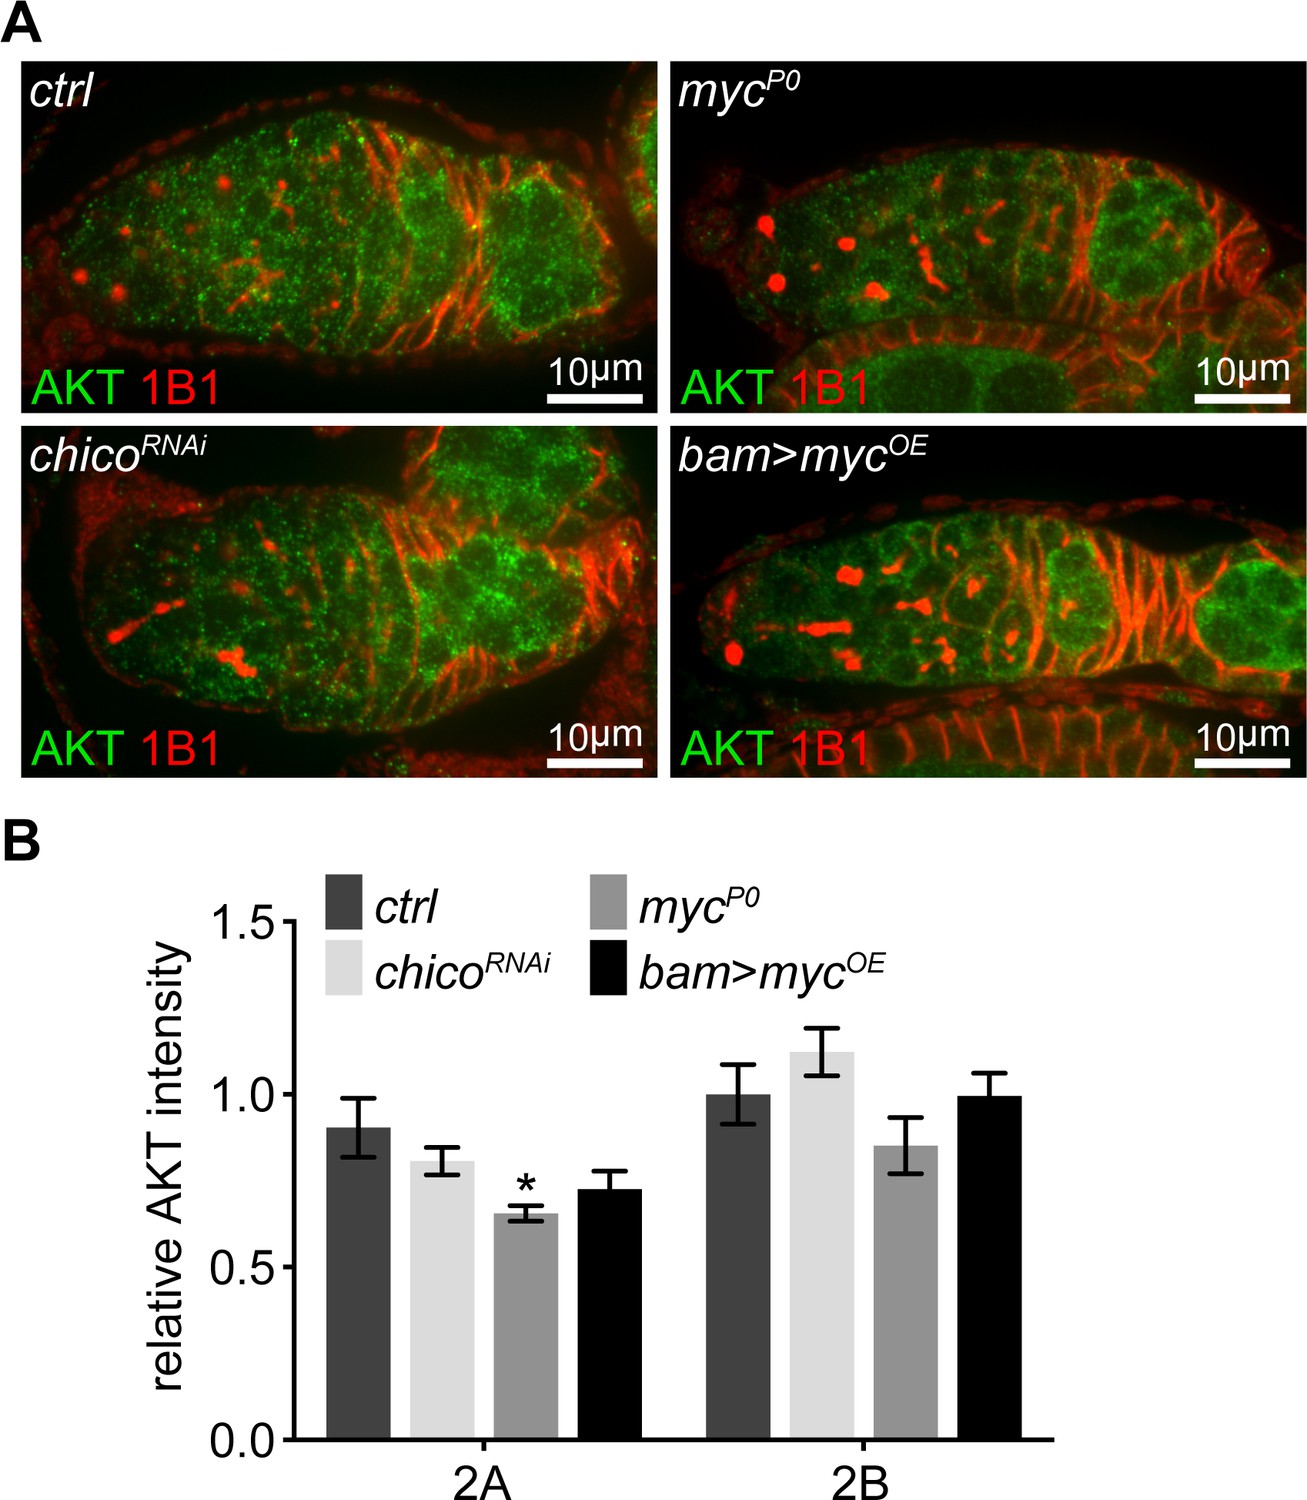
(A) Germaria from ovaries of ctrl, chicoRNAi, mycP0, and bam >mycOE stained with anti-AKT and anti-1B1. Scale bars, 10 μm. (B) Quantification of AKT intensity in region 2A and 2B from ovaries with indicated genotypes. n = 10 germaria for each genotype. Error bars represent SEM. *p<0.005.
-
Figure 6—figure supplement 1—source data 1
Relative AKT intensity in the germarium.
- https://doi.org/10.7554/eLife.49309.021
Figure 7
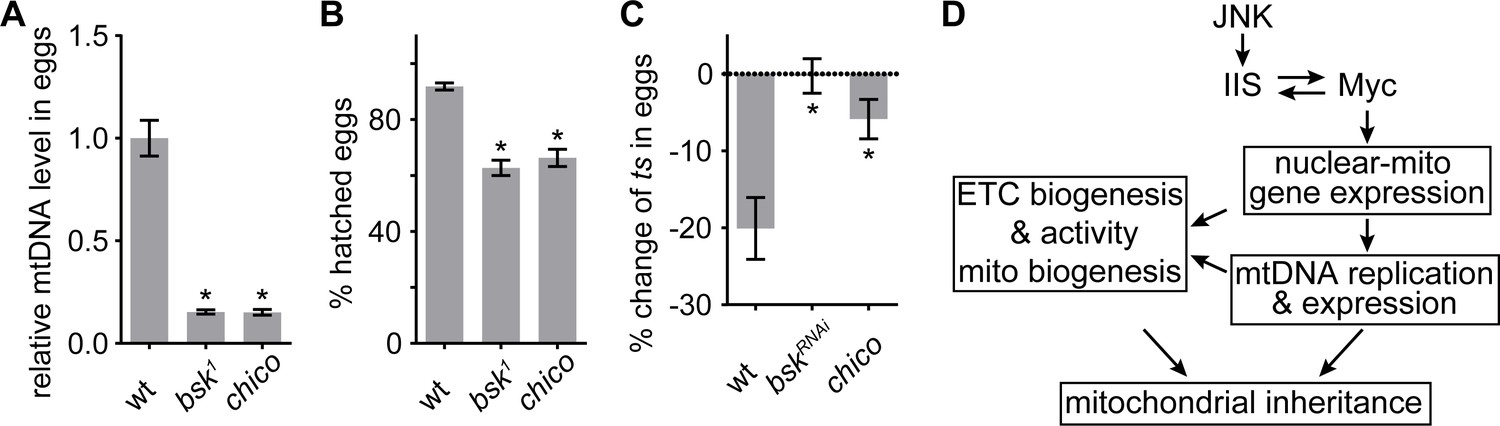
JNK-IIS relay is essential for mtDNA selective inheritance and fertility.
(A) Quantification of relative mtDNA content in eggs produced by mothers carrying germline clones (GLCs) of bsk1 or by chico1/KG mutant mother. Relative mtDNA levels are determined by qPCR for mt:CoI and his4 copies, and normalized to the level in wt. n = 12, 16, and 12 mothers for wt, bsk1, and chico1/KG. Error bars represent SEM. *p<0.005. (B) The hatching rate of eggs produced by female flies carrying bsk1 GLCs or chico1/KG females is significantly lower than that of wt eggs. n = 5 × 40 eggs for each genotype. Error bars represent SEM. *p<0.005. (C) Quantification of mt:ColT300I transmission from females with indicated nuclear genotypes. In wt females, the mtDNA mutation is counter-selected, resulting in ~20% fewer mutant mtDNA in the progeny than in the mothers. This counter-selection is diminished in chico1/KG mutant mothers of in mothers expressing bskRNAi driven by nos-Gal4. Mothers heteroplasmic for mt:ColT300I were cultured at 29°C. n = 10 mothers for each genotype. Error bars represent SEM. *p<0.005. (D) Schematics of the developmental signaling relay initiated from late germarium that primes mitochondrial respiration, and mtDNA replication and inheritance.
-
Figure 7—source data 1
Relative mtDNA level in eggs, % hatched eggs, and % change of ts in eggs.
- https://doi.org/10.7554/eLife.49309.024
Tables
Key resources table
| Reagent type (species) or resource | Designation | Source or reference | Identifiers | Additional information |
|---|---|---|---|---|
| Genetic reagent (D. melanogaster) | w1118 (wt) | Zhang et al., 2019 | https://doi.org/10.1016/j.molcel.2019.01.013 | |
| Genetic reagent (D. melanogaster) | ts (mt:ColT300I%) | Hill et al., 2014 | https://doi.org/10.1038/ng.2920 | |
| Genetic reagent (D. melanogaster) | UAS-Dcr-2; nos-Gal4 | Bloomington Drosophila Stock Center | BDSC: 25751 FLYB: FBti0101430 FLYB: FBti0012287 | FLYB symbol: P{UAS-Dcr-2.D}1 P{GAL4-nos.NGT}40 |
| Genetic reagent (D. melanogaster) | nos-Gal4 | Bloomington Drosophila Stock Center | BDSC: 32563 FLYB: FBti0012287 | FLYB symbol: P{GAL4-nos.NGT}40 |
| Genetic reagent (D. melanogaster) | bam-Gal4 | Chen and McKearin, 2003 | https://doi.org/10.1242/dev.00325 | |
| Genetic reagent (D. melanogaster) | UAS-LacZ | Wang et al., 2016 | https://doi.org/10.1093/hmg/ddw067 | ctrl over-expression |
| Genetic reagent (D. melanogaster) | mycP0 | Johnston et al., 1999 | https://doi.org/10.1016/S0092-8674(00)81512–3 | |
| Genetic reagent (D. melanogaster) | myc-LacZ | Bloomington Drosophila Stock Center | BDSC: 12247 FLYB: FBti0015660 | FLYB symbol: P{lacW}MycG0359 |
| Genetic reagent (D. melanogaster) | puc-LacZ | Bloomington Drosophila Stock Center | BDSC: 11173 FLYB: FBti0005134 | FLYB symbol: P{lArB}pucA251.1F3 |
| Genetic reagent (D. melanogaster) | UAS-myc | (Rhiner et al., 2009) | https://doi.org/10.1242/dev.033340 | |
| Genetic reagent (D. melanogaster) | bsk1, FRT40A | (Bornstein et al., 2015) | https://doi.org/10.1016/j.neuron.2015.10.023 | |
| Genetic reagent (D. melanogaster) | hs-FLP; ubi-mRFP, FRT40A | (Bornstein et al., 2015) | https://doi.org/10.1016/j.neuron.2015.10.023 | |
| Genetic reagent (D. melanogaster) | luciferaseRNAi | Bloomington Drosophila Stock Center | BDSC: 31603 FLYB: FBti0130444 | FLYB symbol: P{TRiP.JF01355}attP2 ctrl RNAi |
| Genetic reagent (D. melanogaster) | sggRNAi | Bloomington Drosophila Stock Center | BDSC: 35364 FLYB: FBst0035364 | FLYB symbol: P{TRiP.GL00277}attP2 |
| Genetic reagent (D. melanogaster) | thorRNAi | Bloomington Drosophila Stock Center | BDSC: 36815 FLYB: FBst0036815 | FLYB symbol: P{TRiP.GL01034}attP2 |
| Genetic reagent (D. melanogaster) | pucRNAi | Bloomington Drosophila Stock Center | BDSC: 36085 FLYB: FBst0036085 | FLYB symbol: P{TRiP.GL00504}attP40 |
| Genetic reagent (D. melanogaster) | UAS-InR | Bloomington Drosophila Stock Center | BDSC: 8262 FLYB: FBst0008262 | FLYB symbol: P{UAS-InR.Exel}2 |
| Genetic reagent (D. melanogaster) | chico1 | Bloomington Drosophila Stock Center | BDSC: 10738 FLYB: FBst0010738 | FLYB symbol: P{ry11}chico1/CyO |
| Genetic reagent (D. melanogaster) | chicoKG | Bloomington Drosophila Stock Center | BDSC: 14337 FLYB: FBst0014337 | FLYB symbol: P{SUPor-P}chicoKG00032 |
| Genetic reagent (D. melanogaster) | Myc-GFP | Bloomington Drosophila Stock Center | BDSC: 81274 FLYB: FBti0147732 | FLYB symbol: PBac{y+-attP-3B}VK00033 |
| Genetic reagent (D. melanogaster) | Sgg-GFP | Bloomington Drosophila Stock Center | BDSC: 66770 FLYB: FBst0066770 | FLYB symbol: Mi{PT-GFSTF.1}sggMI11971-GFSTF.1 |
| Genetic reagent (D. melanogaster) | PDK1-GFP | Bloomington Drosophila Stock Center | BDSC: 59836 FLYB: FBst0059836 | FLYB symbol: Mi{PT-GFSTF.0}Pdk1MI06823-GFSTF.0 |
| Genetic reagent (D. melanogaster) | myc-Dp110 | Bloomington Drosophila Stock Center | BDSC: 25915 FLYB: FBst0025915 | FLYB symbol: P{Myc-Dp110}1 |
| Genetic reagent (D. melanogaster) | Chico-GFP | Vienna Drosophila RNAi Center | VDRC: v318104 FLYB: FBst0491524 | FLYB symbol: PBac{fTRG00456.sfGFP-TVPTBF}VK00033 |
| Genetic reagent (D. melanogaster) | InR-EGFP | This paper | HX lab | EGFP inserted before the stop codon of InR genomic locus |
| Genetic reagent (D. melanogaster) | UAS-FLP | Bloomington Drosophila Stock Center | BDSC: 29731 FLYB: FBti0128596 | FLYB symbol: P{w[+mC]=UASp FLP.G}3 |
| Genetic reagent (D. melanogaster) | TM3, Sb1, Ser1/TM6B, Tb1 | Bloomington Drosophila Stock Center | BDSC: 2537 FLYB: FBst0002537 | FLYB symbol: TM3, Sb[1] Ser[1]/TM6B, Tb[1] |
| Antibody | Mouse monoclonal anti-GFP | Roche | 11814460001 | IF(1:1000) |
| Antibody | Mouse monoclonal anti-Hts | Developmental Studies Hybridoma Bank | 1B1 | IF(1:1000) |
| Antibody | Mouse monoclonal anti-ATP5A | ATP5A | ab14748 | IF(1:400) |
| Antibody | Rabbit polyclonal anti-GFP | Novus | NB600-308 | IF(1:1000) |
| Antibody | Rabbit polyclonal anti-dMyc | Santa Cruz Biotechnology | d1-717 | IF(1:200) |
| Antibody | Rabbit polyclonal anti-Vasa | Santa Cruz Biotechnology | sc-30210 | IF(1:500) |
| Antibody | Rabbit monoclonal anti-p-GSK3 | Cell Signaling Technology | 9323S | IF(1:200) |
| Antibody | Mouse monoclonal anti-GSK3 | Cell Signaling Technology | 9832S | IF(1:200) |
| Antibody | Rabbit polyclonal anti-AKT | Cell Signaling Technology | 9272S | IF(1:200) |
| Antibody | Rabbit polyclonal anti-p-AKT | Cell Signaling Technology | 4054S | IF(1:200) |
| Antibody | Mouse monoclonal β-galactosidase | Promega | Z378A | IF(1:1000) |
| Peptide, recombinant protein | Cytochrome c from equine heart | Sigma-Aldrich | C7752 | COX histochemistry staining |
| Peptide, recombinant protein | Catalase from bovine liver | Sigma-Aldrich | C9322 | COX histochemistry staining |
| Chemical compound, drug | TMRM | Thermo Fisher Scientific | I34361 | 1:10000 on dissected ovaries |
| Chemical compound, drug | MitoTracker Green | Thermo Fisher Scientific | M7514 | 1:10000 on dissected ovaries |
| Chemical compound, drug | 3,3′-Diaminobenzidine tetrahydrochloride | Sigma-Aldrich | D5905 | COX histochemistry staining |
| Chemical compound, drug | Nitrotetrazolium Blue chloride | Sigma-Aldrich | N6876 | COX/SDH dual histochemistry staining |
| Chemical compound, drug | Phenazine methosulfate | Sigma-Aldrich | P9625 | COX/SDH dual histochemistry staining |
| Chemical compound, drug | Sodium succinate | Sigma-Aldrich | S2378 | COX/SDH dual histochemistry staining |
| Chemical compound, drug | Heparin ammonium salt | Sigma-Aldrich | H6279 | RNA FISH |
| Other | Salmon Sperm DNA | Invitrogen | 15632011 | RNA FISH |
| Commercial assay, kit | Click-iT Plus EdU Alexa Fluor 488 Imaging Kit | Thermo Fisher Scientific | C10637 | labeling replicating mtDNA |
| Commercial assay, kit | Ribo-Zero rRNA Removal Kit | Illumina Inc. | MRZH116 | Used in RNA preparation for RNAseq |
| Sequence-based reagent | InR chiRNA targeting sequence | This paper | HX lab | CCTTTCCGTAGATGGATGACACC |
| Sequence-based reagent | InR-F1 | This paper | HX lab | ATGATGTCATCGGTGGGTCCTCAC |
| Sequence-based reagent | EGFP-seqR | This paper | HX lab | CTTGTAGTTGCCGTCGTCCTTGAA |
| Sequence-based reagent | InR-F2 | This paper | HX lab | AGCACATTGTGTCAGTCTTCG |
| Sequence-based reagent | InR-R | This paper | HX lab | CTCATTTTCCGAAGCTTGGCTTCC |
| Sequence-based reagent | mt:CoI, Xho1 site genotyping F | Hill et al., 2014 | https://doi.org/10.1038/ng.2920 | TGGAGCTATTGGAGGACTAAATCA |
| Sequence-based reagent | mt:CoI, Xho1 site genotyping R | Hill et al., 2014 | https://doi.org/10.1038/ng.2920 | GCTCCTGTTAATGGTCATGGACT |
| Sequence-based reagent | qPCR, his4-F | Zhang et al., 2015 | https://doi.org/10.15252/embr.201439636 | TCCAAGGTATCACGAAGCC |
| Sequence-based reagent | qPCR, his4-R | (Zhang et al., 2015) | https://doi.org/10.15252/embr.201439636 | AACCTTCAGAACGCCAC |
| Sequence-based reagent | qPCR, mt:CoI-F | (Zhang et al., 2015) | https://doi.org/10.15252/embr.201439636 | ATTGGAGTTAATTTAACATTTTTTCCTCA |
| Sequence-based reagent | qPCR, mt:CoI-R | Zhang et al., 2015 | https://doi.org/10.15252/embr.201439636 | AGTTGATACAATATTTCATGTTGTGTAAG |
| Software, algorithm | ImageJ | NIH | https://imagej.nih.gov/ij/ | |
| Scoftware, algorithm | GraphPad Prism7 | GraphPad Software, Inc | http://www.graphpad.com/ |
Additional files
-
Supplementary file 1
List of RNAi lines and corresponding genes in the candidate RNAi screen.
- https://doi.org/10.7554/eLife.49309.025
-
Supplementary file 2
List of Differentially expressed genes between mycP0 and wt ovaries.
- https://doi.org/10.7554/eLife.49309.026
-
Supplementary file 3
Gene ontology analysis downregulated genes in mycP0 ovaries.
- https://doi.org/10.7554/eLife.49309.027
-
Supplementary file 4
Gene ontology analysis downregulated mitochondrial genes in mycP0 ovaries.
- https://doi.org/10.7554/eLife.49309.028
-
Supplementary file 5
List of transcription factors that are downregulated in mycP0 ovaries.
- https://doi.org/10.7554/eLife.49309.029
-
Supplementary file 6
List of conserved Myc targets in human and flies.
- https://doi.org/10.7554/eLife.49309.030
-
Supplementary file 7
List of fluorescence DNA probes for FISH.
- https://doi.org/10.7554/eLife.49309.031
-
Transparent reporting form
- https://doi.org/10.7554/eLife.49309.032
Download links
A two-part list of links to download the article, or parts of the article, in various formats.
Downloads (link to download the article as PDF)
Open citations (links to open the citations from this article in various online reference manager services)
Cite this article (links to download the citations from this article in formats compatible with various reference manager tools)
Electron transport chain biogenesis activated by a JNK-insulin-Myc relay primes mitochondrial inheritance in Drosophila
eLife 8:e49309.
https://doi.org/10.7554/eLife.49309


