The NKCC1 antagonist bumetanide mitigates interneuronopathy associated with ethanol exposure in utero
- Geisel School of Medicine at Dartmouth, United States
- University of Minnesota Twin Cities, United States
Figures
Figure 1 with 2 supplements
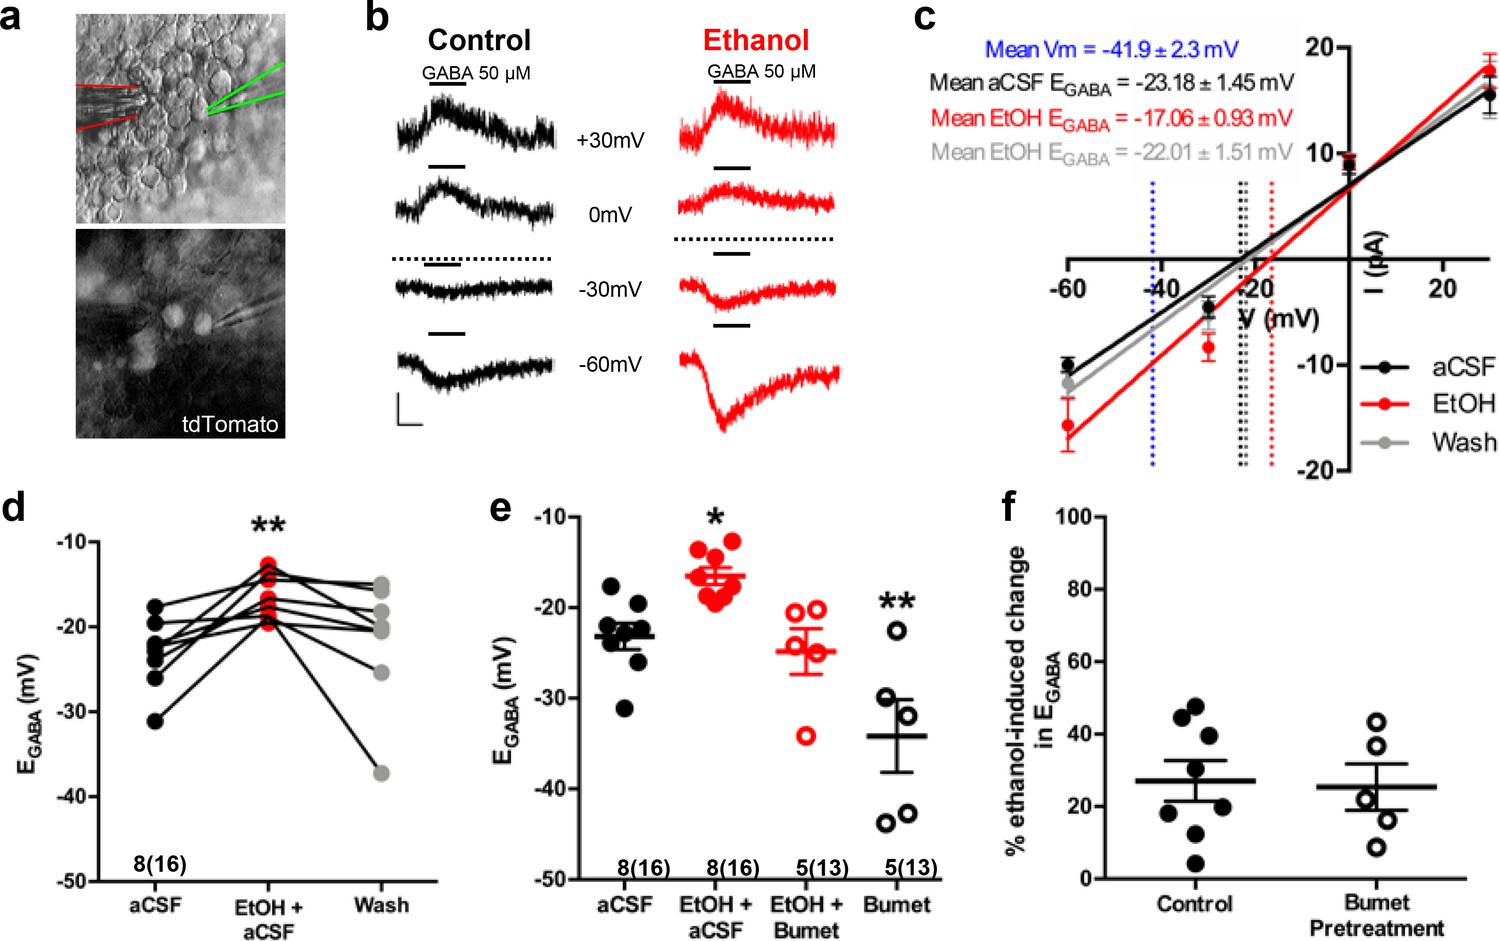
Ethanol induces a depolarizing shift in GABA reversal potential in embryonic MGE-derived GABAergic cortical interneurons that is normalized by the NKCC1 inhibitor bumetanide.
(a) Hoffman modulated contrast image of acute telencephalic slice of E14.5 mouse brain showing patch clamp electrode (green outline) holding a tdTomato fluorescent Nkx2.1+ MGE-derived GABAergic interneuron in the perforated-patch voltage clamp configuration, with a multi-barrel drug pipette (red outline) positioned in the vicinity. (b) EGABA was empirically determined by focal application of GABA (black bars, 50 µM) at varying holding potentials under control (black traces), and ethanol exposure (6.5 mM EtOH, red traces), conditions. Dotted lines indicate EGABA for each condition, scale bar vertical = 10 pA; horizontal = 500 ms. (c) I/V plot of peak GABA-induced current over holding potential defines EGABA as the x-intercept under control (black), ethanol exposure (red), and aCSF wash (gray) conditions. Dotted blue line denotes mean resting membrane potential. (d) EGABA of neurons under control conditions (aCSF), during ethanol exposure (EtOH+aCSF), and aCSF wash (Wash). ** = p < 0.01 one-way ANOVA with Dunnett post-test. (e) Group-wise comparison of EGABA in Nkx2.1+ neurons without and with bumetanide pretreatment (Bumet, 20 µM) and during exposure to EtOH with bumetanide pretreatment (EtOH+Bumet). Numbers below scatter denote number of litters and number of cells recorded in (). *, ** = p < 0.05, p < 0.01 compared to aCSF, one-way ANOVA with Dunnett post-test. (f) Magnitude of change in EGABA induced by 6.5 mM ethanol without and with bumetanide pretreatment (p > 0.05, unpaired t-test).
Figure 1—figure supplement 1
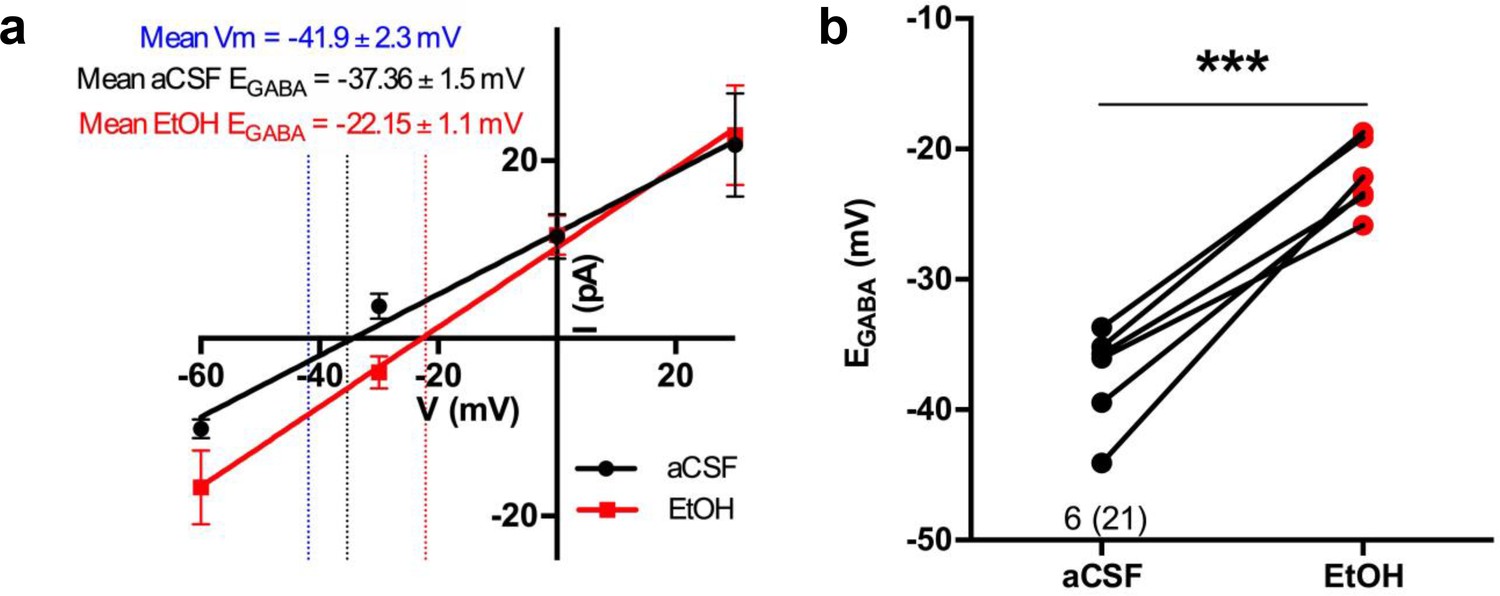
50 mM ethanol induces a depolarizing shift in GABA reversal potential in embryonic MGE-derived GABAergic cortical interneurons.
(a) I/V plot of peak GABA-induced current over holding potential defines EGABA as the x-intercept under control (aCSF; black) and ethanol exposure (EtOH; red) conditions. Dotted blue line denotes mean resting membrane potential. (b) EGABA of neurons under control conditions (aCSF; black dots) and during ethanol exposure (EtOH; red dots). Numbers above x-axis denote number of litters and number of cells recorded in (). *** = p < 0.001, paired t-test.
Figure 1—figure supplement 2
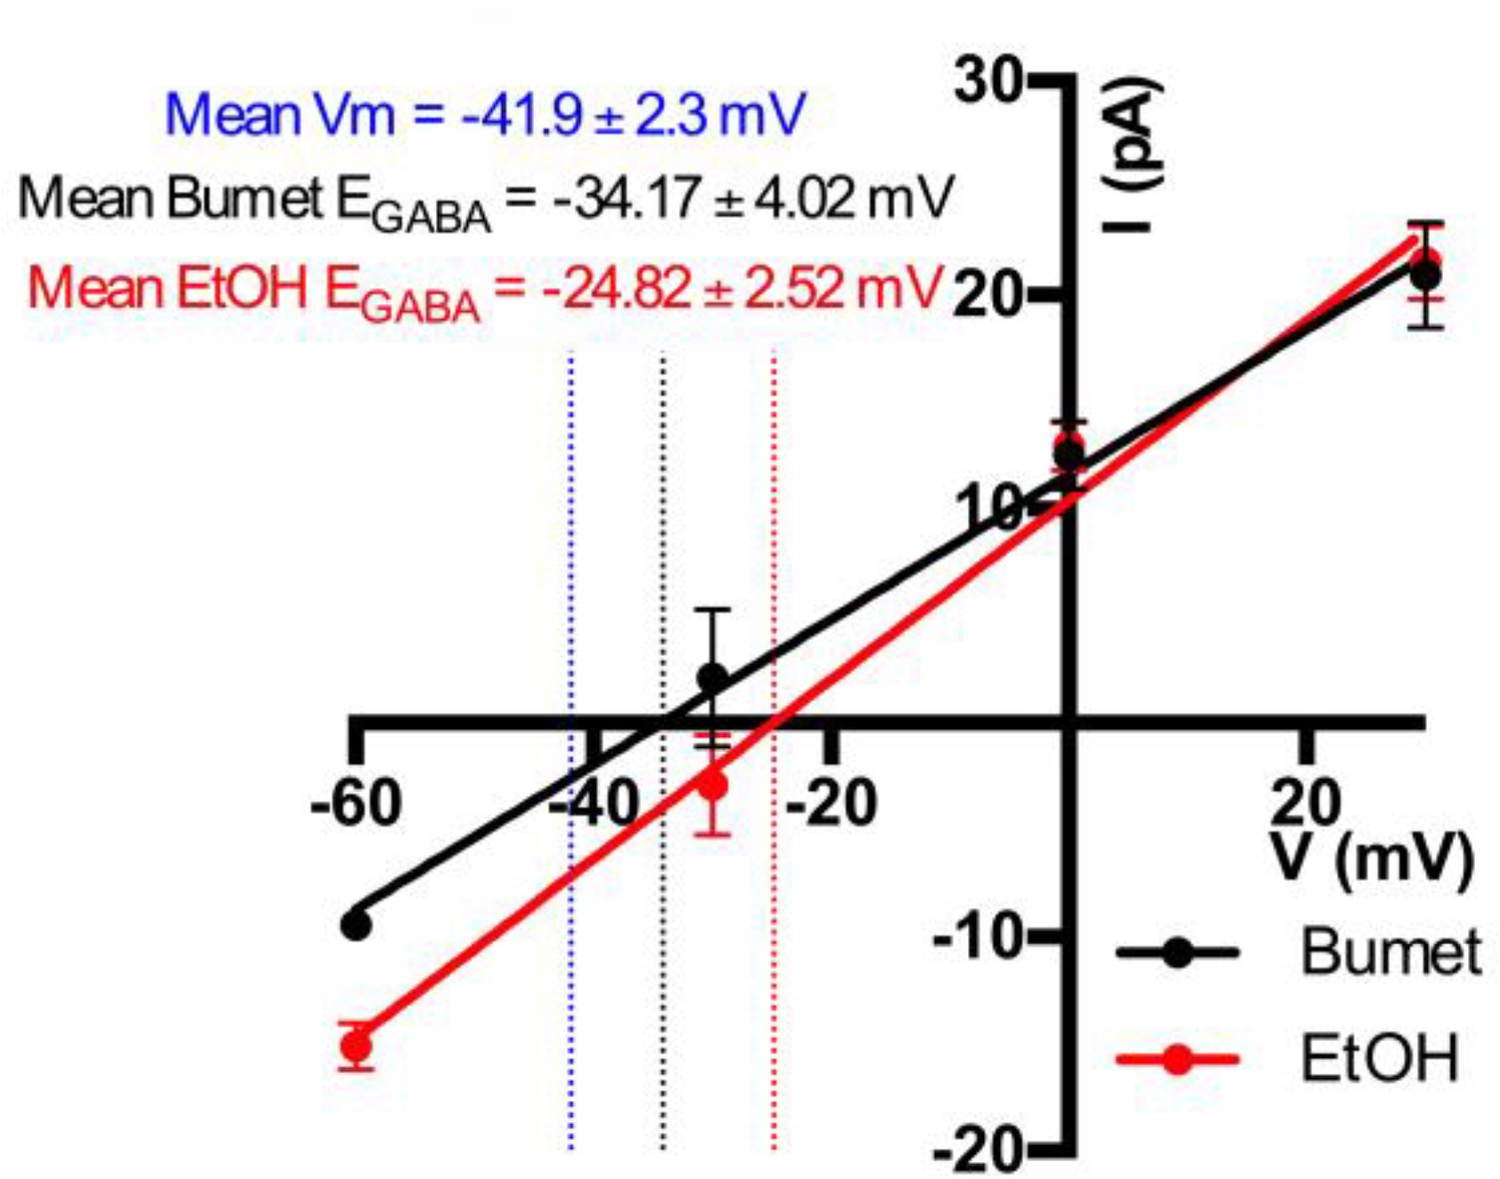
I/V plot of peak GABA-induced current over holding potential in bumetanide pre-treated cells.
I/V plot of peak GABA induced current over holding potential defines EGABA as the x-intercept under bumetanide control (Bumet; black) and 6.5 mM ethanol exposure (EtOH; red) conditions. Dotted blue line denotes mean resting membrane potential.
Figure 2 with 2 supplements
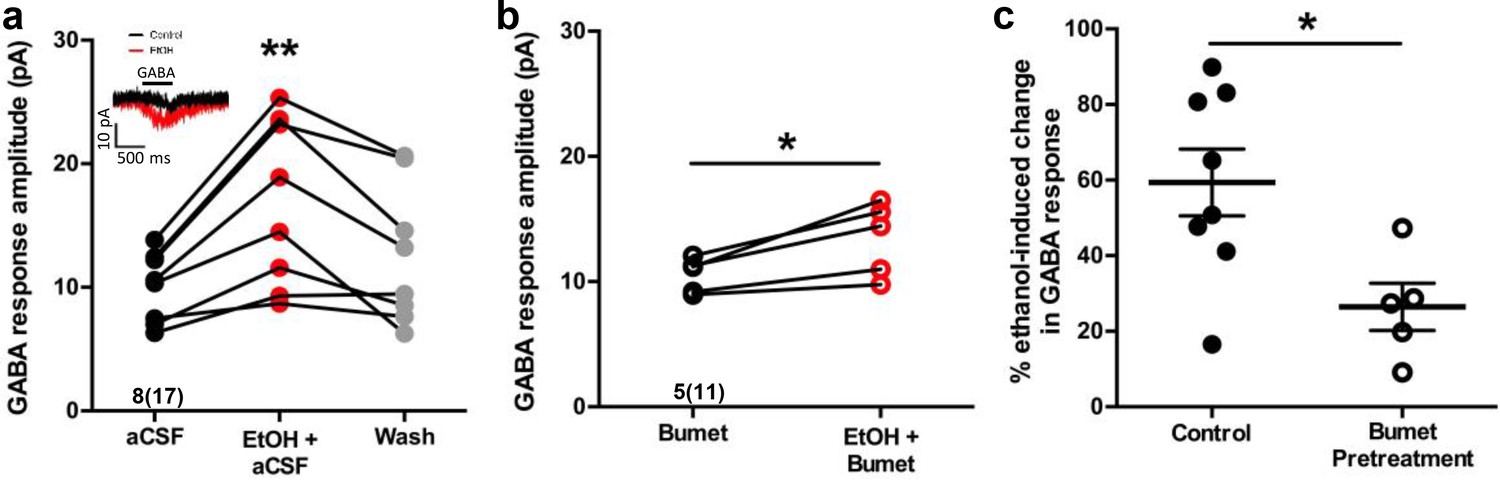
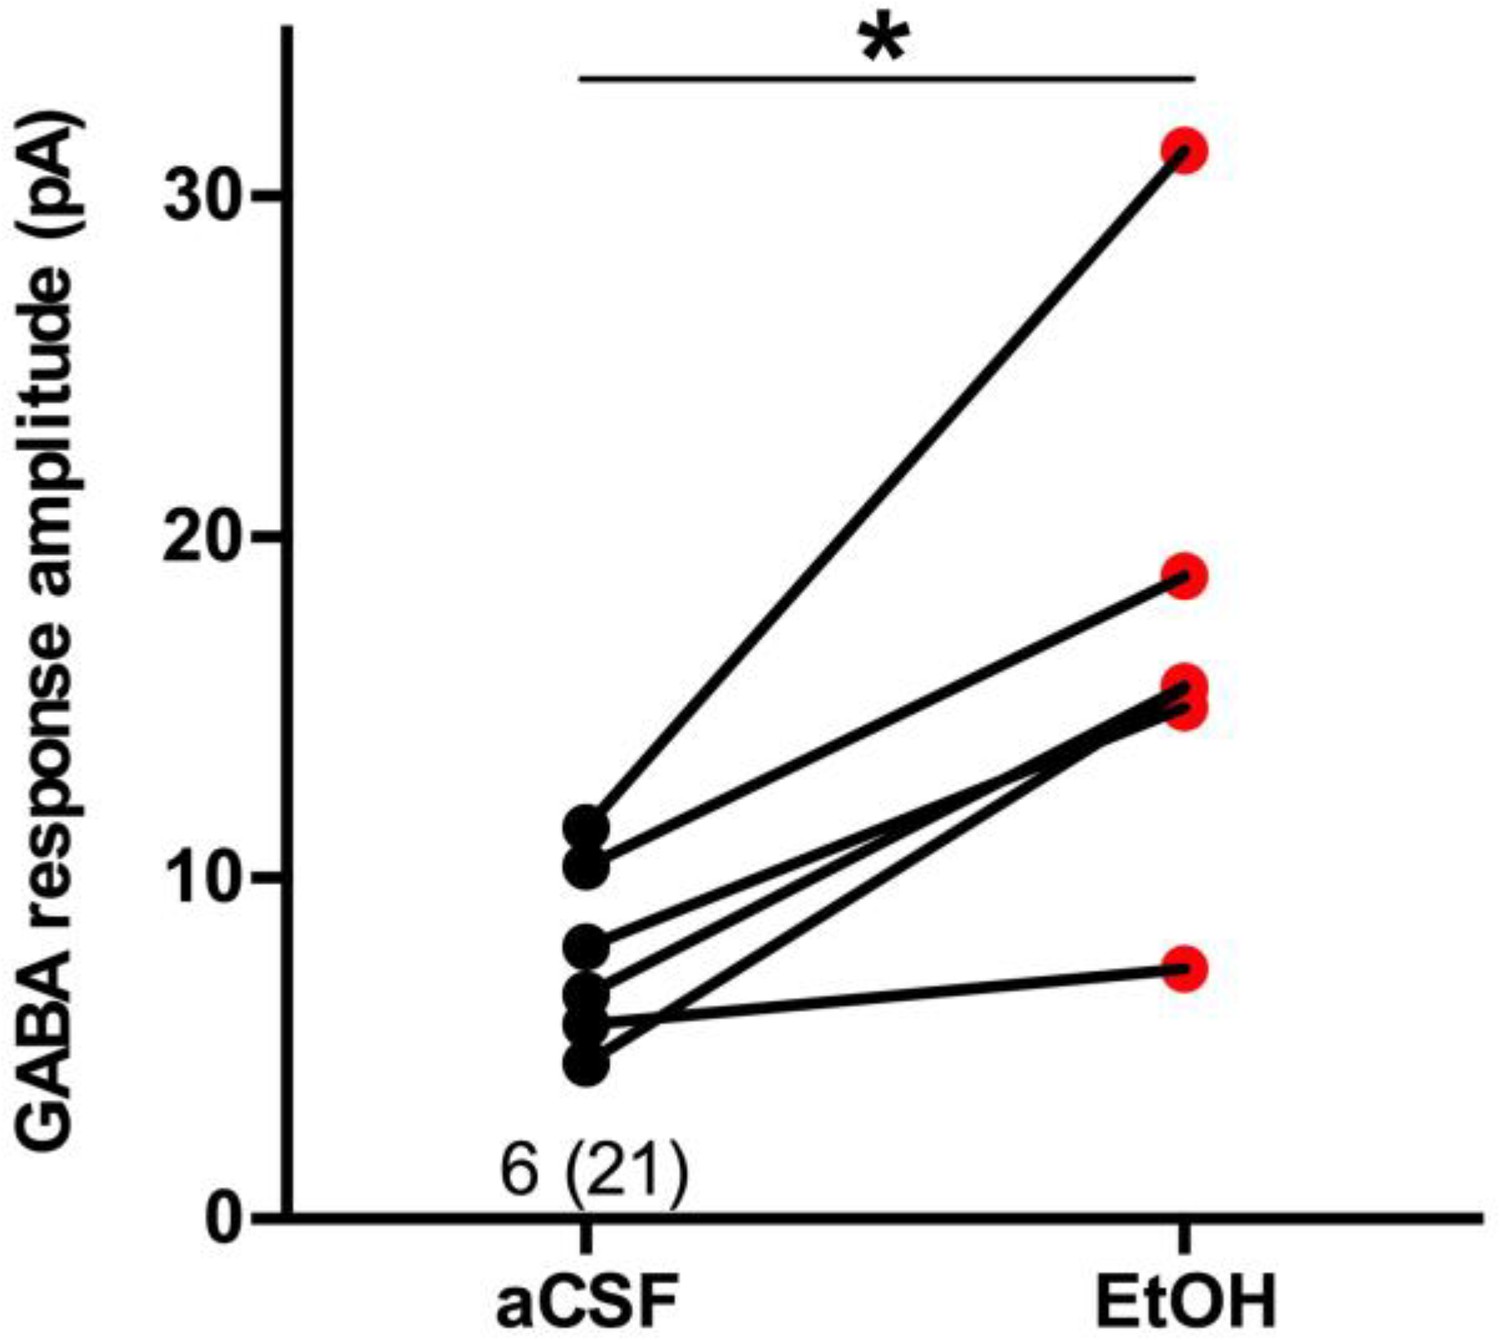
Bumetanide attenuates ethanol-induced potentiation of depolarizing GABA responses in embryonic MGE-derived GABAergic cortical interneurons.
(a) Peak current amplitude recorded from Nkx2.1+ MGE-derived GABAergic interneurons in slices of E14.5 mouse telencephalon in response to focal application of GABA (50 µM) under control (aCSF; inset: black trace), ethanol exposure (EtOH, 6.5 mM; inset: red trace), or aCSF wash (Wash), scale bar vertical = 10 pA; horizontal = 500 ms. ** = p < 0.01 one-way ANOVA with Dunnett post-test. (b) Peak current amplitude in response to focal application of GABA (50 µM) in the presence of bumetanide (Bumet) or ethanol and bumetanide (EtOH+Bumet). * = p < 0.01 paired t-test. (c) Percent change in peak GABA response induced by ethanol exposure at baseline (aCSF) and in the presence of bumetanide (Bumet). * = p < 0.05 unpaired t-test.
Figure 2—figure supplement 1
50 mM ethanol induces a potentiation of depolarizing GABA responses in embryonic MGE-derived GABAergic cortical interneurons.
Peak current amplitude recorded from Nkx2.1+ MGE-derived GABAergic interneurons in slices of E14.5 mouse telencephalon in response to focal application of GABA (50 µM) under control (aCSF; black) and ethanol exposure (EtOH; red). Numbers above x-axis denote number of litters and number of cells recorded in (). * = p < 0.05 paired t-test.
Figure 2—figure supplement 2
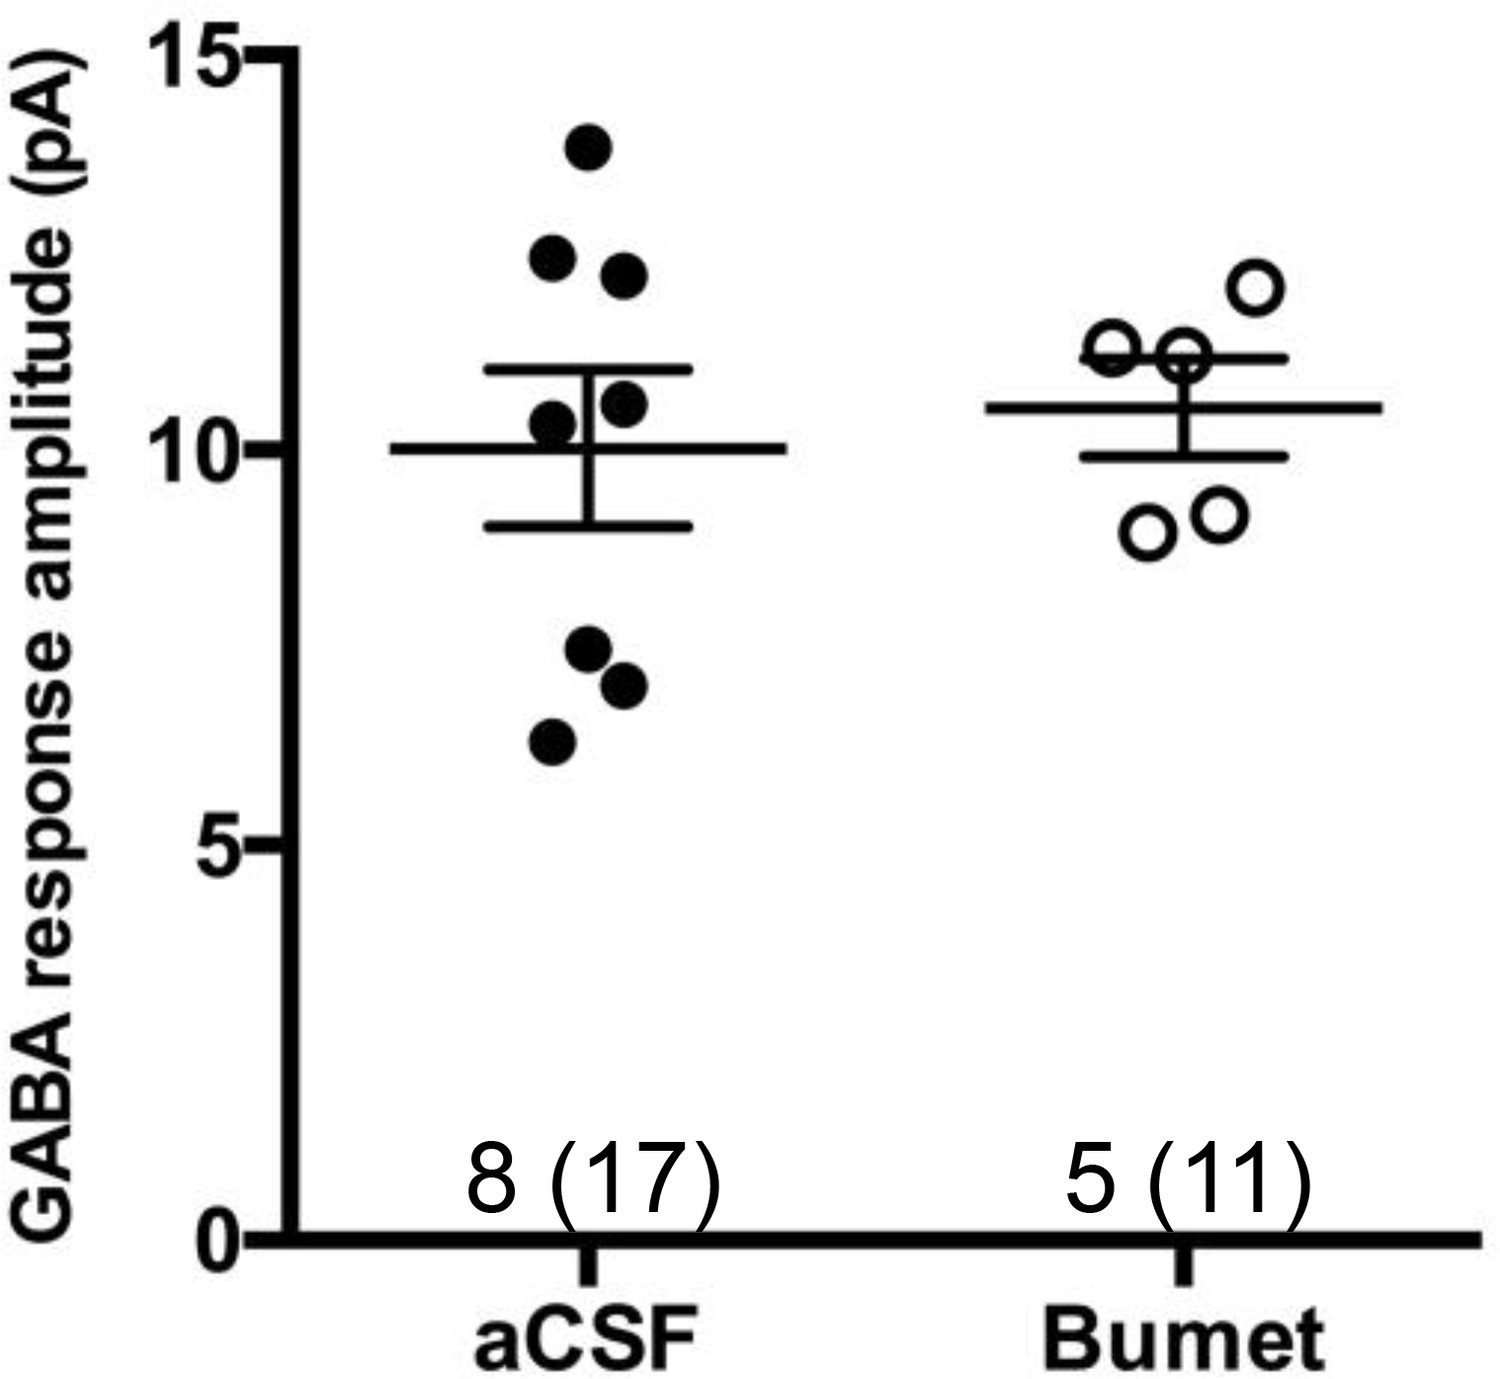
Bumetanide treatment does not change the GABA response amplitude.
The mean GABA response amplitude in control (aCSF) and bumetanide pre-treated (Bumet) cells. Numbers above x-axis denote number of litters and number of cells recorded in (). Unpaired t-test.
Figure 3
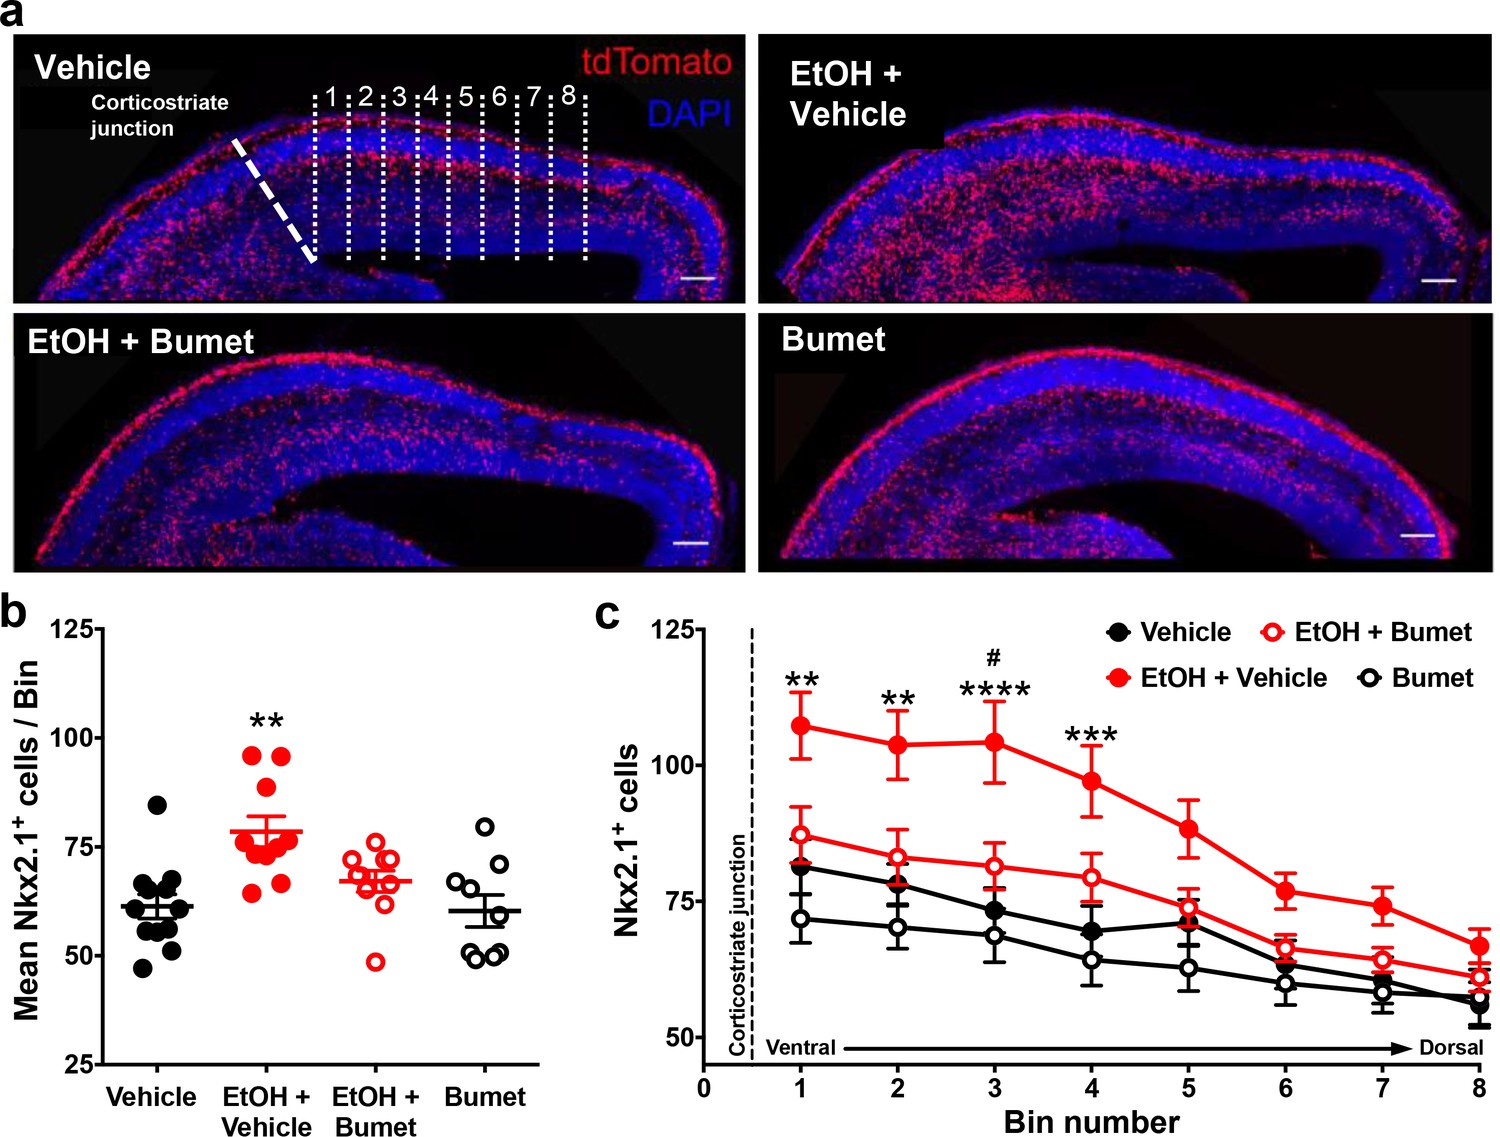
Co-treatment with bumetanide prevents ethanol’s enhancement of tangential migration in vitro.
(a) Fluorescent images of organotypic E14.5 Nkx2.1-Cre/Ai14 mouse telencephalic brain slices treated with vehicle, ethanol (50 mM) + vehicle (EtOH + Vehicle), ethanol + bumetanide (EtOH+Bumet, 20 µM), or bumetanide alone (Bumet, 20 µM), and counterstained with DAPI (blue). The corticostriate junction is marked by the dashed line, and numbered counting bins are denoted by dotted lines in the vehicle panel. Scale bars = 100 µm. (b) Mean number of tdTomato flourecent Nkx2.1+ cells per 100 µm bin. ** = p < 0.01 one-way ANOVA with Bonferroni post-test. Each dot represents one organotypic culture. (c) Number of tdTomato fluorescent Nkx2.1+ cells in each 100 µm bin. **, ***, **** = P < 0.01, 0.001, 0.0001 compared to control, # = p < 0.05 compared to EtOH+Bumet two-way ANOVA with Bonferroni post-test.
Figure 4

Maternal bumetanide treatment prevents ethanol-induced escalation of tangential migration in vivo.
Nkx2.1+ cells were identified by tdTomato fluorescence and quantified in the dorso-medial telencephalon of E16.5 embryonic brain. (a) Fluorescent images counterstained with DAPI following control, binge-type maternal ethanol consumption from E13.3 - E16.5 (EtOH), or ethanol exposure in combination with maternal bumetanide treatment administered i.p. 0.15 mg/kg/day (E13.5 - E16.5) dissolved in DMSO (EtOH+Bumet). Scale bars = 100 µm. (b) Quantification of Nkx2.1+ cells in the dorso-medial telencephalon after ethanol exposure in combination with maternal bumetanide treatment administered i.p. 0.15 mg/kg/day (E13.5 - E16.5) dissolved in normal saline (EtOH+Bumet NS) or DMSO (EtOH+Bumet DMSO), or maternal bumetanide treatment administered in the ethanol containing liquid diet (EtOH+Bumet salt; 1.3, 13, 130, 320 mg/kg food), or control conditions under which dams consumed equicaloric liquid food from E13.5-E16.5 (control). Dotted line highlights mean of control group. Numbers above x-axis denote number of brains and number of litters in (). **,**** = p < 0.01, 0.0001 compared to control; ##, #### = p < 0.01, 0.0001 compared to EtOH; one-way ANOVA with Bonferroni post-test. Control and EtOH groups are reproduced from Skorput et al. (2015).
Figure 5
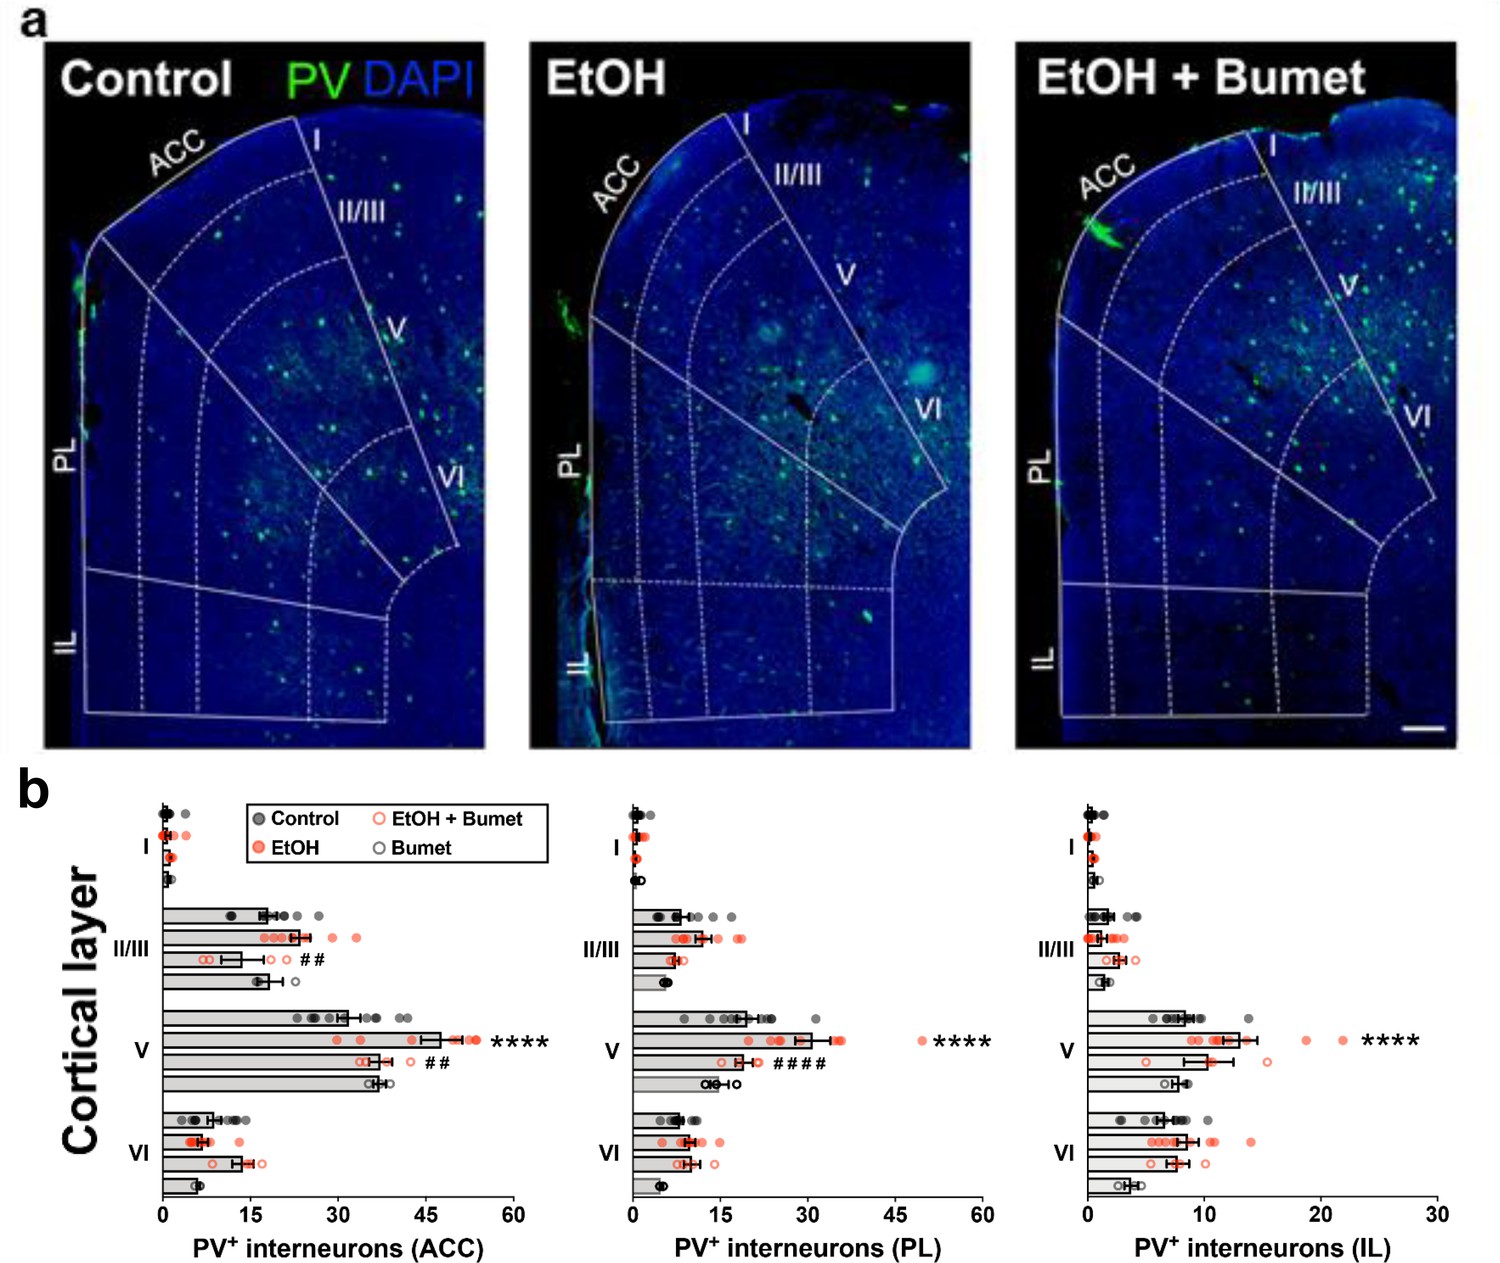
Treatment of binge ethanol-exposed dams with bumetanide prevents the interneuronopathy associated with ethanol exposure in utero.
(a) Histological sections of young adult mouse prefrontal cortex processed for parvalbumin immunofluorescence, counterstained with DAPI, and binned by functional region and layer using DAPI cytoarchitecture. Scale bar = 100 µm. (b) Quantification of PV+ MGE-derived GABAergic cortical interneurons in mice without (control), and with (EtOH) binge-type ethanol exposure (E13.5 - E16.5), as well as mice with ethanol exposure born to dams treated with bumetanide (0.15 mg/kg/day i.p. in DMSO; EtOH+Bumet), or mice born to dams that consumed control diet and received bumetanide treatment (Bumet). **** = p < 0.0001 compared to control; ##, #### = p < 0.01, 0.0001 compared to EtOH; two-way ANOVA with Bonferroni post-test analyzed per region, and stratified by treatment and cortical layer. ACC = anterior cingulate cortex, PL = prelimbic, IL = infralimbic. The EtOH group, and a portion of the Control group are reproduced from Skorput et al. (2015).
Figure 6
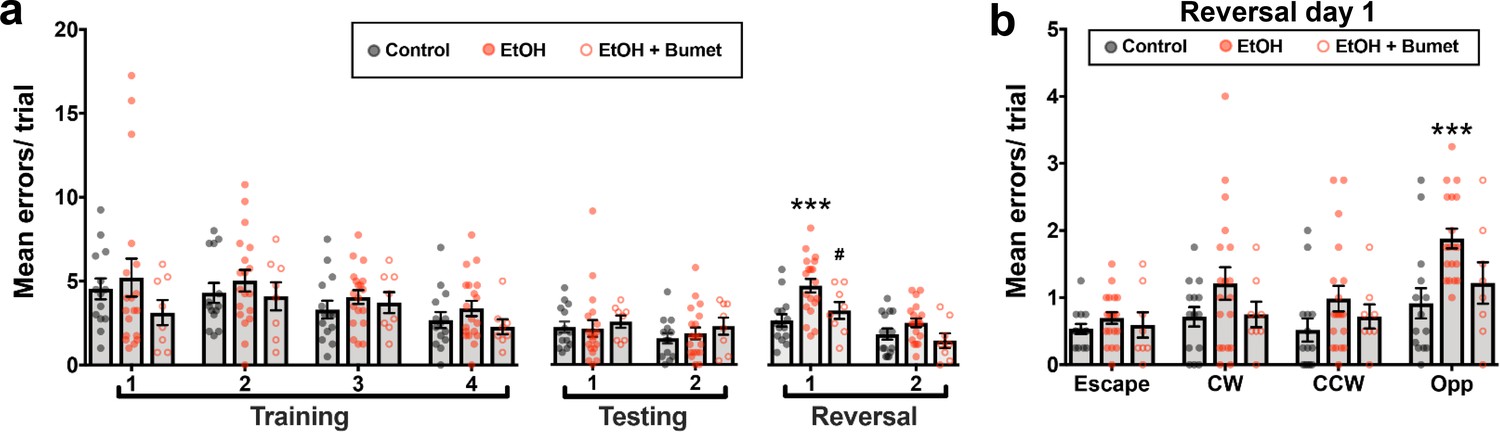
Maternal bumetanide treatment prevents the deficits in behavioral flexibility seen with ethanol exposure in utero.
(a) Mean number of errors committed in the modified Barnes maze by young adult mice born to control, ethanol consuming (EtOH) and ethanol consuming plus bumetanide treated (EtOH+Bumet) dams across training testing and reversal phases of testing. *** = p < 0.001 compared to control, # = p < 0.05 compared to EtOH; two-way ANOVA with Bonferroni post-test. (b) Mean number of errors committed during the first reversal day stratified by quadrant relative to the escape hole. Increased errors in the opposite quadrant denotes perseverative behavior *** = p < 0.001 compared to control; two-way ANOVA with Bonferroni post-test. The Control and EtOH groups are reproduced from Skorput et al. (2015).
Tables
Key resources table
| Reagent type (species) or resource | Designation | Source or reference | Identifiers | Additional information |
|---|---|---|---|---|
| Genetic reagent (M. musculus) | Nkx2.1-Cre | The Jackson Laboratory | JAX: 00861 MGI: J:131144 | PMID: 17990269 |
| Genetic reagent (M. musculus) | Ai14 | The Jackson Laboratory | JAX: 007914 MGI: J:155793 | PMID: 20023653 |
| Antibody | Anti-parvalbumin (mouse polyclonal) | Millipore Sigma | Cat#: MAB 1572 | 1:1000 |
| Chemical compound, drug | GABA | Millipore Sigma | Cat#: A2129 | |
| Chemical compound, drug | Bumetanide | Millipore Sigma | Cat#: B-3023 | |
| Software, algorithm | ImageJ | NIH | https://imagej.nih.gov/ij/ | |
| Software, algorithm | Adobe Photoshop | Adobe Systems, San Jose, CA | http://www.adobe.com/products/photoshop.html | |
| Software, algorithm | Graphpad Prism | Graphpad Software, Inc, La Jolla, CA | http://www.graphpad.com/ | |
| Software, algorithm | G*Power 3.1 | Heinrich Heine University Düsseldorf | RRID: SCR_013726 |
Additional files
-
Transparent reporting form
- https://doi.org/10.7554/eLife.48648.012
Download links
A two-part list of links to download the article, or parts of the article, in various formats.
Downloads (link to download the article as PDF)
Open citations (links to open the citations from this article in various online reference manager services)
Cite this article (links to download the citations from this article in formats compatible with various reference manager tools)
The NKCC1 antagonist bumetanide mitigates interneuronopathy associated with ethanol exposure in utero
eLife 8:e48648.
https://doi.org/10.7554/eLife.48648


