Local human movement patterns and land use impact exposure to zoonotic malaria in Malaysian Borneo
- London School of Hygiene and Tropical Medicine, United Kingdom
- Universiti Malaysia Sabah, Malaysia
- University of Glasgow, United Kingdom
- University of Malaya, Malaysia
Figures
Figure 1
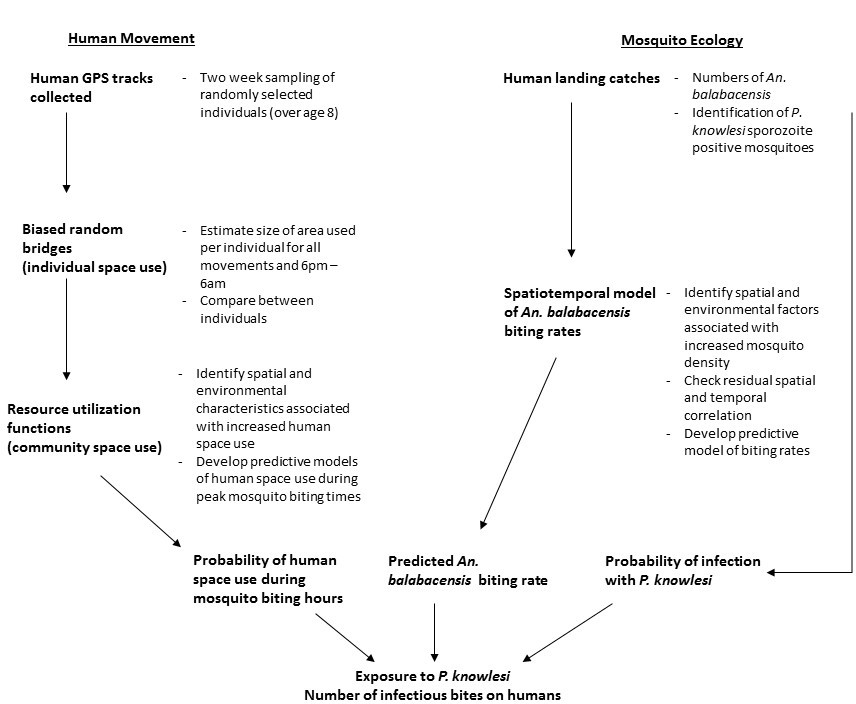
Analysis methods used to estimate individual and community-level exposure to P. knowlesi sporozoite positive An. balabacencis bites.
https://doi.org/10.7554/eLife.47602.002
Figure 2
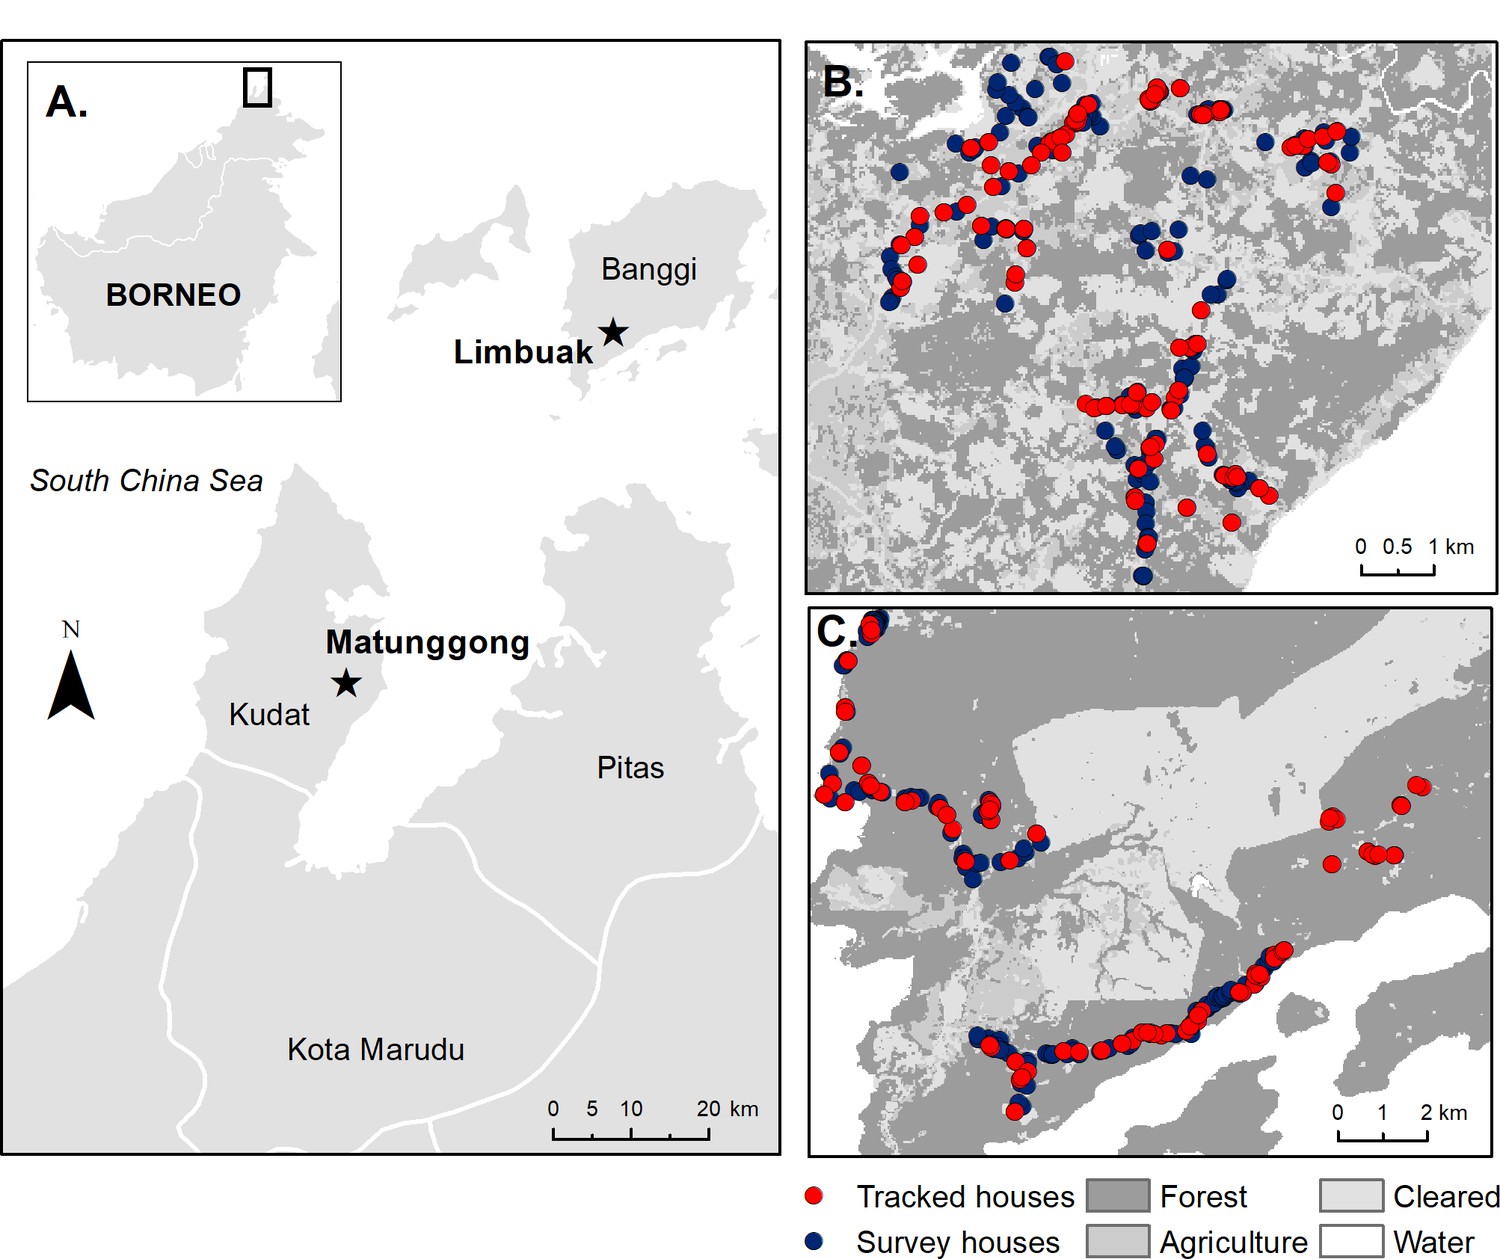
Study sites and sampled houses.
(A) Location of study sites and tracked houses (households with one or more individual GPS tracked) and survey houses (households with only questionnaire data collected and used for prediction) in (B) Matunggong, Kudat and (C) Limbuak, Banggi; description of land cover classification and survey methodology in Fornace et al. (2018).
Figure 3
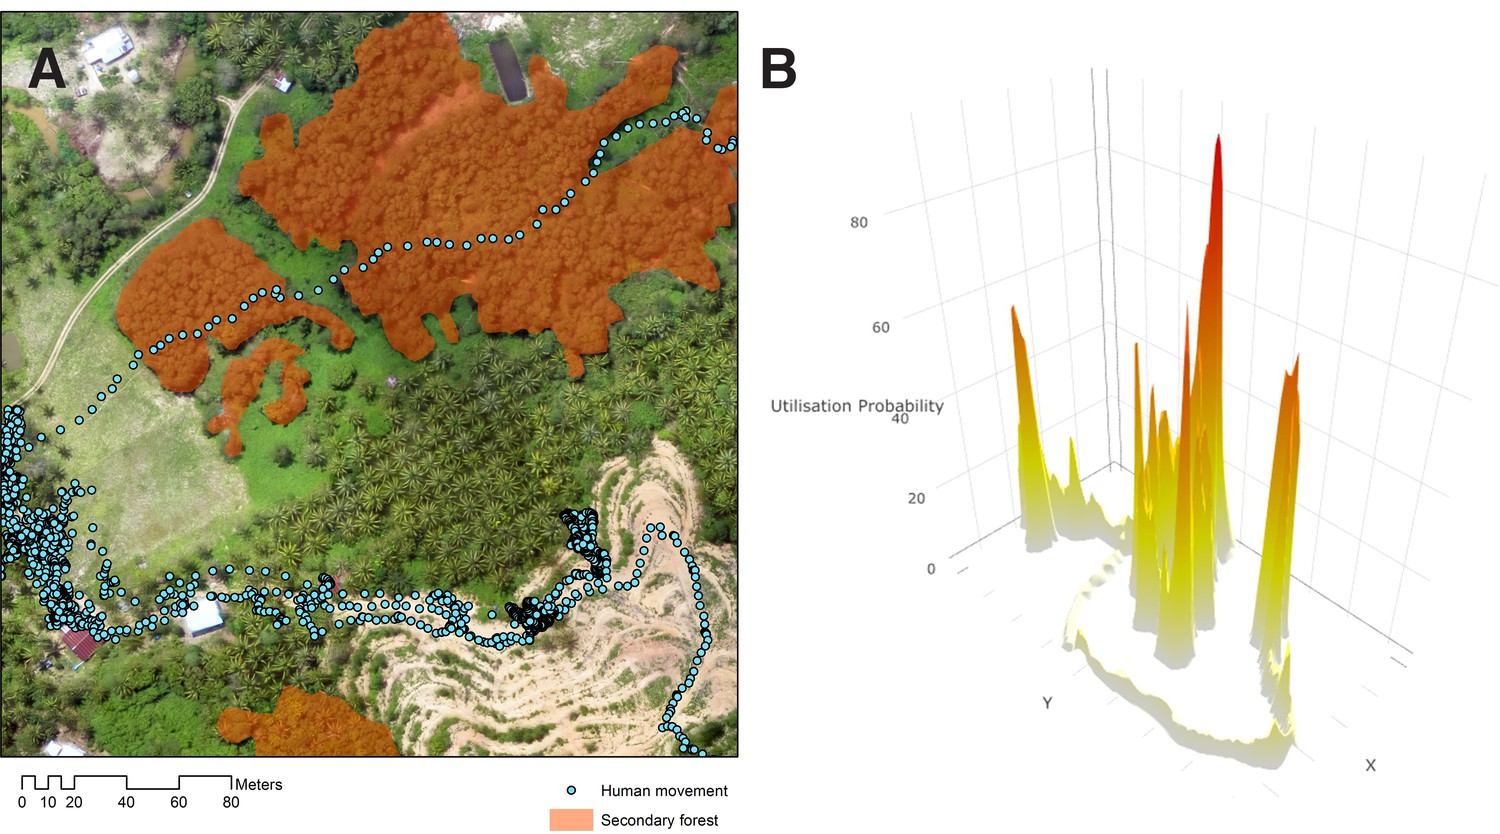
Human movement relative to habitat.
(A) Example of GPS tracks from a 22-year-old male plantation worker in Matunggong over aerial imagery, (B) Probability density of an individual utilisation distribution calculated from GPS tracks.
Figure 4
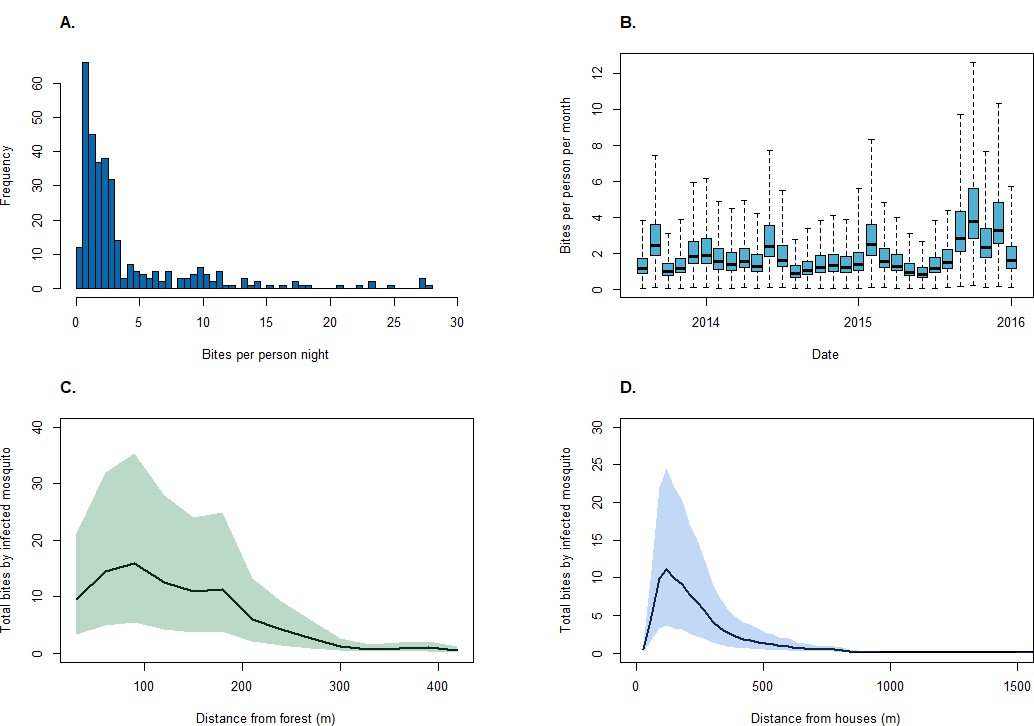
Mosquito biting rates.
(A) An. balabacensis biting rate per person-night from data collected in Matunggong, (B) Predicted mean An. balabacensis biting rates per month from spatiotemporal models, (C) Predicted number of bites for all individuals residing in Matunggong by distance from secondary forest, and by (D) Distance from households.
Figure 5
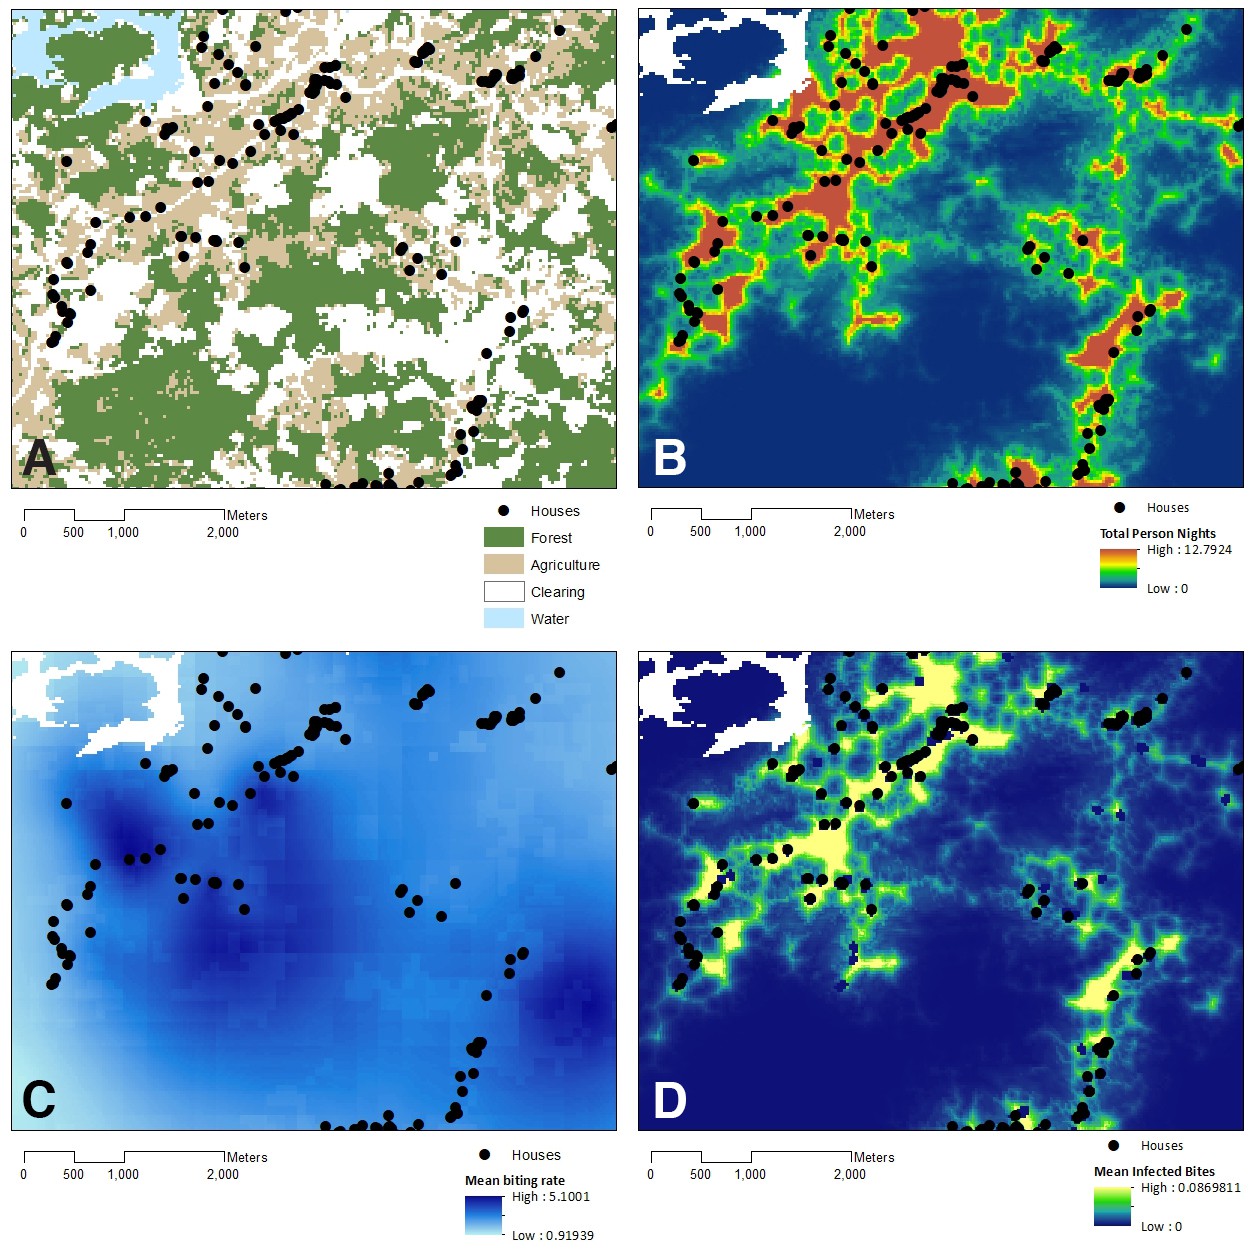
Model outputs relative to land cover.
(A) Land use in Matunggong site, (B) Predicted number of person- nights for entire community per grid cell, (C) Predicted mosquito biting rates, (D) Predicted infected bites per grid cell.
Tables
Table 1
Baseline characteristics of study site communities and sampled populations
https://doi.org/10.7554/eLife.47602.004| Matunggong | Limbuak | |||
|---|---|---|---|---|
| Sampled | Community* | Sampled | Community* | |
| N | 134 | 958 | 109 | 633 |
| Gender | ||||
| Male, % (n) | 51.5% (69) | 46.1% (442) | 47.7% (52) | 46.1% (292) |
| Women, % (n) | 48.5% (65) | 53.9% (516) | 52.3% (57) | 53.9% (341) |
| Age in years, median (IQR) | 31 (17–53) | 32.5 (8–51) | 29 (15–46) | 30 (15–47) |
| Main occupation, % (n) | ||||
| Farming | 29.9% (40) | 28.6% (274) | 7.3% (8) | 10.2% (65) |
| Plantation work | 10.4% (14) | 8.6% (82) | 10.1% (11) | 7.6% (48) |
| Student | 26.1% (35) | 27.7% (265) | 26.6% (29) | 21.0% (133) |
| Other | 6.7% (9) | 9.1% (87) | 15.6% (17) | 14.4% (91) |
| No employment/housewife | 26.9% (36) | 26.1% (250) | 40.4% (44) | 46.8% (296) |
-
*Community includes all individuals eligible for these surveys (residents ages eight and over).
Table 2
Home range estimates by demographic group and site
https://doi.org/10.7554/eLife.47602.006| Area of 99% UD for all movement (hectares) Median (IQR) | Area of 99% UD from 6pm – 6am (hectares) Median (IQR) | |
|---|---|---|
| Demographic group | ||
| Men | 32.09 (7.07, 148.93) | 4.50 (2.79, 19.53) |
| Women | 74.25 (12.24, 320.74) | 6.08 (2.79, 24.17) |
| Children (under 15) | 26.01 (6.39, 151.94) | 3.83 (2.79, 8.73) |
| Occupation | ||
| Farming | 29.34 (8.15, 324.38) | 6.75 (2.79, 19.80) |
| Plantation work | 49.14 (9.72, 201.33) | 4.59 (2.79, 27.72) |
| Fishing | 442.49 (40.07, 1189.00) | 227.16 (4.05, 465.14) |
| Office work | 96.80 (63.61, 256.75) | 13.63 (2.88, 20.14) |
| Other | 19.98 (6.30, 26.82) | 2.97 (2.61, 18.27) |
| No employment/housewife | 43.38 (11.97, 157.59) | 3.60 (2.79, 19.12) |
| Site | ||
| Limbuak | 99.99 (24.57, 387.54) | 7.74 (2.88, 58.05) |
| Matunggong | 12.02 (3.94, 85.55) | 2.97 (2.70, 11.77) |
| Season | ||
| Dry (February – July) | 28.62 (5.45, 252.45) | 4.19 (2.79, 19.60) |
| Wet (August – January) | 54.90 (17.23, 160.99) | 4.64 (2.79, 19.35) |
Table 3
Estimated coefficients for fixed effects of resource utilisation functions (6pm – 6am).
https://doi.org/10.7554/eLife.47602.007| Matunggong | Limbuak | |||||
|---|---|---|---|---|---|---|
| Mean | SD | 95% CI | Mean | SD | 95% CI | |
| Probability of presence/absence | ||||||
| Intercept | 3.383 | 0.839 | 3.218, 3.547 | 3.571 | 0.104 | 3.368, 3.775 |
| Distance from own house (km) | −0.954 | 0.006 | −0.966,–0.942 | −0.543 | 0.003 | −0.548,–0.539 |
| Distance from forest (km) | 5.997 | 0.177 | −5.650, 6.344 | −1.845 | 0.050 | −1.944,–1.746 |
| Distance from road (km) | −5.552 | 0.057 | −5.663,–5.441 | −3.656 | 0.019 | −3.694,–3.618 |
| Distance from houses (km) | −0.504 | 0.030 | −0.563,–0.444 | 0.176 | 0.007 | 0.162, 0.189 |
| Elevation (100 MSL) | −0.710 | 0.025 | −0.759,–0.662 | −1.268 | 0.037 | −1.340,–1.197 |
| Slope (degrees) | −0.0244 | 0.002 | −0.028,–0.021 | −0.009 | 0.001 | −0.012,–0.006 |
| Utilisation distributions for locations present | ||||||
| Intercept | −6.846 | 0.866 | −8.549,–5.147 | −5.676 | 1.017 | −7.673,–3.681 |
| Distance from own house (km) | −0.583 | 0.004 | −0.590,–0.576 | −0.308 | 0.002 | −0.311,–0.305 |
| Distance from forest (km) | 12.012 | 0.199 | 11.621, 12.403 | −1.771 | 0.049 | −1.868,–1.675 |
| Distance from road (km) | −0.833 | 0.054 | −0.939,–0.728 | −1.532 | 0.011 | −1.554,–1.511 |
| Distance from houses (km) | −0.819 | 0.023 | −0.864,–0.773 | −0.239 | 0.006 | −0.249,–0.228 |
| Elevation (100 MSL) | 0.664 | 0.027 | 0.610, 0.718 | −0.297 | 0.003 | −0.303,–0.297 |
| Slope (degrees) | −0.021 | 0.002 | −0.024,–0.018 | −0.034 | 0.001 | −0.036,–0.031 |
Table 4
Model selection statistics for mosquito biting rates
https://doi.org/10.7554/eLife.47602.008| Model | DIC* | Marginal likelihood | Model complexity* | RMSE* | Mean log-score (CPO) | |
|---|---|---|---|---|---|---|
| M1 | No spatial or temporal effect | 2367.03 | −1196.61 | 4.12 | 4.99 | 3.61 |
| M2 | Spatial effect only | 2292.97 | −1175.47 | 40.03 | 4.42 | 4.16 |
| M3 | Spatial effect + month as fixed effect | 2282.88 | −1173.68 | 43.99 | 4.24 | 3.90 |
| M4 | Spatial effect + month as random effect | 2222.89 | −1155.91 | 50.28 | 4.05 | 3.61 |
| M5 | Spatial effect + month as random walk | 2225.43 | −1167.79 | 47.55 | 4.09 | 3.63 |
Table 5
Posterior rate ratio estimates and 95% Bayesian credible interval (BCI) for model 4 of mosquito biting rates.
https://doi.org/10.7554/eLife.47602.010| Covariate | 95% BCI Rate Ratio | ||
|---|---|---|---|
| Mean | 2.5% | 97.5% | |
| Population density | 0.963 | 0.916 | 1.004 |
| EVI | 3.185 | 1.185 | 8.532 |
| Distance to forest (100 m) | 0.926 | 0.871 | 0.976 |
| Spatial range (km) | 3.120 | 0.514 | 6.926 |
Table 6
Probabilities of infected bites per person per night for sampled individuals in Matunggong by demographic characteristics.
https://doi.org/10.7554/eLife.47602.011| Predicted infectious bites per night (median [IQR]) | |
|---|---|
| Demographic group | |
| Men | 0.00157 (0.000804, 0.00289) |
| Women | 0.00219 (0.000864, 0.00307) |
| Children (under 15) | 0.00131 (0.000812, 0.00330) |
| Occupation | |
| Farming | 0.00180 (0.00101, 0.00362) |
| Plantation work | 0.00216 (0.000680, 0.00278) |
| Student | 0.00143 (0.000915, 0.00304) |
| Other | 0.00225 (0.000852, 0.00302) |
| No employment/housewife | 0.00142 (0.000297, 0.00263) |
Additional files
-
Source code 1
R scripts for fitting biased random bridges (with simulated GPS data), spatiotemporal models of mosquito biting rates and semi-continuous resource utilisation models.
- https://doi.org/10.7554/eLife.47602.013
-
Supplementary file 1
Data sources for assessed spatial and environmental covariates.
- https://doi.org/10.7554/eLife.47602.014
-
Supplementary file 2
Data sources of mosquito biting data.
- https://doi.org/10.7554/eLife.47602.015
-
Transparent reporting form
- https://doi.org/10.7554/eLife.47602.016
Download links
A two-part list of links to download the article, or parts of the article, in various formats.
Downloads (link to download the article as PDF)
Open citations (links to open the citations from this article in various online reference manager services)
Cite this article (links to download the citations from this article in formats compatible with various reference manager tools)
Local human movement patterns and land use impact exposure to zoonotic malaria in Malaysian Borneo
eLife 8:e47602.
https://doi.org/10.7554/eLife.47602


