TMC1 is an essential component of a leak channel that modulates tonotopy and excitability of auditory hair cells in mice
- Tsinghua University, China
- IDG/McGovern Institute for Brain Research at Tsinghua University, China
- Hong Kong University of Science and Technology, China
Figures
Figure 1

TMC1 mediates a background current in outer hair cells.
(A) Diagram of the recording configuration. The P6 outer hair cells (OHCs, mostly P6 apical-middle OHCs if not specified otherwise) in acutely dissociated cochlea were whole-cell voltage-clamped with Cs+ in the recording electrode and perfused with either 144 Na or 144 NMDG external solutions. 144 Na, regular recording solution; 144 NMDG, Na+ substituted with NMDG+. (B) Representative traces of membrane current (Im) in OHCs from wild-type and Tmc1-knockout (Tmc1 KO) mice. The light gray and pink traces were recorded traces that were low-pass filtered to less noisy traces shown in black and red (similar filtering applied in the following figures). IBG (background current) was calculated by subtraction of Im in 144 Na (INa) and Im in 144 NMDG (INMDG) to exclude technical leak. (C–E) Quantification of the INa (C), INMDG (D), and IBG (E) measured from recordings similar to (B). Wild-type INa, –73 ± 6 pA, Tmc1-knockout INa, –21 ± 3 pA; wild-type INMDG, –7 ± 1 pA, Tmc1-knockout INMDG, –4 ± 1 pA; wild-type IBG, –71 ± 5 pA, Tmc1-knockout IBG, –18 ± 2 pA (F). Example of Im in wild-type (black and gray) and Tmc1-knockout (red and pink) OHCs undergoing a series of membrane depolarization, with tissues bathed in 144 Na followed by 144 NMDG. (G–I) Composite data showing I-V curve (G), reversal potential (H), and IBG (I) measured and calculated from recordings similar to (F). (G) I-V curve from recordings in 144 Na. (H) Mean reversal potentials calculated from I-V curve recorded in OHCs in 144 Na. (I) IBG-V curve after subtracting INMDG. Only inward current was measured because NMDG was only applied extracellularly. The external solution contained 1.3 mM Ca2+. The holding potential was −70 mV. Data are presented as mean ± SEM. N values are shown in each panel. *p<0.05, **p<0.01, ***p<0.001, Student’s t-test.
-
Figure 1—source data 1
TMC1 mediates a background current in outer hair cells.
- https://doi.org/10.7554/eLife.47441.003
Figure 2 with 1 supplement
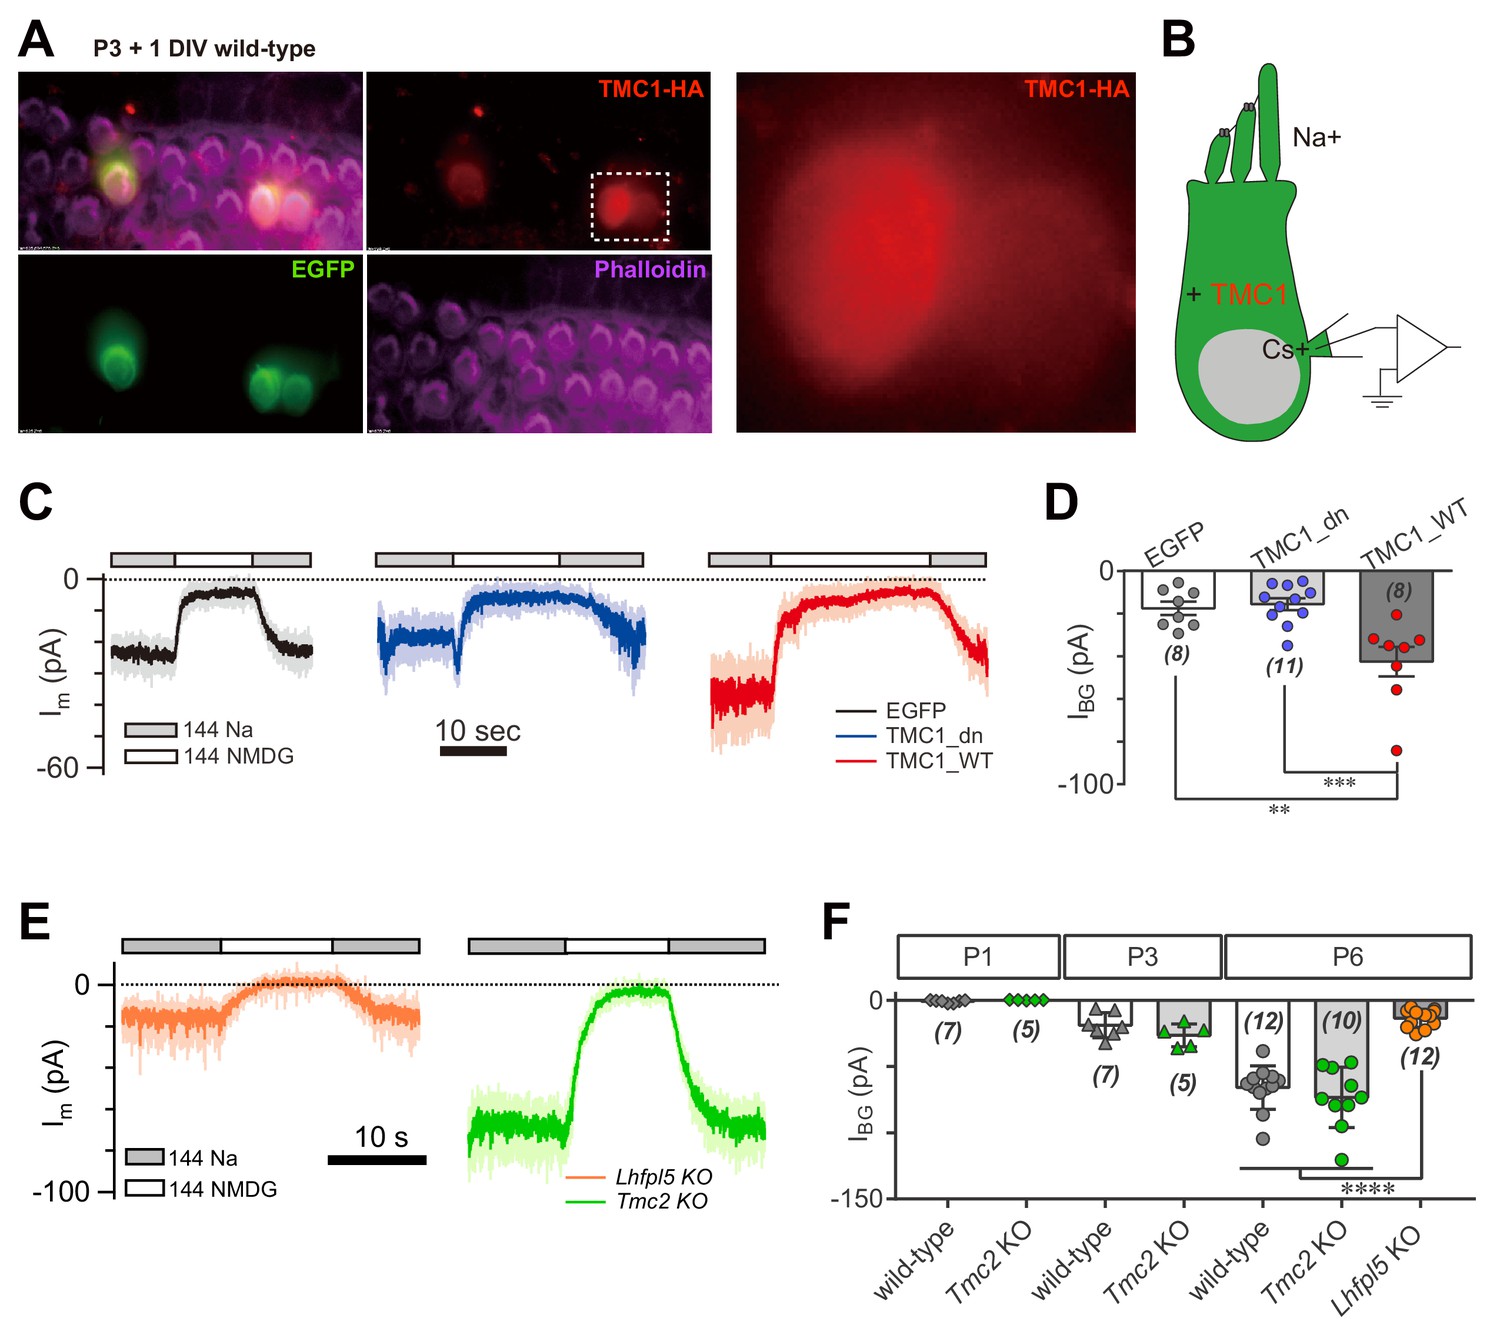
TMC1 but not TMC2 conducts the background current.
(A) Exogenous expression of TMC1 in wild-type OHCs from organotypic P3 cochlear tissue cultured for 1 day in vitro (P3 + 1DIV). EGFP was co-expressed as an indicator. The OHCs were stained to show spatial distribution of TMC1 (recognized by HA antibody, red), EGFP (by GFP antibody, green), and actin-enriched stereocilia (by Phalloidin, magenta), with two OHCs from the white dashed frame shown in detail. (B) Diagram of the recording configuration. The OHCs expressed engineered TMC1 with EGFP and whole-cell voltage clamped with Cs+ in the recording electrode and Na+ extracellularly. (C) Examples of Im of wild-type OHCs at P3 + 1DIV, expressing control (EGFP), deafness TMC1 (TMC1_dn), or wild-type TMC1 (TMC1_WT). (D) Quantification of IBG from wild-type OHCs expressing EGFP, TMC1_dn, and TMC1_WT under conditions similar to those in (C). IBG values: EGFP, –17 ± 3 pA; TMC1_dn, –16 ± 3 pA; TMC1_WT, –43 ± 7 pA. (E) Representative traces of IBG in P6 Tmc2- and Lhfpl5-knockout OHCs from acutely dissociated cochleae. (F) Quantification of IBG measured from recordings similar to (E) from Tmc2- and Lhfpl5-knockout mice at assigned ages. IBG values: P1 wild-type, –1 ± 0 pA, P1 Tmc2-knockout, –0 ± 0 pA; P3 wild-type, –19 ± 4 pA, P3 Tmc2-knockout, –26 ± 4 pA; P6 wild-type, –66 ± 5 pA, P6 Tmc2-knockout, –73 ± 7 pA, P6 Lhfpl5-knockout, –14 ± 2 pA. The external solution contained 1.3 mM Ca2+. The holding potential was −70 mV. Data are presented as mean ± SEM. N values are shown in each panel. *p<0.05, **p<0.01, ***p<0.001, one-way ANOVA.
-
Figure 2—source data 1
TMC1 but not TMC2 conducts the background current.
- https://doi.org/10.7554/eLife.47441.006
Figure 2—figure supplement 1
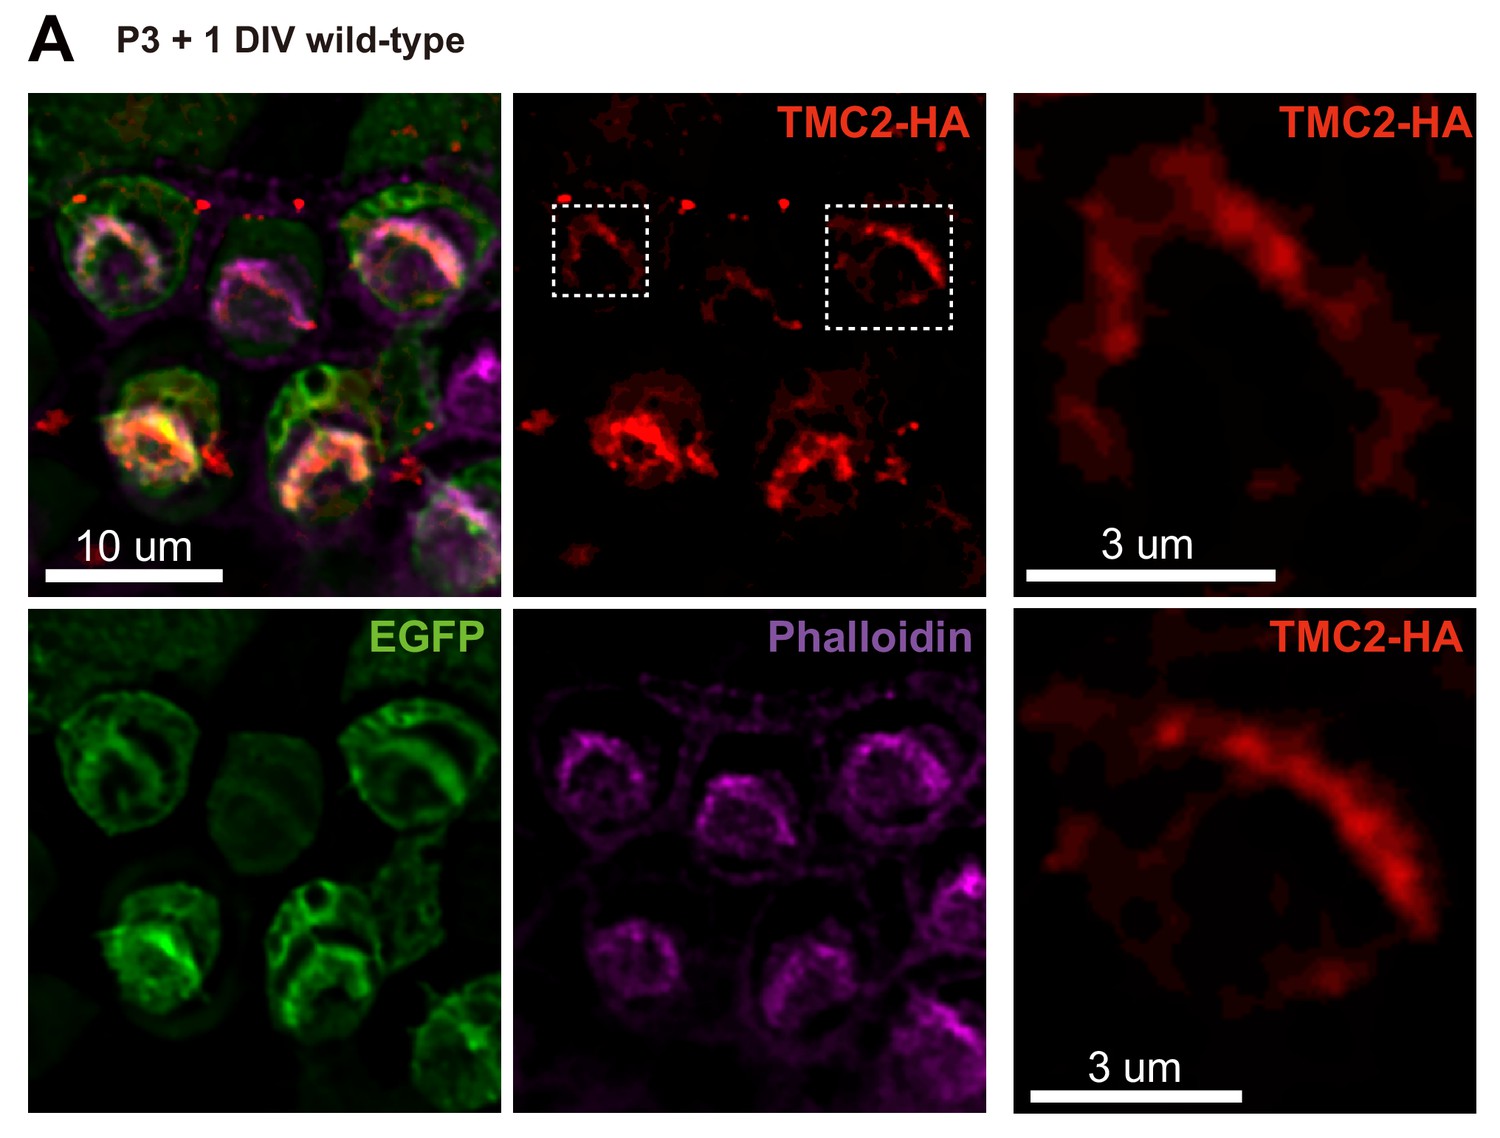
Localization of ectopically expressed TMC2 in OHCs.
(A) Exogenous expression of TMC2 in P3 + 1DIV OHCs. The OHCs were stained to show spatial pattern of TMC2 (by HA antibody, red) and EGFP (by GFP antibody, green). The hair bundle was stained by Phalloidin (magenta). Two transfected OHCs are shown enlarged from the white dashed frame.
Figure 3 with 1 supplement
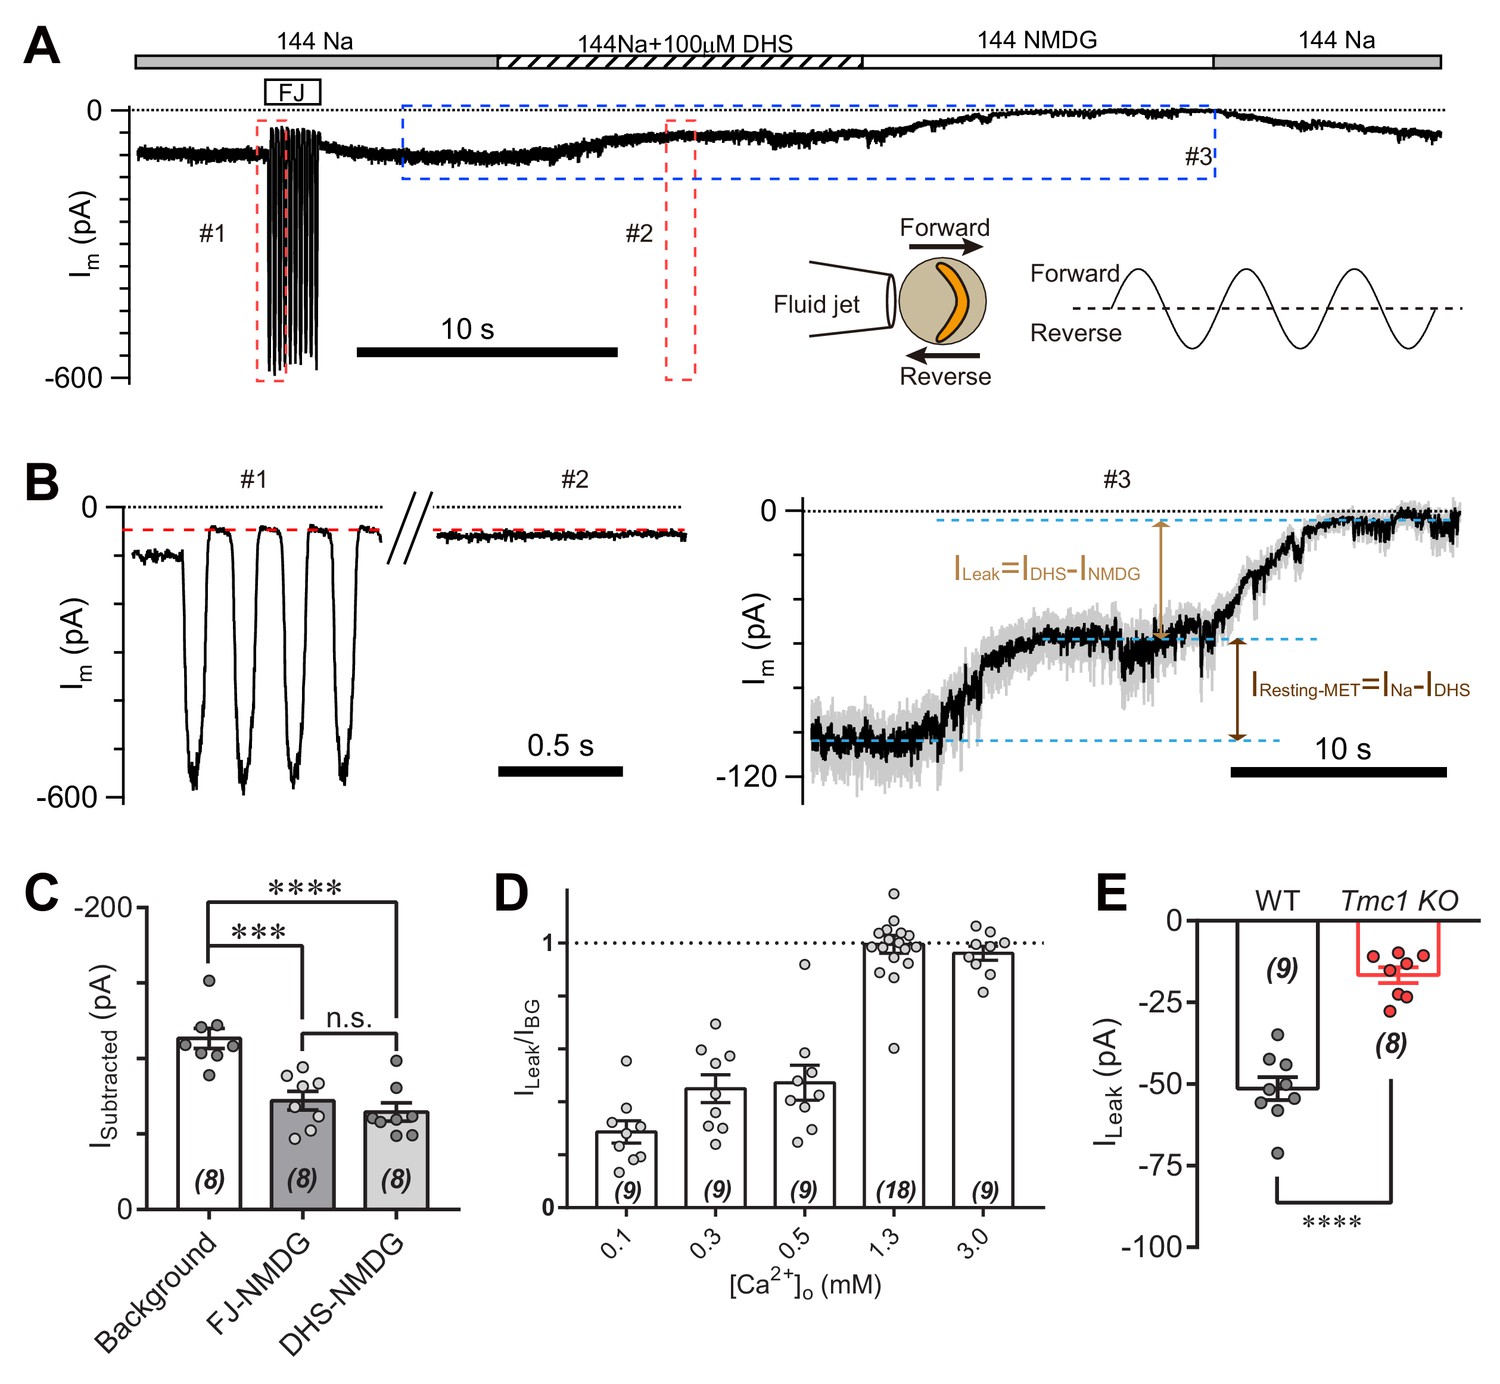
TMC1-mediated leak current is not carried by the resting open MET channel.
(A) Representative Im trace showing fluid jet (FJ)-induced open and closed status of MET current and DHS-induced alteration of baseline current. The OHCs were bathed in external solution with 0.3 mM Ca2+ instead of 1.3 mM Ca2+. Insets: left, a diagram of fluid jet stimulation on a hair bundle; right, a 40 Hz sinusoidal stimulation protocol was used to induce forward and reverse deflection of the hair bundle. (B) Dashed frames #1, #2, and #3 in (A) are shown as enlarged traces. The baseline current was similar when the MET channels were closed by either FJ (#1) or DHS (IDHS, #2), as highlighted with a red dashed line. As shown in #3, the DHS-sensitive resting MET current (IResting-MET) was calculated by subtraction of INa and IDHS. The baseline current was further closed by NMDG (INMDG). ILeak was defined as the subtraction of IDHS and INMDG. (C) Quantification of subtracted currents under different conditions: background, –113 ± 7 pA; FJ-NMDG (ILeak subtracted from current baseline closed at negative FJ), –72 ± 6 pA; DHS-NMDG (ILeak subtracted from that closed by 100 μM DHS), –65 ± 6 pA. (D) Quantification of ratio of ILeak to IBG (ILeak/IBG) under different [Ca2+]o conditions: 0.1 mM, 0.29 ± 0.04; 0.3 mM, 0.45 ± 0.05; 0.5 mM, 0.47 ± 0.07; 1.3 mM, 1.00 ± 0.03; 3.0 mM, 0.96 ± 0.03. (E) Quantification of the ILeak of OHCs measured in 1.3 [Ca2+]o. Wild-type ILeak, –51 ± 3 pA, Tmc1-knockout ILeak, –17 ± 2 pA. The external solution contained variable Ca2+ concentration as indicated. The holding potential was −70 mV. Data are represented as mean ± SEM. N values are shown in each panel. *p<0.05, **p<0.01, ***p<0.001, (C) ANOVA; (E) Student’s t-test.
-
Figure 3—source data 1
TMC1-mediated leak current is not carried by the resting open MET channel.
- https://doi.org/10.7554/eLife.47441.009
Figure 3—figure supplement 1
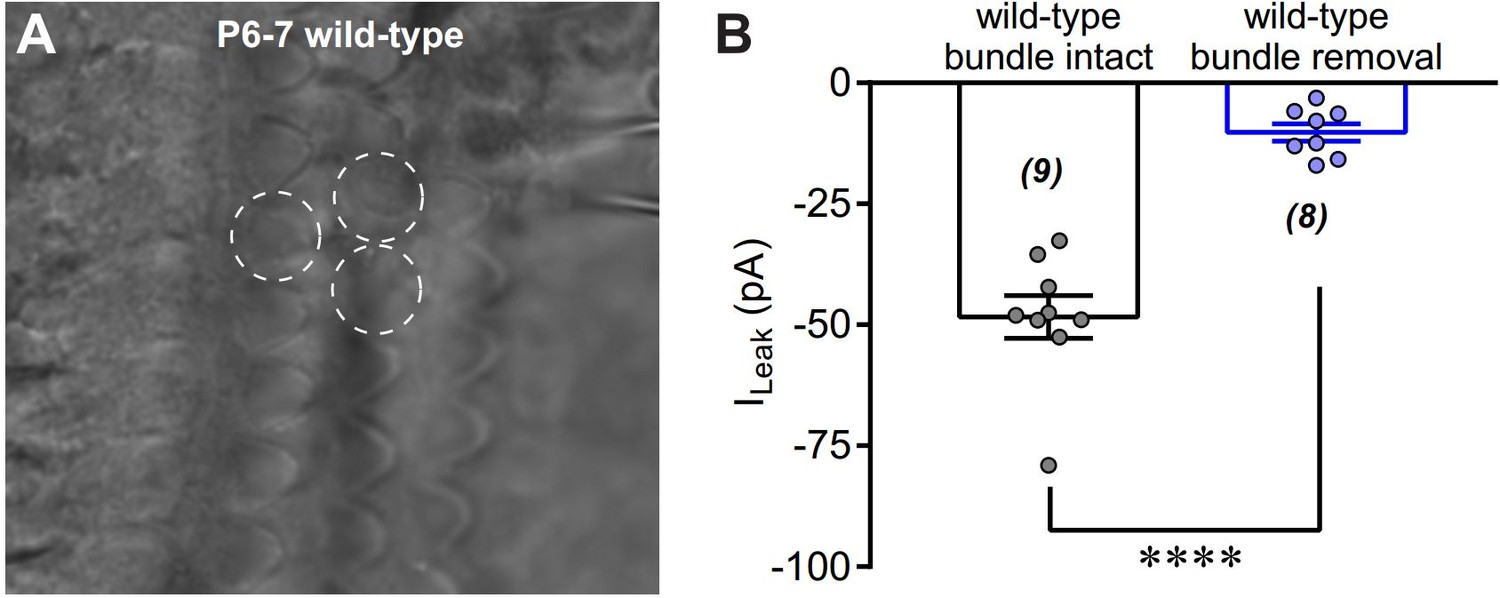
Removal of hair bundles disrupts leak current of OHCs.
(A) A photo showing the OHC in recording with hair bundle removed. The circles with white dashed line indicate hair-bundle removed OHCs. (B) Quantification of ILeak recorded in wild-type OHCs with or without hair-bundle removal. The holding potential was −70 mV. Data are represented as mean ± SEM. N values are shown in each panel. *p<0.05, **p<0.01, ***p<0.001, Student’s t-test.
-
Figure 3—figure supplement 1—source data 1
Removal of hair bundles disrupts leak current of OHCs.
- https://doi.org/10.7554/eLife.47441.010
Figure 4 with 1 supplement
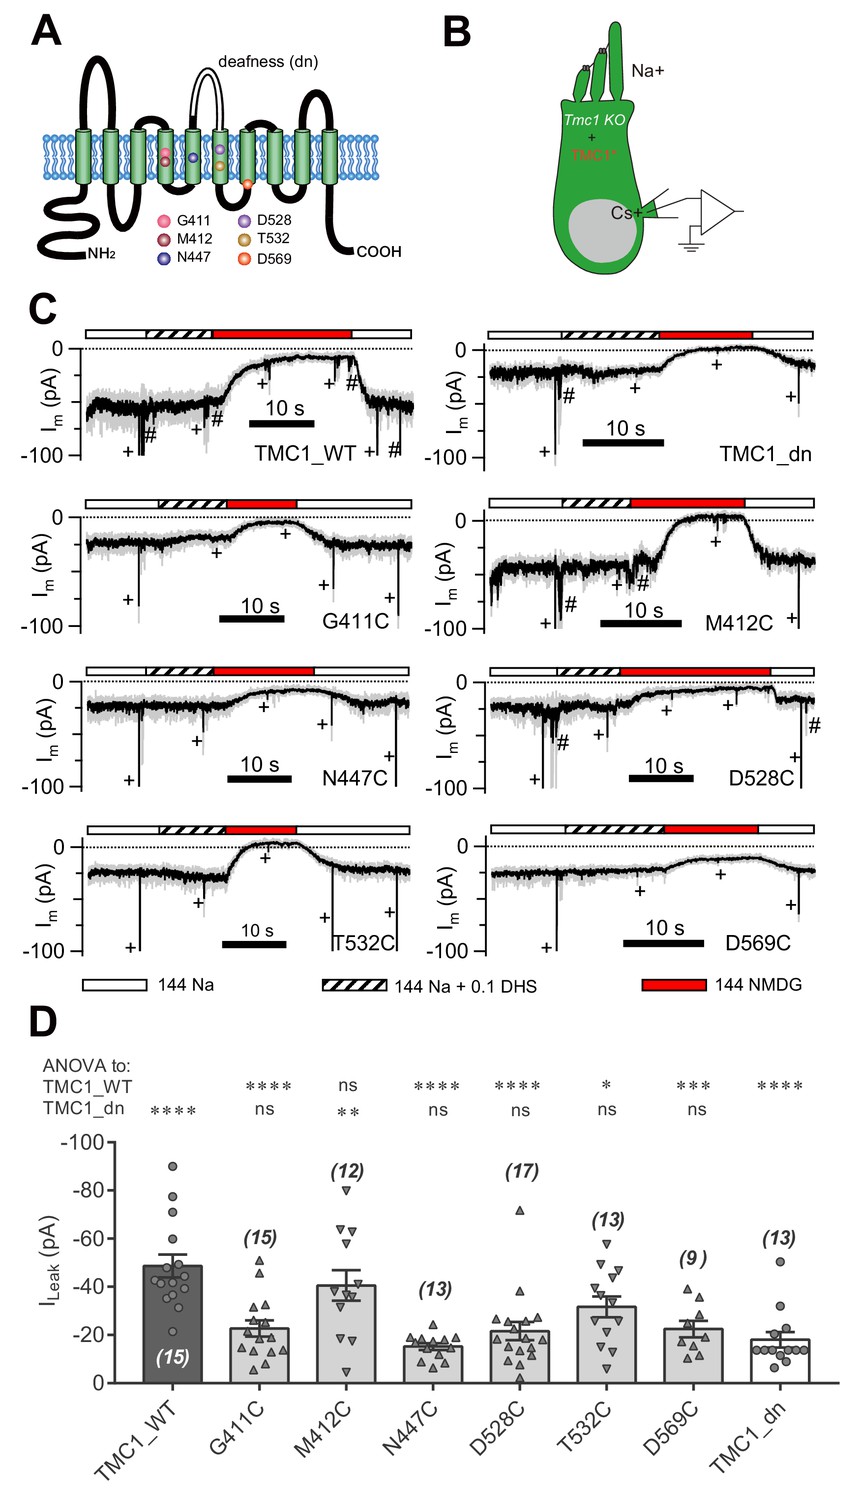
Amino-acid substitution in TMC1 alters the leak current.
(A) TMC1 with 10 putative transmembrane domains. The six substituted amino acids are highlighted as colored balls in the predicted positions, and the deafness (dn) truncation is at the third extracellular loop between TM5 and TM6. (B) Diagram of the analysis of leak current in cultured Tmc1-knockout OHCs (P3 + 1 DIV) expressing modified TMC1 (TMC1*). (C) Representative traces showing the rescue of leak conductance in OHCs by control full-length TMC1 (TMC1_WT), deafness TMC1 (TMC1_dn), TMC1-G411C (G411C), TMC1-M412C (M412C), TMC1-N447C (N447C), TMC1-D528C (D528C), TMC1-T532C (T532C), and TMC1-D569C (D569C). Perfusion contents are indicated below. An 800 nm step deflection was applied to the hair bundle every 10 s by a glass probe. The glass probe induced MET currents are marked ‘+', accompanying unwanted MET currents and electrical artefacts induced by switching the perfusion system (#). Note that the MET current was truncated to better show the leak current. (D) Quantification of rescue by mTMC1 constructs. ILeak values: TMC1_WT, –49 ± 5 pA, G411C, –23 ± 3 pA; M412C, –40 ± 6 pA, N447C, –15 ± 1 pA; D528C, –22 ± 4 pA, T532C, –32 ± 4 pA, D569C, –23 ± 3 pA, TMC1_dn, –18 ± 3 pA. The rescue indexes of FL and dn were used to evaluate significant difference. Cell numbers are shown on each bar. The external solution contained 1.3 mM Ca2+. The holding potential was −70 mV. Data are presented as mean ± SEM. *p<0.05, **p<0.01, ***p<0.001, ANOVA.
-
Figure 4—source data 1
Amino-acid substitution in TMC1 alters the leak current.
- https://doi.org/10.7554/eLife.47441.013
Figure 4—figure supplement 1
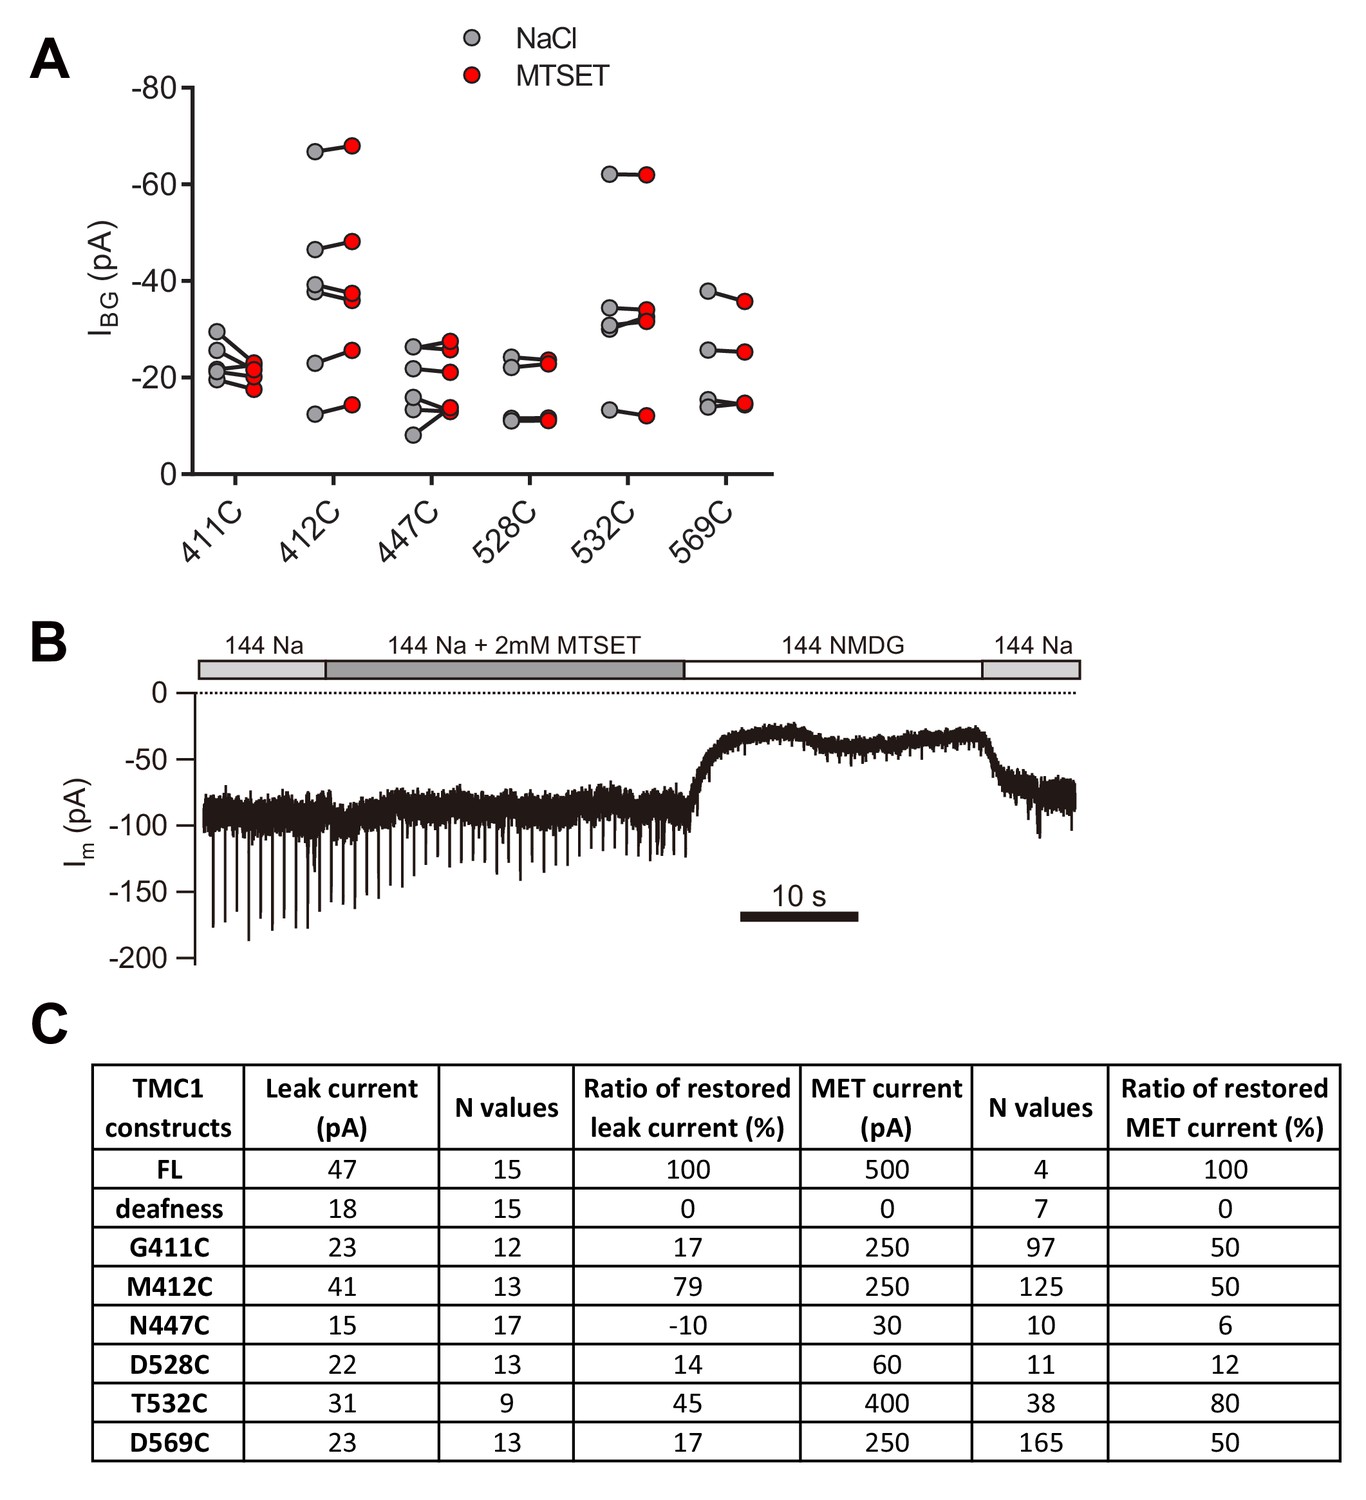
Cysteine substitution in TMC1 affects the MET current and the leak current.
(A) Plots of amplitude of the background current recorded from Tmc1-knockout OHCs expressing engineered TMCs as indicated, before and after MTSET treatment. (B) Representative trace of Im recording in a P1 + 3 DIV Tmc1;Tmc2 double-knockout OHC expressing TMC1-M412C. A 10 Hz train of 800 nm step deflection was applied to the hair bundle by a glass probe. (C) Summary of absolute values and normalized ratios of ILeak and IMET. The ILeak values were measured from data in Figure 4. The restored MET values of all TMC1 constructs were measured from Pan et al. (2018), excepting that of dn, which was collected in vestibular hair cells from Kawashima et al. (2011).
-
Figure 4—figure supplement 1—source data 1
Cysteine substitution in TMC1 affects the MET current and the leak current.
- https://doi.org/10.7554/eLife.47441.014
Figure 5
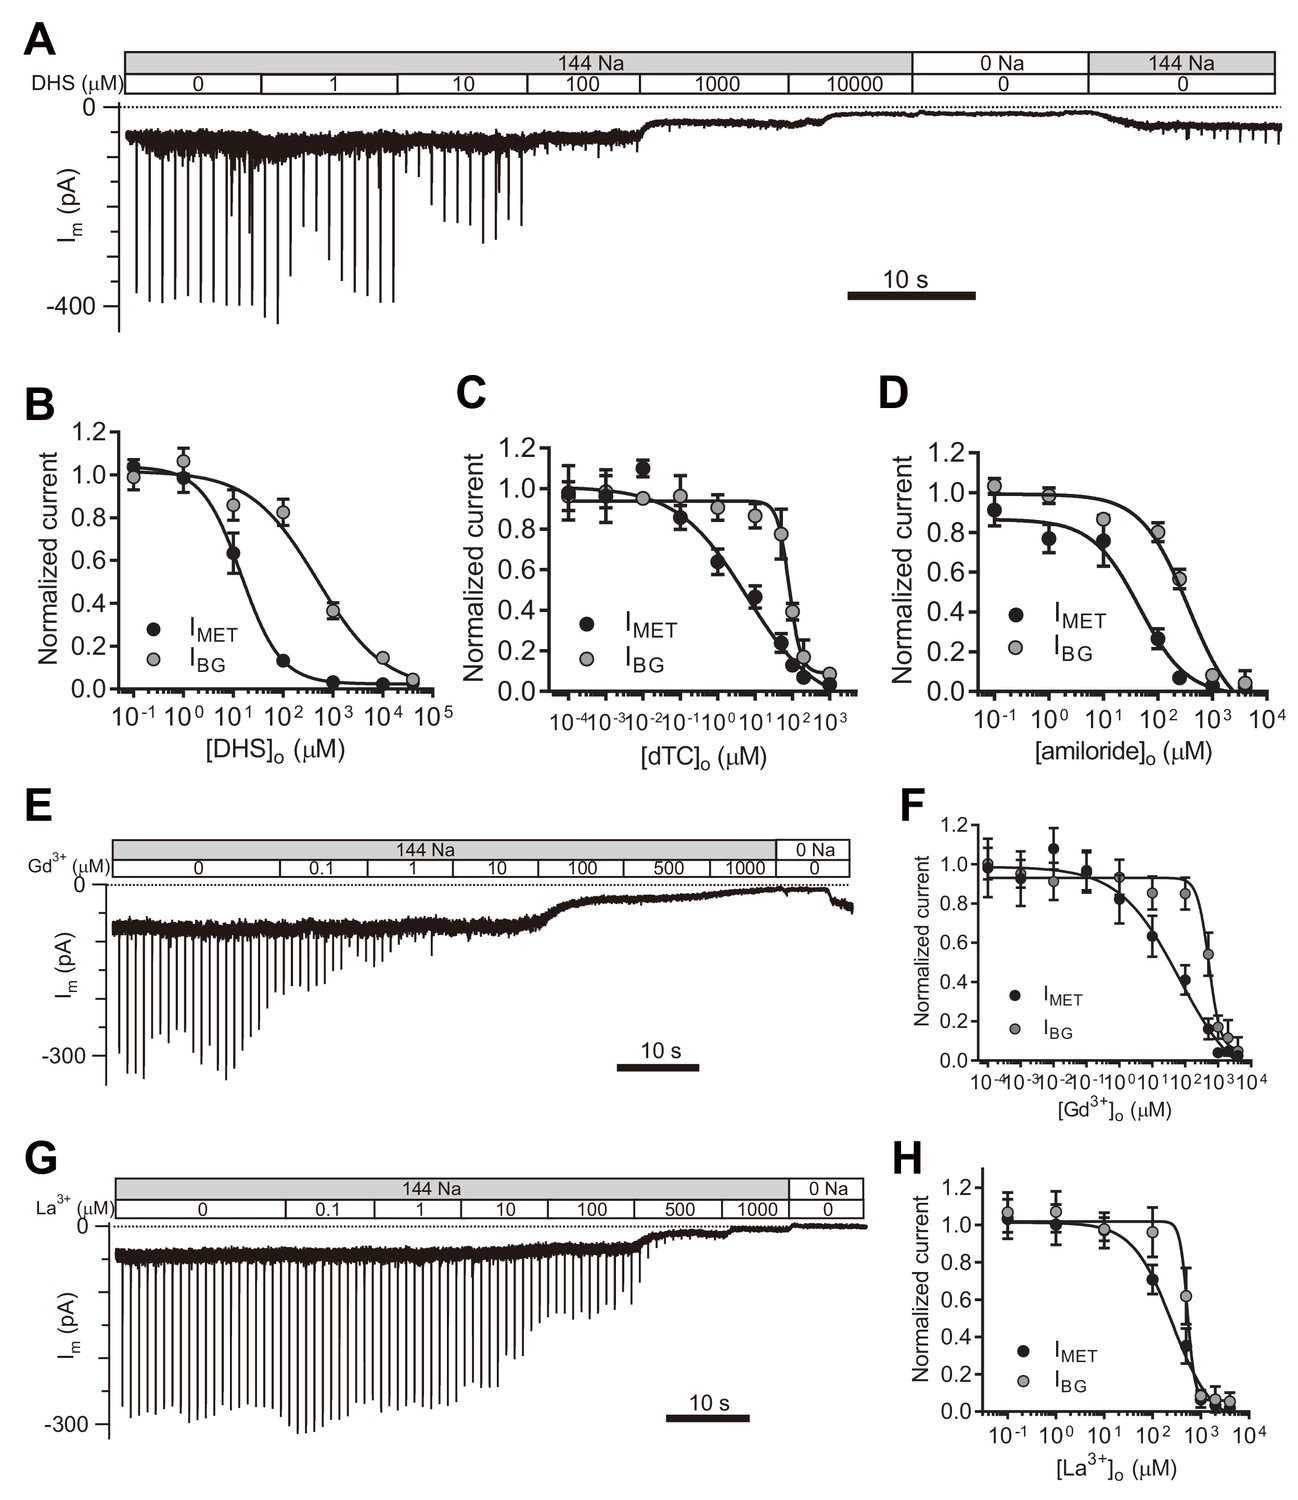
TMC1-mediated leak conductance is antagonized by MET channel blockers.
(A and B) Representative trace (A) and statistical curve (B) of Im inhibition by DHS. A 10 Hz train of 800 nm step deflection was applied to the hair bundle by a glass probe to induce MET currents. IMET and IBG were calculated and plotted against the DHS concentration. As fitted, the IC50 of DHS was 15 μM for the MET channels and 487 μM for the leak conductance. Cell numbers, 7–11. Hill slope: IMET, −1.10; IBG, −0.65. (C and D) Statistical dose curve of Im with graded concentrations of d-tubocurarine (dTC) (C) and amiloride (D). dTC IC50: IMET, 6 μM; IBG, 82 μM. dTC Hill slope: IMET, −0.47; IBG, −2.80. dTC cell numbers, 5–15. Amiloride IC50: IMET, 46 μM; IBG, 365 μM. Amiloride Hill slope: IMET, −1.36; IBG, −1.67. Amiloride cell numbers, 7–16. (E and F) Dosage effect of Gd3+. Example trace (E) and statistical curve (F) of Im in OHCs during perfusion with solutions containing graded concentrations of Gd3+. A train of 800 nm step deflection was applied to the hair bundle by a glass probe to induce MET currents. The MET and leak current amplitudes changed because of the channel sensitivity of Gd3+ and NMDG. IC50: IMET, 66 μM; IBG, 524 μM. Hill slope: IMET, −0.48; IBG, −2.49. Cell numbers, 7–16. (G and H) Dose effect of La3+. Example trace (G) and dosage curve (H) of Im with La3+ treatment. A train of 800 nm step deflection was applied to the hair bundle by a glass probe to induce MET currents. IC50: IMET, 259 μM; IBG, 531 μM. Hill slope: IMET, −1.06; IBG, −5.67. Cell numbers, 7–8. For space reasons, 144 NMDG is shown as 0 Na. The external solution contained 1.3 mM Ca2+. The holding potential was −70 mV. Data are presented as mean ± SEM.
-
Figure 5—source data 1
TMC1-mediated leak conductance is antagonized by MET channel blockers.
- https://doi.org/10.7554/eLife.47441.016
Figure 6
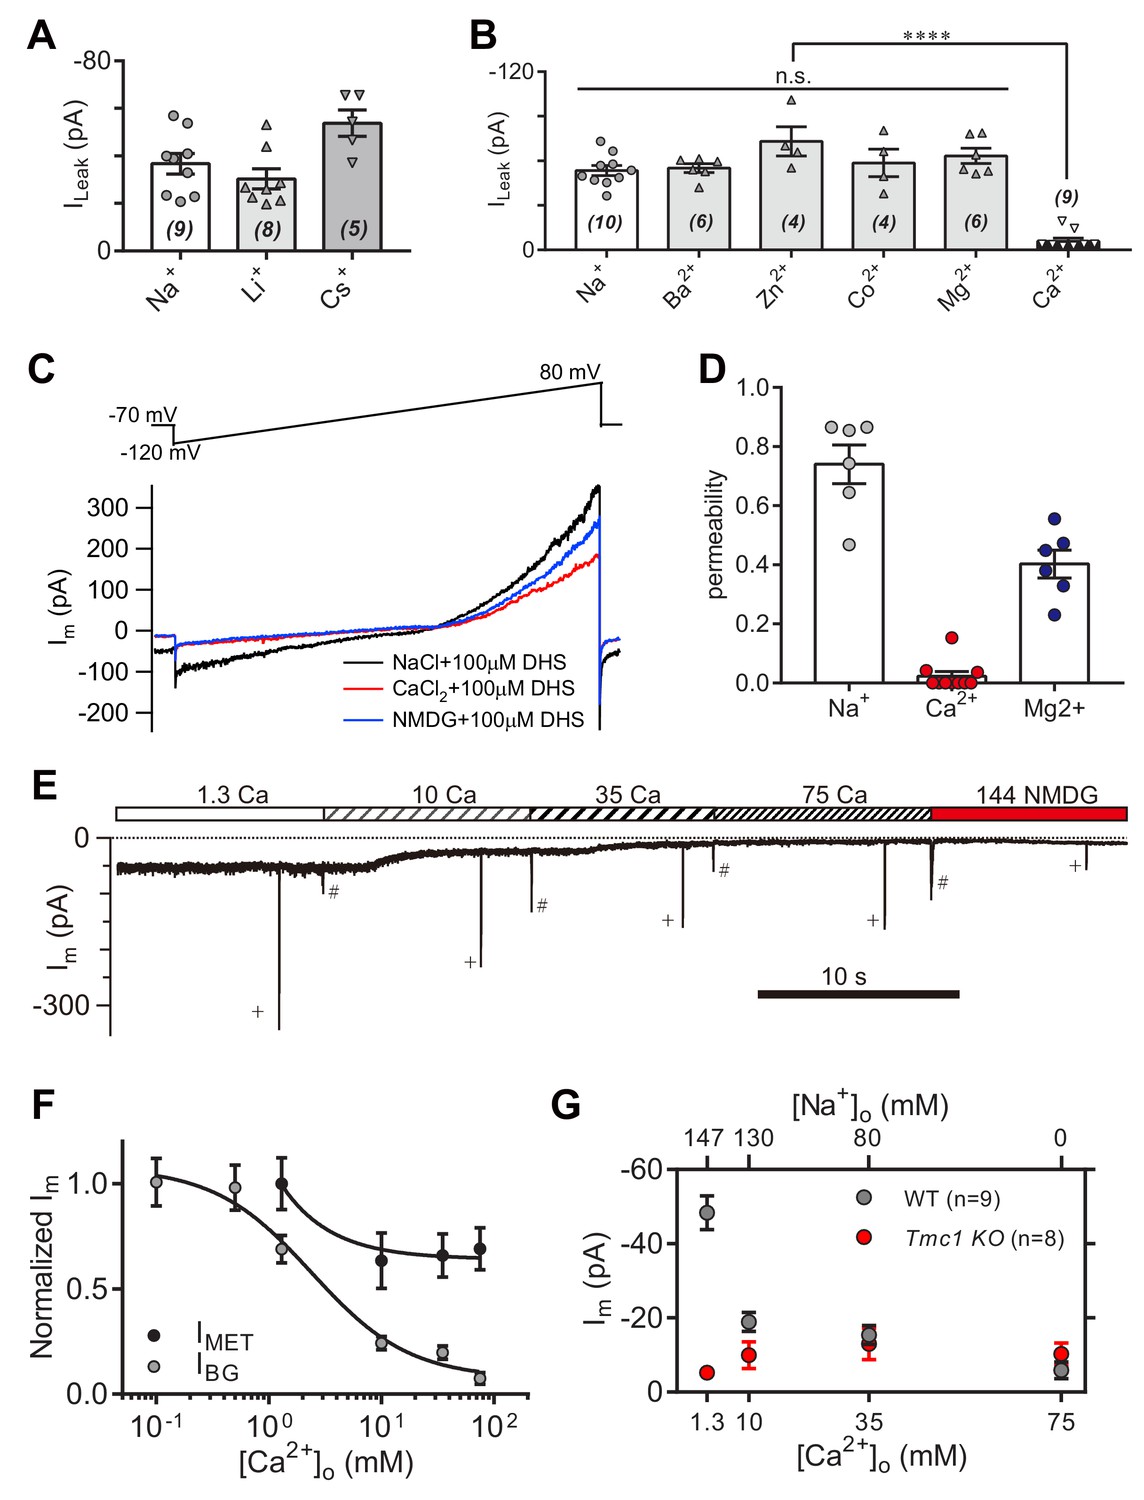
High-concentration Ca2+ blocks the leak current but not MET current.
(A) Monovalent cations Li+ and Cs+ conducted the leak current. In this experiment, 150 mM NaCl was substituted with 150 mM LiCl or 150 mM CsCl in the external solution. (B) Divalent cations 10 mM Ba2+, 75 mM Zn2+, 75 mM Co2+, 150 mM Mg2+, and 75 mM Ca2+, conducted the leak current. The 150 mM NaCl was partially or completely replaced with cations as described in the Materials and methods. (C) Representative Im traces by ramp stimulation for calculation of ionic permeability of the leak channel. The extracellular ion was switched from 150 mM Na+ to 75 mM Ca2+, and to 150 NMDG+, all containing 100 μM DHS. In the intracellular solution, 150 mM CsCl was used. (D) Quantification of ionic permeability calculated from similar recordings in (C). (E) Example trace of Im of OHCs during perfusion with solutions containing graded concentrations of Ca2+ and Na+. An 800 nm step deflection was applied to the hair bundle by a glass probe. The glass probe induced MET currents are marked ‘+', accompanying unwanted MET currents and artefacts induced by switching the perfusion system (#). (F) Dose curves of IBG and IMET in wild-type OHCs in different Ca2+ and Na+ concentrations (cell numbers, 9–20). (G) Quantification of dose-dependent background leak current in OHCs from wild-type (black) and Tmc1-knockout (red) mice when bathed in mixed Ca2+ and Na+. The ions and concentrations used in test external solutions were variable, as described in this figure legend and the Materials and methods. The holding potential was −70 mV. Data are presented as mean ± SEM. N values are shown in each panel. *p<0.05, **p<0.01, ***p<0.001, (B,D) ANOVA.
-
Figure 6—source data 1
High-concentration Ca2+ blocks the leak current but not MET current.
- https://doi.org/10.7554/eLife.47441.018
Figure 7
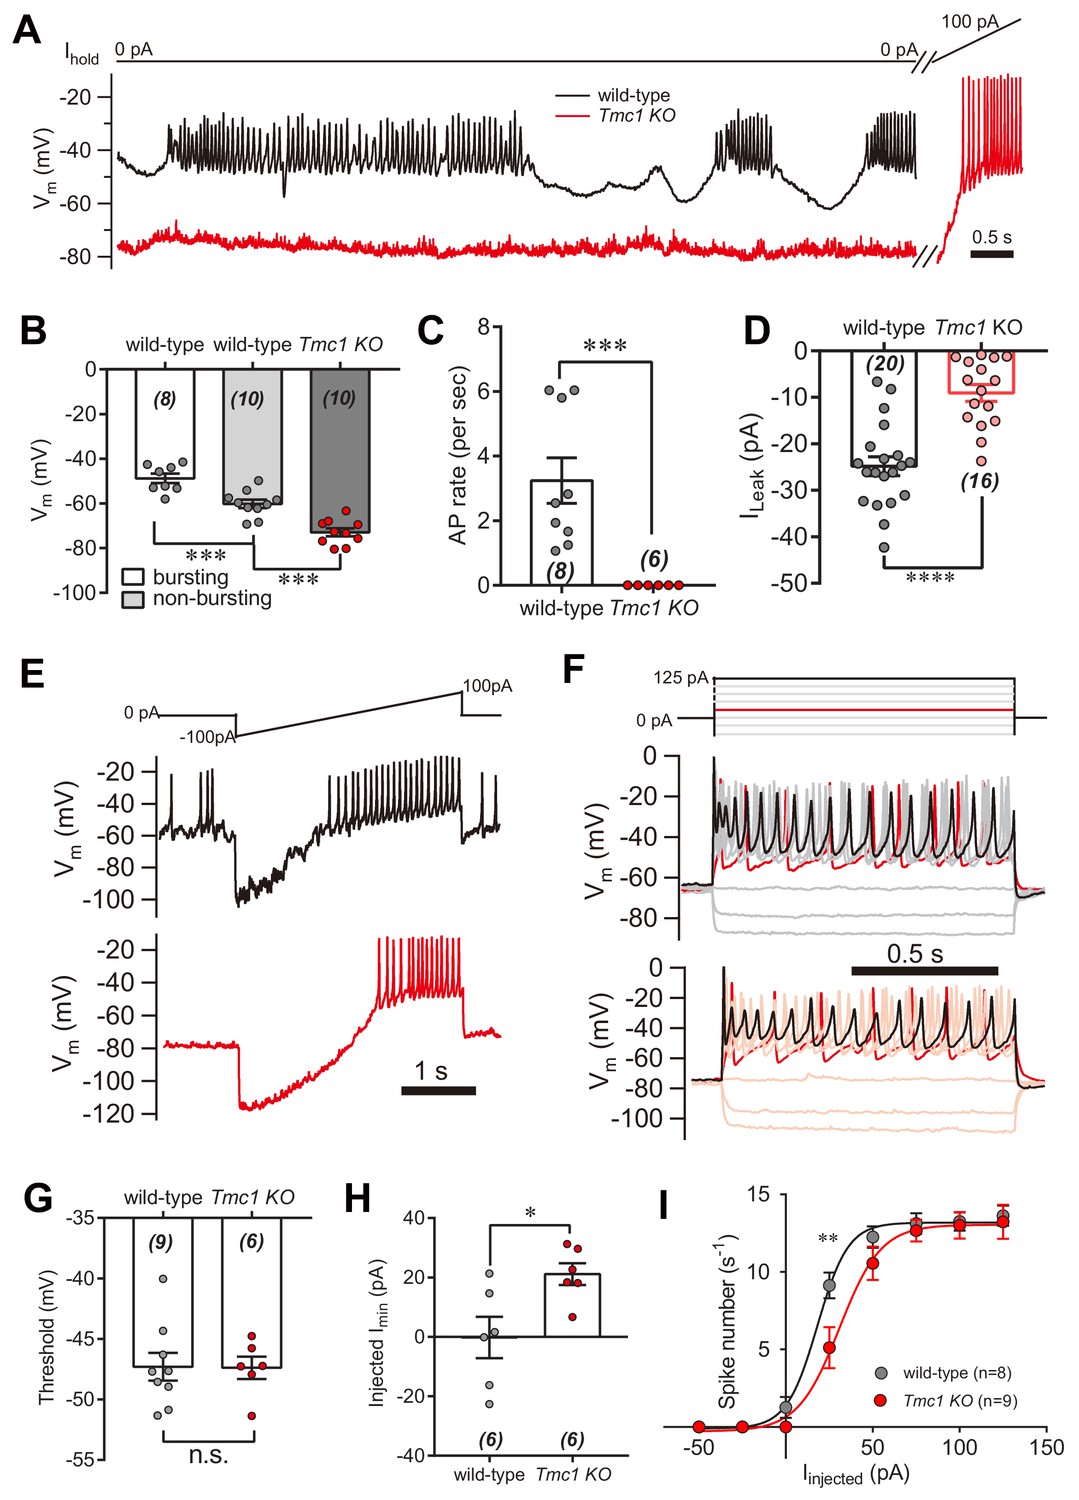
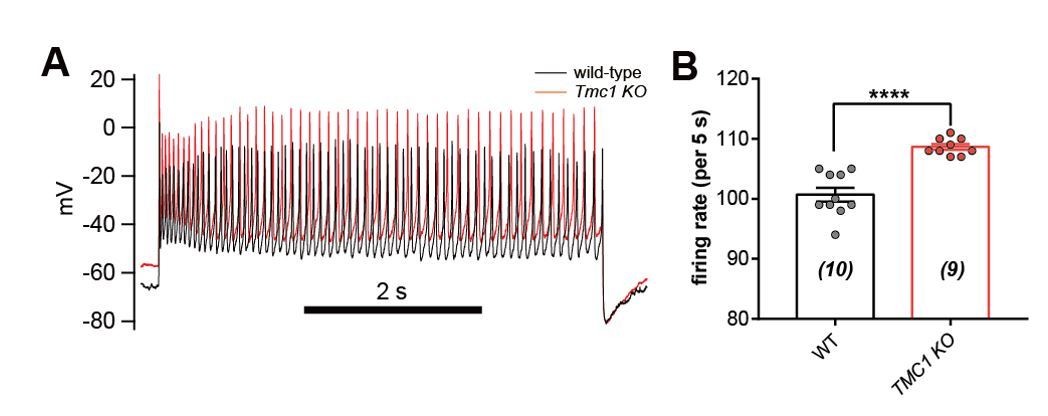
IHC excitability is down-regulated in Tmc1-knockout mice.
(A) Representative current-clamp recording in IHCs bathed in external solution with 100 μM DHS from wild-type (black) and Tmc1-knockout (red) mice. For the most part, the IHCs were held at 0 pA. To define excitability, a ramp current was injected into the Tmc1-knockout IHCs to induce a burst of spikes. (B) Quantification of Vm recorded in IHCs similar to (A). Values of Vm in wild-type IHCs were defined as two states, bursting and non-bursting, which did not apply to Tmc1-knockout IHCs. Vm of wild-type in bursting state, 49 ± 2 mV; wild-type in non-bursting state, 60 ± 2 mV; Tmc1-knockout, 73 ± 2 mV. (C) Quantification of firing rate (spikes/s) in IHCs similar to (A). Values of firing rate: wild-type, 3.2 ± 0.7 Hz; Tmc1-knockout, 0 ± 0 Hz. (D) Quantification of ILeak from voltage-clamp recording in IHCs. Values of ILeak: wild-type, 24 ± 4 pA; Tmc1-knockout, 14 ± 2 pA. (E) Representative current-clamp traces of Vm in IHCs with ramp-current injection from –100 pA to +100 pA for 3 s. (F) Representative current-clamp recording in IHCs stimulated by a family of depolarization currents from –50 pA to +125 pA at 25 pA steps. (G) Quantification of firing threshold from data as in (E). Values of threshold were –47 ± 1 mV in wild-type OHCs and –47 ± 1 mV in Tmc1-knockout OHCs. (H) Quantification of minimum current injected (Injected Imin) to evoke an action potential from data as in (E). In wild-type OHCs: –0 ± 7 pA; in Tmc1-knockout OHCs: –21 ± 4 pA. (I) Quantification of numbers of spikes per second from data as in (F). Wild-type: 0 pA, 1.3 ± 0.7; 25 pA, 9.1 ± 0.8; 50 pA, 12.3 ± 0.7; 75 pA, 13.1 ± 0.7, 100 pA, 13.3 ± 0.6; 125 pA, 13.6 ± 0.7. Tmc1-knockout: 0 pA, 0 ± 0; 25 pA, 5.1 ± 1.3; 50 pA, 10.6 ± 1.1; 75 pA, 12.7 ± 0.7, 100 pA, 13.0 ± 0.9; 125 pA, 13.2 ± 1.1. In this figure, the external solution contained 1.3 mM Ca2+ and 100 μM DHS. K+ was used in the intracellular solution for current-clamp recordings in this figure except that Cs+ was used for voltage-clamp recording in (D). Data are presented as mean ± SEM. N values are shown in each panel. *p<0.05, **p<0.01, ***p<0.001, (B) ANOVA; (C,D,G,H,I) Student’s t-test.
-
Figure 7—source data 1
IHC excitability is down-regulated in Tmc1-knockout mice.
- https://doi.org/10.7554/eLife.47441.020
Figure 8 with 1 supplement
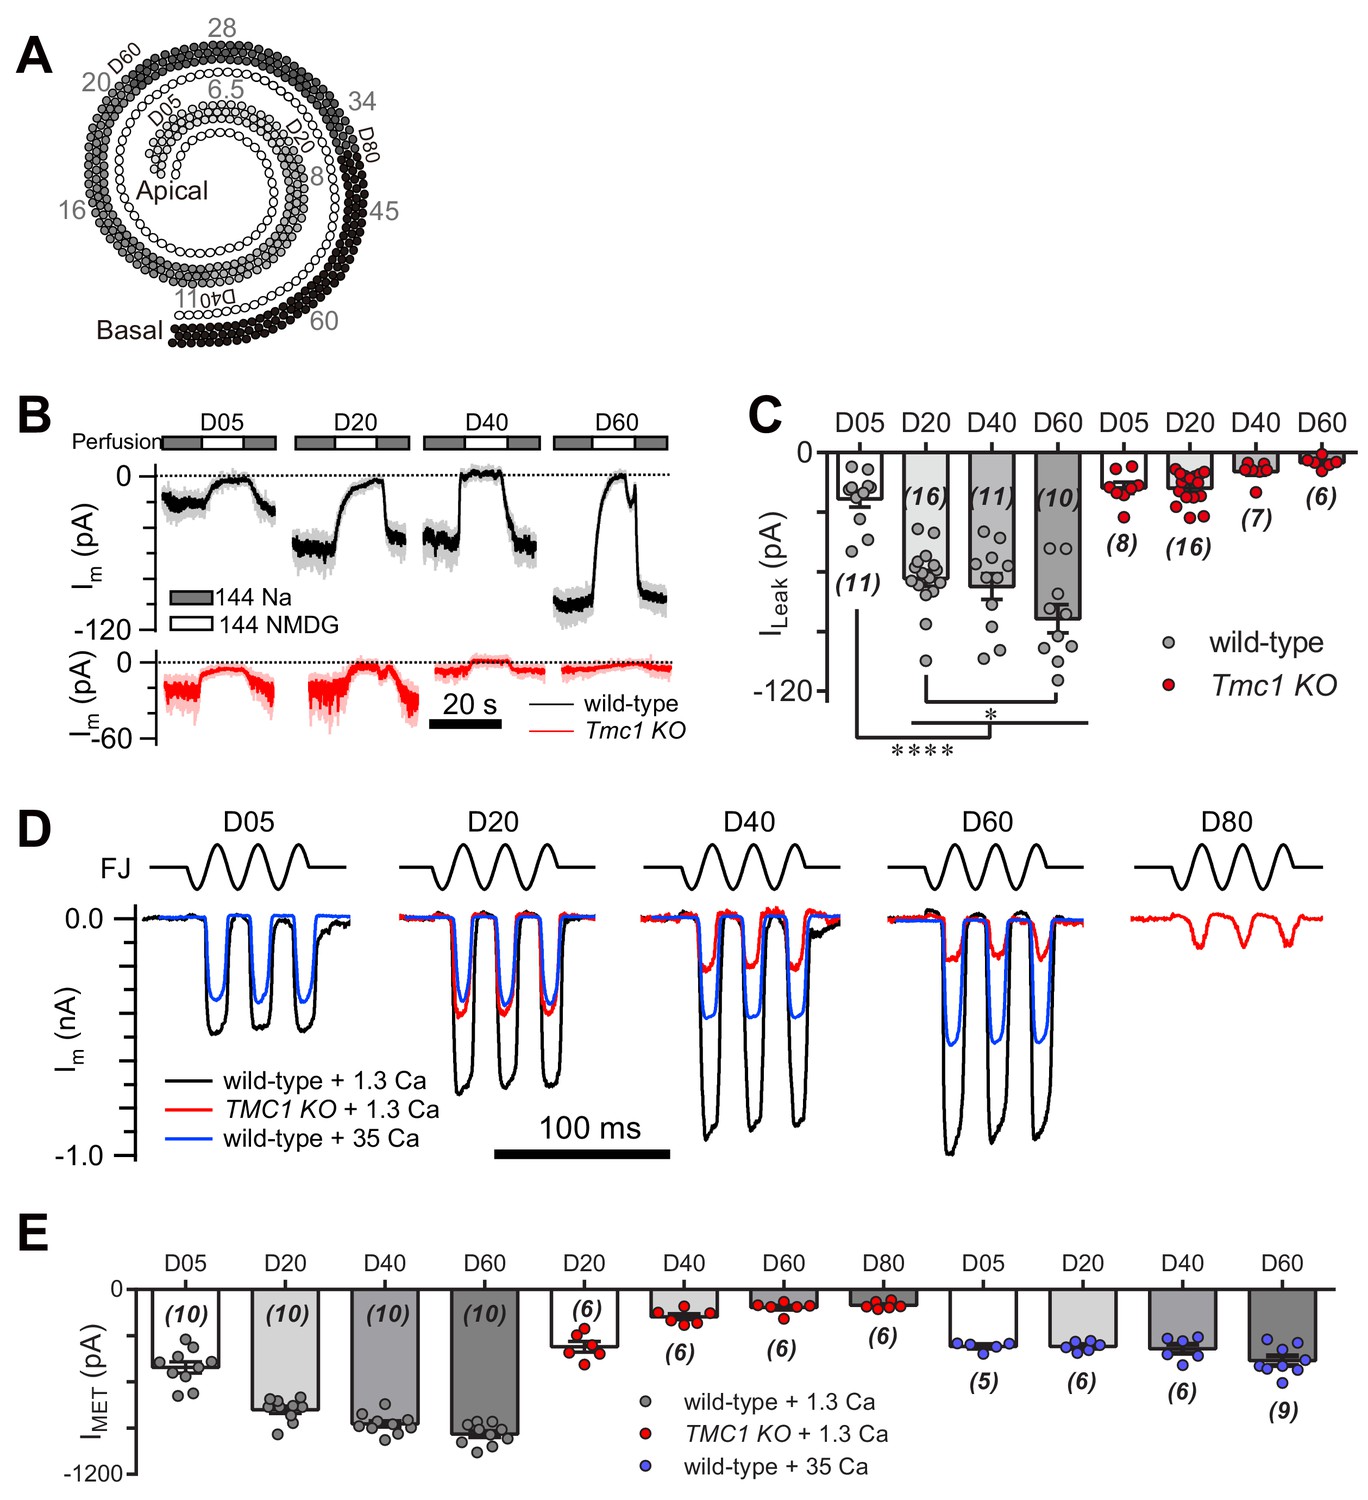
TMC1-mediated leak and MET currents in OHCs.
(A) Diagram showing the tonotopic map in mouse hair cells (adapted from Figure 1B in Kim and Fettiplace, 2013), labeled with response frequencies (kHz, gray) and location (D% to apex, black). The apex and base are defined as 0 and 1, with reference to which D05, D20, D40, D60, and D80 represent distances of 0.05, 0.2, 0.4, 0.6, and 0.8. (B) Representative traces of Im recorded in OHCs at different locations along the cochlear coil, from wild-type (black) and Tmc1-knockout (red) mice. The external solution contained 1.3 mM Ca2+. The apex and base are defined as 0 and 1, with reference to which D05, D20, D40, and D60 represent distances of 0.05, 0.2, 0.4, and 0.6. (C) Quantification of location-specific ILeak from similar recordings to those in (B). Values of ILeak in wild-type OHCs (pA): D05, –23 ± 4; D20, –63 ± 4; D40, –67 ± 7; D60, –84 ± 7. ILeak values in Tmc1-knockout OHCs (pA): D05, –18 ± 3; D20, –18 ± 2; D40, –10 ± 2; D60, –5 ± 1. (D) Representative traces of location-specific MET current in wild-type OHCs when bathed in 1.3 mM or 35 mM Ca2+ and Tmc1-knockout OHCs when bathed in 1.3 mM Ca2+. A sinusoidal deflection was applied to the hair bundle by a fluid jet. (E) Quantification of location-specific macroscopic MET current. Values of IMET in wild-type OHCs in 1.3 mM Ca2+ (pA): D05, –505 ± 37 pA; D20, –780 ± 24 pA; D40, –872 ± 21 pA; D80, –939 ± 22 pA. Values of IMET in wild-type OHCs in 35 mM Ca2+ (pA): D05, –369 ± 13 pA; D20, –369 ± 13 pA; D40, –384 ± 30 pA; D60, –461 ± 31 pA. Values of IMET in Tmc1-knockout OHCs in 1.3 mM Ca2+ (pA): D20, –371 ± 35 pA; D40, –177 ± 19 pA; D60, –117 ± 15 pA; D80, –102 ± 9 pA. The holding potential was −70 mV. In (C) and (E), data are presented as mean ± SEM with N values. *p<0.05, **p<0.01, ***p<0.001, ANOVA.
-
Figure 8—source data 1
TMC1-mediated leak and MET currents in OHCs.
- https://doi.org/10.7554/eLife.47441.023
Figure 8—figure supplement 1
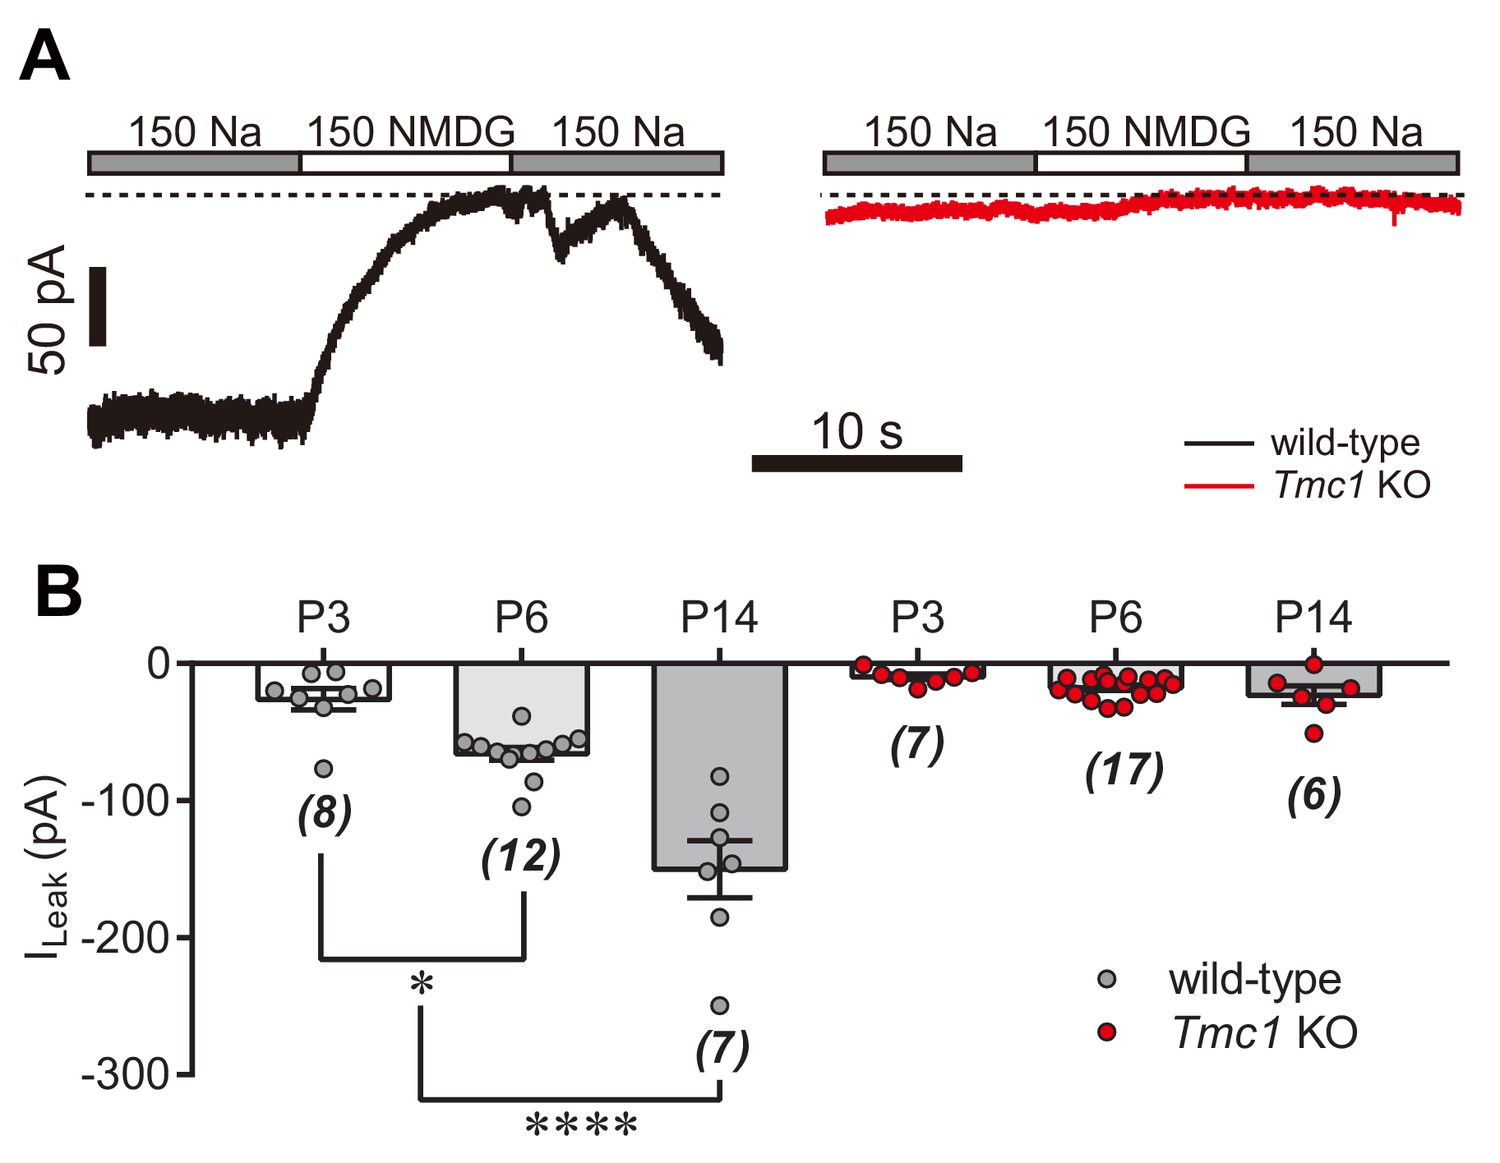
TMC1-dependent background leak current in ageing hair cells.
(A) Representative Im traces in whole-cell voltage-clamp recorded OHCs from P14 wild-type and Tmc1-knockout mice. (B) Quantification of ILeak recorded from P3, P6, and P14 OHCs under conditions similar to those in (A). ILeak values (pA) for wild-type: P3, –26 ± 8; P6, –66 ± 5; P14, –150 ± 21. For Tmc1-knockout: P3, –10 ± 2; P6, –18 ± 2; P14, –23 ± 7. The holding potential was −70 mV. Data are presented as mean ± SEM and N values are shown in panel B. *p<0.05, **p<0.01, ***p<0.001, ANOVA.
-
Figure 8—figure supplement 1—source data 1
TMC1-dependent background leak current in ageing hair cells.
- https://doi.org/10.7554/eLife.47441.024
Figure 9
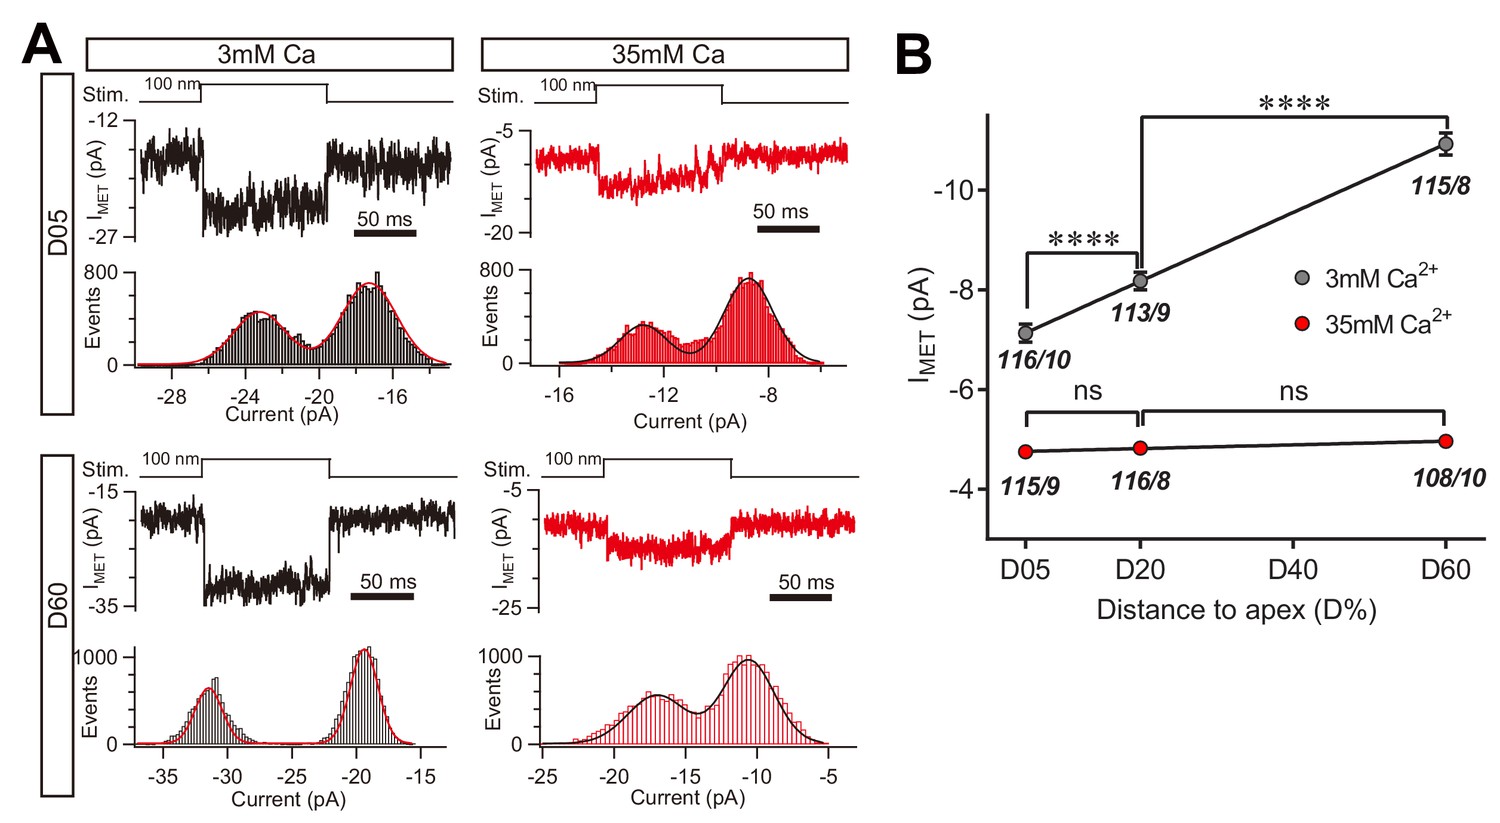
High Ca2+ removes the MET conductance gradient as revealed by unitary channel analysis.
(A) Location-specific single MET channel recording from wild-type OHCs in solution with 3 mM or 35 mM Ca2+ at D05 or D60. The traces were chosen to show nice dual-peak fitting but did not represent normal flickers. A 100 nm step deflection was applied to the hair bundle by a glass probe. (B) Statistical analysis of location-specific unitary MET channel current. Values of unitary IMET in 3 mM Ca2+: D05, –7.0 ± 0.2 pA; D20, –7.9 ± 0.2 pA; D60, –10.6 ± 0.2 pA. Values of IMET in 35 mM Ca2+: D05, –4.7 ± 0.1 pA; D20, –4.8 ± 0.1 pA; D60, –4.9 ± 0.1 pA. The holding potential was −70 mV. N values are shown as events/cells. Data are presented as mean ± SEM. *p<0.05, **p<0.01, ***p<0.001, ANOVA.
-
Figure 9—source data 1
High Ca2+ removes the MET conductance gradient as revealed by unitary channel analysis.
- https://doi.org/10.7554/eLife.47441.026
Author response image 1

Author response image 2
Tables
Key resources table
| Reagent type (species) or resource | Designation | Source or reference | Identifiers | Additional information |
|---|---|---|---|---|
| Gene (Mus musculus) | TMC1 | NCBI ID: 13409 | ||
| Gene (Mus musculus) | TMC2 | NCBI ID:192140 | ||
| Gene (Mus musculus) | Lhfpl5 | NCBI ID: 328789 | ||
| Strain, strain background (Mus musculus) | C57BL6 | Vitalriver | ||
| Genetic reagent (Mus musculus) | C57BL6 TMC1 knockout | MGI: J:184419 | Griffith AJ etc. | From JAX |
| Genetic reagent (Mus musculus) | C57BL6 TMC2 knockout | MGI: J:184419 | Griffith AJ etc. | From JAX |
| Genetic reagent (Mus musculus) | C57BL6 Lhfpl5 knockout | MGI: J:98396 | Johnson KR etc. | From JAX |
| Antibody | Chicken anti-GFP | aveslab | RRID:AB_10000240 | Cat:GFP-1020 (1:1000) |
| Antibody | Anti-mouse HA Clone 16B12 | Biolegend | RRID:AB_2565335 | Cat:901513 (1:500) |
| Antibody | Alexa FluroTM 488 goat anti-chicken IgG(H+L) | Invitrogen | RRID:AB_142924 | Cat: A-11039 Lot:1937504 (1:2000) |
| Antibody | Alexa FluroTM 568 goat anti-mouse IgG(H+L) | Invitrogen | RRID:AB_2534072 | Cat: A-11004 Lot:2014175 (1:1000) |
| Sequence-based reagent | TMC1-DF-F | Ruibio Tech | This paper | 5’:tgagattaacaacaaggaat tcgtgcgtctcaccgttt |
| Sequence-based reagent | TMC1-DF-R | Ruibio Tech | This paper | 5’:tgagacgcacgaattcctt gttgttaatctcatccatcaaggc |
| Sequence-based reagent | mTMC1-G411C-F | Ruibio Tech | This paper | 5’: aatgtccctcctgTGTatgtt ctgtcccaccctgtttga |
| Sequence-based reagent | mTMC1-G411C-R | Ruibio Tech | This paper | 5’:ACAcaggagggacattacc atgttcatttcatttttttcccacca |
| Sequence-based reagent | mTMC1-M412C-F | Ruibio Tech | This paper | 5’:gtccctcctggggTGTttc tgtcccaccctgtttgactt |
| Sequence-based reagent | mTMC1-M412C-R | Ruibio Tech | This paper | 5’:ACAccccaggagggacatt accatgttcatttcatttttttccca |
| Sequence-based reagent | mTMC1-N447C-F | Ruibio Tech | This paper | 5’:tcttcttctaggcTGTttg tatgtattcattctcgcctt |
| Sequence-based reagent | mTMC1-N447C-R | Ruibio Tech | This paper | 5’:ACAgcctagaagaaga gcaaaaatgcgccccaggag |
| Sequence-based reagent | mTMC1-D528C-F | Ruibio Tech | This paper | 5’:tctcaccgtttctTGTgtcct gaccacttacgtcacgat |
| Sequence-based reagent | mTMC1-D528C-R | Ruibio Tech | This paper | 5’:ACAagaaacggtgagacgc acgaattcctgccccaccattgtttc |
| Sequence-based reagent | mTMC1-T532C-F | Ruibio Tech | This paper | 5’:tgacgtcctgaccTGTta cgtcacgatcctcattggcga |
| Sequence-based reagent | mTMC1-T532C-R | Ruibio Tech | This paper | 5’:ACAggtcaggacgtcaga aacggtgagacgcacgaattc |
| Sequence-based reagent | mTMC1-D569C-F | Ruibio Tech | This paper | 5’:atacacagaattcTGT atcagtggcaacgtcctcgctct |
| Sequence-based reagent | mTMC1-D569C-R | Ruibio Tech | This paper | 5’:ACAgaattctgtgtatgaag gatatccatattctaagtcccagca |
| Chemical compound, drug | Dihydrostreptomycin sulfate | HarveyBio | Cat: HZB1169-1 | |
| Chemical compound, drug | d-Tubocurarine | TCI | Cat: C0433 | |
| Chemical compound, drug | Amiloride | Cayman | Cat: 21069 | |
| Chemical compound, drug | MTSET | Cayman | Cat: 21069 | |
| Chemical compound, drug | GdCl3 | Sigma | Cat: 439770–5G | |
| Chemical compound, drug | LaCl3 | Sigma | Cat: 298182–10G | |
| Chemical compound, drug | CoCl2 | Sigma | Cat: 60818–50G | |
| Chemical compound, drug | ZnCl2 | Sigma | Cat: 793523–100G | |
| Chemical compound, drug | MgCl2 | Sigma | Cat: M8266-100G | |
| Chemical compound, drug | CaCl2 | Sigma | Cat: 746495–100G | |
| Chemical compound, drug | CsCl | Sigma | Cat:C3139-25G | |
| Chemical compound, drug | KCl | Sigma | Cat:P9333-500G | |
| Chemical compound, drug | NaCl | Sigma | Cat:S7653-1KG | |
| Chemical compound, drug | NaOH | Sigma | Cat:S8045-500G | |
| Chemical compound, drug | KOH | Sigma | Cat:306568–100G | |
| Chemical compound, drug | CsOH | Sigma | Cat:C8518-10G | |
| Chemical compound, drug | BAPTA Tetrasodium salt hydrate | Bioruler | Cat: RH100017-1g | |
| Chemical compound, drug | EGTA | Sigma | Cat: 03780 | |
| Software, algorithm | Igor 6 | WaveMetrics, Inc | ||
| Software, algorithm | Micro-manager 1.4 | micro-manager.org | ||
| Software, algorithm | HEKA patchmaster | HEKA | ||
| Software, algorithm | Matlab 2014 | MathWorks | ||
| Software, algorithm | Prism GraphPad 6 | GraphPad Software. | ||
| Other | HEKA whole cell recording amplifier | HEKA | Order Number: 895273 | |
| Other | Micromanipulator | Sensapex | Cat:uMp-3 |
Additional files
-
Supplementary file 1
Primers used for generating desired truncation and mutations in mouse Tmc1 cDNA.
Specific primers were designed for PCR of the Tmc1-deafness vector and amino-acid-substituted Tmc1 constructs, based on the pCDNA3.1 vector containing mouse Tmc1 cDNA. DF, deafness; F, forward; R, reverse.
- https://doi.org/10.7554/eLife.47441.027
-
Transparent reporting form
- https://doi.org/10.7554/eLife.47441.028
Download links
A two-part list of links to download the article, or parts of the article, in various formats.
Downloads (link to download the article as PDF)
Open citations (links to open the citations from this article in various online reference manager services)
Cite this article (links to download the citations from this article in formats compatible with various reference manager tools)
TMC1 is an essential component of a leak channel that modulates tonotopy and excitability of auditory hair cells in mice
eLife 8:e47441.
https://doi.org/10.7554/eLife.47441


