Rapid decline of bacterial drug-resistance in an antibiotic-free environment through phenotypic reversion
- Hungarian Academy of Sciences, Hungary
- University of Szeged, Hungary
Figures
Figure 1 with 1 supplement
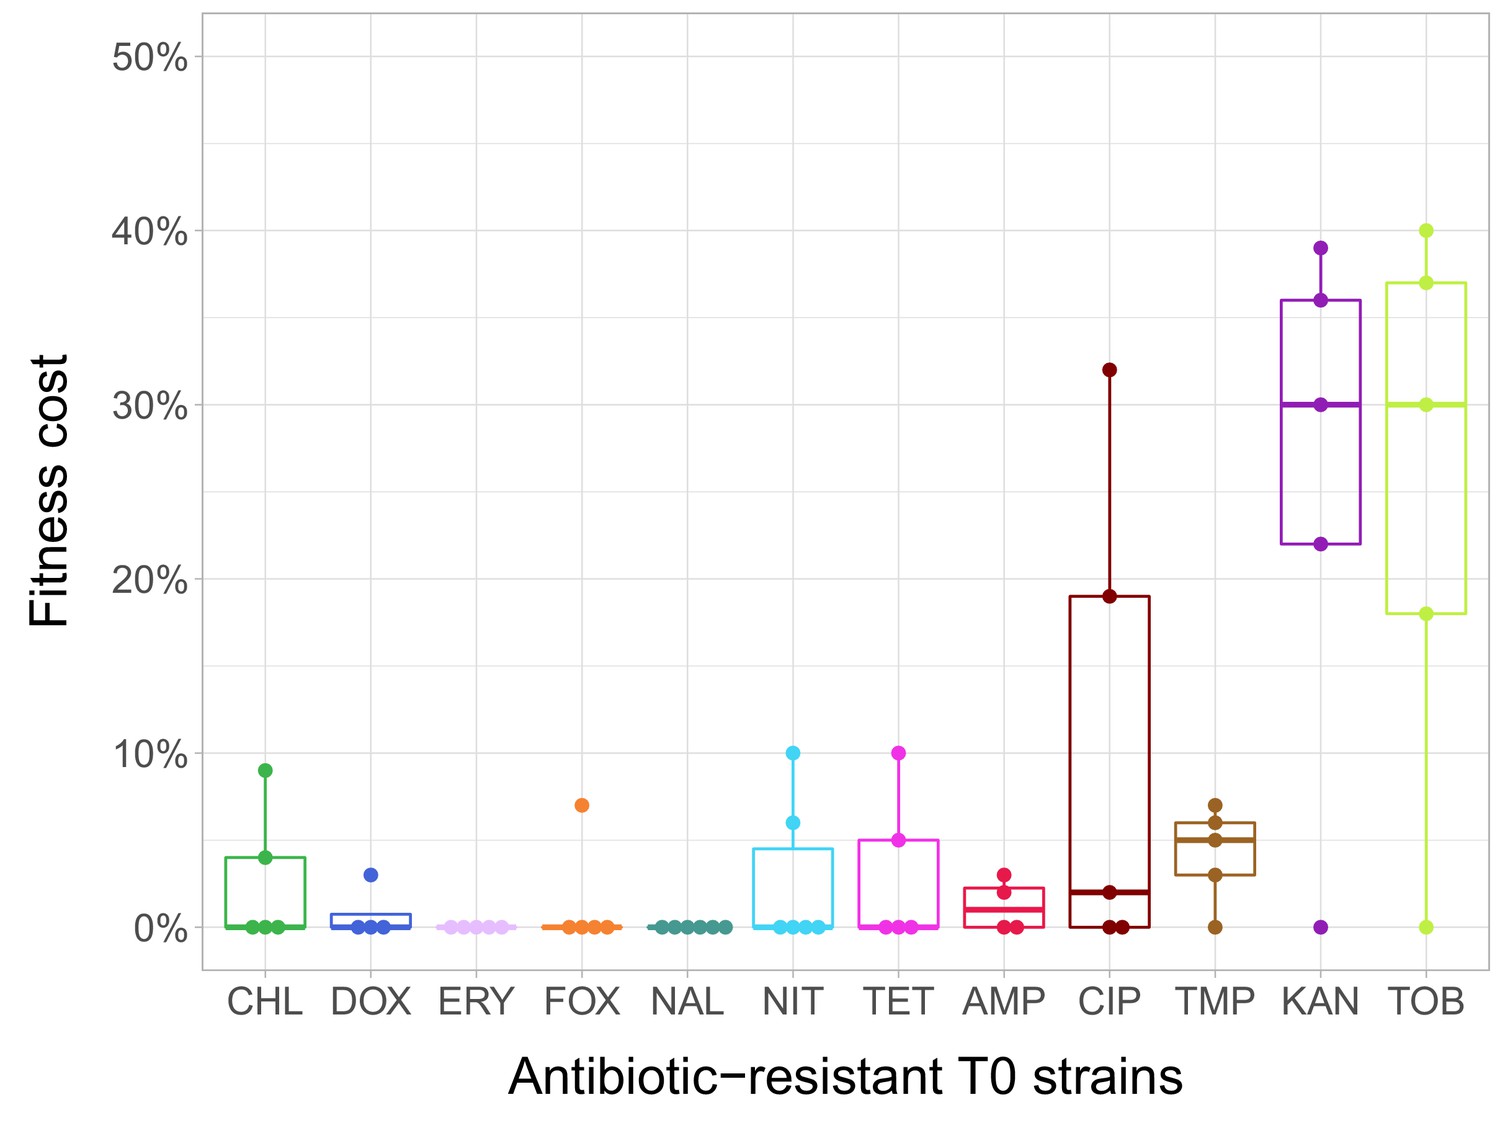
Fitness cost of antibiotic-resistant T0 strains.
The fitness of each strain was measured as the area under the bacterial growth curve recorded in an antibiotic-free medium. Fitness cost was calculated from the absolute fitness of T0 and wild-type strains using the following equation: 1-WT0/Wwild-type, where WT0 and Wwild-type indicate fitness of the T0 and wild-type strains, respectively. Strains adapted to two aminoglycosides – kanamycin (KAN) and tobramycin (TOB) – generally exhibit an especially high fitness cost, while adaptation to erythromycin (ERY) and nalidixic acid (NAL) evoked no measurable fitness cost. For all further analyses only the T0 strains exhibiting a significant fitness cost were used. For antibiotic abbreviations, see Table 1. Boxplots show the median, first and third quartiles, with whiskers showing the 5th and 95th percentiles of the fitness cost per antibiotic. Individual data points represent the median of three biological replicates (five technical measurements) for each of the 60 antibiotic-resistant strains (4–6 strain per antibiotic). Source file is available as Figure 1—source data 1.
-
Figure 1—source data 1
Initial fitness cost of the T0 antibiotic-resistant strains.
Used to create the following figure: Figure 1.
- https://doi.org/10.7554/eLife.47088.005
Figure 1—figure supplement 1
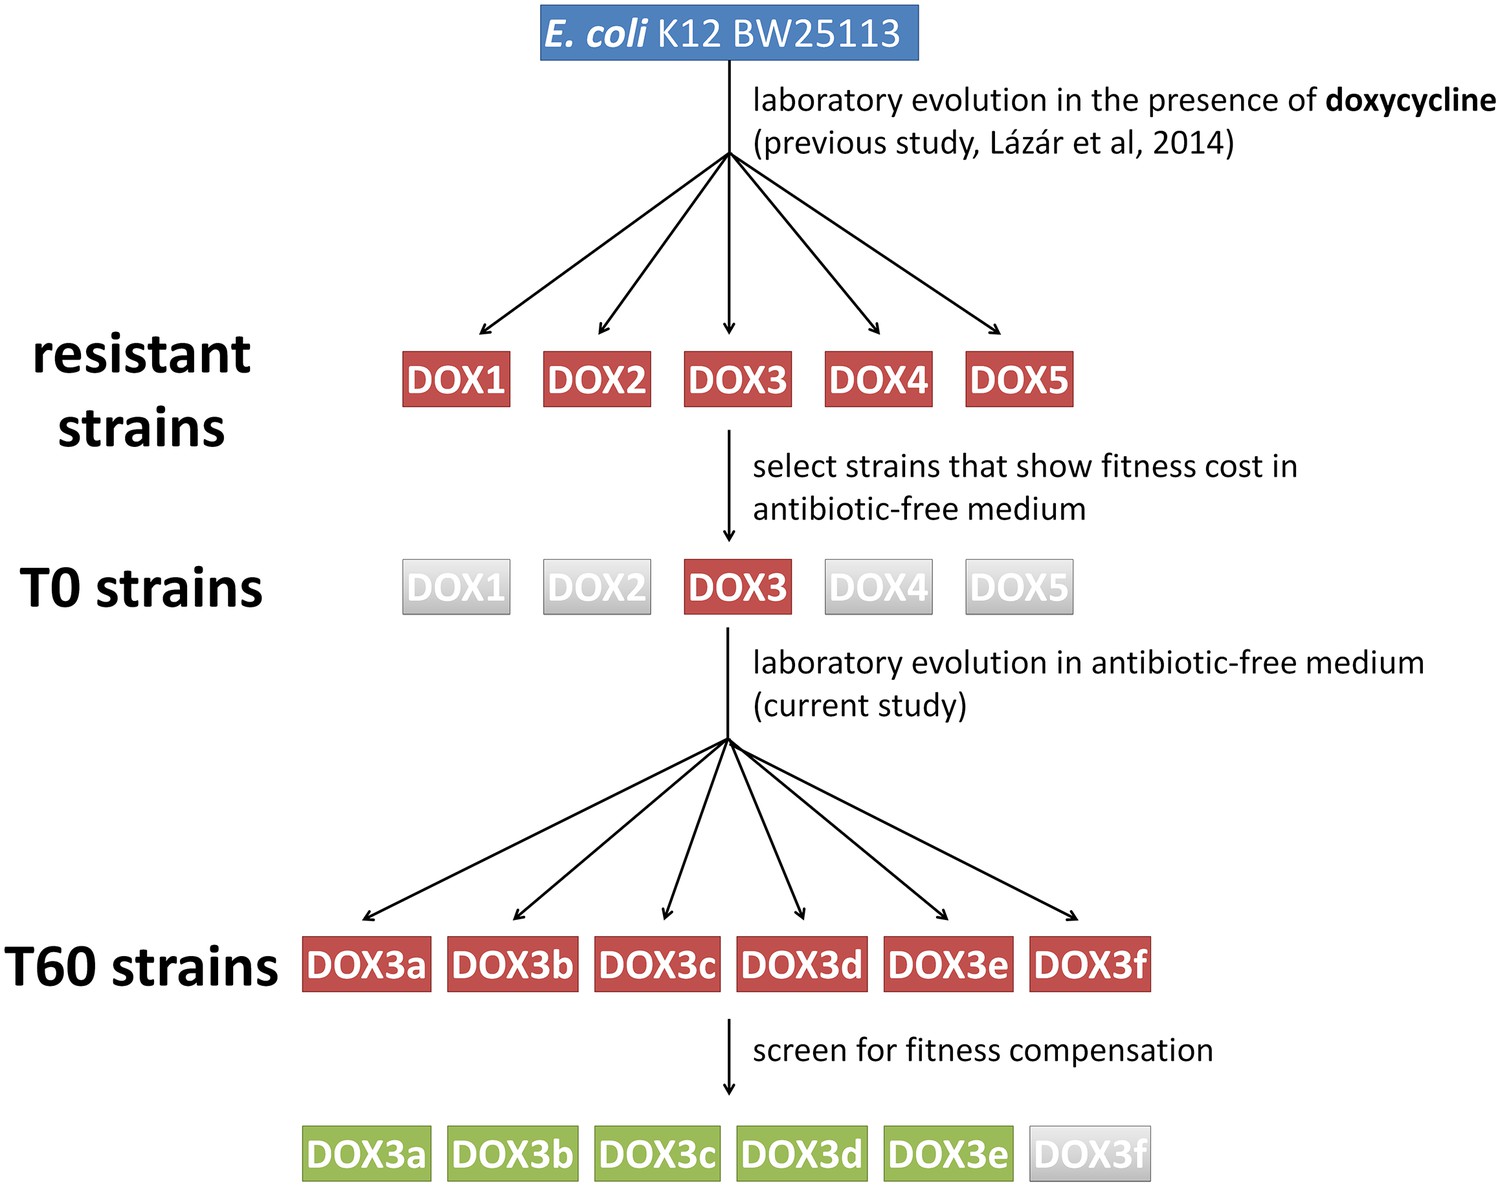
Schematic outline of the evolutionary experiments.
In our previous study (Lázár et al., 2014) we obtained 60 drug-resistant strains by adapting the Escherichia coli K12 BW25113 strain to increasing dosages of one of 12 antibiotics (see Table 1.). The figure depicts one representative example where we adapted the wild type strain to doxycycline (DOX) using five parallel evolving lines (DOX1-2-3-4-5). By screening the resistant strains, we selected only those (e.g. DOX3) that displayed significant fitness cost in antibiotic-free medium compared to the wild-type. We coined these strains T0. We initiated evolutionary experiments with T0 strains in the absence of antibiotic (six parallel populations per antibiotic-resistant strain, for example DOX3a-b-c-d-e-f). Detailed phenotypic and molecular analyses were performed only on those T60 lines that showed significant fitness compensation (green boxes).
Figure 2
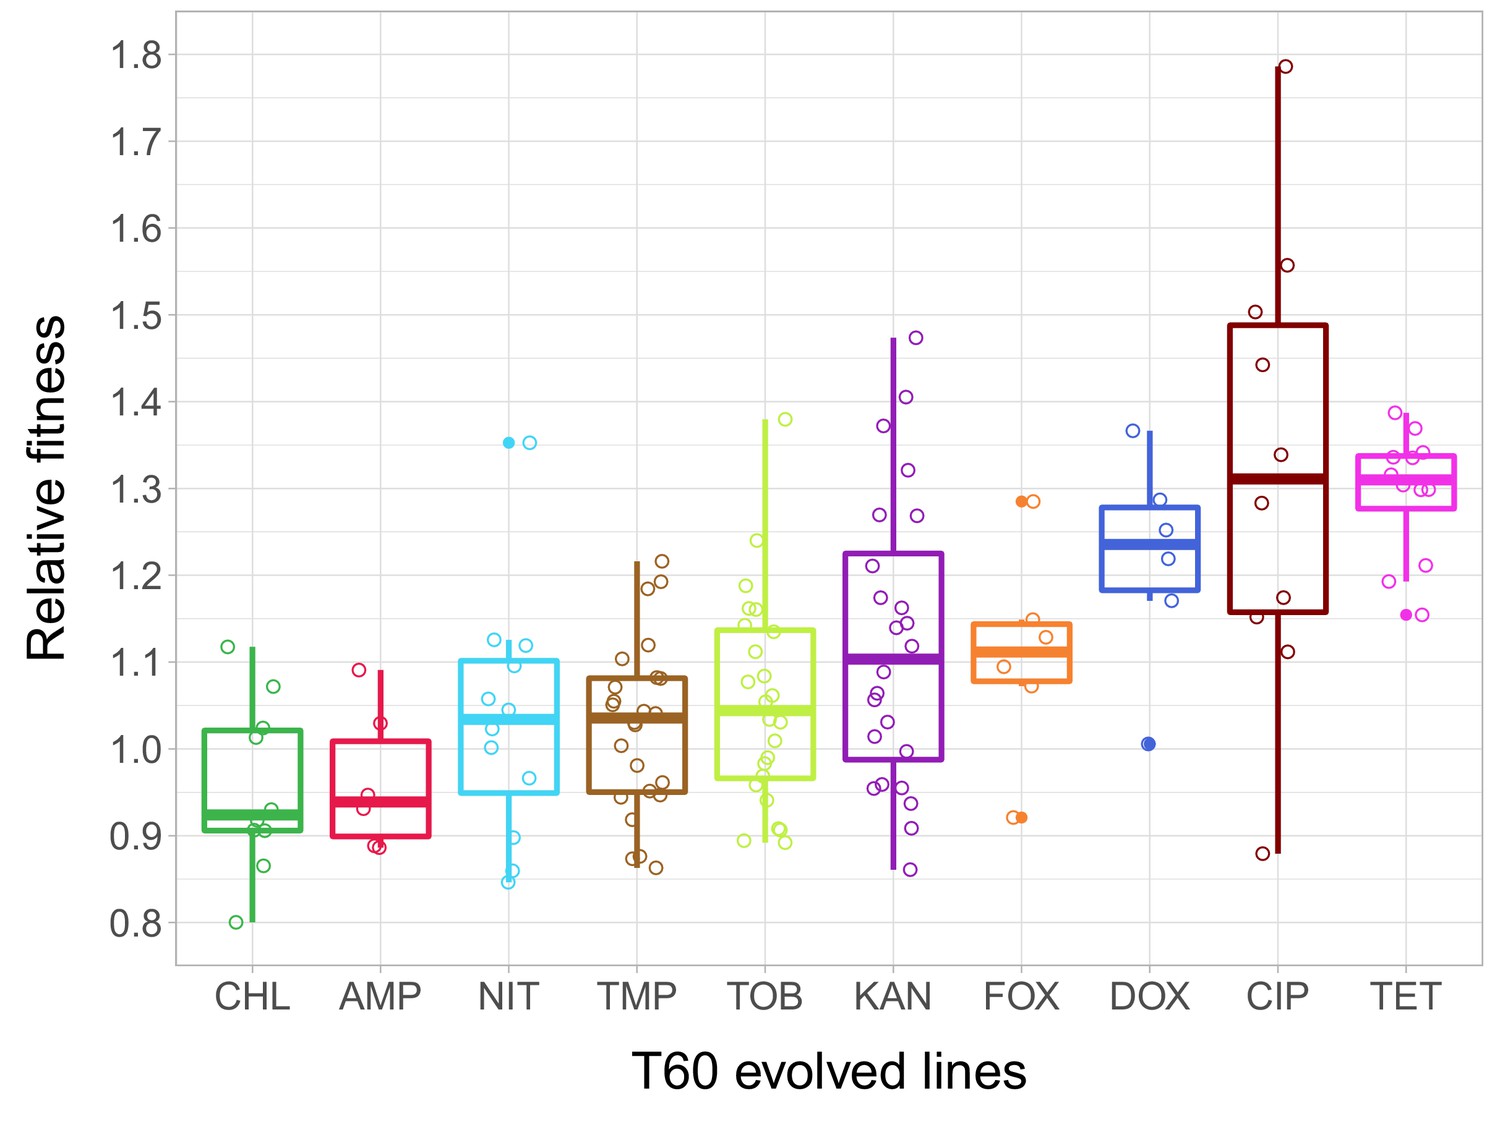
Relative fitness of the T60 evolved lines.
The figure shows the relative fitness of 6 parallel lines of 23 antibiotic-adapted strains (T0) after laboratory evolution in an antibiotic-free medium. Relative fitness was calculated by normalizing the T60 fitness to the fitness of the corresponding T0 antibiotic-resistant strain. Fitness was measured as the area under the growth curve in an antibiotic-free medium. Relative fitness varied significantly across populations initially resistant to different antibiotics (N = 138, p<0.0001, Kruskal–Wallis test). For antibiotic abbreviations, see Table 1. Boxplots show the median, first and third quartiles, with whiskers showing the 5th and 95th percentiles of the relative fitness of all T60 evolved lines originally adapted to different antibiotics. Individual data points represent the median relative fitness of each of the 138 T60 evolved lines (3 biological and five technical replicates per each). Source file is available as Figure 2—source data 1.
-
Figure 2—source data 1
Fitness improvement reached following 60 day evolution in an antibiotic free environment.
Used to create the following figure: Figure 2.
- https://doi.org/10.7554/eLife.47088.007
Figure 3

Impact of compensatory evolution on antibiotic resistance level.
(A) The figure depicts minimum inhibitory concentrations (log10-scale) of T0 and the corresponding T60 strains. Each of the 195 points represents an antibiotic-strain combination; the colors denote different antibiotics. Points below the black line (x = y) indicates cases with a decrease in antibiotic resistance level after compensatory evolution. For antibiotic abbreviations, see Table 1. Source file is available as Figure 3—source data 1. (B) The figure depicts qualitative changes in resistance level across 195 tested antibiotic-T60 line combinations. Using the CLSI resistance break-point cut-offs, we categorized each T60 and the corresponding T0 strains as being resistant (R), intermediate (IM) or susceptible (S) to each investigated antibiotic. Arrows indicate whether the resistance level was maintained (e.g. R->R) or reduced (e.g. R->S) during the course of laboratory evolution in the antibiotic-free medium. The numbers of antibiotic-T60 line combinations in each category are indicated on the arrows. Source file is available as Figure 3—source data 1. (C and D) The figures show the number of T60 lines with resistance maintained/lost to the range of antibiotics tested, as absolute number (3C) versus ratio (3D), respectively. Doxycycline (DOX) and tetracycline (TET) resistance was frequently lost (Fisher’s Exact test: odds ratio = 0.05, p<0.001 for DOX and odds ratio = 0.20, p<0.01 for TET), while aminoglycoside (kanamycin - KAN, tetracycline - TET) resistance was generally maintained in the T60 lines (Fisher’s Exact test: odds ratio = 14.29, p<0.001 for KAN, odds ratio = 6.5, p<0.01 for TOB). For antibiotic abbreviations, see Table 1. Source file is available as Figure 3—source data 1.
-
Figure 3—source data 1
Changes of cross-resistance interactions following 60 day evolution in an antibiotic free environment.
Used to create the following figures: Figure 3A, B and C, 3D.
- https://doi.org/10.7554/eLife.47088.009
Figure 4 with 1 supplement
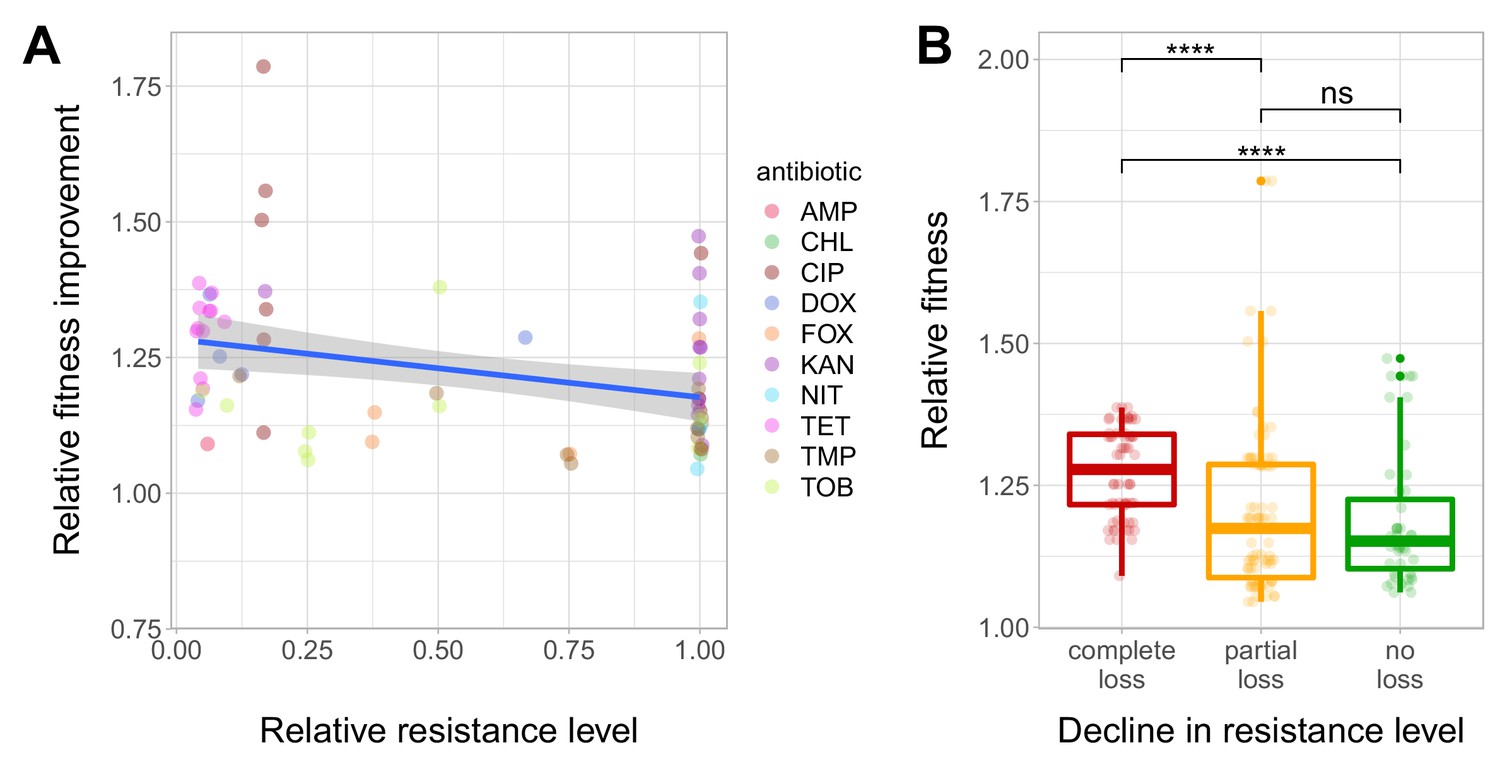
Fitness recovery and resistance loss after compensatory evolution.
(A) The scatterplot shows the relative resistance level and relative fitness improvement of individual T60 strains compared to the corresponding T0 strains (each data point is one strain, the colors indicate the antibiotic used in the analysis). Relative resistance was estimated by the minimum inhibitory concentration of the T60 line relative to that of the T0 line. There is a significant negative correlation between relative fitness improvement and relative resistance level (Spearman’s correlation test, ρ = −0.35, p=0.0031). Blue line with gray shaded area represents linear regression line with 95% confidence interval. For antibiotic abbreviations, see Table 1. Source file is available as Figure 4—source data 1. (B) Resistance loss as a function of relative fitness in antibiotic-free environment. The T60 strains were classified into three main categories based on their resistance-profiles: the resistance level declined against all tested antibiotics (complete), declined towards at least one antibiotic (partial), or the resistance level was maintained (no). Using the CLSI resistance break-point cut-offs (CLSI Approved Standard M100, 29th Edition), we categorized each T60 and the corresponding T0 strains as being resistant (R), intermediate (IM) or susceptible (S) to each investigated antibiotic. A decline in resistance was defined by transitions R->IM, R->S or IM->S. We observed a significant association between the relative fitness in the antibiotic-free medium and the decline in resistance level (Mann-Whitney U-test: **** indicates p<0.0001, ns indicates that the p value is non-significant). Boxplots show the median, first and third quartiles, with whiskers showing the 5th and 95th percentiles. Source file is available as Figure 4—source data 1.
-
Figure 4—source data 1
Fitness recovery and resistance loss after compensatory evolution.
Figure 4—source data 1 was used to create the following figures: Figure 4A, 4B and Figure 4—figure supplement 1.
- https://doi.org/10.7554/eLife.47088.012
Figure 4—figure supplement 1
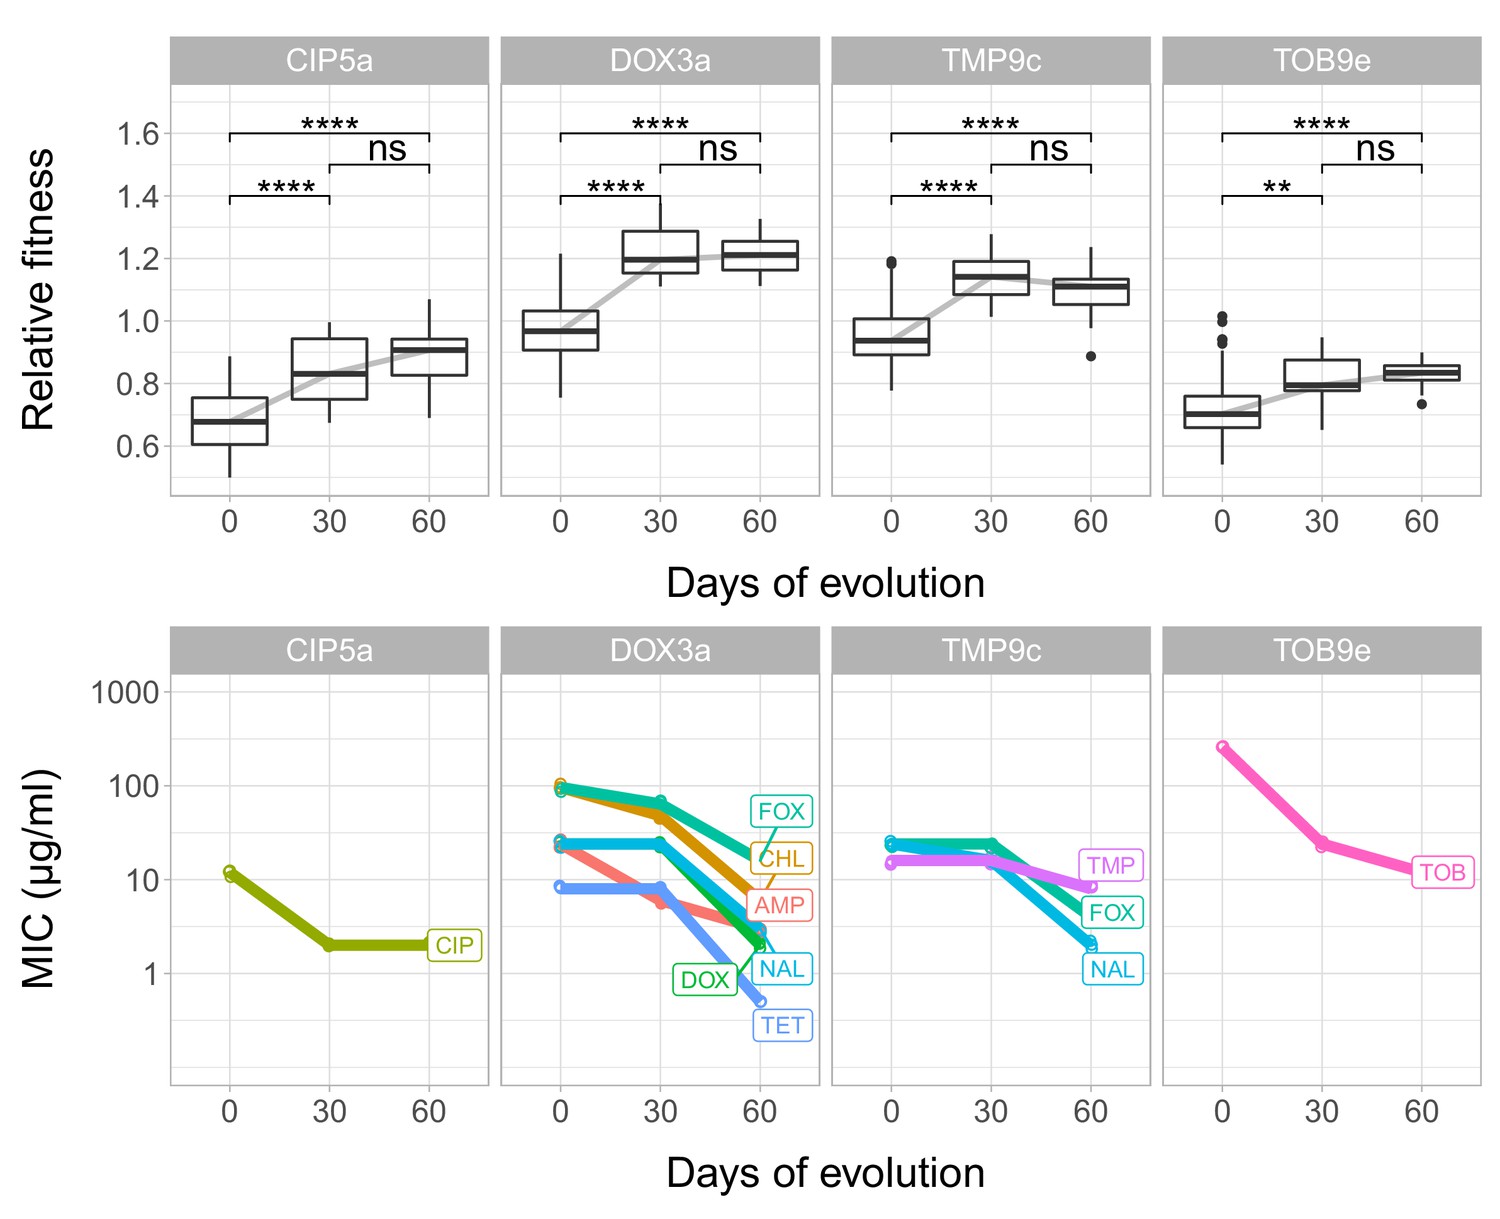
Fitness and resistance changes during laboratory evolution.
Each panel depicts a given T60 strain founded from ciprofloxacin- (CPR5a), doxycycline- (DOX3a) and tobramycin- (TOB9e) resistant lines. The top row depicts the changes in relative fitness across time points (0, 30, 60 days); the bottom row depicts changes in minimum inhibitory concentrations (MIC, y axis is transformed to log10-scale). MICs against different antibiotics are color-coded and labeled. MICs for different antibiotics were determined three times for each line at each time point (0, 30, 60 days), and we found no variation across replicates of the same combination. Boxplots show the median, first and third quartiles, with whiskers showing the 5th and 95th percentiles. ****/** indicates p<0.0001/0.01, ns indicates that the p value is non-significant (Mann Whitney U-test). We found that at certain time points, decline in resistance and fitness recovery are coupled to each other. Source file is available as Figure 4—source data 1.
Figure 5 with 2 supplements
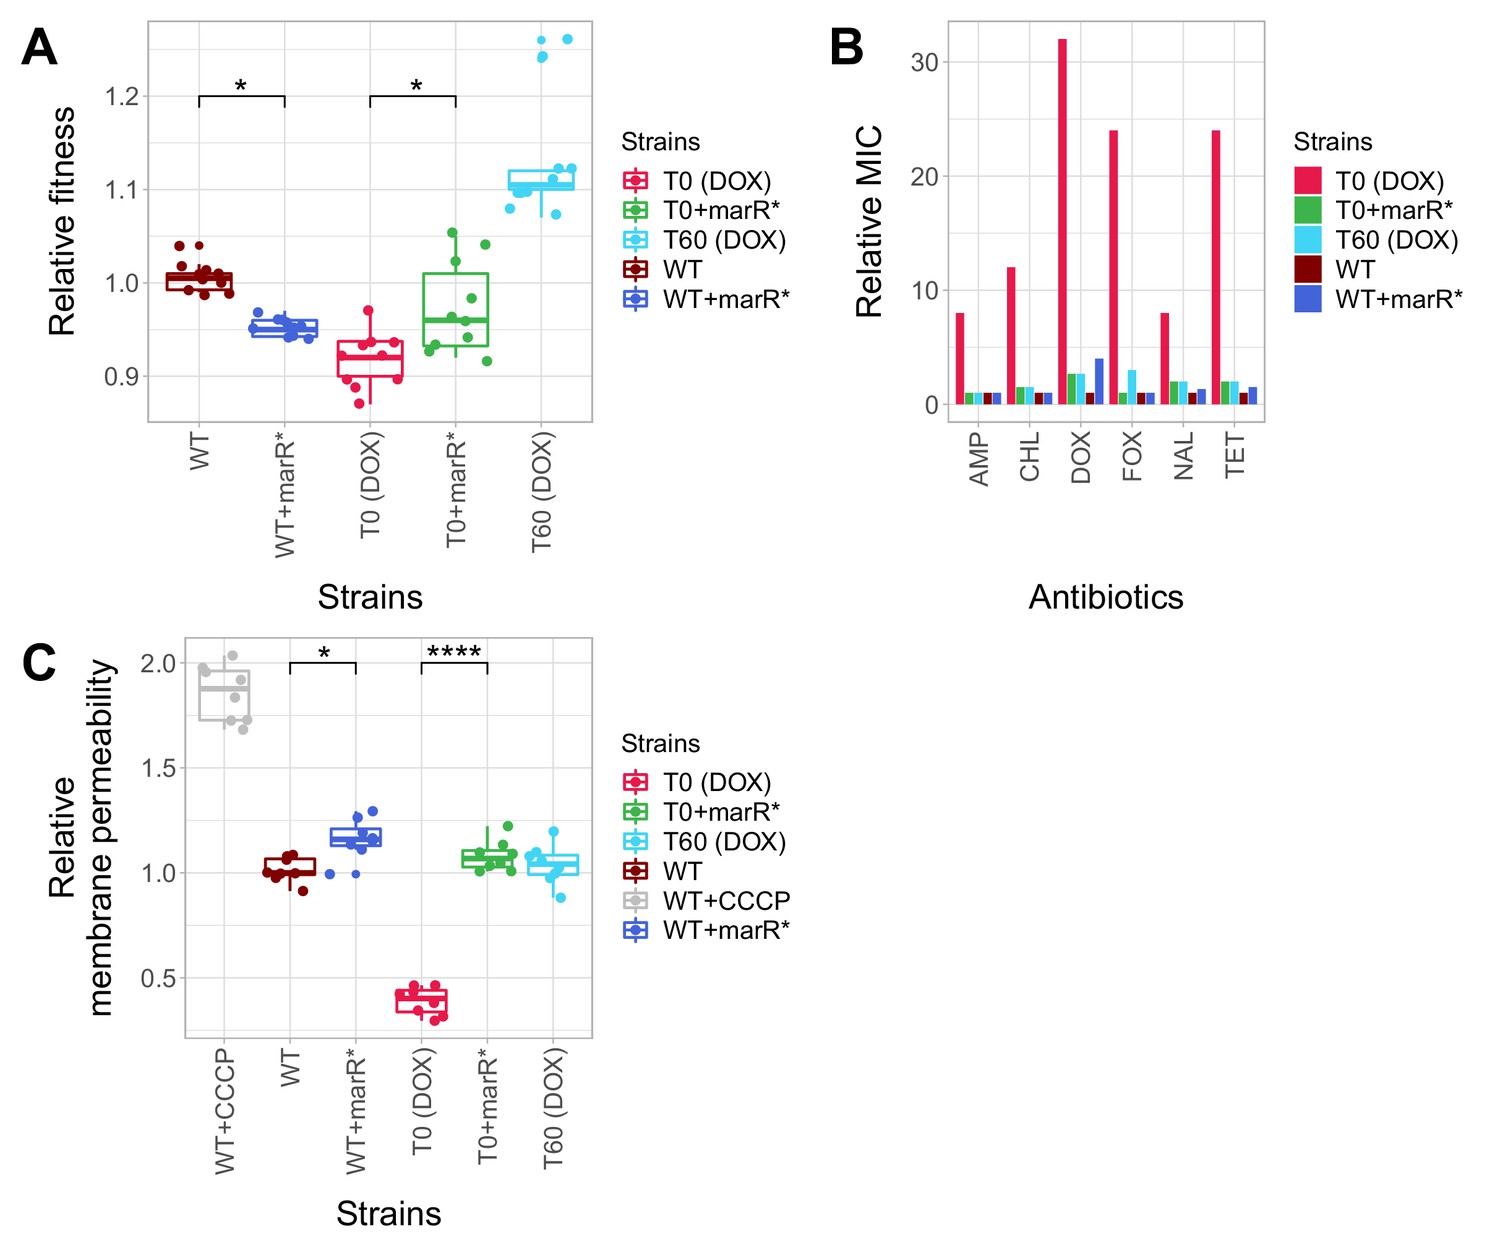
Phenotypic effects of a compensatory mutation in the marR promoter region.
The figure shows the (A) relative fitness, (B) relative resistance level and (C) Relative Hoechst probe accumulation (a proxy of membrane permeability) in the doxycycline-resistant T0 and the corresponding T60 strain harboring a compensatory mutation in the marR promoter region (marR*). Additionally, marR* was introduced into the wild-type and T0 genetic backgrounds as well, yielding WT + marR* and T0 + marR* strains, respectively. (A) Fitness was measured as the area under the growth curve in an antibiotic-free medium, and was normalized to wild-type fitness. Boxplots show the median, first and third quartiles, with whiskers showing the 5th and 95th percentiles (2 biological and five technical replicates per each genotype). We observed a significant variation in relative fitness across the strains (Tukey’s post-hoc multiple comparison tests, * indicates p<0.05). Source file is available as Figure 5—source data 1. (B) Resistance level of all five strains against six antibiotics. Minimum inhibitory concentration (MIC) was measured by the standard E-test assay, and was normalized to that of the wild-type strain. Only the T0 strain can be considered resistant to each antibiotic tested according to the CLSI resistance break-point cut-off. Source file is available as Figure 5—source data 1. (C) Membrane permeability across five strains. Membrane permeability was estimated by measuring the intracellular accumulation of a fluorescent probe (Hoechst 33342) in eight biological replicates per each strain or condition. Intracellular accumulation of the probe in the corresponding strains was normalized to that of the wild-type strain. Wild-type cells treated with a protonophore chemical agent (carbonyl cyanide m-chlorophenyl hydrazone, CCCP) served as a positive control, displaying an 88% larger membrane permeability value compared to that of the non-treated wild-type strain. T0 showed an exceptionally low level of Hoechst-dye accumulation compared to all other strains studied, while T0 + marR* displayed a 166% larger membrane permeability value compared to that of the T0 strain (Tukey’s post-hoc multiple comparison tests: **** indicates p<0.0001). Boxplots show the median, first and third quartiles, with whiskers showing the 5th and 95th percentiles. Source file is available as Figure 5—source data 1.
-
Figure 5—source data 1
Relative fitness, relative MIC and relative Hoechst-dye accumulation of reconstructed mutant strains.
Figure 5—source data 1 was used to create the following figures: Figure 5A, B and C and Figure 5—figure supplement 2A and B.
- https://doi.org/10.7554/eLife.47088.016
Figure 5—figure supplement 1
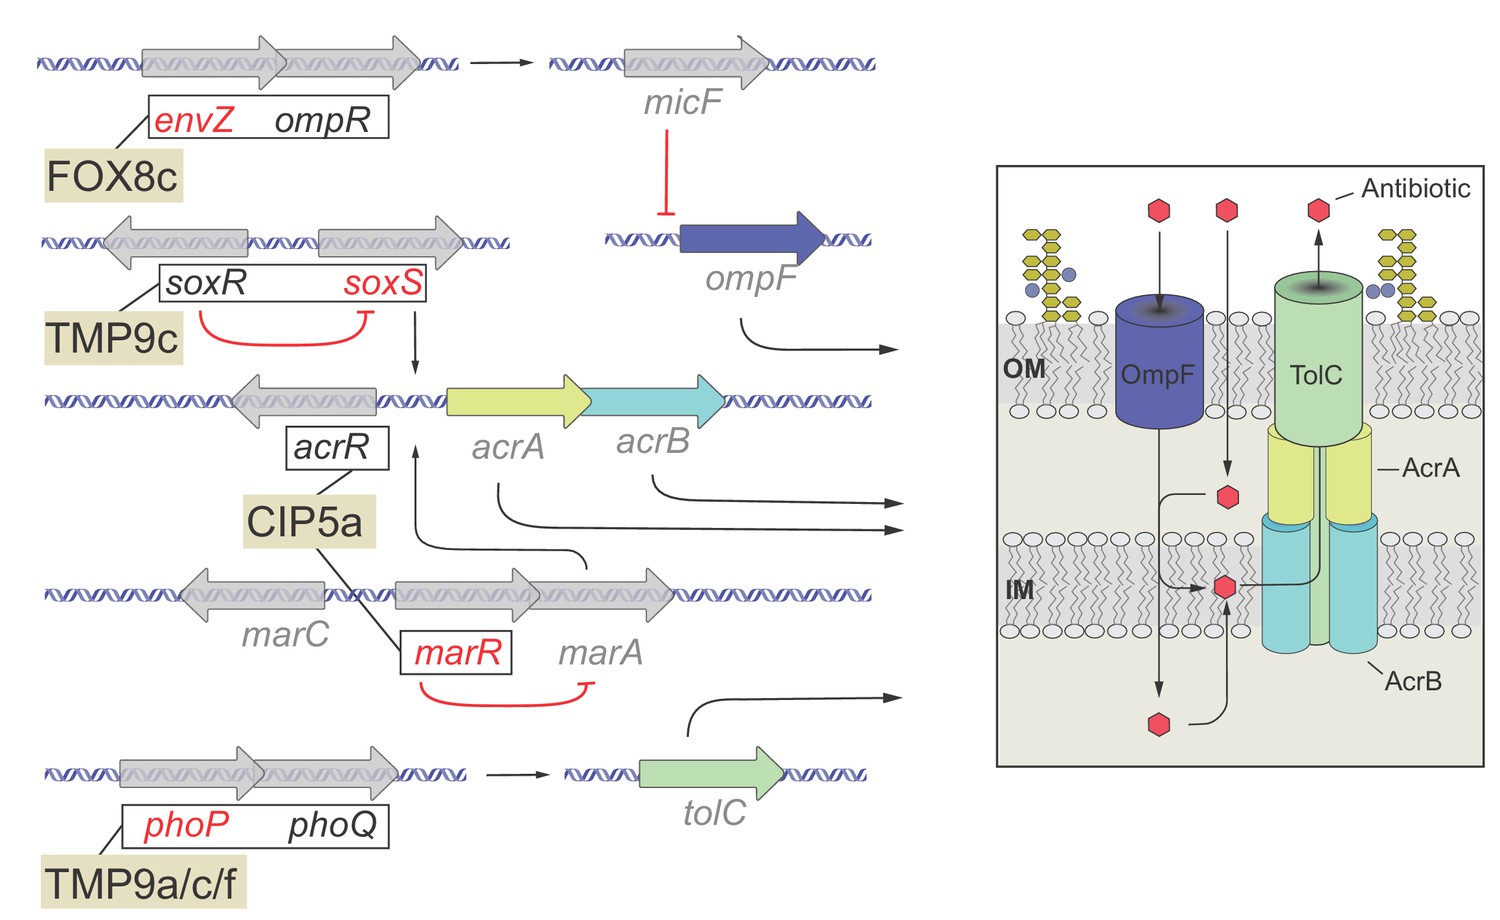
Functional relationship of resistance-conferring and compensatory mutations in representative evolved lines.
The figure depicts the functional relationship of selected T0 and T60 mutations in certain evolved lines. The genes are color-coded: gene names in black are mutated only in T0, gene names in red are mutated only in the T60, while gene names in gray are not mutated either in T0 or T60 and used only for illustrative purposes. Mutations found in genes with established functional relationship are connected with black lines within evolved lines (FOX8c, TMP9c, CIP5a, TMP9a/c/f). Connection between ompR-EnvZ (FOX8b): A cefoxitin-resistant T0 line carries a resistance-conferring mutation in the transcriptional regulatory protein OmpR. OmpR modulates the expression of major outer membrane protein genes, and forms a two-component regulatory system with the sensory histidine kinase EnvZ, a protein mutated in the corresponding T60 line. Connection between PhoQ/SoxR – PhoP/SoxS (TMP9c): A trimetoprim-resistant T0 lines carries a mutation in the sensory histidine kinase PhoQ and the redox–sensitive transcriptional activator SoxR, whereas the T60 line carried compensatory mutations in genes phoP (response regulator in two–component regulatory system with PhoQ) and soxS (superoxide response regulon transcriptional activator). Connection between AcrR-MarR (CIP5a): Mutation in the transcriptional repressor AcrR most likely confers ciprofloxacin-resistance in T0 through activating the AcrA/AcrB/TolC multidrug-efflux system, while a compensatory mutation appeared in MarR, that controls the activity of the mar regulon. The mar regulon is responsible for regulating several genes involved in antibiotic-resistance, including those that encode components of the AcrA/AcrB/TolC multidrug-efflux system. Source file is available as Supplementary file 1.
Figure 5—figure supplement 2
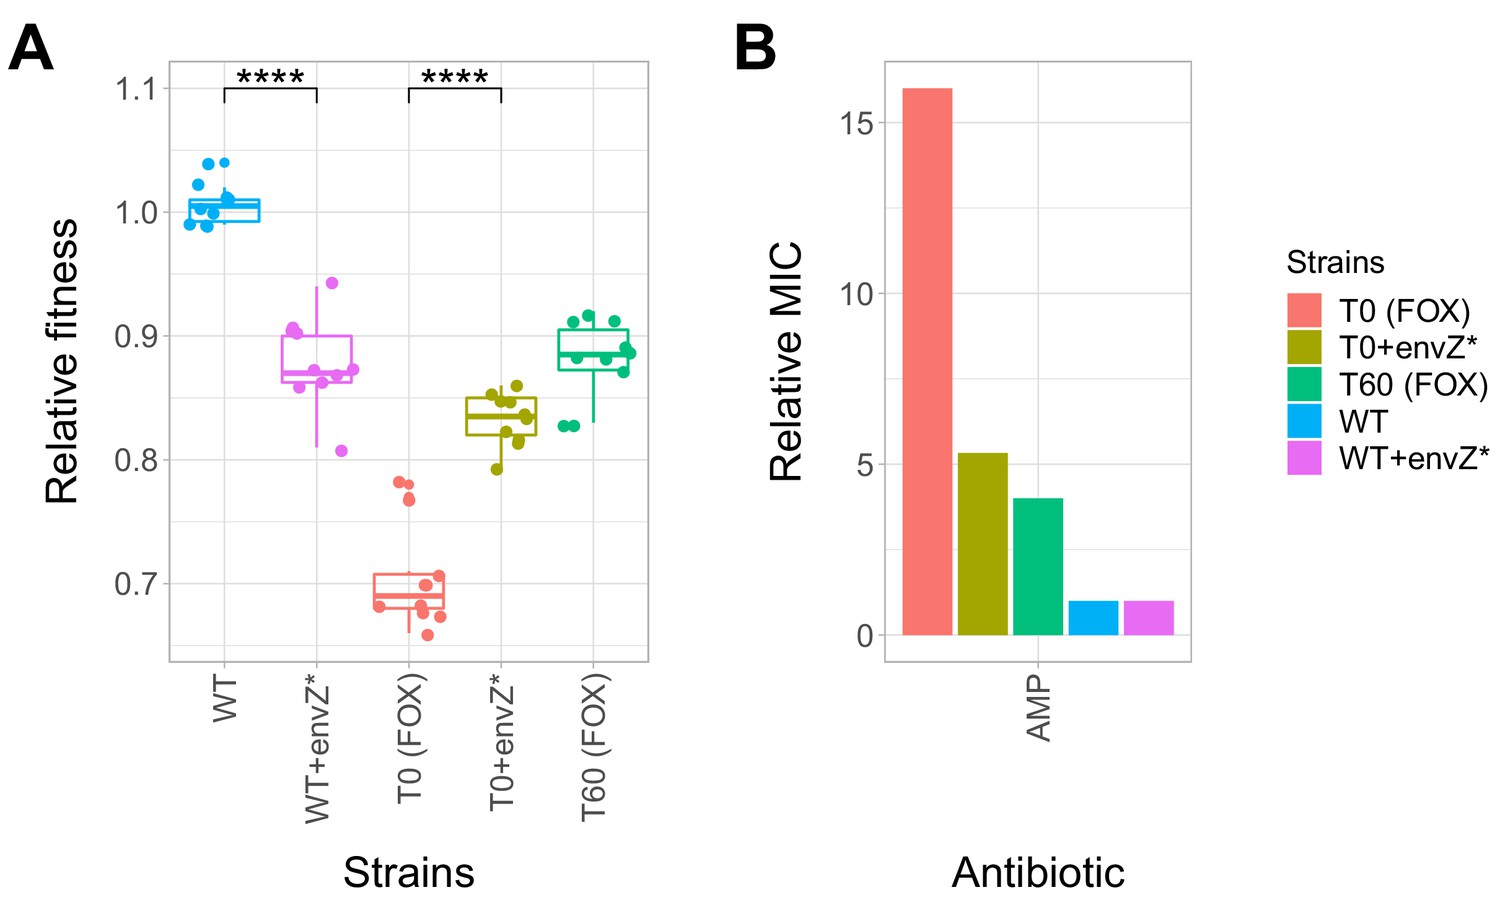
Effect of a compensatory mutation in envZ.
The figure shows the (A) relative fitness and (B) relative resistance level of the following strains: wild-type (WT) E. coli K-12 BW25113, a cefoxitin-resistant T0 strain, the corresponding T60 strain carrying the compensatory mutation in envZ (envZ*). Additionally, envZ* was introduced into the wild-type and T0 genetic backgrounds, yielding WT + envZ* and T0 +envZ* strains, respectively. (A) Fitness was measured as the area under the growth curve, and was normalized to wild-type fitness. Boxplots show the median, first and third quartiles, with whiskers showing the 5th and 95th percentiles (two biological replicates each). As expected, relative fitness showed significant variations across the strains (Tukey’s post-hoc multiple comparison tests, **** indicates p<0.0001). Source file is available as Figure 5—source data 1. (B) Resistance level of all five strains against ampicillin (AMP). Minimum inhibitory concentration (MIC) was measured by the standard E-test assay, and was normalized to that of the wild-type strain. Only the T0 strain can be considered resistant to each antibiotic tested according to the CLSI resistance break-point cut-off. Source file is available as Figure 5—source data 1.
Figure 6
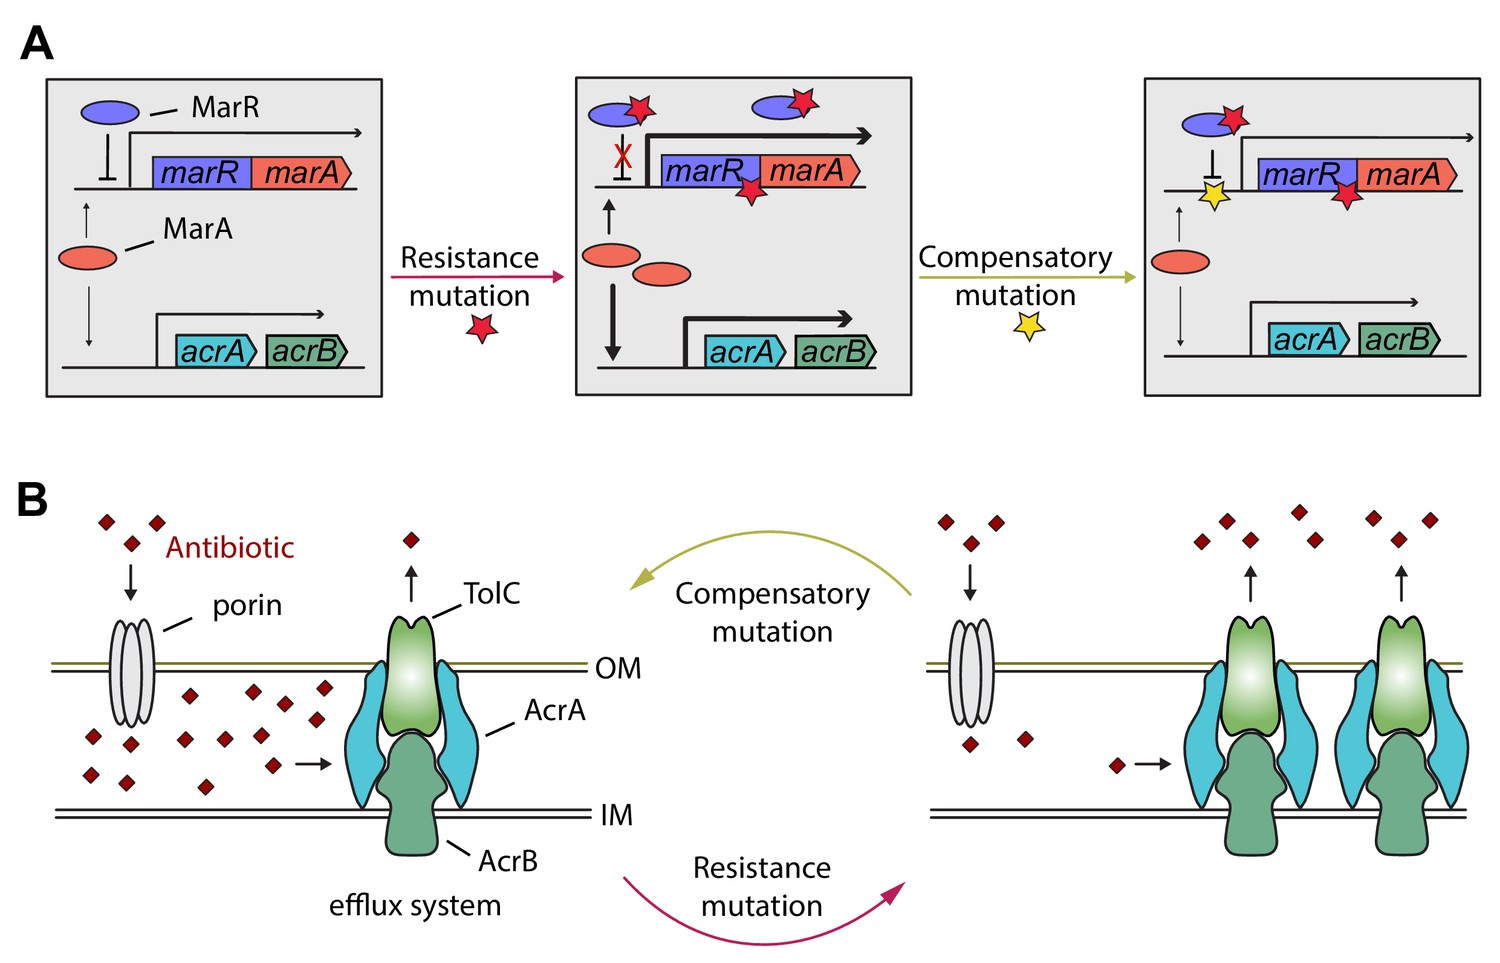
Hypothetical mechanism of compensation by a marR compensatory mutation.
The mar regulon participates in controlling several genes involved in resistance to antibiotics including the AcrA/AcrB/TolC multidrug efflux system (panel A). MarR is a transcriptional regulatory protein that controls the activity of the mar system in wild-type E. coli through the repression of marA. In response to antibiotic stresses (e.g. doxycycline or ciprofloxacin), marR is mutated (indicated by a red star), leading to increased expression of marA and, subsequently, other members of the mar regulon (Praski Alzrigat et al., 2017). However, the elevated activity of the mar regulon is harmful in antibiotic-free conditions, promoting the accumulation of further mutations. Our study indicates that this can be achieved by a compensatory mutation in the promoter region of the mar operon (indicated by a yellow star). The compensatory mutation putatively restores the activity of the mar regulon to the wild-type level (panel B). Source file is available as Supplementary file 1.
Tables
Table 1
Antibiotics employed and their modes of actions.
Functional classification (molecular target) is based on previous studies (Girgis et al., 2009; Yeh et al., 2006). These antibiotics are widely used in clinical practice, are well-characterized and cover a wide range of modes of actions. For three-letter codes (abbreviations), the AAC's standard (https://aac.asm.org/content/abbreviations-and-conventions) was used.
| Antibiotic name | Abbreviation | Antibiotic class | Molecular target | Effect | Number of T0 lines displaying significant fitness cost |
|---|---|---|---|---|---|
| Ampicillin | AMP | Penicillin | Cell wall | Bactericidal | 1 |
| Cefoxitin | FOX | Cephalosporins | Cell wall | Bactericidal | 1 |
| Ciprofloxacin | CIP | Quinolones | Gyrase | Bactericidal | 2 |
| Nalidixic acid | NAL | Quinolones | Gyrase | Bactericidal | 0 |
| Nitrofurantoin | NIT | Nitrofurantoin | Multiple mechanisms | Bactericidal | 2 |
| Kanamycin | KAN | Aminoglycosides | Protein synthesis, 30S | Bactericidal | 4 |
| Tobramycin | TOB | Aminoglycosides | Protein synthesis, 30S | Bactericidal | 4 |
| Tetracycline | TET | Tetra-cyclines | Protein synthesis, 30S | Bacteriostatic | 2 |
| Doxycycline | DOX | Tetra-cyclines | Protein synthesis, 30S | Bacteriostatic | 1 |
| Chloramphenicol | CHL | Chloramphenicol | Protein synthesis, 50S | Bacteriostatic | 2 |
| Erythromycin | ERY | Macrolides | Protein synthesis, 50S | Bacteriostatic | 0 |
| Trimethoprim | TMP | Trimethropim | Folic acid biosynthesis | Bacteriostatic | 4 |
Key resources table
| Reagent type (species) or resource | Designation | Source or reference | Identifiers | Additional information |
|---|---|---|---|---|
| Strain, strain background (Escherichia coli) | K12 BW25113 (wild type) | PMID: 25000950 | SRA project: SRX551437 (E. coli AB cross-resistance) | |
| Strain, strain background (Escherichia coli) | SRR1297006 to SRR1297184 (resistant strains) | PMID: 25000950 | SRA project: SRX551437 (E. coli AB cross-resistance) | |
| Chemical compound, drug | ETEST AMPICILLIN AM 256 | bioMérieux | S30-412253 | |
| Chemical compound, drug | ETEST CEFOXITIN FX 256 | bioMérieux | S30-412285 | |
| Chemical compound, drug | ETEST CIPROFLOXACIN CI 32 | bioMérieux | S30-412311 | |
| Chemical compound, drug | ETEST CHLORAMPHENICOL CL 256 | bioMérieux | S30-412309 | |
| Chemical compound, drug | ETEST DOXYCYCLINE DC 256 | bioMérieux | S30-412328 | |
| Chemical compound, drug | ETEST KANAMYCIN KM 256 | bioMérieux | S30-412382 | |
| Chemical compound, drug | ETEST NALIDIXIC-ACID NA 256 | bioMérieux | B30-516500 | |
| Chemical compound, drug | ETEST NITROFURANTOIN NI 512 | bioMérieux | B30-530400 | |
| Chemical compound, drug | ETEST TETRACYCLINE TC 256 | bioMérieux | S30-412471 | |
| Chemical compound, drug | ETEST TOBRAMYCIN TM 256 | bioMérieux | S30-412479 | |
| Chemical compound, drug | ETEST TRIMETHOPRIM TR 32 | bioMérieux | S30-412483 | |
| Chemical compound, drug | bisBenzimide H 33342 trihydrochloride | Sigma-Aldrich | B2261-25MG | PMID: 20513705 |
| Chemical compound, drug | carbonyl cyanide-m-chlorophenyl hydrazone (CCCP) | Life Technologies | AC228131000 | PMID: 20513705 |
| Recombinant DNA reagent | pORTMAGE-3 | PMID: 26884157 | Addgene: Plasmid #72678 | |
| Software, algorithm | RStudio (Version 1.1.463) | R Core Team (2018). R: A language and environment for statistical computing. R Foundation for Statistical Computing, Vienna, Austria | http://www.r-project.org/ | |
| Software, algorithm | ggplot2 package (version 3.0.0) | H. Wickham. ggplot2: Elegant Graphics for Data Analysis. Springer-Verlag New York, 2016. | https://cran.r-project.org/web/packages/ggplot2/ggplot2.pdf |
Additional files
-
Supplementary file 1
Mutations detected by whole genome sequencing.
This file contains the mutations acquired during 60 day evolution in an antibiotic free environment. This file was used to create Figure 5—figure supplement 1 and Figure 6.
- https://doi.org/10.7554/eLife.47088.018
-
Transparent reporting form
- https://doi.org/10.7554/eLife.47088.019
Download links
A two-part list of links to download the article, or parts of the article, in various formats.
Downloads (link to download the article as PDF)
Open citations (links to open the citations from this article in various online reference manager services)
Cite this article (links to download the citations from this article in formats compatible with various reference manager tools)
Rapid decline of bacterial drug-resistance in an antibiotic-free environment through phenotypic reversion
eLife 8:e47088.
https://doi.org/10.7554/eLife.47088


